Embed Size (px)
Citation preview
1
2
Working together as a team to achieve common goals
DESSEMINATION OF KAIZEN AND QUALITY ASSURANCE
26TH April 2017
Presented by: Sello Mosai
Executive Manager
PRESENTATION OUTLINE
Mandate of Productivity SA
Role of Productivity in the Economy
Common Observations and Key Challenges
Socio Economic benefits and Key Impact
Indicators
Conclusion
3
Productivity SA is an Entity of the Department of Labour, established as a juristic
person in terms of section 31 of the Employment Services Act, No. 4 of 2014.
Its mandate is to promote employment growth and productivity, thereby
contributing to South Africa’s socio-economic development and competitiveness.
WHO IS PRODUCTIVITY SA?
4
THE MANDATE OF PRODUCTIVITY SOUTH AFRICA

Productivity SA is classified as a schedule 3A Public Entity in terms of the Public Finance
Management Act, No. 1 of 1999
Governed by a Tripartite Board appointed in terms of section 33 of the Act, consisting of
7 Members - Chairperson and six members (4 drawn from NEDLAC - 2 representing
Organised Labour and 2 Organised Business), and 2 members representing the
Government.
THE MANDATE OF PRODUCTIVITY SA
Vision
To lead and inspire a productive and competitive South Africa.
“To improve productivity by diagnosing, advising, implementing, monitoring and
evaluating solutions aimed at improving South Africa’s sustainable growth,
development and employment through increased competitiveness”
VISION & MISSION
77
MISSION
SERVICES:
Section 32 of the Act read together with s2 (1) (e) and (f), and s7 enjoins Productivity SA to amongst others, develop
relevant productivity competencies and competitiveness in workplaces, with a focus on amongst others the following
core functions:
(i) To promote employment and income growth, and workplace productivity.
(ii) To improve the employment and re-employment prospects of employees facing retrenchments and retrenched
workers (TAS).
VALUE PROPOSITION:
Service Offering: Productivity and Competitiveness Improvement Solutions to accelerate wealth and decent
employment creation.
HOW – By enhancing the productive capacity and operational efficiency of enterprises throughout the business
lifecycle. 8
THE KEY SERVICES AND VALUE PROPOSITION OF PRODUCTIVITY SA
9
THE ROLE OF PRODUCTIVITY
IN THE ECONOMY
PRODUCTIVITY IN THE ECONOMY
• The role of Productivity in
Economy has to do with
provision of competitive
advantage in relation to
speed and accuracy.
10
• Doing the right things (effectiveness)
• Doing things right (efficiency)
COLLABORATIONIMPROVING THE PRODUCTIVITY RATIO
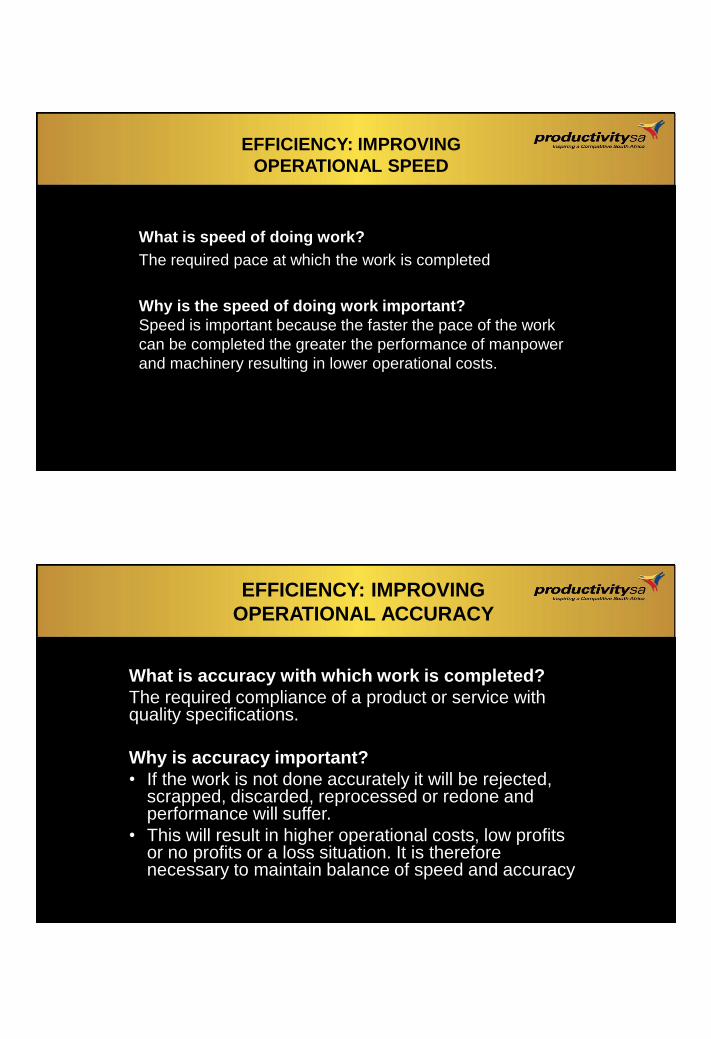
THE PRODUCTIVITY PROCESS
INPUTS OUTPUTSProcess
Conversion
Between output and input there is a blood sweat
and tears process called “Conversion”
During “Conversion” ALL input factors are put
together
Labour is only one of the factors

• Doing the right things (effectiveness)
• Doing things right (efficiency)
COLLABORATIONPRODUCTIVITY OR NOT ??
• Doing the right things (effectiveness)
• Doing things right (efficiency)
COLLABORATIONEFFICIENCY
The measure of the speed and accuracy with which work is
completed/done (efficiency).
Other ways to express how to monitor and drive efficiency
upwards such as:
• A measure of how well resources are transformed into
output
• Working well with little waste
• Getting the most out of what you put in
• The production of the maximum results from the minimum
effort
• The best use of resources to achieve production of
products or services.
COLLABORATION
What is speed of doing work?
The required pace at which the work is completed
Why is the speed of doing work important?
Speed is important because the faster the pace of the work
can be completed the greater the performance of manpower
and machinery resulting in lower operational costs.
EFFICIENCY: IMPROVING
OPERATIONAL SPEED
• Doing the right things (effectiveness)
• Doing things right (efficiency)
COLLABORATION
What is accuracy with which work is completed?
The required compliance of a product or service with quality specifications.
Why is accuracy important?
• If the work is not done accurately it will be rejected, scrapped, discarded, reprocessed or redone and performance will suffer.
• This will result in higher operational costs, low profits or no profits or a loss situation. It is therefore necessary to maintain balance of speed and accuracy.
EFFICIENCY: IMPROVING
OPERATIONAL ACCURACY
• Doing the right things (effectiveness)
• Doing things right (efficiency)
COLLABORATION
These are inputs in which efficiency (speed
and accuracy) apply:
• Manpower/Labour
• Machinery
EFFECIENCY
• Doing the right things (effectiveness)
• Doing things right (efficiency)
COLLABORATION
Relevant ways of achieving efficiency at work or our various businesses?
• Developing existing resources
• Reducing the amount or costs of resources
• Utilising the best resources in the best possible way
• Finding the best resources than the ones we have
• Minimising waste
• Develop Standard Operating Procedure (SOP)
WAYS OF ACHIEVING EFFICIENCY

• Doing the right things (effectiveness)
• Doing things right (efficiency)
COLLABORATION
Increased efficiency in a business will results in:
• Reduced operational costs
• Greater competitiveness
• Improved quality
• More sales
• Higher profits
• Scope for greater investment
• Improved methods.
RESULTS OF INCREASED
EFFICIENCY
• Doing the right things (effectiveness)
• Doing things right (efficiency)
COLLABORATION
Measuring speed and accuracy of machines or
manpower (efficiency)
Efficiency = Time Allowed x 100
Actual Time 1
When products/services are being produced (or any particular job is
being done) the worker or machine is expected to produce and deliver
the right quantity of products/services of the right quality in a specific
allowed time.
• If the time taken to perform task is equal to the time allowed to do the task, then the efficiency is 100%
• If the time taken to perform the task is more than the time allowed for the task, then the efficiency is less than 100%
• If the time taken to perform the task is less than the time allowed to do the task, then the efficiency is more than 100%.
MEASURING EFFECIENCY
When measuring productivity, a definition that is useful
is: Productivity is equal to output divided by input. This
ratio measures how well resources or inputs are utilised
to create the desired output.
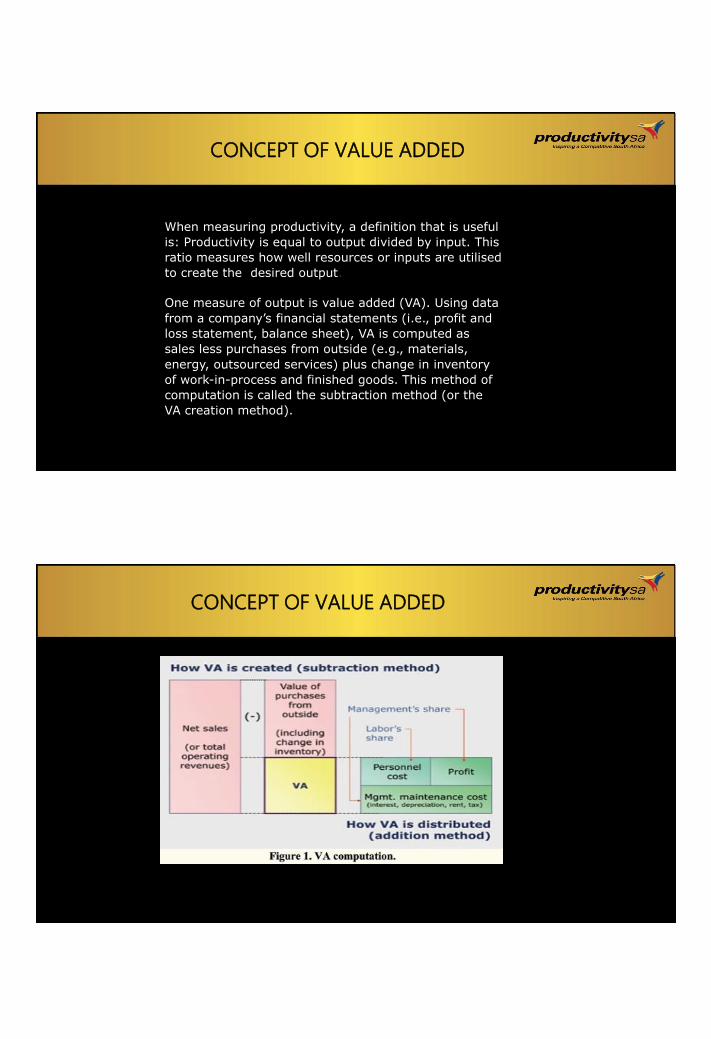
One measure of output is value added (VA). Using data
from a company’s financial statements (i.e., profit and
loss statement, balance sheet), VA is computed as
sales less purchases from outside (e.g., materials,
energy, outsourced services) plus change in inventory
of work-in-process and finished goods. This method of
computation is called the subtraction method (or the
VA creation method).
CONCEPT OF VALUE ADDED
CONCEPT OF VALUE ADDED
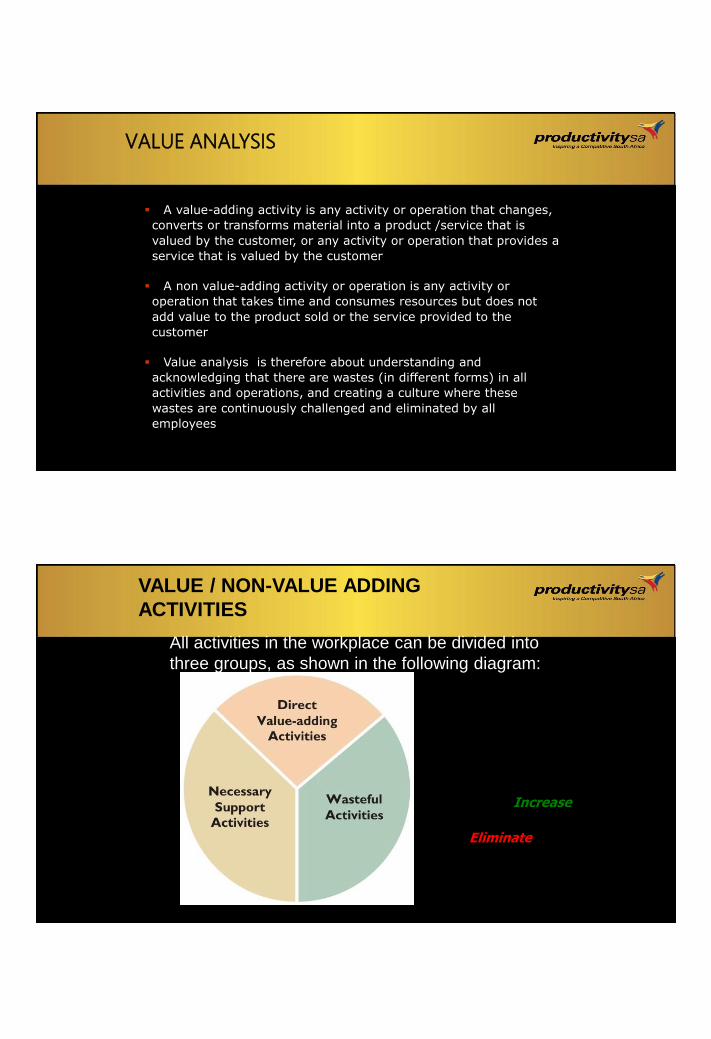
VALUE ANALYSIS
A value-adding activity is any activity or operation that changes,
converts or transforms material into a product /service that is
valued by the customer, or any activity or operation that provides a
service that is valued by the customer
A non value-adding activity or operation is any activity or
operation that takes time and consumes resources but does not
add value to the product sold or the service provided to the
customer
Value analysis is therefore about understanding and
acknowledging that there are wastes (in different forms) in all
activities and operations, and creating a culture where these
wastes are continuously challenged and eliminated by all
employees
VALUE / NON-VALUE ADDING
ACTIVITIES
All activities in the workplace can be divided into
three groups, as shown in the following diagram:
Non-value adding, but necessary: Minimize
Value-adding: Increase
Waste: Eliminate

TYPICAL AREAS OF WASTE
THE IMPORTANCE OF MEASURING
WASTE
It is important to measure wastage in order to determine:
• The current wastage levels
• The causes thereof,
• Ways to reducing or eliminating it.
COMMON
OBSERVATIONS AND KEY CHALLENGES
ARGUMENTS FOR NMW• INFLATION:
– Wages forms only one small part of the unit cost of production and employers can reduce the non-wage input costs. The overall unit percentage increase will be lower than the percentage increase in costs of wages.
– The macro-economic consequences of an increase in disposable income of the low paid might actually reduce average costs as production runs increase to meet higher demand. There is thus no need to pass on costs to the consumer.
PRODUCTIVITY
– Many employers underpay workers despite improvements in productivity and profit thus maintaining the cheap labour system inherited from apartheid.
– Low wages permit inefficient companies to remain in business and low pay effectively serves to subsidise inefficiency and incompetence of employers.
– When labour costs increase employers will use labour more efficiently, provide training and improve management and production methods for producing goods and services. In the process companies will have higher productivity and so recover the additional wage costs without increasing the price of goods and services or reducing the profit margin.
– There will be a decrease in industrial disputes and an improvement in workers’ morale and living standards which will improve the workers’ capacity to work and ensure a reduction in debilitating disease and time off due to illness and accidents caused by fatigue. Low productivity is thus a direct consequence of low pay.
UNEMPLOYMENT
– Those who argue that unemployment must take precedence over poverty wages until unemployment is substantially reduced base this upon a false assumption that poverty wages reduce unemployment.
– The increased productivity arising from a NMW will increase the buying power of workers and expand markets thus increasing employment in the economy as a whole.
INVESTMENT AND GROWTH
Investment, of course, is the precondition for high growth and employment creation. This low investment rates occur despite the maintenance of a cheap labour system in South Africa. Most of the wealth of the rich has been transferred overseas and much of it has been spent on the consumption of luxury imported goods. On the other hand workers spend most of their income on basic goods which have very low import content.

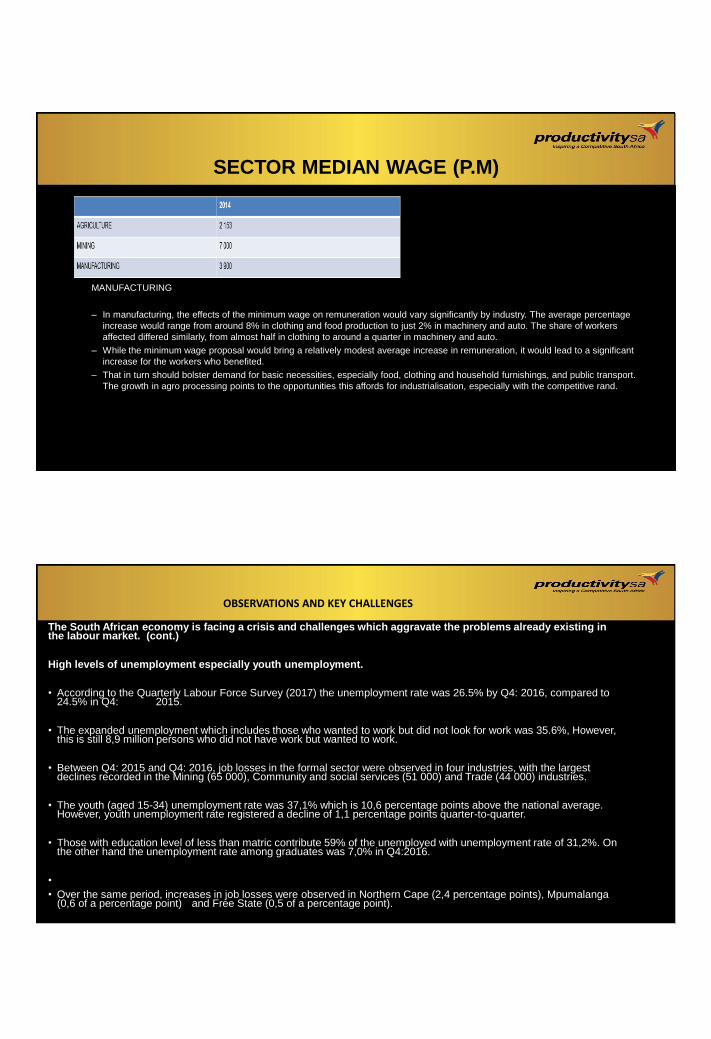
SECTOR MEDIAN WAGE (P.M)
AGRICULTURE:
– Current statistics show that 6.2 million workers, or 47.3% of the workforce, currently earn below the proposed minimum wage of
R3,500 per month.
– DPRU (2016) using a general equilibrium analysis found out that after introduction of minimum wages through Sectoral
Determinations, from 2003 onwards, despite loss of farm worker jobs, net employment in the affected sectors actually increased
by over 650 000 workers, from 3,45 million to 4,1 million (2001 to 2007).
– Garbers (2015) found out that the change in opportunity costs resulting from the implementation of the wage floor also saw formal
employers shift toward skill intensive methods of production, realising a 6% rise in skilled farmworker employment.
SECTOR MEDIAN WAGE (P.M)
MINING
– A Computable General Equilibrium (CGE) analysis by Setou (2016) indicate that implementation of a minimum wage will cause
industries like mining and construction which are labour intensive to shed jobs in both the short-run and the long-run.
– The effect of the minimum wage shock will result in household purchaser power generally increasing across industries in both the
short run and the long run due to higher wages which will improve the standard of living of a number of households. This will
reduce the severity of poverty and inequality experienced by employees in the mining sector and ensure that they get a decent
living wage.
– Exports will decline in the short run, because prices of local commodity exports are likely to increase as labour costs which are
also production costs increase thus reducing the competitiveness and consequently demand for exports. Increase in labour costs
as per the policy shock will also crowd out investment in the long run.
SECTOR MEDIAN WAGE (P.M)
MANUFACTURING
– In manufacturing, the effects of the minimum wage on remuneration would vary significantly by industry. The average percentage
increase would range from around 8% in clothing and food production to just 2% in machinery and auto. The share of workers
affected differed similarly, from almost half in clothing to around a quarter in machinery and auto.
– While the minimum wage proposal would bring a relatively modest average increase in remuneration, it would lead to a significant
increase for the workers who benefited.
– That in turn should bolster demand for basic necessities, especially food, clothing and household furnishings, and public transport.
The growth in agro processing points to the opportunities this affords for industrialisation, especially with the competitive rand.
The South African economy is facing a crisis and challenges which aggravate the problems already existing in the labour market. (cont.)
High levels of unemployment especially youth unemployment.
• According to the Quarterly Labour Force Survey (2017) the unemployment rate was 26.5% by Q4: 2016, compared to 24.5% in Q4: 2015.
• The expanded unemployment which includes those who wanted to work but did not look for work was 35.6%, However, this is still 8,9 million persons who did not have work but wanted to work.
• Between Q4: 2015 and Q4: 2016, job losses in the formal sector were observed in four industries, with the largest declines recorded in the Mining (65 000), Community and social services (51 000) and Trade (44 000) industries.
• The youth (aged 15-34) unemployment rate was 37,1% which is 10,6 percentage points above the national average. However, youth unemployment rate registered a decline of 1,1 percentage points quarter-to-quarter.
• Those with education level of less than matric contribute 59% of the unemployed with unemployment rate of 31,2%. On the other hand the unemployment rate among graduates was 7,0% in Q4:2016.
•
• Over the same period, increases in job losses were observed in Northern Cape (2,4 percentage points), Mpumalanga (0,6 of a percentage point) and Free State (0,5 of a percentage point).
OBSERVATIONS AND KEY CHALLENGES

• High levels of retrenchments and labour shedding.
It should be noted that, there has been a significant upsurge in s189A referrals, with the CCMA receiving 527 referrals in the 2015/16 financial
year compared to 391 in the 2014/15 financial year.
• Furthermore, statistics drawn from the Quarterly Labour Force Survey provides sufficient evidence that the economy has shed more jobs over the
past three years, with over 595 000 jobs
• The above statistics clearly show that Productivity SA resources will be severely stretched if we were to respond to this national challenge; and that
our contribution is therefore insignificant and more needs to be done regarding the funding of section 7 interventions
• Further to the above, insufficient funding and/or late transfer of funds by the UIF makes it difficult for Productivity SA to put in place measures and
programmes to support companies facing economic distress, therefore, not being able to prevent job losses or minimise retrenchments as required
in terms of s7 of the Act.
• The Employment Services Act introduced an expanded mandate for Productivity SA which places the Entity at the centre of Government’s
Programmes and interventions to create decent employment thereby reducing unemployment, poverty and inequality.
• Section 2 (1) (e) read together with s7 and s32 (g) of the Act, enjoins Productivity SA to improve the employment and re-employment prospects of
employees facing retrenchments.
• The UI Act provides for financing of Employment Services, with section 5 (d) relating to financing of the retention of contributors in employment
and the re-entry of contributors into the labour market and any other scheme aimed at vulnerable workers.
OBSERVATIONS AND KEY CHALLENGES
34
CASE-STUDIES: SOCIO-
ECONOMIC BENEFITS AND KEY
IMPACT INDICATORS
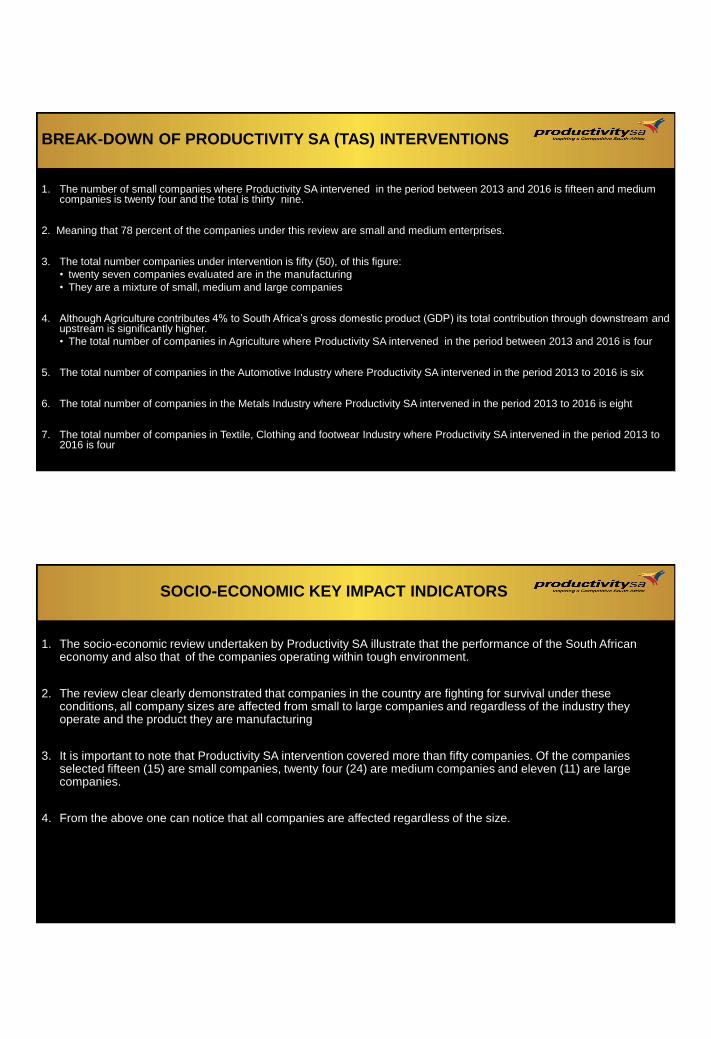
BREAK-DOWN OF PRODUCTIVITY SA (TAS) INTERVENTIONS
1. The number of small companies where Productivity SA intervened in the period between 2013 and 2016 is fifteen and medium companies is twenty four and the total is thirty nine.
2. Meaning that 78 percent of the companies under this review are small and medium enterprises.
3. The total number companies under intervention is fifty (50), of this figure:
• twenty seven companies evaluated are in the manufacturing
• They are a mixture of small, medium and large companies
4. Although Agriculture contributes 4% to South Africa’s gross domestic product (GDP) its total contribution through downstream andupstream is significantly higher.
• The total number of companies in Agriculture where Productivity SA intervened in the period between 2013 and 2016 is four
5. The total number of companies in the Automotive Industry where Productivity SA intervened in the period 2013 to 2016 is six
6. The total number of companies in the Metals Industry where Productivity SA intervened in the period 2013 to 2016 is eight
7. The total number of companies in Textile, Clothing and footwear Industry where Productivity SA intervened in the period 2013 to 2016 is four
SOCIO-ECONOMIC KEY IMPACT INDICATORS
1. The socio-economic review undertaken by Productivity SA illustrate that the performance of the South African economy and also that of the companies operating within tough environment.
2. The review clear clearly demonstrated that companies in the country are fighting for survival under these conditions, all company sizes are affected from small to large companies and regardless of the industry they operate and the product they are manufacturing
3. It is important to note that Productivity SA intervention covered more than fifty companies. Of the companies selected fifteen (15) are small companies, twenty four (24) are medium companies and eleven (11) are large companies.
4. From the above one can notice that all companies are affected regardless of the size.
BREAK-DOWN OF PRODUCTIVITY SA (TAS) INTERVENTIONS
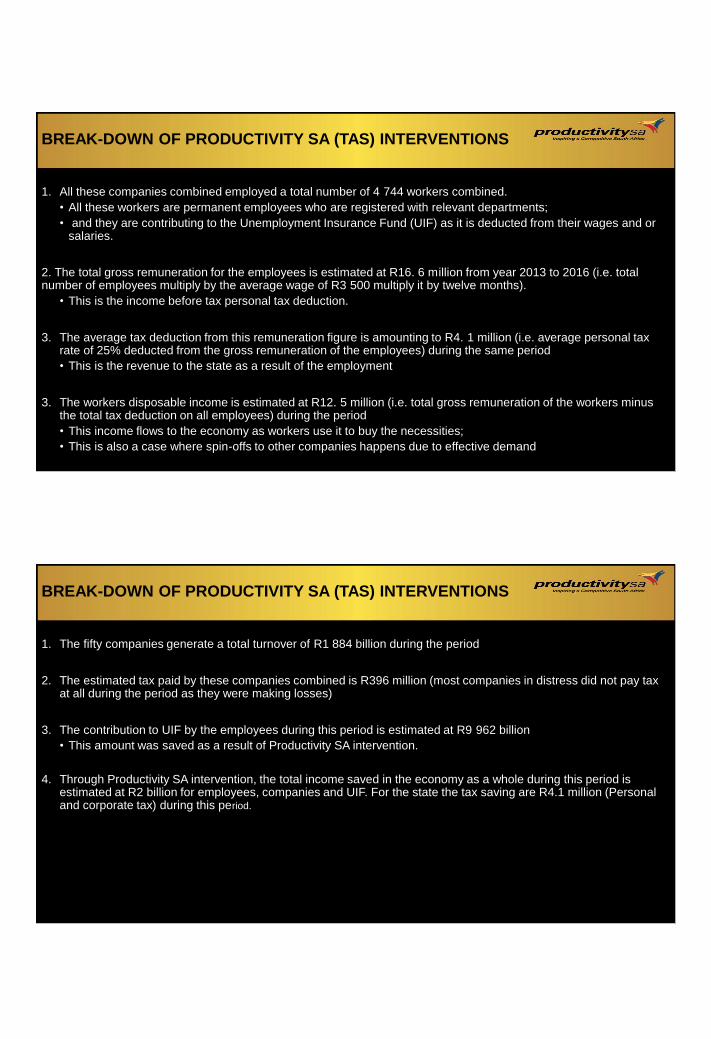
1. All these companies combined employed a total number of 4 744 workers combined.
• All these workers are permanent employees who are registered with relevant departments;
• and they are contributing to the Unemployment Insurance Fund (UIF) as it is deducted from their wages and or salaries.
2. The total gross remuneration for the employees is estimated at R16. 6 million from year 2013 to 2016 (i.e. total number of employees multiply by the average wage of R3 500 multiply it by twelve months).
• This is the income before tax personal tax deduction.
3. The average tax deduction from this remuneration figure is amounting to R4. 1 million (i.e. average personal tax rate of 25% deducted from the gross remuneration of the employees) during the same period
• This is the revenue to the state as a result of the employment of these workers.
3. The workers disposable income is estimated at R12. 5 million (i.e. total gross remuneration of the workers minus the total tax deduction on all employees) during the period
• This income flows to the economy as workers use it to buy the necessities;
• This is also a case where spin-offs to other companies happens due to effective demand
BREAK-DOWN OF PRODUCTIVITY SA (TAS) INTERVENTIONS
1. The fifty companies generate a total turnover of R1 884 billion during the period
2. The estimated tax paid by these companies combined is R396 million (most companies in distress did not pay tax at all during the period as they were making losses)
3. The contribution to UIF by the employees during this period is estimated at R9 962 billion
• This amount was saved as a result of Productivity SA intervention.
4. Through Productivity SA intervention, the total income saved in the economy as a whole during this period is estimated at R2 billion for employees, companies and UIF. For the state the tax saving are R4.1 million (Personal and corporate tax) during this period.
CONCLUSION
39
VALUE ADDING FOR PRODUCVITY LINKED WAGES
A value-adding activity is any activity or operation that changes,
converts or transforms material into a product /service that is
valued by the customer, or any activity or operation that provides a
service that is valued by the customer
A non value-adding activity or operation is any activity or
operation that takes time and consumes resources but does not
add value to the product sold or the service provided to the
customer
Value analysis is therefore about understanding and
acknowledging that there are wastes (in different forms) in all
activities and operations, and creating a culture where these
wastes are continuously challenged and eliminated by all
employees

THANK YOU
41