Embed Size (px)
Citation preview

Avalaible online at http://journals.ums.ac.id, Permalink/DOI: 10.23917/jep.v22i1.12061
Jurnal Ekonomi Pembangunan: Kajian Masalah Ekonomi dan Pembangunan, 22 (1), 2021, 22-33
Jurnal Ekonomi Pembangunan, ISSN 1411-6081, E-ISSN 2460-933122
Design and Technical Quality on The Smes Efficiency: Empirical Evidence from Batik SMEs in Central Java, Indonesia
AbstractThe research is aimed to analyze the effect of design and technical quality implementation on technical and economic efficiency in the batik SMEs (small medium enterprises) in the Central Java province, Indonesia. Implementation of the technical quality is measured by process management implementation. Implementation of the design quality is measured by access to the development of the batik designs quality. The data are collected by direct interview approach to 100 manager-owners of batik business. Efisiensi teknis dan ekonomi diestimasi melalui stochastic efficiency frontier analysis. Furthermore, analysis of the implementation of design and technical quality on technical and economic efficiency uses a regression analysis with dummy variables. Competitive strategy orientation was used as the control variable. The final results are: (1) the role of entrepreneurs in the implementation of design and technical quality does significantly on technical efficiency, (2) the entrepreneurs role in the implementation of design and technical quality does significantly increase economic efficiency. The application of quality management significantly increase economic efficiency primarily in companies with focus and differentiation strategy. Economic efficiency are higher in entrepreneurial implement design and technical quality, and using focused and differentiation strategy. The conclusion this study is the design and technical quality implementation has an effect on the batik SMEs revenue efficiency.
Keyword: stochastic efficiency frontier, SMEs, total quality management, design and technical qualityJEL Classification:
DOI: https://doi.org/10.23917/jep.v22i1.12061
1. IntroductionBusiness environment in fashion industry
are in the age of more from less economy, digital-creative economy, and environment industry increasingly competitive and dynamic (Temouri et al., 2020). In the more from less economy age, businesses that survive and competitive in the market is that ability produce high-value products for customers with less resources (Bidwell, 2011). In the era of digital and creative economy, fashion product not only related to clothing, but
also sign, symbol and lifestyle (UNESCO, 2015). In an increasingly competitive and dynamic environment, product life cycles are getting shorter, market tastes are volatile, competition is increasing and uncertain (Majuri & Halonen, 2019).
One of the products in the SME sector fashion industry is batik. Batik as one commodity of cultural heritage of Indonesia has a potential to compete in the global market. In the more from less economy (Bidwell, 2011), it is important for
Edy Dwi Kurniati, Sri RahayuFaculty of Economics and Business
Received: September 2020 | Revised: June 2021 | Accepted: June 2021
Darul Ulum Islamic Centre Sudirman GUPPI (University (UNDARIS) Semarang
Corresponding author: [email protected]
How to Cite: Kurniati, E., & Rahayu, S. (2021). Design and Technical Quality on The Smes Efficiency: Empirical Evidence From Batik SMEs in Central Java, Indonesia. Jurnal Ekonomi Pembangunan: Kajian Masalah Ekonomi dan Pembangunan, 22(1), 22-33. doi:https://doi.org/10.23917/jep.v22i1.12061

Avalaible online at http://journals.ums.ac.id, Permalink/DOI: 10.23917/jep.v22i1.12061
Jurnal Ekonomi Pembangunan: Kajian Masalah Ekonomi dan Pembangunan, 22 (1), 2021, 22-33
Jurnal Ekonomi Pembangunan, ISSN 1411-6081, E-ISSN 2460-9331 23
batik SMEs to produce unique products, of high value for customers, with the less resources. This can be done through, among others, quality management practices. Batik business to be competitive is not only through technical quality (quality materials, quality workforce, quality production processes) but also the practice of quality design, namely how products are designed according to market tastes and value created to customers. Quality management practices (quality planning and design, quality control, quality evaluation) are limited to SMEs because besides the limitations of economies of scale, they are also traditional management (Burlea-Schiopoiu & Mihai, 2019; Henttonen & Lehtimäki, 2017; O. Brien & Hamburg, 2014; Temouri et al., 2020; Ye & Kulathunga, 2019).
Integrated Quality Management, known as Total Quality Management (TQM) is a leading management philosophy that is used to improve the position and performance of the company (Ali & Yusuf, 2019; Anil & K.P., 2019; Deshpande, 2019; Essel, 2020; Hilman et al., 2020; Mushtaq & Peng, 2020; Sahoo & Yadav, 2017; Sinha et al., 2016). TQM is a tool of strategic, tactical and operational research in the field of quality management (Feizollahi et al., 2013; Kantardjieva, 2014; Ojo, 2013; Yunis et al., 2013). TQM approach is one of the most widely applied and well accepted approach to business excellence instead of Continuous Quality Improvement (CQI), Six Sigma, Just- in-Time (JIT), and Supply Chain Management (SCM). TQM implementation provides many benefits in supporting the competitiveness of enterprises (Ojo, 2013). However, the application of TQM must be tailored to the company’s management strategy, enterprise characteristics and environmental characteristics because the process associated with the expenses, time and resources to several studies (Feizollahi et al., 2013) has not been consistently integrated with the effective implementation of TQM for small companies, companies with local market orientation, leadership-oriented strategy and the intensity of lower costs competition (Hilman et al., 2020; Sahoo & Yadav, 2017; Sinha et al., 2016).
In general, the empirical literature on TQM consists of two groups, soft TQM and hard TQM. TQM hard involves more many techniques stats like using statistical quality control for quality control, while TQM soft mainly related to the “people” and aspects of the behavior of TQM (Ali & Yusuf, 2019; Anil & K.P., 2019; Deshpande, 2019; Essel, 2020; Hilman et al., 2020; Mushtaq & Peng, 2020; Sahoo & Yadav, 2017; Sinha et al., 2016). The importance of technical and design quality in TQM soft literature is explained by several studies (Widrick et al., 2002; Zhu et al., 2007), but the influence of technical and design quality on performance has not been widely explained by several studies. One way to know how to evaluate the effectiveness of technical and design quality is to connect the design and production processes with production and market performance. 2. Literature Review2.1 Design and Technical Quality
Quality management is one of the tools for improving performance (Al-Swidi & Mahmood, 2012; Anil & K.P., 2019). Awareness of quality has emerged since the industrialization age (1980s), starting from the separation of defective products that focus on the final product (inspection), followed by the statistical quality control (1920s). detect whether these deviations are caused by errors in production or just by chance, the quality assurance (1960s) and the strategic quality management (van Kemenade, 2014). The term Total Quality Management (TQM) was first introduced by Fegenbaum with the term “total quality” at an international conference in Tokyo in 1969. Ishikawa explained “company wide quality control” where all employees from top management to their employees must learn and participate in quality control (van Kemenade, 2014).
Quality management is not only related to technical quality control, but also involves systems that involve leadership practices, quality planning and strategy, customer focus, process management, human resource management and performance. Quality is not only related to the

Avalaible online at http://journals.ums.ac.id, Permalink/DOI: 10.23917/jep.v22i1.12061
Jurnal Ekonomi Pembangunan: Kajian Masalah Ekonomi dan Pembangunan, 22 (1), 2021, 22-33
Jurnal Ekonomi Pembangunan, ISSN 1411-6081, E-ISSN 2460-933124
final product (quality products or services), but also to quality inputs and processes (Al-Swidi & Mahmood, 2012; Gonzalez & Jiménez, 2013; Kantardjieva, 2014; Ojo, 2013). In the more form less economy, competitive products are those that use minimal resources (material, labor skills, capital), by creating maximum value for customers. In creative industry products such as fashion, the quality of fashion industry products is not only related to technical quality (material, labor skills, capital), but also value created.
Two elements of quality structure–design quality and Technical quality are recognized and described in the literature (Widrick et al., 2002). Design quality is defined as a fit between a product’s (service’s) design and customer needs (Widrick et al., 2002; Zhu et al., 2007). Technical quality is defined as a fit between the attributes of an actual product and its specification. Quality of technical as compliance with specifications reflects an operations, or internally oriented aspect of quality. Adherence to specifications stems from a high level of consistency and low variation in internal processes. Better technical quality is achieved when things are done right, i.e., when the efficiency is high. Quality of technical can be rather easily measured through statistical means such as process capability (the ratio between specification and control limits). Tools for improvement of technical quality are tools of statistical quality control such as control charts, scatter diagrams etc.
As a match between product features and customer expectations and needs, quality of design is a market, or externally oriented, aspect of quality. Design quality is high when the product is “right”, so it is oriented towards effectiveness rather than efficiency. Quality of design is determined by three factors (Widrick et al., 2002): deep understanding of customer requirements, translation of these requirements into a product and continuous improvement of the design process. Such an improvement is based on close cooperation among marketing, research and development, and engineering.
Since design quality represents a fit between product features and customer needs, it reflects not just internal attributes of a product itself but interaction between those attributes and external factors (Widrick et al., 2002). Design quality may change as a result of improvements in product features or incorporation of new features into existing products as well as the development of new products. It may alter also without any change in the product itself: when needs and expectations rise while product features remain the same, a misfit between the two factors is generated and quality of design declines. By the same token, if new, attractive features are developed, that does not necessarily mean that design quality grows. In the case that needs and expectations grow faster than does the level of product features, a gap between expectations and features also arises, and design quality decreases. Though the product itself has improved, it did not improve fast enough. In order to keep the same level of this dimension, features have to be enhanced at the same pace as customer needs grow.
Sometimes design quality is conceived of in a narrower fashion as “quality of design process”, oriented towards better manufacturability and reliability of a new product (Widrick et al., 2002; Zhu et al., 2007). In that case design quality is viewed as part of internal quality performance. Manufacturability orientation may be regarded as internal customer focus because production and adjacent functions are subsequent stages in the value chain following functions directly involved in the design process. In a more inclusive fashion, design quality can be seen as fit between product features and needs of both external and internal customers. For the reason that external customers are more pivotal for an organization than internal customers and requirements of internal customers are no more than derivative of the needs and expectations of external customers, quality of design is viewed here in mostly outward fashion.

Avalaible online at http://journals.ums.ac.id, Permalink/DOI: 10.23917/jep.v22i1.12061
Jurnal Ekonomi Pembangunan: Kajian Masalah Ekonomi dan Pembangunan, 22 (1), 2021, 22-33
Jurnal Ekonomi Pembangunan, ISSN 1411-6081, E-ISSN 2460-9331 25
2.2 Technical and Economic EfficiencyThe firm’s technology is represented by the
stochastic frontier production function as follows (Chen et al., 2015):
Yi=f(Xi;β)+ei (1)
where = the output of the 𝑖th SMEs, = a vector of input quantities of the 𝑖th SMEs, and 𝛽 = a vector of unknown parameters to be estimated. Consider the following:
ei=(Vi-Ui) (2)The are assumed to be independent and
identically distributed random errors independent of the . The are nonnegative technical inefficiency effects representing management factors and are assumed to be independently distributed with mean 𝑢𝑖 and variance 𝜎2. The 𝑖th farm exploits the full technological production potential when the value of comes out to be equal to zero, and the SMEs is then producing at the production frontier beyond which he cannot produce. The greater the magnitude of from the production frontier, the higher the level of inefficiency of the entrepreneurs. The maximum likelihood estimation of (1) provides estimators for the beta coefficients.The variances of the random errors and those of the technical and allocative inefficiency effects and overall variance of themodel 𝜎2 are related; thus,
σ2= σv2+σu
2 (3)
The ratio 𝛾 = / measures the total variation of output from the frontier which can be attributed to technical or allocative inefficiency. Subtracting V𝑖 from both sides of (1) yields
Yi* = yi - Vi = f(Xi;β) - Ui (4)
where is the observed output of the 𝑖th firm, adjusted for the stochastic noise captured by . Equation (4) is the basis for deriving the technically efficient input vectors and for analytically
deriving the dual cost frontier of the production function represented by (1). For a given level of output , the technically efficient input vector for the 𝑖th firm, 𝑋𝑡
𝑖 , is derived by simultaneously solving (4) and the ratios 𝑋1/𝑋𝑖= 𝑘𝑖(𝑖 > 1) where 𝑘𝑖 is the ratio of observed inputs 𝑋1 and 𝑋𝑖. Assuming that the production function in (1) is self-dual, the dual cost frontier can be derived algebraically and written in a general form as
Ci = f(Pi;α,Yi*);α) (5)
where is the minimum cost of the 𝑖th firm associated with output . is a vector of input prices for the 𝑖th firm, and 𝛼 is a vector of parameters. The economically efficient input vector for the 𝑖th firm, 𝑋𝑒𝑖, is derived by applying Shephard’s Lemmaand substituting the firm’s input prices and output level into the resulting system of input demand equations:
∂Ci ∂Pi = Xei (Pi Yi*;β) i = 1,2,…….m inputs (6)
where is a vector of estimated parameters. The observed, technically efficient, and economically efficient costs of production of the 𝑖th firm are equal to 𝑃𝑖𝑋𝑖,𝑃𝑖𝑋𝑡𝑖, and 𝑃𝑖𝑋𝑒𝑖, respectively. These cost measures are used to compute technical efficiency (TE) and economic efficiency (EE) indices for the 𝑖th firm as follows:
(7a)
(7b)
Following Farrell (1957), the allocative efficiency (AE) index can be derived from (7a) and (7b) as follows:
(8)
Thus the total cost or economic efficiency of the 𝑖th firm (− ) can be decomposed into its technical (−) and allocative (− ) components.
Avalaible online at http://journals.ums.ac.id, Permalink/DOI: 10.23917/jep.v22i1.12061
Jurnal Ekonomi Pembangunan: Kajian Masalah Ekonomi dan Pembangunan, 22 (1), 2021, 22-33
Jurnal Ekonomi Pembangunan, ISSN 1411-6081, E-ISSN 2460-933126
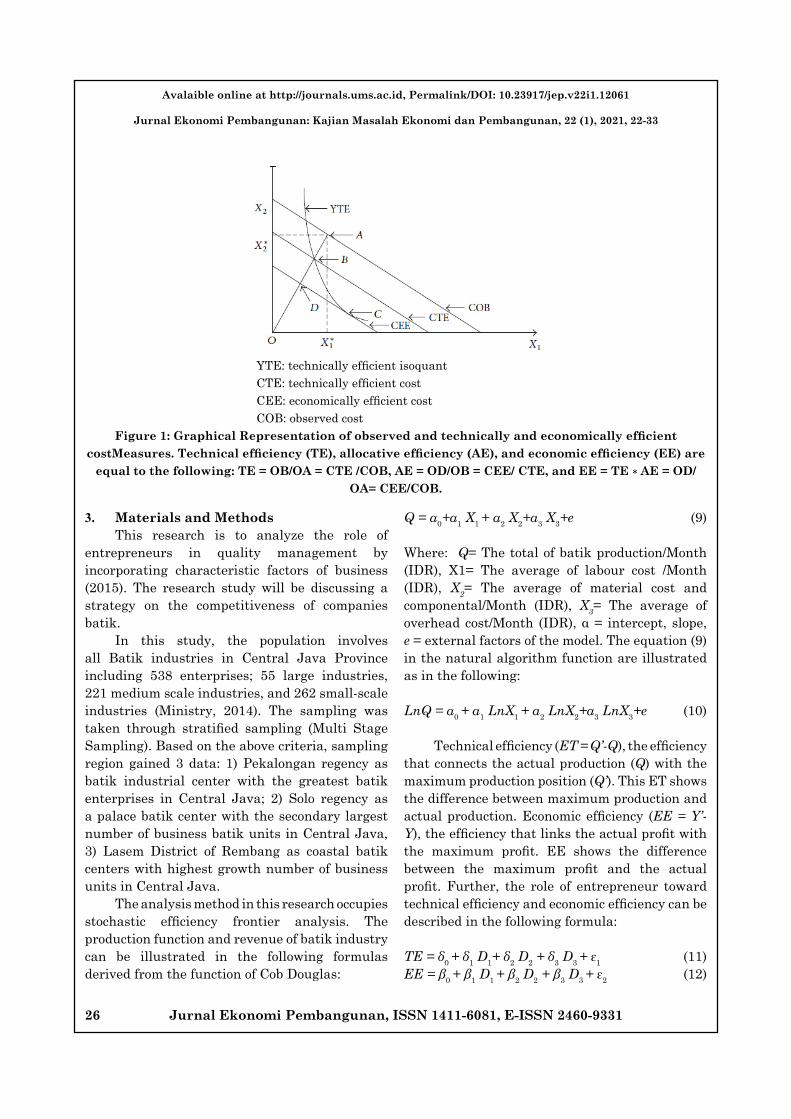
YTE: technically efficient isoquantCTE: technically efficient costCEE: economically efficient costCOB: observed cost
Figure 1: Graphical Representation of observed and technically and economically efficient costMeasures. Technical efficiency (TE), allocative efficiency (AE), and economic efficiency (EE) are
equal to the following: TE = OB/OA = CTE /COB, AE = OD/OB = CEE/ CTE, and EE = TE ∗ AE = OD/OA= CEE/COB.
3. Materials and MethodsThis research is to analyze the role of
entrepreneurs in quality management by incorporating characteristic factors of business (2015). The research study will be discussing a strategy on the competitiveness of companies batik.
In this study, the population involves all Batik industries in Central Java Province including 538 enterprises; 55 large industries, 221 medium scale industries, and 262 small-scale industries (Ministry, 2014). The sampling was taken through stratified sampling (Multi Stage Sampling). Based on the above criteria, sampling region gained 3 data: 1) Pekalongan regency as batik industrial center with the greatest batik enterprises in Central Java; 2) Solo regency as a palace batik center with the secondary largest number of business batik units in Central Java, 3) Lasem District of Rembang as coastal batik centers with highest growth number of business units in Central Java.
The analysis method in this research occupies stochastic efficiency frontier analysis. The production function and revenue of batik industry can be illustrated in the following formulas derived from the function of Cob Douglas:
Q = α0+α1 X1 + α2 X2+α3 X3+e (9) Where: Q= The total of batik production/Month (IDR), X1= The average of labour cost /Month (IDR), X2= The average of material cost and componental/Month (IDR), X3= The average of overhead cost/Month (IDR), α = intercept, slope, e = external factors of the model. The equation (9) in the natural algorithm function are illustrated as in the following:
LnQ = α0 + α1 LnX1 + α2 LnX2+α3 LnX3+e (10)
Technical efficiency (ET = Q’-Q), the efficiency that connects the actual production (Q) with the maximum production position (Q’). This ET shows the difference between maximum production and actual production. Economic efficiency (EE = Y’-Y), the efficiency that links the actual profit with the maximum profit. EE shows the difference between the maximum profit and the actual profit. Further, the role of entrepreneur toward technical efficiency and economic efficiency can be described in the following formula:
TE = δ0 + δ1 D1+ δ2 D2 + δ3 D3 + ɛ1 (11)EE = β0 + β1 D1 + β2 D2 + β3 D3 + ɛ2 (12)

Avalaible online at http://journals.ums.ac.id, Permalink/DOI: 10.23917/jep.v22i1.12061
Jurnal Ekonomi Pembangunan: Kajian Masalah Ekonomi dan Pembangunan, 22 (1), 2021, 22-33
Jurnal Ekonomi Pembangunan, ISSN 1411-6081, E-ISSN 2460-9331 27
Where: = Q’ - Q = technical efficiency, = Y’ - Y = economic efficiency, = Technical Quality Adoptiom (yes=1, no=0), = Design Quality Adoptiom (yes=1, no=0), = strategy type (0=cost leadership, 1= focus, differentiation), = constant, regression coefficient, = external factor of the model.
4. Results and Discussion4.1 Batik SMEs Activities in Quality
ManagementThe study found that the most Batik SMEs
entrepreneurs obtain batik skills from informal experiences from generation to generation and only 24% of formal education. Traditional patterns represent 67% of batik production and the remaining 33% are contemporary patterns.Most batik entrepreneurs don’t have their own design staff. Most batik patterns (67%) come from orders from market agents or buyers. Only 16% have design staff. Accces for proffesional designers are only 12% which is generally a fashion design. Most people only have the task of drawing patterns. Most design activities are carried out by the owners themselves who have a background in design (24%). A source of new design information was obtained from the batik design community (24%). 33% of batik entrepreneurs only focus on production and do not focus on batik pattern design. Batik Craft is a creative product in the field of fashion art, so the quality of design is important. Batik products are hereditary cultural heritage products. Batiks Patterns is a cultural heritage that represents aspects of locality, however batik designs also need to adjust to market trends and tastes. In addition to the design quality, the technical quality of batik cloth and coloring is an important aspect in batik marketing. Fabric quality consists of: comfortable level, durability, not easily damaged or torn. The color quality is that the color does not easily fade, the color is not blurred (color arises), clean or there is no medicinal flag, and is not wrong in color.
Batik businesses that are the object of research are medium-sized, small enterprises, so that most do not have formal mechanisms for quality management, such as: absence of formal planning on quality (64%), absence of formal
operational standard procedures (64%), no has a quality control officer (84%), does not have a staff or special unit that handles consumer complaints (88%). Only 16% of the sample SMEs have operating standards in several work units, namely there are written technical instructions that can be seen at any time by workers to remind how standard the operation of the unit is. Training on quality is conducted informally based on experience (100%) and limited to being done formally (26%).Quality control is carried out starting from controlling material quality standards, quality standards of production processes, intermediate goods, finished goods, up to the standard delivery of final products to consumers, so that goods (services) are produced in accordance with the planned quality specifications. Quality assurance is carried out by replacing defective products with better quality products (100%). Handling defective products is done by selling defective products to container traders with the risk of decreasing selling prices.
Table 1. Batik SMEs Activities in Quality Management
Activities in Quality Management Percent (%)
A. Design Quality1. degree of schooll design 242. have design staff 163. knowledge sharing community 244. access for professional designers 125. design form buyer or marketing agent 676. batik mark certification 377. others 33B. Technical Quality1. control mechanism for raw materials 342. control coloring and drug composition 343. control of packing and delivery 1004. has quality control staff 165. has standard operational procedure
standards 166. Process and product quality certifica-
tion 34

Avalaible online at http://journals.ums.ac.id, Permalink/DOI: 10.23917/jep.v22i1.12061
Jurnal Ekonomi Pembangunan: Kajian Masalah Ekonomi dan Pembangunan, 22 (1), 2021, 22-33
Jurnal Ekonomi Pembangunan, ISSN 1411-6081, E-ISSN 2460-933128
Activities in Quality Management Percent (%)
7. environmentally friendly process certi-fication 22
8. There are staff who handle consumer complaints 12
9. sale of defective products on the sec-ondary market 100
10. informal training 10011. formal training 2612. access to knowledge and information
from local government 63 Source : primary data
4.2 Production and Revenue of Batik IndustriesReturn to scale is a situation where output
increases in response to the proportional increase of all inputs. Refers to Cobb-Douglas function, the coefficients of each independent variable is the elasticity of the elastic dependent. The analysis variable changes exogenous variables on endogenous variables of production volume and revenue batik SMEs using the natural logarithm regression models. The test results are presented in Table 1.
Table 2. Summary of Production and Revenue Elasticity
Parameter Production Function
Revenue Funtion
β ρ β ρConstant -11,066 0,000 3,111 0,000LnX1 0,723 0,000 0,331 0,000LnX2 0,223 0,000 0,365 0,000LnX3 0,135 0,000 0,216 0,000R2 0,998 0,858F test 15518 200,275Sig. F (p-value) 0,000 0,000
Source : primary data
In terms of production function, Table 1 explained that elasticity of labor costs (LnX1) is 0.723. It means that any changes with labor costs by 1% will contribute changes to the production of batik at 0.723% if other variables are constant. Elasticity of variable costs of raw materials
(LnX2) is 0.223. It means that any changes in raw material costs by 1% will contribute changes to the production of batik at 0.223% if other variables are constant. Elasticity variable fixed cost (LnX3) is 0.135. It means that any increase in costs remained at 1% will contribute to the production of batik change of 0.35% if other variables are constant.
In terms of the revenue function, elasticity of labor costs (LnX1) is 0.331. It means that any changes with labor costs by 1% will contribute changes to income (gross) from the sale of batik at 0.331% if other variables are constant. Elasticity of variable costs of raw materials (LnX2) is 0,365. It means that any change in raw material costs by 1% will contribute changes to income (gross) of batik sales at 0.365% if other variables are constant. Elasticity variable fixed cost (LnX3) is 0.216. It means that any increase in costs remained at 1% will contribute changes to income (gross) from the sale of batik at 0.216% if other variables are constant.
4.3 TQM Adoption and Batik Industries EfficiencyThis stage (Table 2) is analysis of the role of
entrepreneurs in the implementation of technical quality (D1), design quality (D2) and competitive strategy (D3) treated with regression with point deviation in the production function and the effect on revenue. On the technical efficiency (Table 2), test results obtained by the correlation coefficient (R) positive (0.235). However the low correlation coefficient (0.235 <0.3) indicates a weak relationship. The effect of entrepreneurs in the implementation of technical and design quality on technical efficiency can not be explained and tends to be negative. These results can be attributed to other factors such as the economies scale efficiency and costs for the quality management adoption. Testing simultaneous equations with the goodness of fit obtained F count (F-test) of 1.869 (ρ= 0.140 > 0.5). It shows that the model does not fit with the data. Thus, it cannot be analyzed further (Table 2).
The findings of this study is in line with the opinion of previous research (Talib et al., 2010; Ahmadi et al., 2012) that TQM is difficult to

Avalaible online at http://journals.ums.ac.id, Permalink/DOI: 10.23917/jep.v22i1.12061
Jurnal Ekonomi Pembangunan: Kajian Masalah Ekonomi dan Pembangunan, 22 (1), 2021, 22-33
Jurnal Ekonomi Pembangunan, ISSN 1411-6081, E-ISSN 2460-9331 29
apply in SMEs due to the relatively high cost of certification, implementation, and maintenance of the certificate. It shows that the government needs to provide facilities for the manufacturing process as well as the extension of the trademark certificate Batik Indonesia. By so doing, it will help the batik entrepreneurs to compete with foreign products. Problems in MSEs is due to the efficiency of economies of scale, a relatively high cost in accessing and utilizing information technology, accessing infrastructure, limitations in reaching quality standards, lack of skills and knowledge in dealing with customers both in the domestic or export markets (Burlea-Schiopoiu & Mihai, 2019; Henttonen & Lehtimäki, 2017; O. Brien & Hamburg, 2014; Temouri et al., 2020; Ye & Kulathunga, 2019).
The results of this study also complement the results of the previous ones that the implementation of TQM does not only need to fit like scale enterprises, commitment and empowerment (Gonzalez & Jiménez, 2013), organizational culture (Ahmadi et al., 2012; Al-Swidi & Mahmood, 2012; Hilman et al., 2020; Ojo, 2013), but also the purpose of market and competitive strategy (Ahmadi et al., 2012; Feizollahi et al., 2013; Kantardjieva, 2014; Ojo, 2013; Yunis et al., 2013). The results of this study found that the strategy of focus and differentiation are more appropriate for the implementation of TQM that supports previous research (Ahmadi et al., 2012; Feizollahi et al., 2013; Kantardjieva, 2014; Ojo, 2013; Yunis et al., 2013). The higher the quality will be in line with the increase in prices.
Table 2. Entrepreneurial Role on Efficiency
ParameterTechnical Efficiency
(TE)
Economic Efficiency
(EE) β ρ β ρ
Constant 0.011 0.769 -2,101 x 106 0.000D1 - 0.163 0.056 1,972 x 106 0.035D2 - 0.022 0.851 6,469 x 106 0.000D3 0.089 0.229 2,062 x 106 0.012R 0,235 0,743R2 0,026 0,537
ParameterTechnical Efficiency
(TE)
Economic Efficiency
(EE)F test 1,869 39,350
Sig. F (p) 0,140 0,000 Note: D1= technical quality, D2= design quality,
D3= competitive strategy orientationSource : primary data
In terms of economic efficiency, test results are obtained from the correlation coefficient (R) positive (0.743). It suggests the orientation of the unidirectional relationship. It means that if an exogenous variable implementation of technical quality (D1), design quality (D2) and competitive strategy (D3) increases, the sales value of batik (Y) will also be increased above the industry average. The coefficient of determination (R2) is equal to 0.537 or 53.7%. It reflects that the implementation of technical quality (D1), design quality (D2) and competitive strategy (D3) is able to explain whether the variation of the change is an increase or decrease of the endogenous variables (deviations optimal point) sales at 53.7%. While the rest by 48.3% is influenced by other variables that are not involved in this research model. Testing simultaneous equations with the goodness of fit (F-test) obtained F count of 39.350 (ρ= 0.000). It shows that the model fits the data.
In terms of economic efficiency (Table 2), variable entrepreneurial role in the implementation of technical quality (D1)has a positive effect on operating revenues of batik (Y) (ρ = 0.035 <5%). The regression coefficient (β)= 1.972 x 10⁶ shows unidirectional relationship. It means that entrepreneurs that carry out the implementation of quality management has higher efficiency batik business income (Y) above IRD 1,972 million compared to the industry average entrepreneurs that lower carry out the implementation of technical quality.
The variable of implementation of design quality (D2) has a positive effect on economic efficiency of batik (Y) (ρ = 0,000 <5%). The regression coefficient (β) = 6.469 x 10⁶ shows the relationship undirectional. It means that export

Avalaible online at http://journals.ums.ac.id, Permalink/DOI: 10.23917/jep.v22i1.12061
Jurnal Ekonomi Pembangunan: Kajian Masalah Ekonomi dan Pembangunan, 22 (1), 2021, 22-33
Jurnal Ekonomi Pembangunan, ISSN 1411-6081, E-ISSN 2460-933130
market oriented entrepreneurs have business batik income (Y) more than Rp 6.469 million above the industry average compared to entrepreneurs who orient to local market.
Variable orientation of competitive strategy (D3) has a positive effect on operating revenues of batik (Y) (ρ= 0,000 <5%). The regression coefficient (β) = 2.062 x 10⁶ shows undirectional relationship. It means that entrepreneurs focusing on differentiation strategy or an income (Y) IDR 2,062 millions have higher income than the entrepreneurs who have a cost leadership strategy (Table 2).
Batik SME economic efficiency by the application of quality management and enterprise characteristics are presented in Table 3. The average efficiency of companies that apply quality management, and differentiation-focus strategy is higher than the average efficiency of companies that do not implement quality management, and low cost strategies orientation. The average technical efficiency implementing quality management is IDR 3.273 million or 10.33% above the efficiency frontier (the industry average). The average technical efficiency has IDR 8.121 million or 25.63% above the efficiency frontier. The average technical efficiency or differentiation focus strategy is IDR 4.695 million or 14.82% above the efficiency frontier.
The average of technical efficiency of companies that do not implement quality management is IDR 1,762 million, or 5.56% below the efficiency frontier (the industry average). The average of technical efficiency is IDR -1.322 million, or 4.17% below the efficiency frontier. The average production cost efficiency-oriented enterprises or differentiation focus strategy is Rp 4.695 million, or 4.68% below the efficiency frontier (Table 3).
The study found that the role of entrepreneurs in the implementation of technical quality (D1), design quality (D2) and competitive strategy (D3) does not give positive and significant effects on the production efficiency (Y). However, the role of entrepreneurs in the implementation of quality management and the orientation of competitive strategy brings significant effect on revenues efficiency (Y).
Table 3. Economic efficiency of SMEs Batik based on Quality Management Adoption and the
Company CharacteristicsInefficiency
Average (million/IDR)
Efficiency-Inefficiency Average (%)
A. T e c h n i c a l QualityNo. -1.762 -5.56Available 3.273 10.33
B. Design QualityNo. -1.322 -4.17Available 8.121 25.63
C. S t r a t e g y OrientationM a n a g e r i a l Cost
-1.483 -4.68
F o c u s , Differentiation
4.695 14.82
Source : primary data
This research has found that the role of entrepreneurs in the implementation of quality management has no significant effect on production efficiency. However, it brings significant effect on the efficiency of revenue. The results of this study found that the effect of the implementation of quality management is on both operating revenues.
These findings are in line with the previous research (Ali & Yusuf, 2019; Anil & K.P., 2019; Deshpande, 2019; Essel, 2020; Hilman et al., 2020; Mushtaq & Peng, 2020; Sahoo & Yadav, 2017; Sinha et al., 2016) by considering quality management as a leading management philosophy that enhances the position and performance of the company. Facing the free trade, it is a requirement to provide support for all products to perform quality management. Quality improves model of performance management through TQM applied in developed countries including the United States, Japan, Britain and other European countries. Nevertheless, in the free-market era, quality practices are also required on small and medium businesses in developing countries.
The results also show that TQM is a quality management system that can be implemented by small and medium enterprises. It can increase revenues as well as SMEs Batik. Yet, the results

Avalaible online at http://journals.ums.ac.id, Permalink/DOI: 10.23917/jep.v22i1.12061
Jurnal Ekonomi Pembangunan: Kajian Masalah Ekonomi dan Pembangunan, 22 (1), 2021, 22-33
Jurnal Ekonomi Pembangunan, ISSN 1411-6081, E-ISSN 2460-9331 31
of this study found that entrepreneurs who own batik and batik SNI (Indonesian National Standard) label are still below 10%. Batik artisans who have SNI and Batik label are still in a small number due to the low awareness to take care of standardization (64%) and the high cost of maintenance constraints (76%).
Batik SMEs that focus on the implementation of quality management for competitive strategy, the implementation of quality management are often constrained by economies of scale problems that small businesses have (Burlea-Schiopoiu & Mihai, 2019; Henttonen & Lehtimäki, 2017; O. Brien & Hamburg, 2014; Temouri et al., 2020; Ye & Kulathunga, 2019). Therefore, the model of alliances (horizontal and vertical) can be considered to deliver the potential benefits of economies of scale efficiency in the adoption of quality management (O. Brien & Hamburg, 2014). In the model of horizontal alliances, business groups can work together for quality planning (such as by building a brand, control design and environmental impact), quality testing (bring staff for testing quality standards batik or quality management consultants together will lead to lower costs). In the model of vertical alliances, company leaders focus on quality control and management, health insurance open to domestic and international markets. While, SMEs focus on meeting the product quality and timely delivery.
5. ConclusionBased on the results of research on batik
SMEs, it can be concluded that the implementation of design and technical quality management do not significantly increase efficiency, but it significantly increases revenue efficiency. The implementation of quality management significantly increases revenue especially in the focus and differentiation strategies.
Based on the results and discussion, this study has several recommendation as follows. (1) Batik business operators are required for the adoption of quality management. (2) The Government may provide convenience to the process of obtaining certification and quality certification and brand extension Batik Indonesia because it will help batik entrepreneurs to
compete in both local and global markets. (3) Economies of scale make SMEs inefficient for the adoption of quality management, so it becomes an obstacle to be competitive in a long term. SMEs must overcome obstacles economies of scale efficiency with cooperative/business group in both clusters and business networks, building vertical alliances within the related business group, or employ agents both through acquisition and contract-based resources. (4) Local government can provide incentives and guidance system to foster the development of new businesses for the implementation of quality management, especially in a short term. (5) The Association respectively strives acknowledgement from the government to assist Central Java batik artisans especially for services trade in Central Java. It also continues to encourage the artisans to consider SNI batik or well known as the Trade Mark (TM). (6) The Association of batik artisans encourage members about the importance of quality standards in the form of batik and batik SNI label.
This study has several limitations. First, this study uses a cross-sectional design approach through determinant analysis. Cross-sectional design based on a qualitative survey of Barik SMEs managers’ experience and preferences. Cross-sectional design causes research to be unable to explain the influence of serial time, such as changes in policy, technology and dynamics of the social-economic environment. Second, research was conducted in Central Java, Indonesia, with homogeneous regulatory, geographical, social and cultural conditions. Research can produce different results with different regional characteristics (regulation, economic, social, technological). This study provides recommendations for future research, for research in other countries, other periods with different regulatory conditions, economy, social, technology.
6. ReferencesAhmadi, S. A. A., Salamzadeh, Y., Daraei,
M., & Akbari, J. (2012). Relationship between Organizational Culture and Strategy Implementation: Typologies and Dimensions. Global Business and

Avalaible online at http://journals.ums.ac.id, Permalink/DOI: 10.23917/jep.v22i1.12061
Jurnal Ekonomi Pembangunan: Kajian Masalah Ekonomi dan Pembangunan, 22 (1), 2021, 22-33
Jurnal Ekonomi Pembangunan, ISSN 1411-6081, E-ISSN 2460-933132
Management Research: An International Journal, 4(3 & 4). https://doi.org/286-299
Al-Swidi, A. K., & Mahmood, R. (2012). Total Quality Management, Entrepreneurial Orientation and Organizational Performance: The Role of Organizational Culture. African Journal of Business Management, 6(13), 4717–4727.
Ali, J., & Yusuf, N. (2019). International Quality Certification and Business Performance of Indian Firms: Evidence from Enterprise Survey Data. Global Business Review, 0972150919. https://doi.org/10.1177/0972150919825514
Anil, A. P., & Satish, K.P., S. (2019). TQM practices and its performance effects – an integrated model. International Journal of Quality & Reliability Management, 36(8), 1318–1344. https://doi.org/10.1108/IJQRM-10-2018-0266
Bidwell, M. (2011). Paying More to Get Less: The Effects of External Hiring Versus Internal Mobility. Administrative Science Quarterly, 56(3), 369–407. https://doi.org/10.1177/0001839211433562
Burlea-Schiopoiu, A., & Mihai, L. (2019). An Integrated Framework on the Sustainability of SMEs. Sustainability, 11, 6026. https://doi.org/10.3390/su11216026.
Chen, C. M., Delmas, M. A., & Lieberman, M. B. (2015). Production frontier methodologies and efficiency as a performance measure in strategic management research. Strategic Management Journal, 36(1), 19–36.
Deshpande, A. (2019). Total Quality Management, Concurrent Engineering and Manufacturing Performance: An Empirical Investigation. Journal of Operations and Strategic Planning, 2(1), 35–64. https://doi.org/10.1177/2516600X19845230
Essel, R. E. (2020). Assessing Total Quality Management (TQM) Effect on Hospital Performance in Ghana Using a Non-Probabilistic Approach: The Case of Greater Accra Regional Hospital (GARH).
Metamorphosis, 19(1), 29–41. https://doi.org/10.1177/0972622520949091
Feizollahi, S., Shirmohammadi, A., & Latifian, B. (2013). The investigation of relationship between organization strategy, total qualitymanagement (TQM) and organization performance. Advances in Environmental Biology, 7(8), 1879–1885.
Gonzalez, L. P., & Jiménez, D. J. (2013). Total Quality Management And Its Relationship With Empowerment AndCommitment: Their Effects On FirmPerformance. Electronic International Interdisciplinary Conference September, 2(6), 39–46.
Henttonen, K., & Lehtimäki, H. (2017). Open innovation in SMEs: Collaboration modes and strategies for commercialization in technology-intensive companies in forestry industry. European Journal of Innovation Management, 20(2), 329–347. https://doi.org/10.1108/EJIM-06-2015-0047
Hilman, H., Ali, G. A., & Gorondutse, A. H. (2020). The relationship between TQM and SMEs’ performance: The mediating role of organizational culture. International Journal of Productivity and Performance Management, 69(1), 61–84. https://doi.org/10.1108/IJPPM-02-2019-0059
Kantardjieva, M. (2014). The Relationship between Total Quality Management(TQM) and Strategic Management. Journal of Economics, Business and Management, 3(5), 537–541.
Majuri, M., & Halonen, N. (2019). Capability Building Through Dynamic Capabilities and Organizational Learning. In Responsible Consumption and Production, Encyclopedia of the UN Sustainable Development Goals. Springer Nature Switzerland AG. https://doi.org/10.1007/978-3-319-71062-4_2-1
Mushtaq, N., & Peng, W. W. (2020). Can TQM Act as Stimulus to Elevate Firms’ Innovation Performance?: An Empirical Evidence From the Manufacturing Sector of Pakistan. SAGE Open. https://doi.

Avalaible online at http://journals.ums.ac.id, Permalink/DOI: 10.23917/jep.v22i1.12061
Jurnal Ekonomi Pembangunan: Kajian Masalah Ekonomi dan Pembangunan, 22 (1), 2021, 22-33
Jurnal Ekonomi Pembangunan, ISSN 1411-6081, E-ISSN 2460-9331 33
org/10.1177/2158244020963669O. Brien, E., & Hamburg, I. (2014). Supporting
Sustainable Strategies for SMEs through Training, Cooperation and Mentoring. Higher Education Studies, 4(2), 61–69. https://doi.org/10.5539/hes.v4n2p61
Ojo, J. (2013). Competitive Strategy and Total Quality Management Culture in organizations. African Research Review, 1(1), 47–56.
Sahoo, S., & Yadav, S. (2017). Entrepreneurial orientation of SMEs, total quality management and firm performance. Journal of Manufacturing Technology Management, 28(7), 892–912. https://doi.org/10.1108/JMTM-04-2017-0064
Sinha, N., Garg, A. K., & Dhall, N. (2016). Effect of TQM principles on performance of Indian SMEs: the case of automotive supply chain. The TQM Journal, 28(3). https://doi.org/10.1108/TQM-10-2014-0086
Temouri, Y., Shen, K., & Pereira, Vijay & Xie, X. (2020). How do emerging market SMEs utilize resources in the face of environmental uncertainty? BRQ Business Research Quarterly, 23, 1–12. https://doi.org/10.1177/2340944420929706
Unesco. (2015). Cultural times The first global map of cultural and creative industries. http://unesdoc.unesco.org/images/0023/002357/235710E.pdf
van Kemenade, E. (2014). Theory C: the near future of quality management. The TQM Journal, 26(6), 650–657. https://doi.org/10.1108/TQM-12-2013-0133
Widrick, S., A.E, M., & Grant, D. (2002). Measuring the Dimensions of Quality in Higher Education. Total Quality Management, 13(1), 123–131. https://doi.org/10.1080/09544120120098609
Ye, J., & Kulathunga, K. (2019). How Does Financial Literacy Promote Sustainability in SMEs? A Developing Country Perspective. Sustainability, 11(10), 1–21. https://doi.org/10.3390/su11102990
Yunis, M., Jung, J., & Chen, S. (2013). TQM, strategy, and performance: a firm‐level analysis. International Journal of Quality & Reliability Management, 30(6), 690–714. https://doi.org/10.1108/02656711311325638
Zhu, Y. M., Alard, R., & Schoensleben, P. (2007). Design Quality: A Key Factor to Improve the Product Quality in International Production Networks. IFIP International Federation for Information Processing, 24b, 132–141.