Embed Size (px)
Citation preview

Jejak Vol 11 (2) (2018): 377-391, DOI: https://doi.org/10.15294/jejak.v11i2.16058
JEJAK Journal of Economics and Policy
http://journal.unnes.ac.id/nju/index.php/jejak
Batik SMEs Efficiency and Entrepreneurship Role in Innovation
Edy Dwi Kurniati1 , Sucihatiningsih Dian Wisika Prajanti2
1 Faculty of Economics and Business, Darul Ulum Islamic Centre Sudirman GUPPI University (UNDARIS) Semarang Region, Central Java
2 Faculty of Economic, Universitas Negeri Semarang, Central Java
Permalink/DOI: https://doi.org/10.15294/jejak.v11i2.16058
Received: February 2018; Accepted: May 2018; Published: September 2018
Abstract:
In the long term, batik SMEs to compete in the local and global markets can not only rely on production capabilities rooted in local
sources of uniqueness, but must have efficiency of economies scale for resource access and innovation. In a competitive
environment, entrepreneurs in the batik industry have an important role to improve the efficiency. This study analyzed the role of
entrepreneurs in the economic efficiency. This study applies production model to describe the entrepreneurs role on economic
efficiency. The study was conducted by interviews to 100 Batik SMEs managers-owners in the Batik Centre in Solo, Pekalongan and
Rembang. The entrepreneurs role in innovation in term of product innovation, marketing innovation, and business alliances
(cooperatives). Data analysis was performed using Stochastic Frontier and Deterministic Regression Analysis. The empirical results
of the technical inefficiency effects model suggest that the entrepreneurs role in product innovation, marketing innovation and
business alliances are important factors affecting economic efficiency of batik SMEs. The role of entrepreneurship in marketing
innovation has the highest elasticity of the production and sales of batik, and then followed by the role of entrepreneurs in new
product innovation and business alliances.
Key words: entrepreneurs role, innovation, SMEs efficiency
How to Cite: Kurniati, E., & Prajanti, S. (2018). Batik SMEs Efficiency and Entrepreneurship Role in Innovation.
JEJAK: Jurnal Ekonomi dan Kebijakan, 11(2), 377-391. doi:https://doi.org/10.15294/jejak.v11i2.16058
Corresponding author :
Address: Jl. Tentara Pelajar, No.13 Semarang, Central Java Indonesia
E-mail: [email protected]
p-ISSN 1979-715X
e-ISSN 2460-5123

JEJAK Journal of Economics and Policy Vol 11 (2) (2018): 377 – 391 378
INTRODUCTION
Batik is a traditional hand-crafted dye-
resist textile rich in intangible cultural
values, passed down for generations. Batik is
a technique of wax-resist dyeing applied to
whole cloth, or cloth made using this
technique originated from Indonesia. The
development of the batik industry as one of
the 14 components of the creative industries
needs to be improved, given the batik market
trends and prospects in the global market
promising. Batik industry has contributed to
the growing the national economy with an
export value of 761 million USD in 2011.
Besides that, amounted to 99.39 of 326
business units engaged in the batik industry
is the Micro, Small and Medium Enterprises
(SMEs), with absorption batik industry
worker about 838 million people that are
spread in various regions in Indonesia. It
means that there is a large contribution from
the batik industry to job opportunities and
income improvement. The additional value
of the batik industry is increasing every year
with the average growth of 32.27%
(Deperindag, 2013).
In a competitive industrial environment,
entrepreneurs factors of batik industry have
an important role to increase economic
efficiency. Innovation is not limited to large-
scale companies that generally have research
and development (R & D) divisions, however
small scale businesses such as Batik SMEs
also require innovation activities (Karabulut,
2015; Ganzera et al., 2017; Ismail et al. , 2014;
Charoenrat et al., 2013; de Jorge, and Suárez,
2011). SMEs benefit organizations flexibility
in responding to environmental change, but
most SMEs have lack of access and inno-
vation capacity due to resource constraints
and economies of scale (Acs et al. 2008),
including in doing development of
cooperation and strategic alliances (Acs et
al., 2008; Ahn et al., 2015; 33-34). SMEs also
have weaknesses R & D capacity leads to
SMEs dependence on external knowledge
(Kim and Park, 2010), but low human
resource capacity also causes inefficient
acquisition of external knowledge (Ahn et al.,
2015; 33-34). Innovation investment becomes
inefficient especially for innovation activities
that require large investment, while small
production capacity. Financial constraints
not only limit the activity of SMEs
innovation, especially for innovation
activities that require large capital. The issue
of capital in SMEs is also a constraint to
utilize the innovation result as in the
purchase of production equipment. SMEs
also have weaknesses in the capacity of tsp
for effective and efficient management of
innovations. SMEs have constraints to recruit
highly skilled workers and change organiza-
tional culture.
Its capacity in batik SMEs is needed to
compete in local, domestic or global markets,
for example on managing the production
resources, flexibility and the ability to
identify business opportunity also market
potency based on product and its unique
service. Although the batik SMEs has several
potencies to develop, it also has several
problems including limited access especially
related to capital, possessing no economics
scale efficiency, high cost on access and
using information technology, low skill and
knowledge (related to using of technology,
entrepreneurship, managerial, accounting
and marketing) to serve the consumers both
in domestic or export market, lacking
information about market opportunity, high
in transaction cost (especially on infrastruc-
ture access), lack access to the quality
standard (Charoenrat and Harvie, 2013;
Hamdania and Wirawan, 2012; Irjayantia dan
Azis, 2012).

379 Kurniati and Prajanti, Batik SMEs Efficiency and Entrepreneurship Role in Innovation
The production process in Batik SMEs is
an activity to change inputs, which are also
called factors of production into outputs so
that the value of the goods increases. The
production function describes the technical
relationship between input and output that
can be produced, or a factor that shows the
relationship between the level of output and
the level of input use. (Mankiw: 2008). The
Cobb-Douglas Production Function is one of
the production functions which has the
advantage of simple, economical functions in
parameter estimation calculations, and often
results in real expectations according to
statistical tests. Consistent with marginal
products that are decreasing, it is easily
obtained by the estimation of economies of
scale, and the contribution of relative factors.
Q= AKαL1-α (1)
Where, Q represents output or production
result that becomes the function from
technology index (A), capital (K) and Labor
(L). The α symbol is called model parameter.
For the value of technology index is so called
efficiency parameter.
Thus Schumpeter's theory explains that
entrepreneurs are acting as innovators to
produce new combinations with innovation
and create opportunities (Audretsch and
Keilbach, 2007; Acs et al., 2008; Zsuzsannaa
dan Hermana, 2012). When the market is
static, entrepreneurial through innovation
process introduces new products, production
methods, markets, sources of supply, or a
combination of the industry which affect the
economy out of previous equilibrium.
Furthermore, entrepreneurs find opportu-
nities to meet the demand to reach a new
equilibrium. Innovation is an important
activity to create efficiency (Karabulut, 2015;
Ganzera et al., 2017; Ismail et al., 2014;
Charoenrat et al., 2013; de Jorge, dan Suárez,
2011).
The Oslo Manual for measuring
innovation defines four types of innovation
(OECD, 2014; Ganzera et al., 2017): product
innovation, process innovation, marketing
innovation and organizational innovation.
Product innovation is A good or service that
is new or significantly improved. This
includes significant improvements in techni-
cal specifications, components and materials,
software in the product, user friendliness or
other functional characteristics. Process
innovation is a new or significantly improved
production or delivery method. This includes
significant changes in techniques, equipment
and/or software. Marketing innovation is A
new marketing method involving significant
changes in product design or packaging,
product placement, product promotion or
pricing. Organizational innovation is A new
organizational method in business practices,
workplace organization or external relations
such as business alliances. Then, the inno-
vation activity will be shown as:
QR= KR
+ ARz (2)
Where:
z = LRh,
KR = g(E)KR
Where, QR represents output of innovation
activity that becomes the function from
capital for innovation (KR), stock of know-
ledge (AR), in relaton resource channelled in
to R&D (z). Internal innovation that becomes
the function from labor for innovation (LR)
and demand of innovation (h). Capital for
innovation (KR) is influenced by Capital for
innovation in the previous year (KR’) and
growth (g) of entrepreneur activity (E).
Quantity production of goods/services as
activities for the fulfillment of human needs

JEJAK Journal of Economics and Policy Vol 11 (2) (2018): 377 – 391 380
is limited because the economic resources
available is always limited in number.An
Entrepreneur has the function of managing
limited resources to produce a higher output
in the fulfillment of these needs through
innovation effort. In the aspect of demand,
entrepreneurs have a role to increase the
demand for goods and services. In the
production aspect, entrepreneurship has a
role to manage the resources (inputs) as low
as possible to produce the highest output
through the creation of added value and
production efficiency. High demand for
goods and services will increase production
volume and revenue, but the increase in
revenue is influenced by other factors.
Meanwhile, production volume is influenced
by the price and cost of production, as well
as entrepreneurial skills in managing
resources to produce higher value-added and
business efficiency through innovation
activity. Notation θ describes the benefits of
capital for investment, while ρR describes
the risk of capital (lost capital for investment
activities. The capital for innovation (KR) and
stock of knowledge for innovation (AR) have
positive influence to revenues of innovation
activities (πR). Labor wage for innovation (LR)
and capital expenditure for innovation (KR)
have negative influence to revenues of
innovation activities (πR) (Audretsch dan
Keilbach, 2007).
RRRg
RRR KzwzAK −−+= (3)
The free market offers the incentive for
competition that encourages the allocation
of factors of production to the most valuable
and efficient use (Lieberman & Dhawan,
2005; Chen, Delmas & Lieberman, 2015). The
efficiency that will be achieved if the
company can optimize the output or
minimize the input. While the function of
efficiency improvement, the role of entrepre-
neurship can be formulated as (Audretsch
dan Keilbach, 2007):
kd
rdTE
= (4)
Where, TE = technical efficiency, dπr =
efficiency profit, dπk = resources which
spend to improve the efficiency such as: the
use of tehnology and activities of product
innovation.
In the long term, the batik SMEs cannot
only rely production capabilities rooted in
tradition as a source of uniqueness in the
market to compete in local, domestic and
global markets, but also have other
advantages, such as the dynamic design and
competitive, understanding quality control,
understanding environmental issues such as
eco-design and eco-labeling, understanding
export procedures, possessing economies
scale efficiency in other hand mastery on
technical and other management controls
such as entrepreneurial, managerial,
accounting and marketing (Hamdania and
Wirawan, 2012; Irjayantia dan Azis, 2012).
There are so many research on batik SMEs
efficiency in Indonesia. This study is the
further research of previous study (Hidayat,
2012; Susanty et al. , 2015) by focusing on the
entrepreneurs role in innovation on batik
SMEs efficiency.
RESEARCH METHODS
This research was conducted at the batik
SMEs in Central Java, Indonesia. The place
selection is due to the potential for
innovation and product development of the
batik industry in Central Java as the data of
Disperindag -Industry and Trade Provincial
Agency (2013). The industries have developed
in the recent years, especially in some areas
of the centers of batik, so it is relevant to be
381 Kurniati and Prajanti, Batik SMEs Efficiency and Entrepreneurship Role in Innovation
studied. Based on data from this agency, the
number of the batik industries in the year of
2013 are 538 businesses, consisting of 55
major industries, 221 medium scale industries
and 262 small-scale industries.
The study was conducted involving 100
respondents, entrepreneurial SMEs in
Central Java Batik Sentra in Surakarta,
Pekalongan, and District Apex (Lasem).
Surakarta is one of the centers of batik
industries in Central Java. The Surakarta
batik is batik that develops in the Surakarta
palace. The development of batik in the
palace is influenced by the Javanese Hindu
culture, has a motif with geometric shapes,
the ornamental variety is symbolic.
Pekalongan Batik and Lasem Batik are
coastal batik that develop and are influenced
by Islamic and Chinese culture. The
development of this batik is influenced by
Islamic culture and China, has a motif with a
non-geometric shape and its ornament is
natural.
The results of the questionnaire are
tabulated and analyzed to determine the
accuracy of existing research models. The
samples are determined by the techniques of
purposive and proportional random
sampling. The variables of exogenous
variables include the labor costs, materials
costs and fixed costs, meanwhile the
endogenous variables include production
and revenue efficiency of batik SMEs. Data
processing is performed by analyzing the role
of entrepreneurship to the efficiency of
revenue batik using deterministic statistical
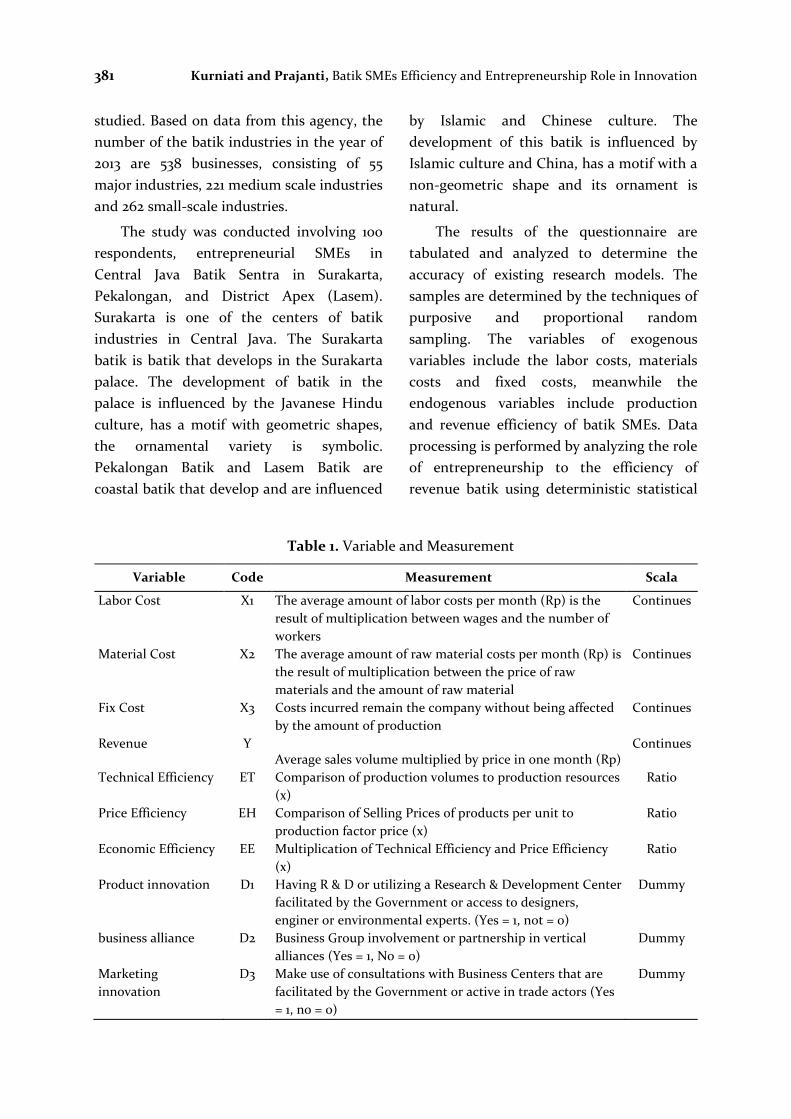
Table 1. Variable and Measurement
Variable Code Measurement Scala
Labor Cost X1 The average amount of labor costs per month (Rp) is the
result of multiplication between wages and the number of
workers
Continues
Material Cost X2 The average amount of raw material costs per month (Rp) is
the result of multiplication between the price of raw
materials and the amount of raw material
Continues
Fix Cost X3 Costs incurred remain the company without being affected
by the amount of production
Continues
Revenue Y Average sales volume multiplied by price in one month (Rp)
Continues
Technical Efficiency ET Comparison of production volumes to production resources
(x)
Ratio
Price Efficiency EH Comparison of Selling Prices of products per unit to
production factor price (x)
Ratio
Economic Efficiency EE Multiplication of Technical Efficiency and Price Efficiency
(x)
Ratio
Product innovation D1 Having R & D or utilizing a Research & Development Center
facilitated by the Government or access to designers,
enginer or environmental experts. (Yes = 1, not = 0)
Dummy
business alliance D2 Business Group involvement or partnership in vertical
alliances (Yes = 1, No = 0)
Dummy
Marketing
innovation
D3 Make use of consultations with Business Centers that are
facilitated by the Government or active in trade actors (Yes
= 1, no = 0)
Dummy

JEJAK Journal of Economics and Policy Vol 11 (2) (2018): 377 – 391 382
frontier with statistical technique to estimate
frontier (Charoenrat et al., 2013; Ismail et al.,
2014)) and regression to determine the effect
of role entrepreneurship in innovation.
This study applies production model;
that is a general model that able to describe
the role of resource on the production
function. The challenge of such traditional
approach is conceptually the production
function to spend expense encountered by
an effective company that occupies the best
practical method within. Most companies are
not fully efficient in capitalizing the resource
inputs. Therefore, the related companies
posit below the average industries. The
advancement of econometric by Suharno,
Susilowati & Firmansyah (2017) results the
model development of stochastic frontier
production capable to identify the produc-
tion axis and company relative position.
Y = f(L, K) TE (ɛ) (5)
Where, Production is defined as value-
added (Y) with the function from labor (L)
and capital (K), TE = technical efficiency, the
function of efficiency increasement
(competitive advantage). ɛ = error variable.
The formula (5) can be written in the natural
logarithm in empiric model before include
entrepreneur role as in the following.
LnYi = β0 + β1LnLi + β2LnKi + ɛi (6)
Where: Yi = value-added firm i, Li = Labor
firm i, Kt = capital firm i, ɛi = error variable.
In the Function of Production Cost in natural
logarithm, can be written as follows.
LnY= α0 + α1LnX1+ α2LnX2 +
α3LnX3 + vi - ui (7)
Where: X1 = Labor Cost, X2 = Material Cost,
X3= Fix Cost. Stochastic frontier production
function was being introduced by Aigner et
al., (1977) pointed out that the components
of the specific error term (ɛi) which ɛi = vi -
ui. Where, ui is explainable error variable
such as entrepreneurs activities, whereas vi is
unexplainable error variable. The issue of in-
efficiency basically arises from the assump-
tion that economic actors maximize profits.
Furthermore, deviations from the optimal
point (efficient) is the difference between
actual income and income prediction that is
influenced by the role of entrepreneur. An
entrepreneur's role analysis of production
efficiency can be illustrated by the following
equation.
Y’ - Y= α + β1D1+ β2 D2+ β3 D3 + vi (8)
Where: Y' - Y = In-efficiency Income, D1 =
entrepreneurship role in product innovation,
D2 = entrepreneurship role in business
alliance, D3= entrepreneurship role in
marketing, α = constant, β = regression
coefficient, vi = unexplainable error variable.
The concept of efficiency refers to the
writings of Farrell (1957) in Coelli et al.,
(2005) uses the efficient unit isoquant to
measure economic efficiency (EE), and to
decompose this measurement into efficiency
technical (ET) and allocative efficiency (AE)
(EE = ET x AE). ET is defined as the ability of
the firm to produce maximum output from
the use of a set (bundle) input, while AE
reflected firm ability to use input to optimal
portion at a certain level and price. In
Farrell’s framework, These concepts are
illustrated in Figure 1, where point P
represents an inefficient firm and the
distance QP is the amount by which all
inputs could be reduced (proportionally)
without lowering output to achieve the
technically efficient level of production
(point Q). Thus, the ET measurement is
equal to the ratio 0Q/0P. Similarly, AE is
equivalent to the ratio 0R/0Q

383 Kurniati and Prajanti, Batik SMEs Efficiency and Entrepreneurship Role in Innovation
Figure 1. Technical (ET), allocative (EA) and economic efficiency (EE)
Source: Coelli et al. (2005)
RESULTS AND DISCUSSION
Profile of Respondens
Batik SMEs in Surakarta, Pekalongan
and Lasem are family companies, which are
Small and Medium Enterprises (SMEs). Most
of the manager-owner of Batik SMEs who
have over 50 years of age are 45%. The
number of manager-owner of Batik SMEs
aged 41-50 years as much as 29%, 31-40 years
as much as 22%. The number of manager-
owner of Batik SMEs who have under 30
years of age is generally new business actors
(4%) (Table 2).
Most of the manager-owner of Batik
SMEs who have formal education level in
high school (46 %), followed by Diploma or
Bachelor (28 %), middle school (20 %),
elementary and non-primary education level
(6%). In terms of gender, managers-owners
are more women (63%), while men (37%).
Some business operators get business
management training such as from the local
government and from banks (63%).
The most market target carried out by
batik business owners is in the marketing
areas local, local and Domestic (Solo,
Yogyakarta, Surabaya, Jakarta, Bandung,
Bali), each of which is equal to 33 %, Batik
SMEs with target market only local is 18 %.
Batik SMEs with main target market export is
15 %. The area of overseas marketing itself is
to Malaysia, Singapore, Thailand, India, Italy,
France, Middle East.
Table 2. Profile of Respondens
No. Percent (%)
(N=100)
1 Age
<30 years 4
31-40 years 22
41 - 50 Years 29
> 50 years 45
Total 100
2 Education
Elementary School, Not
Completed Elementary
School
6
Middle School 20
High School 46
Diploma, Bachelor 28
Total 100
3 Business Owner Gender
Woman 63 63
Man 37
Total 100
4 Training
Yes 63
No. 37
Total 100
5. Types of products
Stamp Batik and Writing
batik
73
Writing batik 27
Total 100
6. Marketing area
Local 19
Domestik 33
Local and Domestic 33
Local, Domestic and
export
15
Total 100
Source: Survey on batik SMEs 2017(processed)

JEJAK Journal of Economics and Policy Vol 11 (2) (2018): 377 – 391 384
There are not only one type of product,
but various types of batik that can be
produced. The batik products produced are
stamp batik and combination batik (a
mixture of stamp batik and Writing batik).
From table 2 it is known that many types of
batik products produced by batik entrepre-
neurs are type of combination batik products
(a mixture of stamped batik and drawing) (73
%) but in the type of Writing batik a total of
27% %. The Writing batik is the most
expensive batik. This batik is handmade.
Writing batik can be distinguished from
printing batik and stamp batik based on the
appearance of the pattern. Writing batik has
an unequal pattern between one pattern and
another. This pattern is not as neat as the
pattern possessed by the pattern of printing
batik and stamp batik. Even so, it gives a
characteristic to batik. So that there is no
equal between one batik and the other batik.
The price of stamp batik ranges from Rp.
25,000 - Rp. 40,000, while Writing batik is
the cheapest Rp. 300,000 to millions of
rupiah.
Business actors in running their business
are not fully running smoothly. These
business actors experience obstacles or
obstacles including direct market access
(16%) and capital which is the main obstacle
for business actors (69%). The low access to
capital is still a classic reason for constraints
to business development. Usually capital can
be assessed from the assets owned by
business people to run their business both
initial capital and working capital. The initial
capital includes, among other things, indus-
trial equipment and equipment, generally
undertaken by business actors through
various means. The working capital in the
form of money is usually self-employed by
businesses by saving, debt to friends or
family.
The role of Batik SME business manager-
owners is very dominant in managing
business both in supervising production,
marketing and decision making. Generally
small industries have simple organizational
characteristics, there are no guidelines, do
not have standard operating procedures, do
not have standard marketing guidelines.
Most businesses are managed by individuals
who are both owners and managers of
companies, and utilize the workforce from
their families and close relatives.
Efficiency of Batik SMEs
Table 3 shows independent variable
which consists of labor cost (X1), material
cost (X2) and fixed cost (X3), and its elastic
production is more than 1 (1,081). It means
that in increasing the return to scale
condition, seen from coefficient value, those
variables have positive values.
Table 3. Estimation Result of Frontier
Stochastic Analysis
Revenue
β ρ
(Constant) 0,141 0,833
LnX1 0,723 0,000
LnX2 0,223 0,000
LnX3 0,135 0,028
R2 0,716
F hitung (p-) 84,017 (0,000)
Source: Survey on batik SMEs 2017(processed)
Classical assumption tests (Table 3)
include normality, autocorrelation, multi-
collinearity tests and heteroscedasticity tests
performed on linear models. The classical
assumption test is compared between the
cost equation model without including
entrepreneurial factors. Data Normality
Testing is done to find out whether the
research data is normally distributed or not.
Normality Test Data is performed using the

385 Kurniati and Prajanti, Batik SMEs Efficiency and Entrepreneurship Role in Innovation
Kolmogorov-Smirnov Z test on residuals
(Unstandardized Residual). Calculation
results obtained Kolmogorov-Smirnov Z
value = 1,315 (p-value = 0,063> 0,05) (Table 4)
shows normal distributed data for cost
function before including entrepreneurial
factors.
Autocorrelation test is used to test the
correlation of data. To test the presence or
absence of autocorrelation residual testing
was used with the statistical run-test
approach. Run test is used to test whether
there is a high correlation between residuals.
If there is no correlation between residuals, it
is said that residuals are random or random.
Run test is used to see whether residual data
occurs randomly or not (systematic). If the p-
value is <0.05 (5%), then the residual is not
random, if the p-value is> 0.05 (5%), then the
residual is random. The significance value of
run-test (p-value) = 0.841 (> 0.05) shows that
residual is random or shows no autocorre-
lation in residual data.
Multicollinearity testing of data was
conducted to test the correlation between
independent variables. Multicollinearity test
is done using the Variance Inflation Factor
(VIF) value. The model is declared free of
multicollinearity interference if it has a VIF
value below 10 or tolerance above 0.1. Table 4
gives all VIF values below 10 or tolerance
values above 0.1, so that it can be concluded
that the linear regression model does not
occur multicollinearity.
The heterokedastic test is to find out
whether the data has the same variance. The
results of testing heterokesdasticity using the
park method found no significant beta
parameters on the regression of exogenous
variable labor costs (X1), material costs (X2)
and fixed costs (X3) on Unstandardized
Residual, so that the data meets the
assumption of Heterocestasticity or data is
homogeneous. Significance value of t-test (p-
value)> 0.05 for all exogenous variables so
that the model meets the assumption of data
homogeneity. The results of the Classical
Regression Assumption test show that the
data model has fulfilled the assumptions of
data normality, multicollinearity and
homogeneity and the assumption of
autocorrelation so that it can be used for
analysis.
Table 4. Classical assumption
Estmation
Normality Distribution
Z-test 1,315
Z-test (ρ) 0,063
Autocoleration test
run-test 0,201
run-test (ρ) 0,841
Multicolinierity test (Tolerance,VIF)
LnX1 0,661 (1,512)
LnX2 0.676 (1.480)
LnX3 0.609 (1.643)
Heterocedastisity (sig. t-test) endogen= error2
LnX1 0,213
LnX2 0,424
LnX3 0,172
Source: Survey on batik SMEs 2017(processed)
Figure 2. Distribution of technical efficiency of
Batik SMEs
Source: Survey on batik SMEs 2017(processed)

JEJAK Journal of Economics and Policy Vol 11 (2) (2018): 377 – 391 386
In Figure 2. presented the distribution of
batik SMEs according to the level of tech-
nical efficiency achieved by entrepreneurs
individually. The figure shows that of all
sample batik entrepreneurs studied, the
proportion of entrepreneurs whose technical
efficiency level approached the frontier (the
level of technical efficiency approached 1.0)
was 28 %, while at the interval of efficiency
rates between 0.801-0.9 % is 29 %. Entrepre-
neurs with a level of technical efficiency
between 0.701-0.8 % as many as 22 %, the
level of technical efficiency between 0.601-0.7
% as many as 14 % and the level of technical
efficiency between 0.50-0.6 %.
Price efficiency (allocation) is a situation
when the Net Profit Margin (NPM) is equal
to the production factor price which is
concerned, or the way in which entrepre-
neurs are able to maximize profits. In the
discussion of price efficiency (allocation),
this will result from three possible outcomes:
(1) if the value of the efficiency is greater
than 1, the maximum efficiency will not be
achieved. Thus, the use of factors of
production should be increased in order to
achieve an efficient condition. (2) If the value
of efficiency is smaller than 1, it will lead to
inefficient business activities of batik.
Therefore, production factors used should be
reduced. (3) If the efficiency values are equal
to 1, the business of batik has reached levels
that are run efficiently and obtain maximum
profit. In this case, the value of the marginal
product (NPM) is obtained from the
coefficient of each variable multiplied by the
average of the total revenue and divided by
the average cost of each of these variables.
Therefore, the calculation of the
analytical calculation of price efficiency
(allocation) is operational costs for activities
of batik SMEs in units of Rp. Including the
earned income, you will know the amount of
price efficiency in batik SMEs.
Table 4. Number of Average Cost and Batik
SMEs Revenue
Items Average
(Rp/Month) Coefficient
Revenue (Y) 27,736,900 -
Labor Cost (X1) 9,154,000 0,723
Material Cost (X2) 5,534,780 0,223
Fix Cost (X3) 1,806,200 0,135
Return to scale 1,081
Source: Survey on batik SMEs 2017(processed)
The calculation of the price efficiency will be
as follows :
NPM Labor Cost
000,154,9
)900,736,27(*)723,0(=NPM
= 2,191
The result of the calculation of the price
efficiency for the use of production factors of
Labor Cost is 2.191. The results of these
calculations indicate that the use of
production factors in the price of capital is
not efficient, because the results of the
calculations show numbers greater than 1.
Therefore, we need additional capital inputs
in order to achieve efficiency.
NPM fixed material cost
780,534,5
)900,736,27(*)135,0(=NPM
= 1,118
The results of the calculation of the
efficiency of the use of production factors
prices for raw materials is 1,118. These results
indicate that the use of input raw material
remains cost inefficient because the
calculation results showed that the efficiency
of the price is greater than 1. Thus, it is
necessary to increase the input of raw

387 Kurniati and Prajanti, Batik SMEs Efficiency and Entrepreneurship Role in Innovation
materials in order to achieve the level of
efficiency.
NPM Fixed cost
200,806,1
)900,736,27(*)723,0(=NPM
= 2,073
The result of the calculation of the price
efficiency for the use of fixed cost factor is
2.073. This number indicates that the use of
fixed costs of production factors has not been
efficient in price because the price of
efficiency calculation results show that
numbers are greater than 1. Therefore, it is
necessary to input additional fixed costs in
order to achieve the level of efficiency.
After calculating the NPM every
production factors, the total of price
efficiency (PE) is as follows:
3
321 NPMNPMNPMPE
++=
PE = 1,794
The number of price efficiency (allocation)
on batik SMEs is 1,794 or > 1, the batik SMEs
is efficient in the price.
Return to scale is a situation where
output increases as a response to the
proportional increase of all inputs. It is well
known in the Cobb-Douglas function that
the coefficient of each independent variable
on the dependent variable is the elasticity.
Based on Table 4, it shows return to scale of
SMEs batik through the summation of each
independent variable.
Return to scale = β1 + β2 + β3
= 0,723 + 0,223 + 0,135
= 1,081
The value of return to scale on batik
SMEs is 1,081. Returns to scale is obtained
from the addition of elasticity coefficients for
each independent variable in the study. This
suggests that the batik SMEs are at
Increasing returns to scale (IRS). It means
that the proportion of additional factors of
production will result a greater proportion of
additional production.
Entrepreneur Role
In the revenue efficiency function (Table
5), the test results obtained value of determi-
nation coefficient (R2) obtained, is 0.161 or
16.1%, it reflects that the exogenous variables
of product innovation (D1), business alliance
(D2) and marketing innovation D3) able to
explain variation of change that is increase or
decrease in endogen variable (revenue
efficiency) equal to 16,1%, while the rest that
is, equal to 83,9% influenced by other
variables not involved in this research model.
Simultaneous simulation test with goodness
of fit (F-test), obtained F count (F-test) equal
to 6,127 (p-value = 0,001) show fit model with
data.
Table 5. Determinant Regression Result of
Entrepreneur Role on Efficiency
Economic Efficiency (EE)
β ρ
(Constant) -0,119 0,001
D1 0,117 0,028
D2 0,096 0,017
D3 0,090 0,022
R2 0,161
F hitung (p-) 6,127 (0,001)
Source: Survey on batik SMEs 2017(processed)
The influence of product innovation (D1)
on the Batik SMEs revenue efficiency (E) has
the value of t count 2,236 (p-value = 0,028
<5%), so it is concluded that product
innovation variable (D1) have positive
influence to revenue efficiency to rise above
the industry average. A positive t-test
indicates a directional relationship means

JEJAK Journal of Economics and Policy Vol 11 (2) (2018): 377 – 391 388
that increasing product innovation (D1) will
increase the value of revenue efficiency (E)
above the industry average and the decline of
product innovation (D1) has an effect on
decreasing the value of revenue efficiency (E)
below industry average. The value of regres-
sion coefficient of variable of entrepreneur-
ship role in product innovation (D1) is 0,117,
meaning that entrepreneur active in product
innovation has 11,7% revenue efficiency
higher than industry average.
The influence of business alliance (D2)
on the Batik SMEs revenue efficiency (E) has
t value 2,435 (p-value = 0,017 <5%), thus
concluded that business alliance variables
(D2) has a positive influence on the revenue
efficiency (E) to increase above the industry
average. A positive t-test indicates a
directional relationship means that an
increasing business alliance (D2) will
increase the revenue efficiency (E) above the
industry average and business alliance
decrease (D2) has an effect on decreasing the
value of batik sales deviation (E) below
industry average. The value of the regression
coefficient variable of an entrepreneurial role
in business alliance (D1) is 0,096, meaning
that the active entrepreneur in product
innovation has 9.6% higher revenue efficien-
cy than the industry average.
The influence of marketing innovation
(D3) on the Batik SMEs revenue efficiency
(E) has t value 2,336 (p-value = 0,022 <5%),
(D3) has a positive influence on the revenue
efficiency (E) to increase above the industry
average. A positive t-test indicates a direc-
tional relationship means that increasing
marketing innovation (D3) will increase the
revenue efficiency (E) above the industry
average and the decrease of marketing
innovation (D3) has an effect on decreasing
revenue efficiency (E) under industry
average. Variable of entrepreneur role in
marketing innovation (D3) has regression
coefficient = 0,090 means that entrepreneur
active in marketing have 9% higher revenue
efficiency than industry average.
The results of the study found that the
role of entrepreneur in product innovation
such as through design development,
cooperation with designer and quality
management have a positive influence on the
efficiency of batik business. Increasing the
role of entrepreneurs in product innovation
will increase the value of batik sales and vice
versa decrease the role of entrepreneurs in
product innovation has an influence on the
decline in the value of batik sales. Similarly,
the role of entrepreneurs in business
alliances such as through partnerships with
large industries or through cooperatives and
marketing innovations such as through
participation in trade shows and marketing
through the internet have a positive
influence on the value of batik sales.
Increasing the role of entrepreneurs in
business alliances and marketing innovations
will increase the value of batik sales and vice
versa the decline of entrepreneurial role in
business and marketing alliances has an
influence on the decline in the value of batik
sales.
These results indicate that in the long
term, batik SMEs can not only rely on the
ability of production that burns on tradition
as a source of uniqueness to compete in
local, domestic and global markets, but SMEs
batik must also have a dynamic and
competitive design, understand environ-
mental issues such as eco-design and eco-
labeling, understand export procedures, have
economies of scale efficiency in addition to
technical and other management such as
entrepreneurship, managerial, accounting

389 Kurniati and Prajanti, Batik SMEs Efficiency and Entrepreneurship Role in Innovation
and marketing (Hamdania and Wirawan,
2012; Irjayantia dan Azis, 2012). The capacity
of SMEs can not only be achieved through
training and mentoring programs that have
been done by the government, state-owned
enterprises/enterprises and private compa-
nies, but should be more integrated in the
wider business network. Cooperation of batik
SMEs in business groups, cooperatives (in
clusters) need to be improved to facilitate
access to information, finance and infrastruc-
ture provision (Acs et al. 2008).
The result of this research is still
consistent with some previous research as
done by Harvie (2004) who found out the
innovation problem at SMEs that is because
economical scale efficiency, has relatively
high cost in accessing and utilizing
information technology, lack of skill in
technology utilization, market, have high
transaction costs arising in accessing infra-
structure, limitations in achieving quality
standards, lack of skills and knowledge in
handling customers in both domestic and
export markets.
As a micro and small business, Batik
SMEs in general does not have a special
division that is tasked to conduct market
research to monitor and analyze the factors
that affect consumer needs and preferences.
In general, SMEs Batik understand their
customers in the long term, customer needs
are observed and assessed through the
development of products and services
consistently. Small-scale businesses have
basically understood their customers only for
their limited market coverage. Small
companies follow some form of customer
philosophy themselves and are informal in
contrast to large-scale companies.
Regression test results can also be
obtained the result that the role of
entrepreneurs have a positive and significant
impact on production efficiency and income.
In this case, small industries that are more
intensive in activities in product innovation,
business alliances and marketing innovations
have a tendency to have production
efficiency and income above the industry
average. This is consistent with previous
research (Karabulut, 2015; Ganzera et al.,
2017; Ismail et al., 2014; Charoenrat et al.,
2013; de Jorge, dan Suárez, 2011). who found
an association of the role of entrepreneurial
behavior toward performance. Innovation
behavior and entrepreneurial business
alliances help companies to increase their
resources and market differentials, these
strategies are needed to deliver superior
performance against competitors.
The results also find the role of
entrepreneurs in business alliance affect the
efficiency of production and income of batik
SMEs. Small business scale, business
management by managers and business
owners who on average has low education
will be difficult to compete. Other models
can be developed that SMEs in business
groups can work together to employ an
internal agent (consisting of staff, such as
marketing, product development, quality
control) or external agents on a periodical
contract basis (such as in waste management
agencies, designers in product development
and marketing) that make SMEs in the
business group have a higher competitive
position in the long run.
CONCLUSION
The role of entrepreneurs in product
innovation, marketing innovation and
business alliances has a positive influence on
the Batik SMEs revenue efficiency. The role
of entrepreneurs in marketing innovation

JEJAK Journal of Economics and Policy Vol 11 (2) (2018): 377 – 391 390
has the highest elasticity to the production
and sales of batik SMEs followed by the role
of entrepreneur in business alliance and
product innovation. The role of
entrepreneurs is important especially in price
and economic efficiency.
The implication of this research is that
batik SMEs to compete in local, domestic
and global market can not only rely on the
production capability that burns traditionally
as a source of local uniqueness, capital
subsidy, access market aid, and short term
training, but in long term must have econo-
mies of scale efficiency, have competent
resource quality in their field, independent
and have strong brand in local and global
market. On the other hand, economies of
scale make SMEs inefficient for technology
adoption, infrastructure access, brand build-
ing, professional pay (such as managers,
accountants, designers, research and devel-
opment), making it a long-term competitive
obstacle. SMEs must overcome the
constraints of economic-scale efficiency with
cooperatives / business groups in both
clusters and business networks, build vertical
alliances in related business groups, or hire
agents either through resource acquisition
and contract-based. The development of
SMEs CENTER is a show room of batik SMEs
products to enhance the role of batik
entrepreneurs in market access, product
design innovation, quality, environmental
impact and capital assistance. Local govern-
ments can provide incentives and coaching
systems to spur the development of new
business actors for market access, technology
and business incubator development, and
support for partnership development among
small businesses.
REFERENCES
Acs, Z.J., Desai, S., Hessels, J., 2008, Entrepreneurship, economic development and institutions, Small Business Economic 31, 219–234
Aigner, D.J. et al. 1977. Formulation and Estimation of Stochastic Frontier Production Function Model. Journal of Econometrics, 6:21-37
Ahn, J. M., Minshall, T. & Mortara, L. 2015. Open innovation: a new classification and its impact on firm performance in innovative SMEs. Journal of Innovation Management, 3, 33-54.
Audretsch dan Keilbach. 2007. Entrepreneruship Capital-Determinant and Impact on Regional Impact Performance. Journal MPI Jena ISNN 1813-8333
Charoenrat, T. and Harvie, C., 2013, Technical Effi-ciency of Thai Manufacturing SMEs: A Stochastic Frontier Analysis, Australasian Accounting, Business and Finance Journal 7(1), 99-121
Chen, C. M., Delmas, M. A., & Lieberman, M. B. (2015). Production frontier methodologies and efficiency as a performance measure in strategic manage-ment research. Strategic Management Journal 36(1), 19-36.
Coelli, T.J., D.S.P. Rao, C.J. O’Donnell, and G.E. Battese. 2005. An introduction to efficiency and produc-tivity analysis. 349 p. 2nd ed. Springer, New York, USA.
Ministry of Industry and Trade. 2013. Guidelines for Small Industry Development Policy, Jakarta.
de Jorge, J., Suárez, C., 2011, Influence of R&D subsidies on efficiency: the case of Spanish manufacturing firms, Cuadernos de Economíay Dirección dela Empresa 14, 185–193
Ganzera,P.P., Chais, C., Oleac, P.M., 2017, Product, process, marketing and organizational innovation in industries ofthe flat knitting sector, RAI Revista de Administração e Inovação 14, 321–332
Hidayat, Y.A., 2012, Production Efficiency of Batik Cap Fabric, Journal of Development Economics 13(1), 79-95
Hamdania, J., Wirawan, C., 2012, Open Innovation Implementation to Sustain Indonesian SMEs, Procedia Economics and Finance 4, 223 – 233
Hermawan. 2011. Impact Analysis of Macroeconomic Policies on the Development of Indonesian Textile and Textile Products Industry. Bulletin of Monetary and Banking Economics, April : 374-408
Irjayantia, M., Azis, A.M, 2012, Barrier Factors and Potential Solutions for Indonesian SMEs, Procedia Economics and Finance 4, 3 – 12
Ismail, R., Noor, Z.M., Abidin, S.Z., 2014. Determinant of Technical Efficiency of Small and Medium Enterprises in Malaysian Manufacturing Firms. PROSIDING PERKEM ke-9 (2014) 665 – 675
391 Kurniati and Prajanti, Batik SMEs Efficiency and Entrepreneurship Role in Innovation
Karabulut, A.T., 2015, Effects of Innovation Type on Performance of Manufacturing Firm in Turkey, Procedia - Social and Behavioral Sciences 195, 1355 – 1364
Kirzner, I.. 1973. Competition and Entrepreneurship. Chicago: University of Chicago Press.
Lieberman, M. B., & Dhawan, R. (2005). Assessing the resource base of Japanese and US auto producers: A stochastic frontier production function approach. Management Science, 51(7), 1060-1075.
Mankiw, G., 2008. Principles of Economics. 3th edition. McGraw-Hill
OECD (Organization for Economic Co-operation and Development), 2014, Oslo Manual: The Measure-ment of Scientific and Technological Activities: Proposed Guidelines for Collecting and Interpreting Technological Innovation Data. http://www.oecd.org/science/inno/2367580.pdf
Salimia, N., Rezaei, J., 2018, Evaluating firms’ R & D performance using best worst method, Evaluation and Program Planning 66, 147–155
Schumpeter. 1934. Theory of Economic development, Cambridge, harvard University Press.
Suharno, Susilowati, I., & Firmansyah. 2017. Manage-ment of the traditional milkfish culture in indonesia: An approach using technical efficiency of the stochastic frontier production. AACL Bioflux, 10(3), 578–586.
Susanty A., Hartini, S., Puspitasari, D., Arsiwi, P., 2015, Measuring Efficiency of Using Resource in the Production Process of Making Stamped-Batik: A DEA Approach, Mediterranean Journal of Social Sciences 6(2), 318-327
Zheng, Jianghuai and Hu, Zhining and Wang, Jialing. 2008. Entrepreneurship, Innovation and Economic Growth: The Case of Yangtze River Delta in China. MPRA paper 8919. http://mpra.ub.uni-muenchen.de/8919/
Zsuzsannaa,S.K., Hermana, E., 2012, Innovative Entrepreneurship for Economic Development in EU, Procedia Economics and Finance 3, 268 – 275