Embed Size (px)
Citation preview

DESCRIPTIVE DATA MINING FOR
PARKINSON’S
DISEASE DATA ANALYSIS
Anita Valmarska

Doctoral DissertationJožef Stefan International Postgraduate SchoolLjubljana, Slovenia
Supervisor: Prof. Dr. Marko Robnik-Šikonja, Faculty of Computer and InformationScience, University of Ljubljana, SloveniaCo-Supervisor: Prof. Dr. Nada Lavrač, Jožef Stefan Institute, Ljubljana, Slovenia
Evaluation Board:Prof. Dr. Marko Bohanec, Chair, Jožef Stefan Institute, Ljubljana, SloveniaProf. Dr. Zoran Bosnić, Member, Faculty of Computer and Information Science, Universityof Ljubljana, SloveniaProf. Dr. Tomislav Šmuc, Member, Ruđer Bošković Institute, Zagreb, Croatia

Anita Valmarska
DESCRIPTIVE DATA MINING FOR PARKINSON’S
DISEASE DATA ANALYSIS
Doctoral Dissertation
OPISNO PODATKOVNO RUDARJENJE ZA ANALIZO
PODATKOV O PARKINSONOVI BOLEZNI
Doktorska disertacija
Supervisor: Prof. Dr. Marko Robnik-Šikonja
Co-Supervisor: Prof. Dr. Nada Lavrač
Ljubljana, Slovenia, April 2018


Посветено на моите родители.


vii
Acknowledgments
My gratitude goes to my supervisor Marko Robnik-Šikonja and co-supervisor Nada Lavračfor all their knowledge, patience, research ideas, support, and energy. I want to thank myco-supervisor Nada Lavrač for giving me the opportunity to start my academic path in theDepartment of Knowledge Technologies and for supporting my research ideas. Additionally,I would like to thank the members of the evaluation board: Marko Bohanec, Zoran Bosnić,and Tomislav Šmuc for the careful reading and constructive feedback.
This research would not have been possible without the financial support of the Slove-nian Research Agency. I wish to thank the Department of Knowledge Technologies atthe Jožef Stefan Institute, the Jožef Stefan International Postgraduate School, and theEuropean Commision for funding the research projects HBP and PD_manager, and forsupporting my research within.
I am grateful to all the people I worked with during this period. I want to thankJohannes Fürnkranz for his comments on our new algorithms for subgroup discovery andclassification rule learning and Julius Stecher for the interesting discussions on invertedheuristics. My gratitude goes to Dragana Miljković and my colleagues in the PD_managerresearch project for interesting discussions that sprung the methodologies for analysis ofParkinson’s disease progression. I also wish to thank Dimitris Gatsios and Spiros Konit-siotis for their contributions in evaluating the generated models for Parkinson’s diseasedata analysis. My thanks also go to my work colleagues at the Department of KnowledgeTechnologies for providing an encouraging and friendly working environment.
Finally, I want to thank my family for the emotional support and encouragementthrough the years of my education. I want to thank my mother Jovanka for always beingmy role model and my father Živko for supporting my dreams. I wish to thank my brotherDimče, for being my friend and my ally. Last but not least, I want to thank my dearestDarko for his love, support, understanding, being my rock, and keeping me sane whenthings seemed to be spinning out of control.


ix
Abstract
Parkinson’s disease is the second most common neurodegenerative disorder that affectspeople worldwide. Its symptoms affect different aspects of patients’ lives that influencethe quality of life and that of their families. Given the wide variability of symptomsamong different patients and also for the same patient at different times, it is difficultfor the clinicians to manage the Parkinson’s disease. Using data mining for analyzing ofParkinson’s disease data can lead to the identification of similar patients, with the aim toassist the clinicians to respond more promptly and in a more personalized fashion to thechanges of the patients’ status.
The management of Parkinson’s disease to improve the patients’ quality of life is notwidely researched. In this thesis, we address the question of data mining support for theanalysis of Parkinson’s disease progression and management with antiparkinson medica-tions. The thesis is divided into three parts addressing improved descriptive modeling,grouping of patients based on similar disease progression, and analysis of the most impor-tant symptoms and medication changes.
High-quality descriptive models are highly appreciated by the clinicians. Classificationrules and rules describing interesting subgroups are important components of descriptivedata mining. Rule learning algorithms typically proceed in two phases: rule refinement se-lects the conditions for specializing the rule and rule selection selects the final rule amongseveral rule candidates. While most conventional algorithms use the same heuristic forguiding both phases, recent research indicates that using two separate heuristics is concep-tually better justified, improves the coverage of positive examples, and may result in betterpredictive accuracy. The thesis presents and evaluates two new beam search rule learningalgorithms: DoubleBeam-SD for subgroup discovery and DoubleBeam-RL for classificationrule learning. The algorithms use two separate beams and can combine various heuristicsfor rule refinement and rule selection, which widens the search space and allows for findingrules with improved quality. In the classification rule learning setting, the experimental re-sults confirm previously shown benefits of using two separate heuristics for rule refinementand rule selection. In subgroup discovery, DoubleBeam-SD algorithm variants outperformseveral related state-of-the-art algorithms. We use the newly introduced algorithms inParkinson’s disease data analysis.
Careful management of the patient’s status is crucial to ensure the patient’s indepen-dence and quality of life. This is achieved by personalized treatment based on individual pa-tient’s symptoms and medical history. We address the issue of determining patient groupswith similar disease progression patterns coupled with patterns of medication changes thatlead to the improvement or decline of the patients’ quality of life symptoms. To this end,we propose a new methodology for clustering short time series of patients’ symptoms andprescribed medications. The methodology also employs time sequence data analysis us-ing skip-grams to monitor disease progression. The results demonstrate that the motorand autonomic symptoms are the most informative for evaluating the quality of life ofParkinson’s disease patients. We show that Parkinson’s disease patients can be divided

x
into clusters ordered in accordance to the severity of their symptoms. By following the evo-lution of symptoms for each patient separately, we were able to determine the patterns ofmedication changes that lead to the improvements or degradations of the patients’ qualityof life.
Based on discovered groups of similar patients, we present a step towards personalizedmanagement of Parkinson’s disease patients. We present two novel approaches. The firstalgorithm analyzes the symptoms’ impact on the Parkinson’s disease progression. Exper-iments on the Parkinson Progression Markers Initiative (PPMI) data reveal a subset ofsymptoms influencing the disease progression which are already established in Parkinson’sdisease literature, as well as symptoms that have been considered only recently as possi-ble indicators of disease progression. The second novelty is a methodology for detectingpatterns of medications dosage changes based on the patient’s status. The methodologycombines multitask learning using predictive clustering trees (PCTs) and short time seriesanalysis to better understand when a change in medications is required. The experimentson PPMI data demonstrate that using the proposed methodology, we can identify someclinically confirmed patients’ symptoms suggesting medications change. In terms of pre-dictive performance, the PCT approach is comparable to the random forest model but isadvantageous due to the model interpretability.

xi
Povzetek
Parkinsonova bolezen je druga najpogostejša nevrodegenerativna motnja na svetu. Simp-tomi vplivajo na različne vidike življenja pacientov, kar vpliva tudi na njihovo kakovost inna kakovost življenja njihovih družin. Med simptomi, ki jih čutijo bolniki s Parkinsonovoboleznijo, obstajajo velike razlike, kar velja celo za simptome istega bolnika v različnihobdobjih. Uporaba podatkovnega rudarjenja za analizo podatkov o Parkinsonovi boleznilahko prispeva k identifikaciji podobnih bolnikov in uspešnejši terapiji in na ta način k boljindividualnemu zdravljenju, kar bo lahko pomagalo zdravnikom, da se bodo odzivali nastanje bolnikov z bolj personaliziranimi terapijami.
Zdravljenje Parkinsonove bolezni z namenom izboljšanja kakovosti življenja bolnikovni dobro raziskana tema. V disertaciji se ukvarjamo z rudarjenjem podatkov za podporopri analizi in nadzoru Parkinsonove bolezni z antiparkinsonskimi zdravili. Disertacija jerazdeljena na tri dele, ki obravnavajo izboljšave opisnih modelov, združevanje bolnikov napodlagi podobnega poteka bolezni ter analizo najpomembnejših simptomov in spremembzdravil.
Zdravniki cenijo kakovostne opisne modele, ki lahko razkrijejo zanimive in nepriča-kovane vzorce v podatkih. Pomembne komponente opisnega podatkovnega rudarjenja sopravila za razvrščanje in pravila za opisovanje zanimivih podskupin. Učenje pravil običajnopoteka v dveh fazah: faza dopolnjevanja izbere pogoje za specializacijo pravila, faza izborapravil pa med kandidati izbere končno pravilo. Medtem ko večina algoritmov uporabljaisto hevristiko v obeh fazah, nedavne raziskave kažejo, da je uporaba dveh ločenih hevri-stik konceptualno boljša, saj izboljša pokritost pozitivnih primerov in lahko privede dovečje napovedne točnosti. V nalogi predstavimo in ovrednotimo dva nova učna algoritma:DoubleBeam-SD za odkrivanje podskupin in DoubleBeam-RL za učenje klasifikacijskihpravil. Algoritma uporabljata dva ločena preiskovalna snopa in lahko uporabita različnehevristike za dopolnjevanje in izbiro pravil, s čimer se razširi iskalni prostor in omogočiiskanje kakovostnejših pravil. Eksperimentalni rezultati potrjujejo prednosti uporabe dvehločenih hevristik pri izgradnji klasifikacijskih pravil. Pri odkrivanju podskupin je nekajrazličic algoritma DoubleBeam-SD učinkovitejših od najuspešnejših sorodnih algoritmov.Razvite algoritme uporabimo tudi pri analizi podatkov o Parkinsonovi bolezni.
Pri zdravljenju Parkinsonove bolezni je nadzor bolnikovega stanja ključnega pomenaza neodvisnost in kakovost bolnikovega življenja. To dosežemo z bolniku prilagojenimzdravljenjem, ki temelji na bolnikovih simptomih in anamnezi. V delu obravnavamo vpra-šanje določanja skupin bolnikov s podobnimi vzorci poteka bolezni ter podobnimi vzorcispremembe zdravil, ki vodijo k izboljšanju ali poslabšanju pokazateljev kakovosti življenjabolnikov. V ta namen predlagamo novo metodologijo za analizo kratkih časovnih vrstbolnikovih simptomov in podatkov o predpisanih zdravilih. Metodologija za analizo časov-nih vrst uporablja preskočne n-grame za spremljanje poteka bolezni. Rezultati kažejo, daso motorični in avtonomni simptomi najinformativnejši za ocenjevanje kakovosti življenjabolnikov s Parkinsonovo boleznijo. V delu pokažemo, da lahko bolnike razdelimo v skupineglede na resnost simptomov. S spremljanjem razvoja simptomov za vsakega posameznega

xii
bolnika določimo vzorce sprememb zdravil, ki lahko privedejo do izboljšav ali poslabšanjakakovosti njihovega življenja.
Na podlagi določanja skupin podobnih bolnikov poskušamo izboljšati personaliziranozdravljenje bolnikov s Parkinsonovo boleznijo. Predstavljamo dva nova pristopa. Prvialgoritem analizira vpliv simptomov na potek Parkinsonove bolezni. Poskusi na podat-kih PPMI (Parkinson Progression Markers Initiative) razkrivajo podmnožico simptomov,ki vplivajo na potek bolezni in so že obravnavani v literaturi o Parkinsonovi bolezni, patudi simptome, ki so jih začeli zdravniki šele nedavno obravnavati kot možne pokazateljepoteka bolezni. Druga novost je metodologija za odkrivanje vzorcev pri odmerjanju zdra-vil, ki temelji na bolnikovem stanju. Metodologija združuje večopravilno učenje drevesza napovedno razvrščanje (PCT) in analizo kratkih časovnih vrst za ugotavljanje, kdaj jepotrebna sprememba zdravil. Eksperimenti na podatkih PPMI kažejo, da lahko z upo-rabo predlagane metodologije ugotovimo, da se zaradi sprememb zdravil pojavijo nekateriklinično potrjeni simptomi. V smislu napovedne točnosti se izkaže, da je večopravilnipristop z uporabo PCT metode primerljiv z naključnim gozdom, njegova prednost pa jeinterpretabilnost.

xiii
Contents
List of Figures xv
List of Tables xvii
Abbreviations xix
1 Introduction 11.1 Background and Motivation . . . . . . . . . . . . . . . . . . . . . . . . . . . 1
1.1.1 Classification Rule Learning and Subgroup Discovery . . . . . . . . . 21.1.2 Discovering Parkinson’s Disease Progression Patterns . . . . . . . . . 31.1.3 Tracking Medication Changes . . . . . . . . . . . . . . . . . . . . . . 4
1.2 Purpose of the Thesis . . . . . . . . . . . . . . . . . . . . . . . . . . . . . . 41.3 Goals and Hypotheses of the Thesis . . . . . . . . . . . . . . . . . . . . . . . 61.4 Scientific Contributions . . . . . . . . . . . . . . . . . . . . . . . . . . . . . 61.5 Structure of the Thesis . . . . . . . . . . . . . . . . . . . . . . . . . . . . . . 8
2 Related Work 92.1 Classification Rule Learning . . . . . . . . . . . . . . . . . . . . . . . . . . . 92.2 Subgroup Discovery . . . . . . . . . . . . . . . . . . . . . . . . . . . . . . . 122.3 Multi-View Clustering . . . . . . . . . . . . . . . . . . . . . . . . . . . . . . 132.4 Analysis of Short Time Series . . . . . . . . . . . . . . . . . . . . . . . . . . 142.5 Skip-grams for Sequence Data Analysis . . . . . . . . . . . . . . . . . . . . . 152.6 Multitask Learning . . . . . . . . . . . . . . . . . . . . . . . . . . . . . . . . 162.7 Feature Evaluation . . . . . . . . . . . . . . . . . . . . . . . . . . . . . . . . 172.8 Parkinson’s Disease Related Data Mining Research . . . . . . . . . . . . . . 18
3 Parkinson’s Disease Data 213.1 Symptoms Data . . . . . . . . . . . . . . . . . . . . . . . . . . . . . . . . . . 213.2 Medications Data . . . . . . . . . . . . . . . . . . . . . . . . . . . . . . . . . 24
4 Descriptive Rule Learning 274.1 Problem Description . . . . . . . . . . . . . . . . . . . . . . . . . . . . . . . 274.2 Related Publication . . . . . . . . . . . . . . . . . . . . . . . . . . . . . . . 29
5 Detection of Parkinson’s Disease Progression Patterns 475.1 Problem Description . . . . . . . . . . . . . . . . . . . . . . . . . . . . . . . 475.2 Related Publication . . . . . . . . . . . . . . . . . . . . . . . . . . . . . . . 48
6 Detection of Medications Change Patterns 896.1 Problem Description . . . . . . . . . . . . . . . . . . . . . . . . . . . . . . . 896.2 Related Publication . . . . . . . . . . . . . . . . . . . . . . . . . . . . . . . 90

xiv Contents
7 Conclusions 1257.1 Summary of Contributions . . . . . . . . . . . . . . . . . . . . . . . . . . . . 1257.2 Summary of Hypotheses Confirmations . . . . . . . . . . . . . . . . . . . . . 1267.3 Strenghts and Limitations of the Developed Approaches . . . . . . . . . . . 127
7.3.1 Strenghts . . . . . . . . . . . . . . . . . . . . . . . . . . . . . . . . . 1277.3.2 Limitations . . . . . . . . . . . . . . . . . . . . . . . . . . . . . . . . 128
7.4 Further Work . . . . . . . . . . . . . . . . . . . . . . . . . . . . . . . . . . . 128
Appendix A 131A.1 Appendix to Chapter 5 . . . . . . . . . . . . . . . . . . . . . . . . . . . . . . 131A.2 Appendix to Chapter 6 . . . . . . . . . . . . . . . . . . . . . . . . . . . . . . 131
References 133
Bibliography 141
Biography 143

xv
List of Figures
Figure 3.1: Example of Parkinson’s disease patient therapy modifications betweenvisits 1 and 4. The blue line presents the linear timeline, while pointsV1, V2, V3, and V4 present four consecutive visits to the clinician whenthe MDS-UPDRS questionnaire is administered. The red lines presentthe duration of intake for each antiparkinson medication, while the linewidth presents the dosage of the medication. . . . . . . . . . . . . . . . 26


xvii
List of Tables
Table 2.1: Comparison of the DoubleBeam-RL algorithm to the state-of-the-artclassification rule learners CN2, Ripper and SC-ILL. . . . . . . . . . . . 11
Table 2.2: Some properties of subgroup discovery algorithms DoubleBeam-SD, APRIORI-SD, SD, and CN2-SD. . . . . . . . . . . . . . . . . . . . . . . . . . . . . 13
Table 3.1: Short overview of the patients whose data are used in the experimentalwork. . . . . . . . . . . . . . . . . . . . . . . . . . . . . . . . . . . . . . . 22
Table 3.2: Characteristics of the questionnaire data used in the analysis. . . . . . . 23


xix
Abbreviations
RL . . . Rule LearningSD . . . Subgroup DiscoveryAUC . . . Area Under CurveWRACC . . . Weighted Relative ACCuracyPD . . . Parkinson’s DiseasePPMI . . . Parkinson’s Progression Markers InitiativeLEDD . . . Levodopa Equivalent Daily DosageMAO-B . . . MonoAmine Oxidase BPCT . . . Predictive Clustering TreeNLP . . . Natural Language ProcessingMTL . . . Multi Task LearningMDS . . . Movement Disorder SocietyUPDRS . . . Unified Parkinson’s Disease Rating ScaleMoCA . . . Montreal Cognitive AssessmentSCOPA-AUT . . . SCales for Outcomes in PArkinson’s disease–AUTonomicQUIP . . . QUestionnaire for Impulsive-compulsive disorders in Parkinson’s diseasePASE . . . Physical Activity Scale for the Elderly

1
Chapter 1
Introduction
This thesis contributes to the development of descriptive data mining approaches forParkinson’s disease data analysis. The main contributions include improving classificationrule learning algorithms and subgroup discovery algorithms, methods for analyzing diseaseprogression based on clustering of patients and skip-grams, and methods for analyzingchanges in the dosage of medications using multitask learning. In this introductory chap-ter, we motivate the problems addressed and overview solutions to the presented problems.This is followed by the purposes of the dissertation, its goals, and scientific contributions.We conclude with a structural overview of the rest of the thesis.
1.1 Background and Motivation
Parkinson’s disease is a neurodegenerative disorder affecting people worldwide. It is a disor-der of the central nervous system, mostly affecting the patients’ motor functions. Accordingto Bega (2017), the motor symptoms most associated with the idiopathic Parkinson’s dis-ease are bradykinesia, rigidity, resting tremor, and postural instability. In addition to themotor symptoms, patients experience several emotional and behavioral problems, includ-ing depression, anxiety, impulsivity, and sleeping problems. Both motor and non-motorsymptoms affect the patients’ ability to live independently, consequently decreasing theirquality of life and affecting also the lives of their families.
At the moment, there is no cure for Parkinson’s disease. The disease treatment is di-rected towards managing the symptoms of the patients and prolonging their independence.The management of symptoms is done mostly by prescribing antiparkinson medications.A careful medication therapy is of crucial importance as the clinicians must prudentlybalance between controlling the symptoms and reducing the side effects of antiparkinsonmedications prolonged usage.
Parkinson’s disease poses a high economic cost on countries. This cost can be dividedinto a direct cost caused by the decreased independence of the patients and indirect costinduced by the dedication of patients’ families to care for their wellbeing. As of 2012, theestimated annual cost of Parkinson’s disease on the economies of European Union countriesis estimated at 13.9 billion EUR: a cost that will increase as the population ages (Olesen,Gustavsson, Svensson, Wittchen, & Jönsson, 2012). Efforts are made by the EuropeanUnion to address this issue. A quick and efficient response to the patient’s status is neededin order to control the disease, treat its symptoms, and consequently lower the burden onthe economies of countries.
The introduction of data mining techniques can lead to a faster discovery of groupsof patients with similar symptoms, therapies, and patterns of disease progression. It canreveal the common characteristics of patient groups and identify how symptoms should

2 Chapter 1. Introduction
be treated with medications. Parkinson’s disease clinicians only have access to the dataof their patients. Data mining can take advantage of databases of numerous Parkinson’sdisease patients from around the world to find relevant patterns in the data.
Most of machine learning and data mining research in the field of Parkinson’s diseaseis concerned with the prediction of Parkinson’s disease diagnosis (Gil & Johnson, 2009;Ramani & Sivagami, 2011), detection of patients’ symptoms from wearable sensors (Patelet al., 2009), or determining subtypes of Parkinson’s disease patients (Lewis et al., 2005;Ma, Chan, Gu, Li, & Feng, 2015; Reijnders, Ehrt, Lousberg, Aarsland, & Leentjens, 2009).Currently, there are no methods to follow Parkinson’s disease progression or analysis ofpatients’ medications therapy.
The usage of data mining for the analysis of Parkinson’s disease patients’ symptomsand therapies is further facilitated by the increased availability of real Parkinson’s diseasepatients data. For example, such data has been available by the PD_manager: m-Healthplatform for Parkinson’s disease management (2015), an EU Horizon 2020 project, aimed atthe development of a patient-centric platform for Parkinson’s disease. Providing long-termaccess to patients’ motor and non-motor symptoms data should enable the clinicians toprescribe the best therapy for symptoms maintenance (Gatsios, Rigas, Miljkovic, Seljak,& Bohanec, 2016) and maintain a good quality of life of the patients. One of the keyelements of this project is the use of machine learning for the development of a decisionsupport system, helping the clinicians in choosing appropriate patients’ therapies (Gatsioset al., 2016).
In this research, which was a part of the PD_manager project (PD_manager: m-Healthplatform for Parkinson’s disease management, 2015), we use symptoms and medicationsdata from the Parkinson’s Progression Markers Initiative (PPMI) data collection (Mareket al., 2011). This is an extensive data collection of Parkinson’s disease patients monitoredthrough a period of five years. The PPMI data collection gives an opportunity to follow thedisease progression among different groups of PD patients and to monitor how cliniciansreact to their symptoms–the ones resulting from the disease as well as those that are sideeffects of the prescribed medications.
The relatively unexplored field of data mining for Parkinson’s disease data analysisoffers many possibilities for data mining research. Below we present our motivation fordeveloping novel methods in descriptive learning, ordering of groups of patients according totheir symptoms severity, analysis of disease progression, and medications change analysis.
1.1.1 Classification Rule Learning and Subgroup Discovery
Good descriptive methods are essential in order to identify patients and describe them withtheir common symptoms. Subgroup discovery is a technique for identifying subgroups ofsimilar patients (Gamberger & Lavrač, 2002). The task of subgroup discovery is to findinteresting subgroups in the population, i.e. subgroups that have a significantly differentclass distribution than the entire population (Klösgen, 1996; Wrobel, 1997). The result ofsubgroup discovery is a set of individual rules where the rule consequence is a target classlabel (Fürnkranz, Gamberger, & Lavrač, 2012). Rule learning is a symbolic data analysistechnique that can be used to construct understandable models or patterns describing thedata (Clark & Niblett, 1989; Fürnkranz et al., 2012; Michalski, 1969). The main differencebetween classification rule learning and subgroup discovery is that subgroup discoveryalgorithms construct individual rules describing the properties of individual groups of targetclass instances, while classification rule learning algorithms construct a set of classificationrules covering the entire problem space. The learning process in both classification rulelearning and subgroup discovery typically proceeds in two phases: rule refinement selectsconditions for specializing the rule, and rule selection selects the final rule among several

1.1. Background and Motivation 3
rule candidates.Similarly to classification rule learning algorithms, subgroup discovery algorithms use
pre-selected heuristics in their rule learning process (Fürnkranz et al., 2012). In the pro-cess of building a new rule, they do not differentiate between the selection and refinementstep. Stecher, Janssen, and Fürnkranz (2014) proposed to use separate heuristics for eachof the two rule construction phases, and suggested that in the refinement phase, the so-called inverted heuristics shall be used for evaluating the relative gain obtained by refiningthe current rule. The key idea of these heuristics is the following: while the majorityof conventional rule learning heuristics, such as the Laplace or m-estimate, anchor theirevaluation on the empty rule that covers all examples, inverted heuristics anchor the pointof view on the base (parent) rule, which is more appropriate for a top-down refinementprocess (Stecher et al., 2014). As a side effect to improved rule quality in terms of classi-fication accuracy, the rules generated by using inverted heuristics in the refinement phaseare longer and contain more terms (descriptors), thus offering an additional explanation.We extend the approach of Stecher et al. (2014) to improve classification rule learning aswell as subgroup discovery with two beams, taking both phases into account.
The division of patients into groups of similar symptoms can be done using methodsuch as clustering. In the medical literature on Parkinson’s disease, Goetz et al. (2015)suggested that sums of the severity of certain symptoms can be used to determine theoverall status of the patient. For this reason, we explore groups of patients on data,described by the sums of the considered symptoms. Since patients’ symptoms data arecollected from different sources, there is a possibility to use both multi-view (Xu, Tao, &Xu, 2013) and single view methods. Multi-view clustering can use the information frommultiple sources (views) to provide an alternative analysis of patients (He, Kan, Xie, &Chen, 2014). This approach has not yet been investigated in the context of Parkinson’sdisease.
We hypothesize that the status of patients can be learned from the descriptions ofobtained clusters. These descriptions shall enable the experts to establish an ordering or apartial ordering of clusters according to the severity of the described symptoms. The order-ing of clusters is important for distinguishing changes—improvement or degradation—ofthe patients’ overall status. The clusters’ descriptions are obtained by the abovementioneddescriptive methods.
1.1.2 Discovering Parkinson’s Disease Progression Patterns
The Parkinson’s disease patients’ symptoms and status data are recorded in the databaseand updated at regular time intervals (on each visit to the clinician). The status of patientsis changing through time, reflecting a natural progression of the disease and medicationintake. We expect that–after initial clustering of patients in terms of the severity of theirsymptoms–the patients will have changed clusters between the considered time points(between two visits to the clinician), reflecting the improvement or worsening of theiroverall (quality of life) status. By considering these cluster changes across all patientsthroughout their involvement in the study, we should be able to determine the patterns ofpatients symptoms changes.
The scarcity of recorded events (6 visits at most) prevents the use of traditional time se-ries approaches. Therefore, we address the problem of disease progression with approachesadapted from natural language processing and use sequence analysis to determine patternsof disease progression. In order to increase the robustness of our results, we model thesequences of changes between clusters using skip-grams (Guthrie, Allison, Liu, Guthrie, &Wilks, 2006) instead of n-grams that are regularly used in the analysis of data sequences.The introduction of skip-grams results in an increased number of investigated n-grams,

4 Chapter 1. Introduction
providing more stable and robust patterns of cluster changes.The use of skip-grams has been up to now limited to natural language processing tasks
and to the best of our knowledge, except our work, no other research has yet addressedthe application of skip-grams in disease progression data analysis.
1.1.3 Tracking Medication Changes
Parkinson’s disease patients are treated with combinations of antiparkinsonian medicationsto improve the patients’ quality of life and reduce the unwanted side effects. The assignedcombinations depend on the patients’ symptoms (Fox et al., 2011; Seppi et al., 2011),consisting of disease symptoms and side effects symptoms. The identification of interactionsbetween the antiparkinsonian medications selected for the given symptoms can assist theclinicians when considering changing the patients’ therapies. To the best of our knowledge,there are no available data mining approaches supporting the control of disease symptomswith the changes in the medications therapy. Zhao, Papapetrou, Asker, and Boström(2017) use the analysis of heterogeneous temporal data in electronic health records to detectadverse drug events. They use the history of patients symptoms in order to predict a singleevent (adverse drug event: yes or no), while we follow the patients’ disease developmentand predict changes in the therapies as a result of changes in the overall status.
Patients’ symptoms are collected from multiple sources. The multitask problem of si-multaneously learning the dosage change of several antiparkinsonian medications can thusbe addressed in two settings: using features from a single data set and features from mul-tiple data sets. The latter setting is a representative of multitask multi-view learning andis not addressed in this thesis. The analysis of dosage changes of antiparkinsonian medica-tions as a reaction to patients’ symptoms from multiple views can lead to the identificationof groups of symptoms that require specific therapy modifications. This is a step towardsmore personalized assistance to clinicians in handling therapies of their patients.
1.2 Purpose of the Thesis
The purpose of this dissertation is to develop methods supporting the analysis of longitudi-nal Parkinson’s disease patients data, consisting of the symptoms data and the medicationsdata. The dissertation covers three main topics: development of improved algorithms forclassification rule learning and subgroup discovery, development of a methodology for find-ing patterns of Parkinson’s disease progression, and development of a methodology fordetection of medications dosage changes.
Development of improved algorithms for classification rule learning and sub-groups discovery. The first part of the dissertation (covered in Section 4) examinesalgorithms for rule learning and subgroup discovery motivated by separating the twophases of the rule learning process, rule refinement and rule selection. Stecher et al.(2014) introduced the idea that due to the different nature of the refinement and se-lection phase of the rule learning process, it is beneficial to separate these two phasesby using heuristics that take full advantage of each phase. However, they only storea single rule with the best potential to refine and the selection phase is therefore lim-ited to a single rule. Their experimental work is focused on the separate-and-conqueralgorithm for classification rule learning. Although the results are encouraging, theirsearch strategy can miss some rules with an even better selection quality. For thatpurpose, we suggest keeping track of a subset of rules that have the best potentialfor refinement and selection, and store them separately. In this way, we expand thesearch space and possibly discover rules that are not found by other state-of-the-art

1.2. Purpose of the Thesis 5
algorithms for classification rule learning and subgroup discovery. In our evaluation,we determine the default parameters for the introduced algorithms and compare themwith other state-of-the-art algorithms.
Development of a methodology for finding patterns of Parkinson’s diseaseprogression. The current application of data mining to Parkinson’s disease data islimited to diagnosis of new patients (Gil & Johnson, 2009), detection of symptoms(Timmer, Gantert, Deuschl, & Honerkamp, 1993), detection of subtypes of Parkin-son’s disease patients (Lewis et al., 2005), and assessing the success of deep brainstimulation surgery as a last resort in the treatment of Parkinson’s disease patients(Y. Liu et al., 2014). The Parkinson’s disease progession in terms of patients’ motorand overall UPDRS (Unified Parkinson’s Disease Rating Scale) score was addressedby Eskidere, Ertaş, and Hanilçi (2012), Tsanas (2012), Tsanas, Little, McSharry,and Ramig (2010), Tsanas, Little, McSharry, and Ramig (2010). Their evaluation ofParkinson’s disease progression is done on data from non-invasive speech tests for asix months period. During this six months period all of the patients were off thereantiparkinson medications. To the best of our knowledge, no data mining researchis done on disease progression, reasons for progression, and clinicians’ reaction tosymptoms changes with modification of medications therapies of patients. This is ofcrucial importance in order to maintain a good quality of life for Parkinson’s diseasepatients. We address this issue by i) developing a method that combines clusteringof patients into groups of patients with similar symptoms, and ii) following changeswith respect to patient’s symptoms and iii) their prescribed medications therapiesas the patients change clusters through time. The division of patients into clusterscan be done using traditional clustering methods, e.g., k-means clustering, or multi-view clustering approaches that take advantage of groups of recorded symptoms. Todetermine robust patterns of disease progression, we adapt the skip-gram approachfrom natural language processing. With our approach, we preserve the sequentialnature of the cluster assignments that reflect changes in the patients’ overall status.
Development of a methodology for the detection of medications change pat-terns. Based on the patients’ assignment to clusters between consecutive visits andthe (partial) order established between the clusters, the changes in the patients’ over-all status can be characterized as positive or negative. Our methodology from theprevious point is able to detect patterns of medications dosage changes when the over-all status of the patients has improved or deteriorated. However, this approach doesnot address the underlying symptoms that affected the changes and which causedthe clinicians to change the medications dosages. For this purpose, we propose multi-task learning with predictive clustering trees (PCT) to determine when the cliniciansdecide to change the patients’ therapies and what are the changes. Based on thisknowledge extracted from the real patients’ data, we consulted the experts concern-ing the discovered scenarios which enabled us to develop of decision support models,which should enable more personalized disease management of Parkinson’s diseasepatients.
Public accessibility of the developed algorithms. Our purpose is also to make thealgorithms for classification rule learning and subgroup discovery publicly accessible.The code for the DoubleBeam-RL algorithm and the DoubleBeam-SD algorithm ispublicly available on GitHub. We are currently working on its implementation withinthe ClowdFlows platform (Kranjc, Podpečan, & Lavrač, 2012), i.e. an open-source,cloud-based platform for composition, execution, and sharing of interactive machinelearning and data mining workflows. On the other hand, the code we developed for

6 Chapter 1. Introduction
the analysis of Parkinson’s disease data is available upon request as is closely relatedto the data being analyzed. We do not have permission to share the data but userscan obtain it from PPMI.
1.3 Goals and Hypotheses of the Thesis
The goals and hypotheses of this thesis are aligned with its purposes described in theprevious section. We believe that by separating the two phases of the rule learning pro-cess, the classification rule learning algorithms and the subgroup discovery algorithms willgenerate rules with the improved quality compared to the rules produced by their state-of-the-art counterparts. The introduction of two beams and separate heuristics for each of thephases in the rule learning process will widen the search space and enable the algorithmsto construct rules which would be missed by the standard rule learning algorithms.
We hypothesize that Parkinson’s disease patients can be divided into groups of patientswith similar symptoms. These groups of patients can be partially ordered1 according to theseverity of the symptoms describing each of the clusters. The patients’ status will changethrough time, thus prompting the patients to be assigned to different groups. Given thefact that the clusters are at least partially ordered in terms of the symptoms severity, thetransition between two clusters can also indicate a transition in the overall status of thepatient, signaling an improvement or deterioration of the patients’ status. Following thechanges of clusters for all patients using skip-grams, our methods will reveal robust patternsof disease progression, while further analysis of these patterns will reveal characteristics ofthe patients following certain patterns of disease progression.
Analysis of medications dosage changes aligned with the changes of patients’ statuscan reveal patterns that led to the improvement or degradation of the overall status ofpatients. We hypothesize that using multitask approach, we will be able to determine thesymptoms that trigger the changes in medication dosages.
1.4 Scientific Contributions
The scientific contributions of the thesis are as follows.
Contribution 1 We developed improved algorithms for classification rule learning andsubgroup discovery by separating the two phases of the rule learning process, rule refine-ment and rule selection. We used two separate beams for the refinement and selectionphase and used different heuristics in each of the phases. We evaluated and comparedthe newly developed algorithms to their state-of-the-art counterparts. We made the codepublicly available on GitHub2.
Publications related to this contribution
Journal Paper
Valmarska, A., Lavrač, N., Fürnkranz, J., & Robnik-Šikonja, M. (2017). Refinement andselection heuristics in subgroup discovery and classification rule learning. Expert Sys-tems with Applications, 81, 147–162. doi:10.1016/j.eswa.2017.03.041
1In a partially ordered set of clusters, not every pair of clusters need be comparable.2https://github.com/bib3rce/RL_SD

1.4. Scientific Contributions 7
Conference Paper
Valmarska, A., Robnik-Šikonja, M., & Lavrač, N. (2015). Inverted heuristics in subgroupdiscovery. In Proceedings of the 18th International Multiconference Information So-ciety (Vol. 178, pp. 41–44).
Contribution 2 We developed a methodology for the division of patients into clustersbased on the severity of the symptoms of patients assigned to each cluster. We showedthat the resulting clusters can be at least partially ordered according to the severity of thedisease. Using this, we can declare the changes of clusters between two consecutive visitsto be positive or negative (the patient’s status has improved or has worsened). Based onthese changes, we presented an algorithm for detection of medications dosage changes thatoccurred most frequently when the status of the patients improved or worsened. We alsopresent a methodology for determining patterns of Parkinson’s disease progression basedon skip-grams from natural language processing. The pseudocode of the methodology ispresented in Chapter 5 and Appendix A.1.
Publications related to this contribution
Journal Paper
Valmarska, A., Miljkovic, D., Lavrač, N., & Robnik-Šikonja, M. (2018). Analysis of medi-cations change in Parkinson’s disease progression data. Journal of Intelligent Infor-mation Systems. doi:10.1007/s10844-018-0502-y
Conference Paper
Valmarska, A., Miljkovic, D., Robnik-Šikonja, M., & Lavrač, N. (2016). Multi-view ap-proach to Parkinson’s disease quality of life data analysis. In Proceedings of the In-ternational Workshop on New Frontiers in Mining Complex Patterns (pp. 163–178).Springer.
Contribution 3 We developed a methodology for the detection of medications changepatterns and determining the symptoms that trigger the change of the dosages of an-tiparkinson medications. We found patterns of medications dosage changes as a result ofchanges in the overall status (quality of life) of patients. We developed an algorithm fordetermining the symptoms that have the strongest impact on the progression of the dis-ease. Some of the identified symptoms are well known, while others only recently startedto gain recognition as possible markers of Parkinson’s disease progression. The pseudocodeof the methodology is presented in Appendix A.2.
Publications related to this contribution
Journal Paper
Valmarska, A., Miljkovic, D., Konitsiotis, S., Gatsios, D., Lavrač, N., & Robnik-Šikonja, M.(2018). Symptoms and medications change patterns for Parkinson’s disease patientsstratification. Artificial Intelligence in Medicine (accepted).

8 Chapter 1. Introduction
Conference Paper
Valmarska, A., Miljkovic, D., Konitsiotis, S., Gatsios, D., Lavrač, N., & Robnik-Šikonja,M. (2017). Combining multitask learning and short time series analysis in Parkin-son’s disease patients stratification. In Proceedings of the Conference on ArtificialIntelligence in Medicine in Europe (pp. 116–125). Springer.
1.5 Structure of the Thesis
The remainder of the thesis is structured as follows. Chapter 2 presents the related work.Chapter 3 presents the Parkinson’s disease data used in the experiments. Chapters 4, 5,and 6 present the main body of our work.
Chapter 3 is an introduction to Parkinson’s disease through the description of thepatients’ symptoms and the medications treatments available to the clinicians to control thesymptoms and promote the patients’ independence. We present the PPMI data collectionand describe the process of data collection, as well as the nature of symptoms, representedby the attributes and their values. We present value ranges of the attributes and statisticalassociations with the improvements or degradations of the patients’ status.
Chapter 4 presents our approach to improving algorithms for classification rule learningand subgroup discovery by separating the two phases of rule learning, refinement andselection. We extend the idea of Stecher et al. (2014) by using two beams that holdthe best rules according to their potential quality for rule refinement and selection. Thischapter is divided into two sections, where we first introduce the problem description andthen present the paper published in the Expert Systems with Applications journal thataddresses the described problem.
In Chapter 5 we present our methodology for separating the patients into groups basedon the similarity of their symptoms and determining patterns of medications change anddisease progression. We present an algorithm for detection of medications changes patternsthat most frequently cause improvement or worsening of patients’ status. We employ skip-grams from natural language processing to obtain the patterns of disease progression. Thechapter is divided into two sections, where we first introduce the problem description andthen we present the paper published in the Journal of Intelligent Information Systems thataddresses the described problem.
Chapter 6 presents our methodology for the detection of medications changes patternsbased on the patients’ status. We employ predictive clustering trees in order to learnsymptoms that trigger the medications dosage change. We present an algorithm for deter-mining symptoms that mostly influence the Parkinson’s disease progression, i.e. symptomsthat improve or worsen most frequently as the status of the patients improves or declines.Similarly to Chapters 4 and 5, this chapter is also divided into two sections: problem de-scription and the paper published in the Artificial Intelligence in Medicine journal whichaddresses the described problem.
Chapter 7 summarizes the work and presents the ideas for future improvements.

9
Chapter 2
Related Work
This chapter provides the related work in three research topics covered by the thesis: rulelearning and subgroup discovery algorithms based on separation of refinement and selectionphase in rule learning, Parkinson’s disease data clustering and skip-gram analysis of shortseries, and multi-target approach to Parkinson’s disease management.
Rule learning is a standard symbolic data analysis technique used for constructingcomprehensible models and patterns. Its main advantage over the other data analysistechniques is its simplicity and comprehensibility of its outputs. Rule learning has beenextensively used both in predictive and descriptive rule learning settings, whereby applyingdifferent rule evaluation heuristics different trade-offs between the consistency and coverageof constructed rules can be achieved. This chapter presents a short overview of classifi-cation rule learning in Section 2.1 and subgroup discovery in Section 2.2, followed by anoverview of relevant multi-view clustering approaches (Section 2.3), a short overview ofmethods for short time series analysis (Section 2.4), and the introduction of skip-grams forsequence data analysis (Section 2.5). In Parkinson’s disease management several groups ofmedications are used together. We apply multi-target modeling with predictive clusteringtrees to capture their joint effects. We discuss related work from multitarget and multi-task learning in Section 2.6. We are interested in the importance of symptoms affecting theoverall status of the disease, which is a problem addressed in feature ranking/evaluationresearch. We compare and contrast the proposed algorithm with existing approaches inSection 2.7.
2.1 Classification Rule Learning
The task of classification rule learning is to find models that would ideally be complete(i.e., cover all the positive examples, or at least most of the positives), and consistent (i.e.,do not cover any of the negative examples, or at most a very small number of negatives).Multi-class classification problems can be addressed by using the one-versus-all approach,which learns one rule set for each class, where the examples labeled with the chosen classare considered as positive target class examples and the examples of all the other classesas the negatives.
There are numerous classification rule learning algorithms, the most popular being AQ,CN2 and Ripper. The AQ algorithm (Michalski, 1969) was the first covering algorithm forrule set construction. It is a top-down beam search algorithm that uses a random positiveexample as a seed for finding the best rule. The CN2 algorithm (Clark & Niblett, 1989)combines the ideas from the AQ algorithm and the decision tree learning algorithm ID3(Quinlan, 1983), where each path from the root of the tree to a tree leaf can be viewedas a separate rule. It constructs an ordered decision list by learning rules describing the
10 Chapter 2. Related Work
majority class examples. Once the learned rule is added to the decision list, all the coveredexamples, both positive and negative, are removed from the training data set, and the ruleinduction process is continued on the updated training set. Ripper (Cohen, 1995) is thefirst rule learning algorithm that effectively overcomes the overfitting problem and is thus avery powerful rule learning system. The algorithm constructs rule sets for each of the classvalues. Initially, the training data set is divided into a growing and a pruning set. Rules arelearned on the growing set and then pruned on the pruning set by incrementally reducingthe error rate on the pruning set. A pruned rule is added to the rule set if the descriptionlength of the newly constructed rule set is at most d bits longer (a parameter) than thealready induced rule set. Otherwise, the rule learning process is stopped. Similarly tothe CN2 algorithm, when a new rule is added to the rule set, all the instances coveredby this rule are removed from the growing set. In addition to pruning the rules beforeadding them to the induced rule set, Ripper prevents rules overfitting in a post-processingphase in which the learned rule set is optimized and the selected rules are re-learned inthe context of the other rules. FURIA (Hühn & Hüllermeier, 2009) is a classification rulelearning algorithm that extends the Ripper algorithm by learning fuzzy rules.
Despite its long history, rule learning is still actively researched and routinely appliedin practice. For example, Napierala and Stefanowski (2015) use rule learning with argu-mentation to tackle imbalanced data sets, and Ruz (2016) explores the order of instancesin seeding rules to improve the classification accuracy. Minnaert, Martens, De Backer, andBaesens (2015) discuss the importance of proper rule evaluation measures for improvingthe accuracy of classification rule learning algorithms. They also introduce multi-criterialearning and investigate a Pareto front as a trade-off between comprehensibility and accu-racy of rule learners.
In the line of research started by Parpinelli, Lopes, and Freitas (2002), rule learningis turned into an optimization problem using an ant colony optimization approach. Theinitial rule learning algorithm, named Ant-Miner, worked for nominal attributes only butwas later improved by Pičulin and Robnik-Šikonja (2014) to efficiently handle numericattributes. Classification rule learning has been a vivid topic of research also in induc-tive logic programming and relational data mining. For example, Zeng, Patel, and Page(2014) developed the QuickFOIL algorithm that improves over the original FOIL algorithm(Quinlan & Cameron-Jones, 1993).
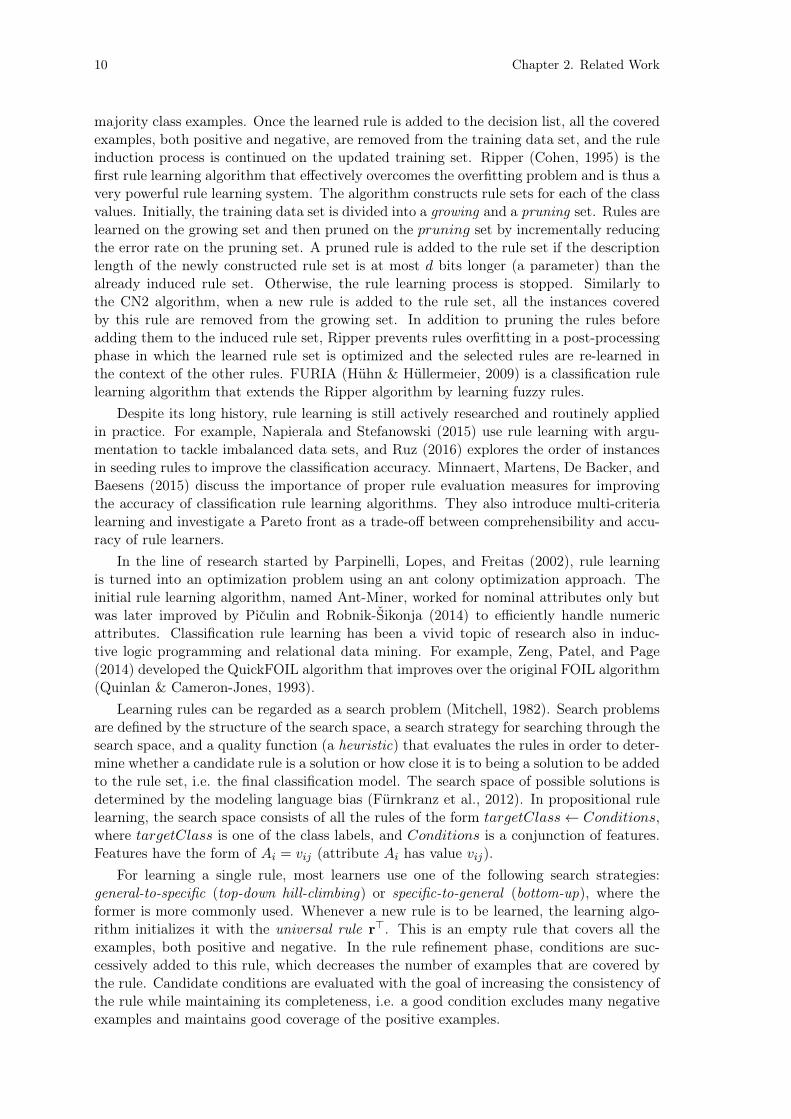
Learning rules can be regarded as a search problem (Mitchell, 1982). Search problemsare defined by the structure of the search space, a search strategy for searching through thesearch space, and a quality function (a heuristic) that evaluates the rules in order to deter-mine whether a candidate rule is a solution or how close it is to being a solution to be addedto the rule set, i.e. the final classification model. The search space of possible solutions isdetermined by the modeling language bias (Fürnkranz et al., 2012). In propositional rulelearning, the search space consists of all the rules of the form targetClass Conditions,where targetClass is one of the class labels, and Conditions is a conjunction of features.Features have the form of Ai = vij (attribute Ai has value vij).
For learning a single rule, most learners use one of the following search strategies:general-to-specific (top-down hill-climbing) or specific-to-general (bottom-up), where theformer is more commonly used. Whenever a new rule is to be learned, the learning algo-rithm initializes it with the universal rule r>. This is an empty rule that covers all theexamples, both positive and negative. In the rule refinement phase, conditions are suc-cessively added to this rule, which decreases the number of examples that are covered bythe rule. Candidate conditions are evaluated with the goal of increasing the consistency ofthe rule while maintaining its completeness, i.e. a good condition excludes many negativeexamples and maintains good coverage of the positive examples.

2.1. Classification Rule Learning 11
Heuristic functions are used in order to evaluate and compare different rules. Differentheuristics implement different trade-offs between the two objectives (coverage and consis-tency). While CN2 and Ripper use entropy as the heuristic evaluation measure, numerousother heuristic functions have been proposed in rule learning—for a variety of heuristicsand their properties the interested reader is referred to (Fürnkranz et al., 2012). The mostfrequently used heuristics in rule learning are:
Precision:hprec(p, n) =
p
p+ n(2.1)
Laplace:hlap(p, n) =
p+ 1
p+ n+ 2(2.2)
m-estimate:
hm-est(p, n,m) =p+m · P
P+N
p+ n+m(2.3)
where, for a given rule, arguments p and n denote the number of positive and negativeexamples covered by the rule (i.e. the true and false positives, respectively), and P and Ndenote the total number of positive and negative examples in the data set. Given that theseheuristics concern the problem of selecting the best of multiple refinements of the samebase rule (the empty rule, universal rule), values P and N can be regarded as constant, sothat the above functions may be written as h(p, n) depending only on the true and falsepositives, while in Equation (2.3) the function arguments include m, which is a positivenumber denoting a correction towards the prior probability of the positive class (Fürnkranzet al., 2012).
Table 2.1 compares the DoubleBeam-RL classification rule learning algorithm intro-duced in Chapter 4, to the state-of-the-art classification rule learners that were used in theexperiments. CN2 and DoubleBeam-RL are beam search algorithms, while Ripper and SC-ILL are greedy algorithms, adding conditions to the rules that maximize their respectiveheuristics. The DoubleBeam-RL and SC-ILL algorithms use separate heuristics adaptedfor the refinement and selection phase of the rule learning process. Ripper is the only con-sidered classification rule learning algorithm that employs rule pruning and optimizationof rule sets in post-processing. The algorithms use different stopping criteria; for example,Ripper uses a heuristic based on the minimum description length (MDL) principle.
Table 2.1: Comparison of the DoubleBeam-RL algorithm to the state-of-the-art classifica-tion rule learners CN2, Ripper and SC-ILL.
Separate Stopping Rule Post-Algorithm Type of search refinement criterion pruning processing
heuristicCN2 beam no no beam no no
improvement
Ripper greedy no MDL yes yes
no negativeSC-ILL greedy yes examples no no
covered
DoubleBeam-RL beam yes maxSteps no no

12 Chapter 2. Related Work
2.2 Subgroup Discovery
The goal of data analysis is not only to build prediction models but frequently the aimis to discover individual patterns that describe regularities in the data (Fürnkranz et al.,2012; Kralj Novak, Lavrač, Zupan, & Gamberger, 2005; Wrobel, 1997). This form of dataanalysis is used for data exploration and is referred to as descriptive induction.
Subgroup discovery is a form of descriptive induction. The task of subgroup discoveryis to find subgroups of examples which are sufficiently large while having a significantlydifferent distribution of target class instances than the original target class distribution.Like in classification rule learning, individual subgroup descriptions are represented as rulesin the form targetClass Conditions, where targetClass is the target class representingthe property of interest, and Conditions is a conjunction of features that are characteristicfor a selected group of individuals.
Subgroup discovery is a special case of a more general task of rule learning. Classifica-tion rule learners have been adapted to perform subgroup discovery with heuristic searchtechniques drawn from classification rule learning. These algorithms apply constraints,which are appropriate for descriptive rule learning. Research in the field of subgroup discov-ery has developed in different directions. Exhaustive methods, which include EXPLORA(Klösgen, 1996), SD-MAP (Atzmüller & Puppe, 2006), and APRIORI-SD (Kavšek, Lavrač,& Jovanoski, 2003), guarantee the optimal solution given the optimization criterion. TheAPRIORI-SD algorithm draws its inspiration from the association rule learning algorithmAPRIORI (Agrawal & Srikant, 1994) but restricts it to constructing rules that have onlythe target variable (the property of interest) in their head, with weighted relative accuracy(WRACC), defined in Equation (2.5), used as a measure of rule quality. In order to im-prove the inferential power of the subgroup describing rules, the APRIORI-SD algorithmuses a post-processing step to reduce the generated rules to a relatively small number ofdiverse rules. This reduction is performed using the weighted covering method proposedby Gamberger and Lavrač (2000). When a rule is added to the induced rule set, weightsof examples covered by the rule are decreased. This allows the method to prioritize ruleswhich cover yet uncovered examples, thus promoting the coverage of diverse groups ofexamples.
While the APRIORI-SD algorithm adapts the process of association rule learning tothe context of subgroup discovery, the SD subgroup discovery algorithm (Gamberger &Lavrač, 2002) performs heuristic beam search, where rule quality is estimated using theheuristic
hg(p, n, g) =p
n+ g, (2.4)
where p is the number of true positives, n is the number of false positives, and g is thegeneralization parameter. High-quality rules will cover many target class examples and alow number of non-target examples. The number of tolerated non-target examples coveredby a rule is regulated by generalization parameter g. For small g, more specific rules aregenerated, while for bigger values of g the algorithm constructs more general rules. Theinterpretation of the rules produced by the SD algorithm is improved using the abovementioned weighted covering method in post-processing (Gamberger & Lavrač, 2000).
CN2-SD (Lavrač, Kavšek, Flach, & Todorovski, 2004) is a beam search algorithm,which adapts the CN2 (Clark & Niblett, 1989) classification rule learner to subgroupdiscovery. CN2-SD introduced a weighted covering algorithm, where examples that havealready been covered by one of the learned rules are not removed from the training dataset, but instead, their weights are decreased. The authors propose and compare differentmeasures for rule evaluation. They argue that the most important measure for subgroupevaluation is weighted relative accuracy (WRACC), referred to as unusualness, defined as
2.3. Multi-View Clustering 13
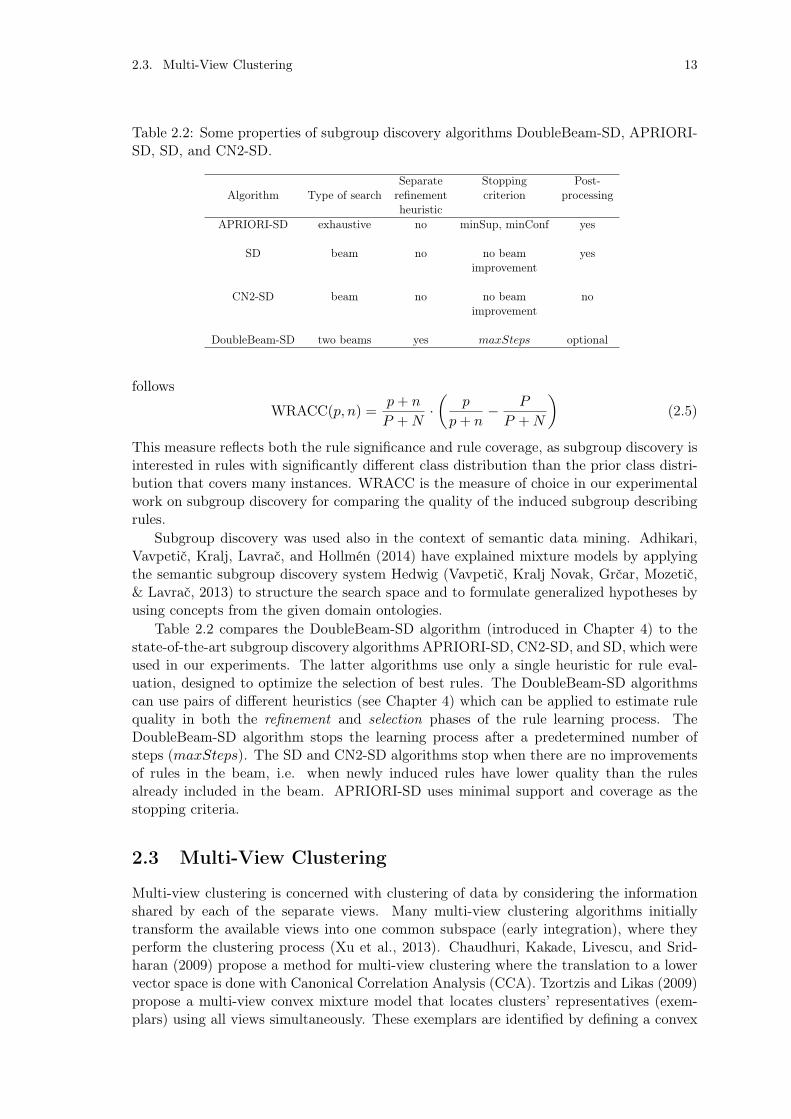
Table 2.2: Some properties of subgroup discovery algorithms DoubleBeam-SD, APRIORI-SD, SD, and CN2-SD.
Separate Stopping Post-Algorithm Type of search refinement criterion processing
heuristicAPRIORI-SD exhaustive no minSup, minConf yes
SD beam no no beam yesimprovement
CN2-SD beam no no beam noimprovement
DoubleBeam-SD two beams yes maxSteps optional
follows
WRACC(p, n) =p+ n
P +N·✓
p
p+ n� P
P +N
◆(2.5)
This measure reflects both the rule significance and rule coverage, as subgroup discovery isinterested in rules with significantly different class distribution than the prior class distri-bution that covers many instances. WRACC is the measure of choice in our experimentalwork on subgroup discovery for comparing the quality of the induced subgroup describingrules.
Subgroup discovery was used also in the context of semantic data mining. Adhikari,Vavpetič, Kralj, Lavrač, and Hollmén (2014) have explained mixture models by applyingthe semantic subgroup discovery system Hedwig (Vavpetič, Kralj Novak, Grčar, Mozetič,& Lavrač, 2013) to structure the search space and to formulate generalized hypotheses byusing concepts from the given domain ontologies.
Table 2.2 compares the DoubleBeam-SD algorithm (introduced in Chapter 4) to thestate-of-the-art subgroup discovery algorithms APRIORI-SD, CN2-SD, and SD, which wereused in our experiments. The latter algorithms use only a single heuristic for rule eval-uation, designed to optimize the selection of best rules. The DoubleBeam-SD algorithmscan use pairs of different heuristics (see Chapter 4) which can be applied to estimate rulequality in both the refinement and selection phases of the rule learning process. TheDoubleBeam-SD algorithm stops the learning process after a predetermined number ofsteps (maxSteps). The SD and CN2-SD algorithms stop when there are no improvementsof rules in the beam, i.e. when newly induced rules have lower quality than the rulesalready included in the beam. APRIORI-SD uses minimal support and coverage as thestopping criteria.
2.3 Multi-View Clustering
Multi-view clustering is concerned with clustering of data by considering the informationshared by each of the separate views. Many multi-view clustering algorithms initiallytransform the available views into one common subspace (early integration), where theyperform the clustering process (Xu et al., 2013). Chaudhuri, Kakade, Livescu, and Srid-haran (2009) propose a method for multi-view clustering where the translation to a lowervector space is done with Canonical Correlation Analysis (CCA). Tzortzis and Likas (2009)propose a multi-view convex mixture model that locates clusters’ representatives (exem-plars) using all views simultaneously. These exemplars are identified by defining a convex

14 Chapter 2. Related Work
mixture model distribution for each view. Cleuziou, Exbrayat, Martin, and Sublemontier(2009) present a method where in each view they obtain a specific organization using fuzzyk-means (Bezdek, 1981) and introduce a penalty term in order to reduce the disagreementbetween organizations in different views. Cai, Nie, and Huang (2013) propose a multi-view k-means clustering algorithm for big data. The algorithm utilizes a common clusterindicator in order to establish common patterns across the views.
Co-training (Blum & Mitchell, 1998) is one of the earliest representatives of multi-viewlearning. This approach considers two views consisting of both labeled and unlabeled data.Using labeled data, co-training constructs a separate classifier for each view. The mostconfident predictions of each classifier on the unlabeled data are then used to iterativelyconstruct additional labeled training data. Kumar and Daumé (2011) apply the co-trainingprinciple (Blum & Mitchell, 1998) in unsupervised learning. Clustering is performed onboth views, then cluster points from one view are used to modify the clustering structureof the other view. Appice and Malerba (2016) employ the co-training principle in themulti-view setting for process mining clustering. The above-mentioned approaches pre-sume that each of the respective views is capable of producing clusters of similar qualitywhen considered separately. He et al. (2014) do not make that presumption. They com-bine multiple views under a principled framework, CoNMF (Co-regularized Non-negativeMatrix Factorization), which extends NMF (Non-negative Matrix Factorization) for multi-view clustering by jointly factorizing the multiple matrices through co-regularization. Thematrix factorization process is constrained by maximizing the correlation between pairs ofviews, thus utilizing information from each of the considered views. CoNMF is a multi-view clustering approach with intermediate integration of views, where different views arefused during the clustering process. The co-regularization of each pair of views makes theclustering process more robust to noisy views. The decision to use the CoNMF approachin our work was made based on this property and on the availability of its Python code.The CoNMF approach is used in Chapter 5.
2.4 Analysis of Short Time Series
A time series is a sequence of data points indexed in time order. Time series data analysiswas used to study a wide range of biological and ecological systems (Bence, 1995). The useof time series allows for studying the dynamics of a system. Short time series (8 points orless) constitute more than 80% of all time series data sets (Ernst, Nau, & Bar-Joseph, 2005).The small number of available time points does not allow for identification of statisticallysignificant temporal profiles (Ernst & Bar-Joseph, 2006). Bence (1995) examines methodsfor adjusting confidence intervals of the mean and parameters of a linear regression forautocorrelation. De Alba, Mendoza, et al. (2007) suggest that simpler models can be moreeffective on short time series. They show that the Bayesian approach is superior to thetraditional approach when applied to short time series but inferior when applied to longertime series. A lot of the research in short time series analysis is related to the analysis ofshort time series on microarray gene expression data. Ernst et al. (2005) present a methodfor clustering of short time series gene expression data, followed by the introduction ofthe STEM (Short Time-series Expression Miner) software program (Ernst & Bar-Joseph,2006) specifically designed for the analysis of short time series microarray gene expressiondata.
In the healthcare domain, Choi, Schuetz, Stewart, and Sun (2017) incorporate temporalmodeling using the recurrent neural network (RNN) model to predict heart failure. Imhoff,Bauer, Gather, and Löhlein (1998) apply short time series analysis to monitor lab variablesafter liver surgery and to offer support to clinicians in their decision-making process for

2.5. Skip-grams for Sequence Data Analysis 15
the treatment of acute respiratory distress syndrome. Schieb, Mobley, George, and Casper(2013) evaluate the clustering of stroke hospitalization rates, patterns of the clusteringover time, and associations with community-level characteristics. They generate clustersof high and low-stroke hospitalization rates during two periods of time. According to theplace of residence of patients, counties in the USA are assigned to clusters. Following thetransition of counties between clusters between these two periods, counties are labeled ashaving a persistently high, transitional, or persistently low-stroke hospitalization rate.
Murugesan et al. (2017) present a hierarchical multi-scale approach for visualizing spa-tial and functional cluster evaluation patterns. Their visualization method is a two-stagemethod based on a sequence of community detection at each time stamp and communitytracking between steps. Greene, Doyle, and Cunningham (2010) address the issue of iden-tifying communities in dynamic networks. Appice (2017) uses social network analysis as abasic approach for organizational mining, aimed at understanding the life cycle of dynamicorganizational structures.
Zhao et al. (2017) explore different representations of temporal data from electronichealth records to improve prediction of adverse drug events. They obtain sequences ofsymbols by transforming time series of individual feature into strings, as presented in (Lin,Keogh, Wei, & Lonardi, 2007). These strings reflect the temporal nature of the originalvalues. Results from their empirical investigation show that transformation of sequencesto tabular form based on edit distance of sub-sequences to representative shapelets leadsto improved predictive performance. This approach reduces the feature sequence diversityby finding informative random sub-sequences. The goal of Zhao et al. (2017) is to predictwhether patients will develop adverse drug reactions. They use the history of patientssymptoms in order to predict a single event (adverse drug event: yes or no), while wefollow the patients’ disease development and changes in their overall status as a resultof therapy changes. Another difference is our use of skip-grams which reduces noise andenforces strong transition patterns.
To the best of our knowledge, the temporal nature of medical data has not been ex-plored in research directed towards determining the progression of Parkinson’s disease anddetermining the therapy recommendations in order to stabilize the disease progression.We present a clustering based methodology on short time series symptoms data of Parkin-son’s disease patients in an attempt to discover how the disease develops through time,reflected by the change of patients’ symptoms. Simultaneously, we use the temporal dataabout their medications therapy to determine how clinicians react to patients’ symptomschanges. Each Parkinson’s disease patient is described with his/her symptoms and medi-cations treatment through time. The temporal data is flattened to records from single timepoints, where any change of patients’ symptoms between two consecutive points is referredas a change in their status. Changes in status are then connected to possible changes inmedications therapies.
2.5 Skip-grams for Sequence Data Analysis
Patient’s allocation to clusters in sequential time points can be viewed as a sequence ofitems. Analysis of contiguous sequences of items for every patient’s cluster allocation canprovide an insight into the disease progression and reveal patterns how (and how often)the patient’s symptoms improve or degrade.
We use an approach to sequence data analysis, where we borrow the methodologyinitially developed in the field of natural language processing (NLP). In NLP, a contiguoussequence of n items from a given sequence of text or speech is called an n-gram (Broder,Glassman, Manasse, & Zweig, 1997). Skip-grams are a generalization of n-grams in which

16 Chapter 2. Related Work
the components (typically words) need not be consecutive in the text under considerationbut may leave gaps that are skipped over (Guthrie et al., 2006). They provide a way ofovercoming the data sparsity problem found with conventional n-gram analysis.
Another use of skip-grams is in producing word embeddings into a vector form toreduce the dimensionality and sparsity of a bag-of-words representation. Mikolov, Chen,Corrado, and Dean (2013) proposed word2vec embedding based on deep learning, whichhas subsequently been used in many NLP applications, including some with clinical textdata (De Vine, Zuccon, Koopman, Sitbon, & Bruza, 2014) and to learn relationshipsbetween clinical processes and unified medical language system (UMLS) concepts (Choiet al., 2017). Our use of skip-grams is entirely different as we do not use embeddings butuse skip-grams directly as a more robust version of n-grams.
In the context of our analysis, skip-grams allow for robust identification of frequentpaths through clusters and reveal typical disease progression patterns. The patient’s overallstatus at a given visit to the clinician, as determined by the (patient, visit) pair clusterassignment, can be seen as an item, and changes of clusters as sequences of items, whichcan be analyzed with the skip-grams-based approach developed for NLP. This is novelin the analysis of Parkinson’s disease data and allows us to follow the progression of thepatient’s overall status without taking into account noise in the form of sudden changes inthe patient’s status. Such changes are not necessary due to Parkinson’s disease but can beattributed to other stressful events in the patient’s life (such as loss of a loved one, loss of apet, etc.). The patients’ status is determined by the symptoms recorded during their visitto the clinician. Patients’ assignment to the clusters is determined based on their overallstatus. To the best of our knowledge, there has not been any study involving skip-gramsthat uses the actual symptoms of patients in order to explore patients’ disease progressionand the clinicians’ response by changing the medications therapy. The skip-gram approachis used in Chapter 5.
2.6 Multitask Learning
In multitask learning (MTL), multiple related tasks are learned simultaneously on a sharedattribute space. Compared to single task learning, MTL can improve model generalizationand prevent overfitting (Caruana, 1997). This is achieved by transfer of intermediateknowledge (features) between jointly learned tasks.
Caruana, Baluja, and Mitchell (1996) use knowledge from the future to rank patientsaccording to their risk to die from pneumonia. The shared attribute space consists of pa-tients at the time they are admitted to the hospital. The multiple tasks which are learnedby the model are a set of hospital tests performed to determine whether the patients areat risk of dying of pneumonia. Zhou, Liu, Narayan, Ye, and ADNI (2013) use multitasklearning to model Alzheimer’s disease progression. They use two clinical/cognitive mea-sures, Mini Mental State Examination (MMSE) and Alzheimer’s Disease Assessment Scalecognitive subscale (ADAS-Cog) as multiple evaluations to determine the progression of thedisease. Zhang, Shen, and ADNI (2012) propose a multitask model for prediction of multi-ple regression and classification variables in Alzheimer’s disease, which takes advantage ofthe multi-modal nature of patient’s symptoms. Similarly to Parkinson’s disease patients,Alzheimer’s disease patients can be described by symptoms collected from multiple sources.All of these approaches use quantitative data “from the future” (test values) to determinehow the disease progresses. Unfortunately, there are no tests to appropriately measurethe progression of Parkinson’s disease. None of the above-mentioned methods look at themedications that the patients are receiving to decelerate the disease progression.
We use multitask learning with the aim to simultaneously predict the values of several

2.7. Feature Evaluation 17
target attributes (medications in our case). We use the MTL implementation with pre-dictive clustering trees (PCTs) (Blockeel & De Raedt, 1998; Blockeel, Raedt, & Ramon,1998). This method adapts the basic top-down induction of decision trees with clusteringand allows for multitask learning. The PCT learning algorithm used is implemented in theCLUS data mining framework (Blockeel, 1998; Blockeel et al., 1998; De Raedt & Blockeel,1997; Kocev, Vens, Struyf, & Džeroski, 2007; Piccart, Struyf, & Blockeel, 2008). We ob-tain multi-target decision trees, simultaneously predicting three target variables: changeof levodopa dosage, change of dopamine agonists dosage, and change of MAO-B inhibitorsdosage, referring to three most important medication groups used in Parkinson’s diseasepatient management. The PCT-based approach is used in Chapter 6.
2.7 Feature Evaluation
Feature subset selection can improve the accuracy, efficiency, applicability, and comprehen-sibility of a learning process and its resulting model (Arauzo-Azofra, Aznarte, & Benítez,2011; Guyon & Elisseeff, 2003; Guyon, Gunn, Nikravesh, & Zadeh, 2008). For this reason,many feature subset selection approaches have been proposed. In general, three types offeature selection methods exist: wrapper, filter, and embedded methods. Wrapper meth-ods use the performance of a given learning algorithm as the criterion to include/excludeattributes. Embedded methods use feature selection as an integral part of their learningprocess. Filter methods introduce some external criterion independent of the predictorand evaluate features according to that criterion, which allows for ranking of features andselection of a suitable subset. This is fit for our purpose.
Our approach to determine the importance of symptoms for the overall disease pro-gression is strongly related to the well-known Relief family of algorithms (Kira & Rendell,1992; Kononenko, 1994; Reyes, Morell, & Ventura, 2015; Robnik-Šikonja & Kononenko,2003). These algorithms evaluate attributes based on their ability to distinguish betweensimilar instances with different class values. Contrary to the majority of feature evaluationheuristics (e.g., information gain, gini index, etc.) that assume conditional independenceof attributes with respect to the target variable, the Relief approaches do not make thisassumption and are suitable for problems that involve feature interaction. The Relief al-gorithms randomly select an instance and find the nearest instance from the same classand nearest instances from different classes. When comparing feature values of near in-stances the algorithm rewards features that separate instances with different class valuesand punishes features that separate instances with the same class value. The whole processis repeated for a large enough sample. The approach we propose also uses similar instancesbut uses cluster membership as a criterion for similarity instead of a distance in the featurespace. When updating the importance of features, our approach assesses joint transitionsfrom one cluster to another or from a better patient status to a worse one, while Reliefalgorithms use similarities in target variable.
Most feature selection methods do not attempt to uncover causal relationships betweenfeature and target and focus instead on making best predictions. The introduction ofcausal feature selection (under broad assumptions) can exibit strong feature set parsimony,high predictivity, and local causal interpretability (Aliferis, Statnikov, Tsamardinos, Mani,& Koutsoukos, 2010a, 2010b). In the medical context, the Markov blanket discoveryalgorithm HITON (Aliferis, Tsamardinos, & Statnikov, 2003) has been used to understandphysicians’ decisions and their guideline compliance in the diagnosis of melanomas.
Some recent feature selection approaches try to explore the interconnection betweenthe features by exploring the similarity graph of features (Rana et al., 2015; Shang, Wang,Stolkin, & Jiao, 2016). Other approaches pose feature selection as an optimization problem.

18 Chapter 2. Related Work
For example, Sun et al. (2012) use optimization in combination with a game theory basedmethod. Our approach also uses a graph of transitions between clusters to assess similarityof patients, but we work in an unsupervised scenario and use time order of patients’ visitsas links between nodes. The details are explained in Chapter 6.
2.8 Parkinson’s Disease Related Data Mining Research
The main branches of data mining research in the field of Parkinson’s disease (PD) include:classification of PD patients, detection of subtypes of PD patients, detection of possiblebiomarkers, detection of PD symptoms, and assessing the success of deep brain stimulationsurgery as a last resort in the treatment of Parkinson’s disease patients.
The use of classification techniques offers decision support to specialists by increasingthe accuracy and reliability of diagnosis and reducing possible errors. Gil and Johnson(2009) use Artificial Neural Networks (ANN) and Support Vector Machines (SVM) to dis-tinguish PD patients from healthy subjects. Ramani and Sivagami (2011) compare theeffectiveness of different data mining algorithms in the diagnosis of PD patients. Identifi-cation of Parkinson’s disease subtypes is presented in the work of Lewis et al. (2005), andhas been confirmed in the conclusions from Reijnders et al. (2009) and Ma et al. (2015).
A biomarker is an objectively measurable characteristic that is able to detect abnormalbiological processes, pathogenic processes and/or pharmacological responses to therapy(Bazazeh, Shubair, & Malik, 2016). To the best of our knowledge, there is no accepteddefinitive biomarker of Parkinson’s disease. The development of early diagnostic biomark-ers can lead towards more promt clinician’s intervention at the onset of disease and can aidmonitor the progress of medications therapy interventions that may slow or stop the courseof the disease (Miller & O’Callaghan, 2015). Effors are made in the machine learning anddata mining community to discover biomarkers distinguishing idiopathic Parkinson’s dis-ease patients. Research includes detection of possible biomarkers from image (Adeli et al.,2017; Goebel et al., 2011; L. Liu et al., 2018; Singh & Samavedham, 2015), speech (Tsanas,Little, McSharry, Spielman, & Ramig, 2012), and biochemical data (Alberio et al., 2013).
Tremor is one of the symptoms strongly associated with Parkinson’s disease. Severalmethods for numerical assessment of the intensity of tremor have been proposed. Thesemethods include time series analysis (Timmer et al., 1993), spectral analysis (Riviere,Reich, & Thakor, 1997) and analysis with adaptive Fourier modeling (Riviere et al., 1997)and they address tremor detection and quantification. Recent works are based on bodyfixed sensors (BFS) for long-term monitoring of patients (Patel et al., 2009).
In the course of their disease, patients are prescribed antiparkinson medications thera-pies in order to control the troubling symptoms. As the disease progresses, the medicationstreatment can become ineffective and—as a last resort—clinicians use deep brain stimu-lation (DBS) surgery to control the Parkinson’s disease symptoms. Data mining researchconfirms that DBS significantly improves the patients’ motor function (Y. Liu et al., 2014).Depending on the chosen method for DBS, a great reduction in dose of medication, or con-servation of cognitive functions can be achieved. In order to predict the neurological effectsrelated to different electrode-contact stimulation, Szymański, Kubis, and Przybyszewski(2015) tracked the connections between the stimulated part of the subthalamic nucleusand the cortex with the help of diffusion tensor imaging (DTI).
Tsanas (2012) addresses the progression of Parkinson’s disease for 42 patients overa six month period by predicting the total score of patients’ motor symptoms severityand the total UPDRS (Unified Parkinson’s Disease Rating Scale) score using linear andnonlinear regression techniques. Eskidere et al. (2012) build on previous work (Tsanas,Little, McSharry, & Ramig, 2010; Tsanas, Little, et al., 2010) by proposing and comparing
2.8. Parkinson’s Disease Related Data Mining Research 19
the performance of multiple regression methods for predicting the above mentioned totalscores. It is worth noting that during their involvement in the clinical study for datacollection, patients did not receive their antiparkinson medications.
While clustering usually focuses on patient grouping with the aim of diagnosing newpatients, none of the listed methods follows the progression of the disease, and to the bestof our knowledge, no data mining research in the field of Parkinson’s disease analyzed thedevelopment of the disease in combination with the medications that the patients receive.Identification of groups of patients based on the similarity of their symptoms and theclinicians’ reaction with medications modification in order to keep the patients as stable andin good status as possible, can be helpful in the assignment of personalized therapies andadequate patient treatments. For that purpose, we propose a methodology for identificationof groups of patients based on the severity of their symptoms, determination of diseaseprogression, and the consequent patterns of medications modifications.
In the context of the PD_manager project (PD_manager: m-Health platform forParkinson’s disease management, 2015), Mileva-Boshkoska et al. (2017) developed a deci-sion support model for Parkinson’s disease medication changes. Models are developed incollaboration with Parkinson’s disease experts and no data mining is used in the process.


21
Chapter 3
Parkinson’s Disease Data
The data we used in this thesis is a part of the Parkinson’s Progression Markers Initiative(PPMI) funded by the Michael J. Fox Foundation. The PPMI study is comprised of neu-rological and movement disorder study sites throughout the United States, Europe, andAustralia, and study cores with expertise in clinical assessments, neurological imaging, bi-ologic sample storage (biorepository), bioinformatics, statistics, bioanalytics, and genetics(Marek et al., 2011). The PPMI data set collection includes clinical assessments and eval-uations, subject demographics, imaging data, and biological samples. In addition to thesedata, the PPMI study also keeps track of all the concomitant medications the Parkinson’sdisease patients are receiving throughout their involvement in the study. This chapterpresents a short description of symptoms and medications data used in our analyses todetermine indicators of changes in the patients’ quality of life—important symptoms andreactions to these symptoms by medications therapy modifications. Section 3.1 presentsa short description of symptoms data used by clinicians to follow the quality of life oftheir patients. In Section 3.2 we present groups of antiparkinson medications used in thetherapy of Parkinson’s disease patients. We describe how these medications are recordedin the PPMI study and how we relate them to symptoms reflecting the overall status ofthe patients.
3.1 Symptoms Data
Parkinsonism is a term that covers a range of conditions that have similar symptoms toParkinson’s. About 85% of people with parkinsonism have Parkinson’s (sometimes calledidiopathic Parkinson’s) (European Parkinson’s Disease Association, 2016). The quality oflife of patients suffering from Parkinson’s disease is monitored by a set of clinical symptoms.These symptoms describe different aspects of patients’ everyday life and are obtained andevaluated by standardized questionnaires. The most popular and widely accepted ques-tionnaire for determining the medical condition and the quality of life of a patient sufferingfrom Parkinson’s disease is the Movement Disorder Society (MDS) sponsored revision ofUnified Parkinson’s Disease Rating Scale (MDS-UPDRS) (Goetz et al., 2008). It is aquestionnaire consisting of 65 questions concerning the progression of disease symptoms.MDS-UPDRS is divided into four parts. Part I consists of questions about the ‘non-motorexperiences of daily living’. These questions address complex behaviors, such as halluci-nations, depression, apathy, etc., and patient’s experiences of daily living, such as sleepingproblems, daytime sleepiness, urinary problems, etc. Part II expresses ‘motor experiencesof daily living’. This part of the questionnaire examines whether the patient experiencesspeech problems, the need for assistance with the daily routines such as eating or dress-ing, etc. Part III is referred to as the ‘motor examination’ and collects data about the

22 Chapter 3. Parkinson’s Disease Data
Table 3.1: Short overview of the patients whose data are used in the experimental work.
Characteristic ValueNumber of patients 405Male/Female patients 265/140Age range on baseline visit 33–84Average age 61Visit range 1–5Average number of visits 3.32Number of instances 1335
motor symptoms that are typical for Parkinson’s disease patients and involve bradykinesia(slowness of movement), rigidity, tremor, postural instability, etc. Part IV concerns ‘motorcomplications’, which are mostly developed when the main antiparkinson drug levodopa isused for a longer time period.
Each question from the MDS-UPDRS questionnaire is anchored with five responsesthat are linked to commonly accepted clinical terms: 0 = normal (patient’s condition isnormal, symptom is not present), 1 = slight (symptom is present and has a slight influenceon the patient’s quality of life), 2 = mild, 3 = moderate, and 4 = severe (symptom ispresent and severely affects the normal and independent functioning of the patient, i.e.her/his quality of life is significantly decreased). In terms of data science, questions fromthe questionnaire can be considered as attributes in a data table, while responses to thequestions provide values of the corresponding attributes. The evaluation of MDS-UPDRSsymptoms is performed periodically, approximately every 3–6 months, throughout thepatients’ 5-year involvement in the study, thus providing a longitudinal view and dataabout the progression of Parkinson’s disease of each of the involved patients. We referto the time points when symptoms are updated as visits as these are actual visits of thepatients.
Note that PPMI data collection holds data about patients with varying times fromdiagnosis and length of involvement in the PPMI study. There are patients who have onlyrecently been diagnosed with Parkinson’s disease as well as patients with almost 2 yearspassed between their diagnosis and the start of their involvement in the PPMI study. Also,there are patients who have only started their involvement in the PPMI study and thosewho have concluded theirs. The experimental data include symptoms and medicationsdata of 405 Parkinson’s disease patients from the PPMI study. Table 3.1 presents a shortoverview of the patients whose data are used in our experimental work. The data coverthe status of 265 male and 140 female patients. At the beginning of their involvement inthe study (baseline visit), the youngest patient was 33 years old and the oldest patientwas 84 years old. The average age of patients is 61 years. Each patient has made 1 to 5visits to the clinician. The average number of recorded visits is 3.32. The experimentaldata consist of 1,345 patients’ visits and each visit is considered a separate data instance,representing the basic building block of the methodology described in Chapters 5 and 6.
The cognitive state of Parkinson’s disease patients is assessed by the Montreal CognitiveAssessment (MoCA) (Dalrymple-Alford et al., 2010) questionnaire. It is a rapid screen-ing instrument for mild cognitive dysfunction. It is a 30 point questionnaire consisting of11 questions, designed to assess different cognitive domains: attention and concentration,executive functions, memory, language, visuoconstructional skills, conceptual thinking,calculations, and orientation. The cognitive evaluation of patients using the MoCA ques-tionnaire is done on every other visit, starting from the fourth visit. In addition to MoCA,

3.1. Symptoms Data 23
Table 3.2: Characteristics of the questionnaire data used in the analysis.
Questionnaire Number of Answers Higher value indicatesquestions value range higher symptom severity
MDS-UPDRS Part I 6 0–4 YesMDS-UPDRS Part Ip 7 0–4 YesMDS-UPDRS Part II 13 0–4 YesMDS-UPDRS Part III 35 0–4 YesMoCA 11 0–1 NoPASE 7 1–2 NoSCOPA-AUT 21 0–3 YesQUIP 11 0–1 Yes
physicians also use the Questionnaire for Impulsive-Compulsive Disorders in Parkinson’sdisease (QUIP) (Weintraub et al., 2012) to address four major and three minor impulsive-compulsive disorders. The patient is impulsive if he/she has impulsion problems with anyof the considered impulsive compulsive problems. In our research, we use QUIP to deter-mine whether the patient has an impulsivity problem or not. Questions are not consideredas separate attributes in the data analysis. QUIP is administered regularly on every othervisit to the clinician.
Scales for Outcomes in Parkinson’s disease–Autonomic (SCOPA-AUT) is a specificscale to assess autonomic dysfunction in Parkinson’s disease patients (Visser, Marinus,Stiggelbout, & Van Hilten, 2004). It consists of 23 questions concerning gastrointestinal,urinary, cardiovascular, thermoregulatory, pupillomotor, and sexual symptoms. The sexualsymptoms are gender-specific and were therefore omitted from our analysis, thus bringingthe number of considered SCOPA-AUT attributes to 21. Each question from the SCOPA-AUT questionnaire is anchored with four responses that are linked to commonly acceptedclinical terms: 0 = never (patient has never experienced the particular symptom), 1 =sometimes (symptom has occurred sometimes), 2 = regularly, 3 = often (patient often hasproblems with the particular symptom). Urinary symptoms can also be evaluated withvalue 9, indicating that the patient is wearing a catheter. Responses to the SCOPA-AUTquestionnaire are updated on every other visit.
Physical Activity Scale for the Elderly (PASE) (Washburn, Smith, Jette, & Janney,1993) is a questionnaire that is a practical and widely used approach for physical activ-ity assessment in epidemiologic investigations. The PASE score combines information onleisure, household, and occupational activity. Washburn et al. (1993) states that the PASEtest-retest reliability coefficient (0.75) exceeded those reported for other physical activitysurveys. Responses to the PASE questionnaire are updated on every other visit, startingfrom the fourth visit. The periodical update of patients symptoms in the PPMI studyallows the clinicians to monitor patients’ disease development through time. As mentionedabove, answers to the questions from each questionnaire form the vectors of attributevalues.
Table 3.2 presents a summary of the symptoms data sets considered in our research.It lists the number of considered questions from each questionnaire, the range of attributevalues, and the nature of the attribute values. All considered questions have ordered valuesand with the exception of questions from MoCA and PASE, larger values suggest highersymptom severity and decreased quality of life of PD patients.
Symptoms of patients suffering from Parkinson’s disease are grouped into several datasets, representing distinct views of the data. These views consist of data from MoCA test,motor experiences of daily living, non-motor experiences of daily living, complex motor

24 Chapter 3. Parkinson’s Disease Data
examination data, etc. For each patient these data are obtained and updated periodically(on each or every second patient’s visit to the clinician), usually first at the beginning ofthe patient’s involvement in the PPMI study, and then approximately every 6 months,in total duration of 5 years—providing the clinicians with the opportunity to follow thedevelopment of the disease. Visits of each patient can be viewed as time points, and thecollected data on each visit is the data about the patient at the respective time point. Alltime points collected for one patient form a short time series.
When considering the possibility of using a multi-view framework, the independenceof separate views should be inspected. The conditional independence of separate viewsimposes constraints on their shared latent representation. If the conditional independenceconstraint is respected, it can improve the quality of a learned low dimensional represen-tation thus leading towards improved learning results (White, Zhang, Schuurmans, & Yu,2012). In their work, Goetz et al. (2008) state that MDS-UPDRS shows high internal con-sistency (Cronbach’s alpha = 0.79–0.93 across the MDS-UPDRS parts (described above),indicating acceptable to excellent internal consistency). Cronbach’s alpha (Cronbach, 1951)is a measure of internal consistency, measuring how closely related a set of items are asa group. MDS-UPDRS across-part correlations range from 0.22 to 0.66, indicating notacceptable or poor internal consistency. Across-part correlations determine the correlationbetween pairs of MDS-UPDRS parts. Results confirm that each part assesses a differentaspect of PD. Reliable factor structures for each part are obtained (comparative fit index> 0.90 for each part), which supports the use of sum scores for each part, when comparedto using a total score of all parts. Factor analysis is a strong clinical/statistical methodfor scale evaluation (Goetz et al., 2008). It examines whether items can be clustered andallows clinicians to determine if these clusters fall into components that represent clinicallyrelevant domains (Goetz et al., 2008).
3.2 Medications Data
The PPMI data collection offers information about all concomitant medications that pa-tients used during their involvement in the study. These medications are described withnames, medical conditions they are prescribed for, and time when the patient started and(if) ended the medications therapy. For the purpose of our research, we initially concentrateonly on whether the patient receives a therapy with antiparkinson medications, and whichcombination of antiparkinson medications the patient has received between the time pointswhen the MDS-UPDRS test and the MoCA test were administered. The main families ofdrugs used for treating motor symptoms are levodopa, dopamine agonists, and MAO-Binhibitors (National Collaborating Centre for Chronic Conditions, 2006). Medications thattreat Parkinson’s disease-related symptoms but are not from the above-mentioned groupsof medications are referred to as other.
The most widely used treatment for Parkinson’s disease for over 30 years is levodopa.It crosses the blood/brain barrier and once it is in the nervous system, it is transformedinto dopamine in the dopaminergic neurons by dopa-decarboxylase. Motor symptoms areproduced by a lack of dopamine in the substantia nigra, so levodopa is used to temporar-ily diminish the motor symptomology. The chronic administration of levodopa in thetreatment of Parkinson’s disease can cause several serious side effects, that include on/offfluctuations and levodopa-induced dyskinesia. When this occurs, Parkinson’s disease pa-tients change rapidly from a state with good response to medication and few symptoms(”on” state) to a status with no response to medication and important motor symptoms(”off” state). In order to omit or prolong the time before these side-effects occur, levodopadoses are kept as low as possible while maintaining functionality of patients. A common

3.2. Medications Data 25
practice is to delay the initiation of levodopa therapy and use alternatives for some time.Dopamine agonists were initially used for patients experiencing on-off fluctuations and
dyskinesias as a complementary therapy to levodopa. Now they are mainly used on theirown as an initial therapy for motor symptoms with the aim of delaying motor complications.Dopamine agonists are known to cause side effects which include insomnia, hallucinations,constipation, and problems with impulsive control. The existence of these side effectsforces clinicians to change patients’ medication therapies either by decreasing the dosageor stopping the dopamine agonist therapy.
MAO-B inhibitors increase the level of dopamine in the basal ganglia by blocking itsmetabolization and provide increased levels of levodopa in the striatum (nuclei in theforebrain and a critical component of the motor and reward system). Similar to dopamineagonists, MAO-B inhibitors are used in the first stages of the disease to control the motorsymptoms and delay the need for taking levodopa. Therapies with MAO-B inhibitors arealso used for the treatment of depression and anxiety. Both symptoms can be experiencedby Parkinson’s disease patients.
Clinicians follow the patients’ status and respond to changes in modifications of medica-tions. The modifications can be in terms of increasing or decreasing the dosage of a certaingroup of antiparkinson medications, introducing or removing medications from patients’therapies, changing the frequency and dosage of medication intake, etc. Clinicians canmodify the patients’ medications at any time and their decision is not strictly connectedto the visits at which the above-mentioned questionnaires are administered. Many timesclinicians do phone call-ups to patients in order to stay informed of the patients’ status andhow the disease progresses, and if necessary, they modify the therapy in order to controland stabilize the status of the patients. The medications therapy for Parkinson’s diseasepatients is highly personalized. Patients take different medications with personalized plansof intake. In order to be able to compare different therapies, dosages of Parkinson’s diseasemedications are translated into a common score called Levodopa Equivalent Daily Dosage(LEDD).
Figure 3.1 presents scenarios of medications dosage changes of a single patient. PointsV1, V2, V3, and V4 present time points on the continuous timeline with visits 1, 2, 3,and 4 to the clinician. The red lines represent the intake duration of each antiparkinsonmedication, D1, D2, and D3. The line width indicates the dosage of the medications, wherewider line width indicates increased dosage. As evident from Figure 3.1, on visit 1, thepatient receives a therapy consisting of medications D1 and D3. Sometime between visits1 and 2 the therapy is updated by introducing medication D2 and removing medicationD1. The snapshot of medications therapy in visit 3 shows that the patient’s therapy ismodified by increasing the LEDD of medication D2 and consists of medications D2 and D3.By visit 4, the medications therapy consists only of medication D3. As mentioned above,the clinicians follow the status of the patient and based on the overall status decide how tomodify the therapy. For example, if certain motor symptoms are getting overly problem-atic, clinicians will try to introduce levodopa based medications or increase their dosage.However, if the patient is experiencing hallucinations or has problems with impulse controland takes dopamine agonists, clinicians will decrease the dosage of these medications orremove them from the therapy.
We preprocessed the medications data presented in the PPMI concomitant medicationslog by recording only antiparkinsonian medications and connecting the medications andtheir dosages to the patients’ visits. For example, for the patient from Figure 3.1, wewould record that in visit 1 the patient was taking medications D1 and D3 and as well astheir respective LEDD values. For visit 2 we would record that the therapy consisted ofmedications D2 and D3, etc.

26 Chapter 3. Parkinson’s Disease Data
Figure 3.1: Example of Parkinson’s disease patient therapy modifications between visits 1and 4. The blue line presents the linear timeline, while points V1, V2, V3, and V4 presentfour consecutive visits to the clinician when the MDS-UPDRS questionnaire is adminis-tered. The red lines present the duration of intake for each antiparkinson medication, whilethe line width presents the dosage of the medication.

27
Chapter 4
Descriptive Rule Learning
Rule learning algorithms typically proceed in two phases: rule refinement selects termsfor specializing the rule, and rule selection selects the final rule among several candidates.While most conventional algorithms use the same heuristic in both phases, recent research(Stecher et al., 2014) indicates that two separate heuristics improve the coverage of posi-tive examples, and may result in better classification accuracy. This chapter presents andevaluates two new beam search rule learning algorithms: DoubleBeam-SD for subgroupdiscovery and DoubleBeam-RL for classification rule learning. The algorithms use twoseparate beams and can use different heuristics in the rule refinement and rule selectionphase. The chapter is divided into two sections. We first introduce the problem descrip-tion and then present the published Expert Systems with Applications journal paper thataddresses the described problem.
4.1 Problem Description
Most data mining techniques aim at optimizing the predictive performance of the inducedmodels. However, in order for these models to be utilized by an expert system or to offerdecision support, their comprehensibility is of the ultimate importance. For example, inmedical applications, clinicians are interested in the symptoms, conditions, and circum-stances causing a certain recommendation. Other examples of application areas in need oftransparent models include law, finance and knowledge discovery (Bibal & Frénay, 2016).
Rule learning is a symbolic data analysis technique that can construct comprehensiblemodels or patterns describing the data (Clark & Niblett, 1989; Fürnkranz et al., 2012;Michalski, 1969). Compared to statistical learning techniques, the key advantage of rulelearning is its simplicity and humanly comprehensible outputs, therefore, the developmentof new rule learning algorithms for constructing understandable models and patterns is ofgreat interest of the data mining community.
Classification rule learning is a technique for predictive induction. Models consist of IF-THEN rules covering the entire problem space. The rule generation process is performed onthe labeled data with the intention to construct rules with high predictive power, coveringas many as possible positive examples and as few as possible negative examples. Contraryto classification rule learning, subgroup discovery (Atzmüller, 2015; Klösgen, 1996; Wrobel,1997) is a descriptive induction technique where the ultimate goal is to induce individualrules describing interesting subgroups which have a significantly different class distributionto that of the entire population (Klösgen, 1996; Wrobel, 1997). Models are generated onthe labeled data, however, they consist only of rules describing the properties of individualgroups of target class instances.
A common property of classification rule learning and subgroup discovery is the rule

28 Chapter 4. Descriptive Rule Learning
construction process. In both cases, rule construction is performed in two phases: the rulerefinement and the rule selection phase. Typically, different types of heuristics are usedfor classification rule induction and subgroup induction. Researchers usually choose oneheuristic and use the same heuristic in the two phases of the rule construction process:(i) a heuristic is used to evaluate rule refinements, i.e. to select which of the refinements(specializations) of the current rule will be further explored, and (ii) the same heuristic isused in rule selection to decide which of the constructed rules will be added to the rule set.
Since one of the goals of rule learning is to optimize the predictive performance ofconstructed rules, heuristics used in the rule construction process are customized andadapted for the selection phase. Given the different natures of the refinement and selectionphase, this practice may not fully take advantage of each phase and not lead to the bestdiscovered rules. Stecher et al. (2014) described this divergence and proposed to useseparate heuristics for each of the two rule construction phases. They suggested that inthe refinement phase, so-called inverted heuristics should be used for evaluating the relativegain obtained by refining the current rule. The key idea of these heuristics is that whilemost conventional rule learning heuristics, such as the Laplace or the m-estimate, anchortheir evaluation on the empty rule that covers all examples, inverted heuristics anchorthe point of view on the base rule, which is more appropriate for a top-down refinementprocess. In terms of the formulas for the conventional rule learning heuristics, it meansthat the values of P and N are constant and denote the total number of positive andnegative examples in the data set. In the inverted heuristics setup, these values change,and represent the number of positive and negative examples covered by the parent rule ofthe rule that is being evaluated.
The introduction of separate heuristics that take full advantage of the different naturesof the rule construction phases can lead towards discovering better rules in terms of theirclassification power and their coverage. Stecher et al. (2014) mention that longer rules arean expected side effect of using inverted heuristics in the refinement phase which might bewelcome in the analysis of medical data, as longer rules have a greater descriptive powerand are preferred in some application areas such as medicine.
We explored the possibility of separating the phases of the rule learning process in twosettings: classification rule learning and subgroup discovery. We propose two new algo-rithms, the DoubleBeam-RL algorithm for classification rule learning and the DoubleBeam-SD algorithm for subgroup discovery. The separation of the refinement and selection phasein the rule learning process was done two-fold by introducing separate heuristics and usingseparate beams for rule refinement and selection.
The introduction of two beams in the rule learning process effectively widens the searchspace and allows the algorithms to construct and detect rules which could be overlookedotherwise. This separation keeps track of the set of rules which may have low selectivequality—they cover some negative examples, but have high refinement quality—rule alsohas a high coverage of positive examples. It also keeps track of rules that have very highselective quality but only cover a fraction of positive examples. By keeping track of thebest rules for both refinement and selection we extend the possibility that by the end ofthe search process the algorithm will find rules of better quality.
We compare the performance of the DoubleBeam-RL algorithm and the DoubleBeam-SD algorithm to their state-of-the-art counterparts. In order to omit any bias introducedby the algorithms’ parameters, we introduce a double-loop approach for parameter setting.In the classification rule learning setting, the experimental results confirm previously shownbenefits of using two separate heuristics for rule refinement and rule selection. In subgroupdiscovery, DoubleBeam-SD algorithm variants outperform several state-of-the-art relatedalgorithms.

4.2. Related Publication 29
4.2 Related Publication
The rest of this chapter presents the Expert Systems with Applications journal paper.
Publication related to this contribution
Journal Paper
Valmarska, A., Lavrač, N., Fürnkranz, J., & Robnik-Šikonja, M. (2017). Refinement andselection heuristics in subgroup discovery and classification rule learning. Expert Sys-tems with Applications, 81, 147–162. doi:10.1016/j.eswa.2017.03.041
This publication contains the following contributions:
• We present an overview of existing algorithms for classification rule learning andsubgroup discovery.
• We present the process of rule learning in the coverage space and motivate the sep-aration of the refinement and selection phase of the learning phases.
• We present the DoubleBeam-RL algorithm for classification rule learning and empir-ically compare its performance to the performance of the CN2 algorithm (Clark &Niblett, 1989), the Ripper algorithm (Cohen, 1995), and the best performing algo-rithm from (Stecher et al., 2014).
• We show that our algorithm performs comparably to its state-of-the-art counterparts.
• We confirm the advantage of separating the learning phases in both the classificationrule learning setting as well as in the subgroup discovery setting.
• We present the DoubleBeam-SD algorithm for subgroup discovery and present threeapproaches for instance weighting.
• We compare its performance to the SD algorithm (Gamberger & Lavrač, 2002), theCN2-SD algorithm (Lavrač et al., 2004), and the APRIORI-SD algorithm (Kavšeket al., 2003). We empirically show that the DoubleBeam-SD algorithm performscomparably to the considered state-of-the-art algorithms for subgroup discovery. Wealso show that a variant of this algorithm produces rules that are statistically moreunusual than the rules generated by the SD and the APRIORI-SD algorithm.
The authors’ contributions are as follows. The algorithms were designed and developedby Anita Valmarska with the insights from Marko Robnik-Šikonja. Anita Valmarska im-plemented the algorithms and performed the experimental work. Marko Robnik-Šikonjainitiated the idea for double-loop cross-validation determination of default parameters andsupervised the implementation of the algorithms. Nada Lavrač directed our attention to-wards the work of Stecher et al. (2014) and motivated the usage of inverted heuristics in therule learning process. Johannes Fürnkranz provided helpful insights into the performanceof the algorithms. All authors contributed to the text of the manuscript.


Expert Systems With Applications 81 (2017) 147–162 Contents lists available at ScienceDirect
Expert Systems With Applications journal homepage: www.elsevier.com/locate/eswa
Refinement and selection heuristics in subgroup discovery and classification rule learning Anita Valmarska a , b , ∗, Nada Lavra c a , b , c , Johannes Fürnkranz d , Marko Robnik-Šikonja e a Jožef Stefan Institute, Jamova 39, Ljubljana, Slovenia b Jožef Stefan International Postgraduate School, Jamova 39, Ljubljana, Slovenia c University of Nova Gorica, Vipavska 13, Nova Gorica, Slovenia d TU Darmstadt, Darmstadt, Germany e University of Ljubljana, Faculty of Computer and Information Science, Slovenia a r t i c l e i n f o Article history: Received 7 June 2016 Revised 17 March 2017 Accepted 18 March 2017 Available online 21 March 2017 Keywords: Rule learning Subgroup discovery Inverted heuristics
a b s t r a c t Classification rules and rules describing interesting subgroups are important components of descriptive machine learning. Rule learning algorithms typically proceed in two phases: rule refinement selects con- ditions for specializing the rule, and rule selection selects the final rule among several rule candidates. While most conventional algorithms use the same heuristic for guiding both phases, recent research in- dicates that the use of two separate heuristics is conceptually better justified, improves the coverage of positive examples, and may result in better classification accuracy. The paper presents and evaluates two new beam search rule learning algorithms: DoubleBeam-SD for subgroup discovery and DoubleBeam-RL for classification rule learning. The algorithms use two separate beams and can combine various heuris- tics for rule refinement and rule selection, which widens the search space and allows for finding rules with improved quality. In the classification rule learning setting, the experimental results confirm previ- ously shown benefits of using two separate heuristics for rule refinement and rule selection. In subgroup discovery, DoubleBeam-SD algorithm variants outperform several state-of-the-art related algorithms.
© 2017 Elsevier Ltd. All rights reserved. 1. Introduction
While most data mining techniques aim at optimizing predic- tive performance of the induced models, their comprehensibility is of ultimate importance for expert systems and decision support. Examples of application areas in need of transparent models in- clude medicine, law, finance and knowledge discovery ( Bibal & Fré- nay, 2016 ).
Rule learning is a symbolic data analysis technique that can be used to construct understandable models or patterns describing the data ( Clark & Niblett, 1989; Fürnkranz, Gamberger, & Lavra c, 2012; Michalski, 1969 ). As one of the standard machine learning techniques it has been used in numerous applications. Compared to statistical learning techniques, the key advantage of rule learn- ing is its simplicity and human understandable outputs. Therefore, the development of new rule learning algorithms for constructing
∗ Corresponding author. E-mail addresses: [email protected] (A. Valmarska), [email protected] (N. Lavra c), [email protected] (J. Fürnkranz),
[email protected] (M. Robnik-Šikonja).
understandable models and patterns is in the core interest of the data mining community.
Symbolic data analysis techniques can be divided into two cate- gories. Techniques for predictive induction produce models, typically induced from labeled data, which are used to predict the label of previously unseen examples. The second category consists of tech- niques for descriptive induction , where the aim is to find compre- hensible patterns, typically induced from unlabeled data. There are also descriptive induction techniques that learn descriptive rules from labeled data, which are referred to as supervised descriptive rule discovery techniques ( Kralj Novak, Lavra c, & Webb, 2009 ). Typi- cal representatives of these techniques are subgroup discovery (SD) ( Atzmueller, 2015; Klösgen, 1996; Wrobel, 1997 ), contrast set min- ing (CSM) ( Bay & Pazzani, 2001 ), and emerging pattern mining (EPM) ( Dong & Li, 1999 ) techniques. For instance, the task of sub- group discovery is to find interesting subgroups in the population, i.e. subgroups that have a significantly different class distribution than the entire population ( Klösgen, 1996; Wrobel, 1997 ). The re- sult of subgroup discovery is a set of individual rules, where the rule consequence is a class label.
An important characteristic of subgroup discovery is that its task is a combination of predictive and descriptive rule induction.
http://dx.doi.org/10.1016/j.eswa.2017.03.041 0957-4174/© 2017 Elsevier Ltd. All rights reserved.
4.2. Related Publication 31

148 A. Valmarska et al. / Expert Systems With Applications 81 (2017) 147–162 It provides understandable descriptions of subgroups of individu- als which share a common target property of interest. This fea- ture of subgroup discovery has inspired many researchers to in- vestigate new methods that will be more effective in finding inter- esting patterns in the data. Most subgroup discovery approaches build on classification algorithms, e.g., EXPLORA ( Klösgen, 1996 ), MIDOS ( Wrobel, 1997 ), SD ( Gamberger & Lavra c, 2002 ), CN2- SD ( Lavra c, Kavšek, Flach, & Todorovski, 2004 ), and RSD ( Lavra c, Železný, & Flach, 2002 ), or on algorithms for association rule learn- ing, e.g., APRIORI-SD ( Kavšek, Lavra c, & Jovanoski, 2003 ), SD-MAP ( Atzmüller & Puppe, 2006 ), and Merge-SD ( Grosskreutz & Rüping, 2009 ).
The main difference between classification rule learning and subgroup discovery is that subgroup discovery algorithms con- struct individual rules describing the properties of individual groups of target class instances, while classification rule learning algorithms construct a set of classification rules covering the en- tire problem space.
A common property of classification rule learning and subgroup discovery is that rule construction is performed in two phases: the rule refinement and the rule selection phase. Typically, different types of heuristics are used for classification rule induction and subgroup induction. Researchers usually choose one heuristic and use the same heuristic in the two phases of the rule construction process: (i) a heuristic is used to evaluate rule refinements , i.e. to select which of the refinements (specializations) of the current rule will be further explored, and (ii) the same heuristic is used in rule selection to decide which of the constructed rules will be added to the rule set. For learning classification rules, Stecher, Janssen, and Fürnkranz (2014) proposed to use separate heuristics for each of the two rule construction phases, and suggested that in the refine- ment phase, so-called inverted heuristics should be used for eval- uating the relative gain obtained by refining the current rule. The key idea of these heuristics is that while most conventional rule learning heuristics, such as the Laplace or the m -estimate, anchor their evaluation on the empty rule that does not cover any exam- ples, inverted heuristics anchor the point of view on the base rule, which is more appropriate for a top-down refinement process.
In this paper, we test the utility of inverted heuristics in the context of subgroup discovery as well as in the context of clas- sification rule learning. For this purpose we have developed two new beam search rule learning algorithms, named DoubleBeam- SD for subgroup discovery and DoubleBeam-RL for classification rule learning, respectively. The algorithms allow to combine vari- ous heuristics for rule refinement and rule selection, with the goal of determining their optimal combination, and, in consequence, learn rules with better coverage and better descriptive power with- out compromising rule accuracy. The introduction of two separate beams enlarges the search space, enabling the learner to find rule sets that are more accurate as well as more interesting to the end user. For example, physicians appreciate rules that are highly accu- rate when used in patient classification, but prefer understandable rules that precisely characterize the patients in terms of the fea- tures that distinguish the patients from the control group.
We compare the double beam search algorithms to state-of-the- art subgroup discovery and rule learning algorithms by experimen- tally evaluating them on the UCI data sets, using the same data sets as in previous research of Stecher et al. (2014) . All the com- petitors are used with their default parameters from their corre- sponding software platforms. In order to determine useful default configurations for our algorithms, we employ a data set hold-out methodology for parameter setting with the goal of finding the op- timal configuration without tuning the algorithms to a particular data set.
The rest of this paper is organized as follows. Section 2 pro- vides the necessary background on rule learning and subgroup dis-
covery, followed by the introduction of the coverage space and an illustrative example, explaining the advantages of using inverted heuristics in rule refinement. It also summarizes the findings of Stecher et al. (2014) concerning the use of inverted heuristics in rule learning. Section 3 is concerned with subgroup discovery pre- senting the DoubleBeam-SD algorithm and its variants, followed by a description of the experimental setting and the obtained re- sults. Section 4 outlines the DoubleBeam-RL algorithm for classifi- cation rule learning, followed by a description of the experimen- tal setting, and the presentation of experimental results. Finally, Section 5 presents the conclusions and ideas for further work. 2. Rule learning: background and related work
Rule learning is a standard symbolic data analysis technique used for constructing understandable models and patterns. Its main advantage over the other data analysis techniques is its sim- plicity and comprehensibility of its outputs. Rule learning has been extensively used both in predictive and descriptive rule learning settings, where by applying different rule evaluation heuristics dif- ferent trade-offs between the consistency and coverage of con- structed rules can be achieved.
This section first presents a short overview of classification rule learning and subgroup discovery. It introduces the coverage space used as a tool for studying the properties of different heuristics and presents the idea of using two separate heuristics for rule re- finement and rule selection illustrated on a selected UCI data set. The section ends with the description of closely related work re- garding the use of inverted heuristics in classification rule learning. 2.1. Classification rule learning
The task of classification rule learning is to find models which would ideally be complete (cover all positive examples, or at least most of the positives), and consistent (not cover any negative ex- amples, or at most a very small number of negatives). Multi-class classification problems can be dealt with by using the one-versus- all approach, which learns one rule set for each class, where the examples labeled with the chosen class are considered as positive target class examples, and all examples of other classes as nega- tives.
There are numerous classification rule learning algorithms, the most popular being AQ, CN2 and Ripper. The AQ algorithm ( Michalski, 1969 ), which was the first to propose the covering al- gorithm for rule set construction, is a top-down beam search algo- rithm that uses a random positive example as a seed for finding the best rule. The CN2 algorithm ( Clark & Niblett, 1989 ) combines the ideas from the AQ algorithm and the decision tree learning al- gorithm ID3 ( Quinlan, 1983 ), given the similarity of rule learning to learning decision trees, where each path from the root of the tree to a tree leaf can be viewed as a separate rule. It constructs an ordered decision list by learning rules describing the majority class examples in the training set. Once the learned rule is added to the decision list, all the covered examples, both positive and negative, are removed from the training data set, and the rule in- duction process is continued on the updated training set. Ripper ( Cohen, 1995 ) is the first rule learning algorithm that effectively overcomes the overfitting problem and is thus a very powerful rule learning system. The algorithm constructs rule sets for each of the class values. Initially, the training data set is divided into a growing and a pruning set. Rules are learned on the growing set, and then pruned on the pruning set by incrementally reducing the error rate on the pruning set. A pruned rule is added to the rule set if the description length of the newly constructed rule set is at most d bits longer (a parameter) than the already induced rule set. Oth- erwise, the rule learning process is stopped. Similarly to the CN2
32 Chapter 4. Descriptive Rule Learning

A. Valmarska et al. / Expert Systems With Applications 81 (2017) 147–162 149 Table 1 Comparison of the DoubleBeam-RL algorithm to the state-of-the-art classification rule learners CN2, Ripper and SC-ILL.
Algorithm Type of search Separate refinement heuristic Stopping criterion Rule pruning Post-processing CN2 Beam No No beam improvement No No Ripper Greedy No MDL Yes Yes SC-ILL Greedy Yes No negative examples covered No No DoubleBeam-RL Beam Yes maxSteps No No
algorithm, when a new rule is added to the rule set, all the in- stances covered by that rule are removed from the growing set. In addition to pruning the rules before adding them to induced rule set, Ripper prevents rules overfitting in a post-processing phase in which the learned rule set is optimized and the selected rules are re-learned in the context of the other rules. FURIA ( Hühn & Hüller- meier, 2009 ) is a classification rule learning algorithm which ex- tends the Ripper algorithm by learning fuzzy rules.
Despite its long history, rule learning is still actively researched and routinely applied in practice. For example, Napierala and Ste- fanowski (2015) use rule learning with argumentation to tackle im- balanced data sets, and Ruz (2016) explores the order of instances in seeding rules to improve the classification accuracy. Minnaert, Martens, De Backer, and Baesens (2015) discuss the importance of proper rule evaluation measures for improving the accuracy of classification rule learning algorithms. They also introduce multi- criteria learning and investigate a Pareto front as a trade-off be- tween comprehensibility and accuracy of rule learners.
In a line of research started by Parpinelli, Lopes, and Freitas (2002) , rule learning is turned into an optimization problem us- ing an ant colony optimization approach. The initial rule learning algorithm, named Ant-Miner, worked for nominal attributes only, but was later improved by Pi culin and Robnik-Šikonja (2014) to ef- ficiently handle numeric attributes. Classification rule learning has been a vivid topic of research also in inductive logic programming and relational data mining. For example, Zeng, Patel, and Page (2014) developed the QuickFOIL algorithm that improves over the original FOIL algorithm ( Quinlan & Cameron-Jones, 1993 ).
Learning rules can be regarded as a search problem ( Mitchell, 1982 ). Search problems are defined by the structure of the search space, a search strategy for searching through the search space, and a quality function (a heuristic ) that evaluates the rules in or- der to determine whether a candidate rule is a solution or how close it is to being a solution to be added to the rule set, i.e. the final classification model. The search space of possible solutions is determined by the model language bias ( Fürnkranz et al., 2012 ). In propositional rule learning, the search space consists of all the rules of the form targetClass ← Conditions , where targetClass is one of the class labels, and Conditions is a conjunction of features. Fea- tures have the form of A i = v i j (attribute A i has value v ij ).
For learning a single rule, most learners use one of the fol- lowing search strategies: general-to-specific ( top-down hill-climbing ) or specific-to-general ( bottom-up ), where the former is more com- monly used. Whenever a new rule is to be learned, the learning algorithm initializes it with the universal rule r ⊤ . This is an empty rule that covers all the examples, both positive and negative. In the rule refinement phase, conditions are successively added to this rule, which decreases the number of examples that are covered by the rule. Candidate conditions are evaluated with the goal of increasing the consistency of the rule while maintaining its com- pleteness, i.e. a good condition excludes many negative examples and maintains good coverage on the positive examples.
Heuristic functions are used in order to evaluate and com- pare different rules. Different heuristics implement different trade- offs between these two objectives. While CN2 and Ripper use en- tropy as the heuristic evaluation measure, numerous other heuris- tic functions have been proposed in rule learning—for a variety of
heuristics and their properties the interested reader is referred to Fürnkranz et al. (2012) . The most frequently used heuristics in rule learning are:
Precision: h prec (p, n ) = p
p + n (1) Laplace:
h lap (p, n ) = p + 1 p + n + 2 (2)
m-estimate: h m-est (p, n, m ) = p + m · P
P+ N p + n + m (3)
where, for a given rule, arguments p and n denote the number of positive and negative examples covered by the rule (i.e. the true and false positives, respectively), and P and N in Eq. (3) denote the total number of positive and negative examples in the data set. Given that these heuristics concern the problem of selecting the best of multiple refinements of the same base rule (the empty rule, universal rule), the values P and N can be regarded as constant, so that the above functions may be written as h ( p, n ) depending only on the true and false positives.
Table 1 compares the DoubleBeam-RL classification rule learn- ing algorithm (introduced in Section 4 ) to the state-of-the-art clas- sification rule learners that were used in the experiments. CN2 and DoubleBeam-RL are beam search algorithms, while Ripper and SC- ILL are greedy algorithms, adding conditions to the rules which maximize their respective heuristics. The DoubleBeam-RL and SC- ILL algorithms use separate heuristics adapted for the refinement and selection phase of the rule learning process. Ripper is the only considered classification rule learning algorithm which em- ploys rule pruning and optimization of rule sets in post-processing. The algorithms use different stopping criteria; for example, Ripper uses a heuristic based on minimum description length (MDL) prin- ciple. 2.2. Subgroup discovery
The goal of data analysis is not only building prediction mod- els, but frequently the aim is to discover individual patterns that describe regularities in the data ( Fürnkranz et al., 2012; Kralj No- vak, Lavra c, Zupan, & Gamberger, 2005; Wrobel, 1997 ). This form of data analysis is used for data exploration and is referred to as descriptive induction . Subgroup discovery is a form of descriptive induction. The task of subgroup discovery is to find subgroups of examples which are sufficiently large while having a significantly larger distribution of target class instances than the original target class distribution.
Like in classification rule learning, individual subgroup descrip- tions are represented as rules in the form targetClass ← Conditions , where the targetClass is the target class representing the property of interest, and Conditions is a conjunction of features that are characteristic for a selected group of individuals.
Subgroup discovery is a special case of the more general task of rule learning. Classification rule learners have been adapted
4.2. Related Publication 33

150 A. Valmarska et al. / Expert Systems With Applications 81 (2017) 147–162 Table 2 Some properties of subgroup discovery algorithms DoubleBeam-SD, APRIORI-SD, SD, and CN2-SD.
Algorithm Type of search Separate refinement heuristic Stopping criterion Post-processing APRIORI-SD Exhaustive No minSup, minConf Yes SD Beam No No beam improvement Yes CN2-SD Beam No No beam improvement No DoubleBeam-SD Two beams Yes maxSteps Optional
to perform subgroup discovery with heuristic search techniques drawn from classification rule learning. These algorithm also ap- ply constraints, which are appropriate for descriptive rule learning. The research in the field of subgroup discovery has developed in different directions. Exhaustive methods, which include EXPLORA ( Klösgen, 1996 ), SD-MAP ( Atzmüller & Puppe, 2006 ) and APRIORI- SD ( Kavšek et al., 2003 ), guarantee the optimal solution given the optimization criterion. The APRIORI-SD algorithm draws its inspira- tion from the association rule learning algorithm APRIORI ( Agrawal & Srikant, 1994 ), but restricts it to constructing rules that have only the target variable (the property of interest) in their head, with weighted relative accuracy (WRACC), defined in Eq. (5) , used as a measure of rule quality. In order to improve the inferential power of the subgroup describing rules, the APRIORI-SD algorithm uses a post-processing step to reduce the generated rules to a relatively small number of diverse rules. This reduction is performed using the weighted covering method proposed by Gamberger and Lavra c (20 0 0) . When a rule is added to the induced rule set, weights of examples covered by the rule are decreased. This allows the method to prioritize rules which cover yet uncovered examples, thus promoting the coverage of diverse groups of examples.
While the APRIORI-SD algorithm adapts the process of associa- tion rule learning to the context of subgroup discovery, the SD sub- group discovery algorithm ( Gamberger & Lavra c, 2002 ) performs heuristic beam search, where rule quality is estimated using the generalization quotient heuristic h g (p, n, g) = p
n + g , (4) where p is the number of true positives, n is the number of false positives , and g is the generalization parameter . High-quality rules will cover many target class examples and a low number of non- target examples. The number of tolerated non-target examples cov- ered by a rule is regulated by the generalization parameter. For small g , more specific rules are generated while for bigger values of g the algorithm constructs more general rules. The interpreta- tion of the rules produced by the SD algorithm is improved using the above mentioned weighted covering method in post-processing ( Gamberger & Lavra c, 20 0 0 ).
CN2-SD ( Lavra c et al., 2004 ) is a beam search algorithm, which adapts the CN2 ( Clark & Niblett, 1989 ) classification rule learner to subgroup discovery. CN2-SD has introduced a weighted covering algorithm, where examples that have already been covered by one of the learned rules are not removed from the training data set, but instead their weights are decreased. The authors propose and compare different measures for rule evaluation. They argue that the most important measure for subgroup evaluation is weighted relative accuracy (WRACC), referred to as unusualness , defined as follows WRACC (p, n ) = p + n
P + N ·!
p p + n − P
P + N "
(5) This measure reflects both the rule significance and rule coverage, as subgroup discovery is interested in rules with significantly dif- ferent class distribution than the prior class distribution that cover many instances. WRACC is the measure of choice in our experi- mental work on subgroup discovery for comparing the quality of the induced subgroup describing rules.
Subgroup discovery was used also in the context of seman- tic data mining. Adhikari, Vavpeti c, Kralj, Lavra c, and Hollmén (2014) have explained mixture models by applying semantic sub- group discovery system Hedwig ( Vavpeti c, Novak, Gr car, Mozeti c, & Lavra c, 2013 ) to structure the search space and to formulate gen- eralized hypotheses by using concepts from the given domain on- tologies.
Table 2 compares the DoubleBeam-SD algorithm (introduced in Section 3 ) to the state-of-the-art subgroup discovery algorithms APRIORI-SD, CN2-SD, and SD, which were used in the experiments. The latter algorithms use only a single heuristic for rule evaluation, designed to optimize the selection of best rules. The DoubleBeam- SD algorithms can use pairs of different heuristics (see Section 2.4 ) which can be applied to estimate rule quality in both the re- finement and selection phases of the rule learning process. The DoubleBeam-SD algorithm stops the learning process after a pre- determined number of steps ( maxSteps ). The SD and CN2-SD algo- rithms stop when there are no improvements of rules in the beam, i.e. when newly induced rules have lower quality than the rules al- ready included in the beam. APRIORI-SD uses minimal support and coverage as the stopping criteria. 2.3. Coverage space
Fürnkranz and Flach (2005) introduced the coverage space as a formal framework for analyzing and visualizing the behavior of rule learning heuristics. The coverage space ( Fürnkranz & Flach, 2005; Fürnkranz et al., 2012 ), referred to as the PN space when initially introduced by Gamberger and Lavra c (2002) , enables us to plot the number of covered positive examples (true positives p ) over the number of covered negative examples (false positives n ). This results in a rectangular plot with values {0,1,... , N } (where N is the total number of negative examples) on the horizontal axis and {0,1,... , P } (where P is the total number of positive examples) on the vertical axis. Fig. 1 shows a coverage space visualization. The principle of coverage spaces can be used to plot individual rules, as well as entire theories or models composed of a rule set or a decision list.
There are four points of special interest in a coverage space: - (0, 0) marks the empty theory , denoted by r ⊥ . This theory covers
no positive and no negative example. - (0, P ) is the perfect theory which covers all positive and none of
the negative examples. - ( N , 0) is the opposite theory . It covers all negative, but no posi-
tive examples. - ( N, P ) is the universal theory , denoted by r ⊤ . This theory covers
all the examples, regardless of their label. The ultimate goal of learning is to reach the point of perfect
theory in the coverage space, i.e. the point (0, P ). This will rarely be achieved in a single step. A set of rules will need to be constructed in order to achieve this objective. The purpose of heuristics used for rule evaluation is to determine how close a given rule is to this ideal point.
An isometric of a heuristic h is a line (or curve) in the coverage space that connects all points ( p, n ) for which h(p , n) = c for some constant value c . Several properties of heuristics can be seen from
34 Chapter 4. Descriptive Rule Learning

A. Valmarska et al. / Expert Systems With Applications 81 (2017) 147–162 151
Fig. 1. Visualization of coverage space with P (total of positives) and N (total of negatives).
Fig. 2. Isometrics for precision. isometrics. As an example, Fig. 2 shows the isometrics of precision, h prec . These isometrics show that regarding precision all rules that cover only positive examples (points on the P -axis) achieve the best quality score, and all rules that cover only negative examples (points on the N -axis) achieve zero score. All other isometric val- ues are obtained by rotation around the origin (0, 0) for which the value of h prec is undefined. Fig. 2 presents also the disadvantage of precision, which is its inability to discriminate between rules with high and low coverage. For illustration, a rule that covers only one positive example and no negative example will have better evalua- tion than a rule that covers a hundred positive examples and only one negative example.
The commonly used top-down strategy for rule refinement can be viewed as a path through the coverage space. Fig. 3 illustrates rule refinement, where each point on the path corresponds to one further condition conjunctively added to the rule body. The path starts at the upper right corner, ( N, P ), with the universal rule r ⊤ . By adding conditions to the rule, the number of covered positive and negative examples decreases and the path of the rule contin- ues towards the origin (0, 0), which corresponds to the empty rule r ⊥ . 2.4. Inverted heuristics
Rule learning algorithms rely on heuristic measures to deter- mine the quality of the induced rules. Stecher et al. (2014) propose to distinguish between rule refinement and rule selection heuris- tics in inductive rule learning. They argue that the nature of the separate-and-conquer rule learning algorithms opens up a possi- bility to use two different heuristics in the two fundamental steps of the rule learning process, i.e. rule refinement and rule selec- tion. Using the coverage space they motivate separate evaluation of candidates for rule refinement and the selection of rules for the
final theory. Stecher et al. (2014) further argue that the rule refine- ment step in a top-down search requires inverted heuristics , which can result in better rules. Such heuristics evaluate rules from the point of the current base rule, instead of the empty rule. In this way, while successively adding features to the rule (refinement), the learner favours rules with higher coverage of positive exam- ples and thereby gives chance to rules with higher coverage to be finally selected with the selection heuristics.
Representations of the inverted heuristics in the coverage space reveal the following relationship with the basic heuristic:
(6) where p and n denote the number of positive and negative exam- ples covered by the rule, and P and N are not constant but depend on the predecessor of the currently constructed rule. For example, in the example illustrated in Fig. 5 , in the first step N and P cor- respond to the initial top-right corner ( N, P ) in the coverage space, but when refined to rule p ← a , the top-right corner is moved to point B . The values of N and P will change respectively. Addition- ally, on the refinement path, N and P will be updated with the ( N, P ) coordinates of values of point C, D , and E , respectively in each next refinement iteration. Each of these points represent the base rule from which we observe the improvements of the consequent refinements.
Stecher et al. (2014) adapt the three standard heuristics for rule induction (introduced in Section 2.1 ): precision, Laplace , and m- estimate . The effect on these three heuristics is that the isometrics of their inverted variants do not rotate around the origin of the coverage space, but rotate around the point in the coverage space representing the base rule (the predecessor of the currently con- structed rule). Consequently, the inverted heuristics have the fol- lowing forms:
Inverted precision: (7)
Inverted Laplace:
(8) Inverted m-estimate:
(9) The inverted heuristics are not suited for rule selection. They
do favor rules with high coverage but are also tolerant to covering
4.2. Related Publication 35

152 A. Valmarska et al. / Expert Systems With Applications 81 (2017) 147–162
Fig. 3. A path in the coverage space of a top-down specialization of a single rule. For simplicity, a comma is used to represent the conjunction operator.
Fig. 4. Isometrics of inverted precision. negative examples. The isometrics of inverted precision in Fig. 4 illustrate this propery.
For classification rule learning, Stecher et al. (2014) have shown that the combination of Laplace heuristic h lap used in the rule se- lection step and the inverted Laplace heuristic used in the rule refinement step outperformed other combinations in terms of average classification accuracy. An interesting side conclusion from Stecher et al. (2014) is that the usage of inverted heuristics in the rule refinement phase produces on average longer rules, which are claimed to be better for explanatory purposes.
We illustrate the advantage of using inverted heuristics in the refinement phase on the UCI ( Lichman, 2013 ) mushroom data set. In Fig. 5 we show the path in coverage space of top-down special- ization of two rules for the class poisonous using different heuris- tics. Table 3 shows the descriptions of the coverage space points shown in Fig. 5 . The red path shows the top-down specialization of a rule using the h lap heuristic. From all of the refinements of the universal rule, the refinement odor = f has the steepest gradi- ent from the origin (0, 0). Therefore, this rule is selected for further refinement. However, since the number of covered positive exam-
ples is n = 0 , the refinement process is terminated and the rule odor = f is also selected in the selection phase, covering 2160 pos- itive and no negative examples.
The green path shows the top-down specialization of a rule us- ing the heuristic. This heuristic prefers rules with high cov- erage of positive examples. It gives preference to rule refinements with the smallest angle between the line of the refinement and the horizontal axis, i.e. angles α, β , and γ in Fig. 5 . Top-down special- ization continues until there are no covered negative examples or there are no possible refinements. In Fig. 5 the refinement stops at point F , where rule veil-color = w, gill-spacing = c, bruises? = f, ring-number = o, stalk-surface-above-ring = k is constructed, cov- ering a total number of 2192 positive examples and no negative examples. Using only a single selection heuristics this rule would be preferred to the rule depicted with the red path, but it is not achievable as a different choice was made already in the first step.
In summary, inverted heuristics prefer rules with high cover- age of positive examples. The top-down specialization of a rule is steadily removing negative examples and some positive examples. This leaves the possibility that an additional refinement will con- struct a rule with the same or a higher number of covered positive examples than a rule constructed using a single heuristics which immediately maximizes its value. 2.5. Relation to previous work
Our work is closely related to previous work in rule learning and subgroup discovery. In particular, it explores the recommended approach by Stecher et al. (2014) for separation of rule refinement and rule selection and the use of different heuristics in the classi- fication rule learning context. While rule induction algorithms and subgroup discovery algorithms typically use the same heuristic for rule refinement and rule selection, Stecher et al. (2014) argued that the nature of the separate-and-conquer algorithms offers the pos- sibility of separating the two rule construction phases and their evaluation using two different heuristics.
Table 3 Description of coverage space points from Fig. 3 , illustrated on the mushroom data set, using target class p ( poisonous ).
Point Rule p n U p ← true. 3916 4208 A p ← odor = f. 2160 0 B p ← veil-color = w. 3908 4016 C p ← veil-color = w, gill-spacing = c. 3804 2816 D p ← veil-color = w, gill-spacing = c, bruises? = f. 3188 160 E p ← veil-color = w, gill-spacing = c, bruises? = f, ring-number = o. 3152 144 F p ← veil-color = w, gill-spacing = c, bruises? = f, ring-number = o, 2192 0
stalk-surface-above-ring = k.
36 Chapter 4. Descriptive Rule Learning

A. Valmarska et al. / Expert Systems With Applications 81 (2017) 147–162 153
Fig. 5. Comparison of rule refinement paths using standard heuristic and the inverted one. The red path shows rule constructed using h lap . The green path shows rule refinement using . (For interpretation of the references to colour in this figure legend, the reader is referred to the web version of this article.)
In this paper we investigate the separation of the rule refine- ment and rule selection phase in both subgroup discovery and classification rule learning. Along with the phase separation we in- troduce two beams, each consisting of the best rules according to the refinement and selection heuristic, respectively.
Contrary to the approach of Stecher et al. (2014) , where they compare the selection quality of the best rule refinement to the rule with the best selection quality, we compare the selection qual- ity of all refined candidate rules to the selection quality of the best rules for selection (current selection beam members). In this way we expand the space of possible candidates for selection and in- crease the possibility of choosing a candidate with good selection quality, which might have been omitted in the refinement phase using the Stecher et al. (2014) approach. Additionally, our algo- rithm for rule learning builds rule sets for each target class of a given data set. This is different from the approach taken in Stecher et al. (2014) where unordered decision lists are constructed.
This paper also significantly extends our previous work ( Valmarska, Robnik-Šikonja, & Lavra c, 2015 ), where we reported on the initial findings regarding the use of inverted heuristics in sub- group discovery. In this paper, we introduce an additional heuristic, WRACC, which consequently proves to improve over other heuris- tics in several settings. In addition, we propose a different ap- proach to algorithm comparison, by first determining the default parameters for each algorithm and then comparing the algorithms on new data sets, using the default parameters. The establishment of default parameters is valuable for future users of the algorithms, as it offers a solid starting point for their use. In addition to the subgroup discovery algorithm, in this paper we also introduce a novel classification rule learning algorithm based on double beam and compare it to the state-of-the-art rule learning algorithms. 3. DoubleBeam algorithm for subgroup discovery
The previously observed favorable properties of inverted heuris- tics in a classification setting provide a motivation to test the idea in the subgroup discovery context. For this purpose, we developed the DoubleBeam-SD subgroup discovery algorithm 1 , which com- bines separate refinement and selection heuristics with the beam
1 Code is available on github at https://github.com/bib3rce/RL _ SD .
search. In the same fashion, we integrated the beam search and two separate heuristics in the classification rule learning setting, which we discuss in Section 4 .
Contrary to conventional beam-search based algorithms such as CN2-SD ( Lavra c et al., 2004 ), the DoubleBeam-SD algorithm for subgroup discovery maintains two separate beams, the refinement beam and the selection beam . Upon initialization, each beam is filled with the best single-condition rules according to their refine- ment and selection quality, respectively. The algorithm then enters a loop. In each iteration, rules of the form targetClass ← Condi- tions from the refinement beam are refined by adding features to the Conditions part of the existing rules. The resulting new rules are added to the refinement beam, which is ordered according to the refinement quality. Newly produced rules are then evalu- ated according to their selection heuristic and the selection beam is updated with the rules whose selection quality is better than the selection quality of the rules already stored in the beam. The algorithm exits the loop after the maximally allowed number of steps is reached. Another purpose of storing several rules in the selection beam is to allow post-processing where only the non- redundant subset of rules is retained ( Gamberger & Lavra c, 2002 ). The DoubleBeam-SD algorithm is outlined in Algorithm 1 .
In order to induce descriptions for subgroups of data instances which have not yet been covered by the previously constructed rules, we employ weighted covering, which reduces the weight of covered positive examples but does not remove them entirely. This required a modification of the method for updating the se- lection beam. Each time a positive example is covered by a rule that is already in the selection beam, the instance coverage count is increased and consequently the instance weight is decreased, which results in reducing the probability that the covered exam- ples would be covered again by the rules constructed in the fol- lowing iterations of the algorithm.
In this work, we used the harmonic and geometric weights for instance weighting. We also implemented removal of the already covered positive instances by assigning weight 0 to every instance already covered by some rule in the selection beam (method zero weight ). Eqs. (10) –(12) show how the weight of a covered example is updated depending on the number of rules that cover it.
4.2. Related Publication 37

154 A. Valmarska et al. / Expert Systems With Applications 81 (2017) 147–162 Algorithm 1: DoubleBeam-SD algorithm.
Input: : E = P ∪ N E is the training set, | E| its size, tc is target class, P are positive examples (of class tc), N are negative examples (of classes = tc).
Output: : subgroup descriptions Parameters: : minSupport ,
rbw is refinement beam width, sbw is selection beam width, rh is refinement heuristic, sh is selection heuristic maxSteps is maximal number of steps
1 Cand id ateList ← all feature values or intervals 2 for each candidate in CandidateList do 3 evaluate candidate with rh 4 evaluate candidate with sh 5 end 6 sort Cand id ateList according to the rh 7 for i = 0 to rbw do 8 RB [ i ] ← Cand id ateList[ i ] 9 end
10 sort Cand id ateList according to the sh 11 for i = 0 to sbw do 12 SB [ i ] ← Cand id ateList[ i ] 13 end 14 step ← 1 15 do 16 refinedCandidates ← refine RB with Cand id ateList 17 replace RB with refinedCandidates using rh 18 updateSelectionBeam ( SB , refinedCandidates , sh ) 19 step ← step + 1 20 while step ≤ maxSteps ; 21 return SB
Geometric weight: w g (d i ) = αk , (10) where k is the number of rules that have already covered example d i ;
Harmonic weight: w h (d i ) = 1
k + 1 , (11) where k is the number of rules that have already covered example d i ;
Zero weight: w z (d i ) = 0 , (12) if example d i is covered by at least one rule in the selection beam.
The weighted value of positive examples covered by a rule r ( weighted number of true positives ) is calculated using Eq. (13) . wT P (r) = | E| #
i =1 w (d i ) · c $c = 1 if r covers d i ; c = 0 otherwise. (13)
Note that zero weight can be understood as removing covered positive examples from the data set. This is not the same as no weighting, which means that instances are retained in the data set. As we use the selection beam, which keeps all the interest- ing subgroups, and the algorithm takes care that beam entries are not duplicated, no weighting might be sufficient. However, a prac- tical reason to introduce instance weighting are possible redun- dancies in the attribute set. Without weighting we might get sev- eral different but redundant descriptions of the same instances in the beam, which unnecessary fill the beam and reduce the search space. The code of the updateSelectionBeam method is outlined in Algorithm 2 .
Algorithm 2: Method for updating the selection beam. 1 Method updateSelectionBeam( SB , refinedCandidates , sh )
// current data 2 cData ← P ∪ N
// candidates for selection 3 cs ← ∪ SB
// new selection beam 4 nSB ← {} 5 resetWeights ( cData ) 6 for i = 0 to sbw do 7 bestRule ← getBestRule ( cs , cData , sh ) 8 cs ← remove ( cs , bestRule ) 9 nSB { i } ← bestRule
10 cData ← updateWeights ( cData , bestRule ) 11 end 12 SB ← nSB
Function getBestRule returns the rule with the best selection quality on the data set with updated weights. The selection quality of a rule is calculated according to the chosen selection heuristics. Function updateWeights updates the weights of the covered pos- itive examples. The weights are updated according to the desired weight type i.e. geometric, harmonic or zero. 3.1. Experimental setting
For the purpose of algorithm evaluation, we use different com- binations of refinement and selection heuristics, constituting the following DoubleBeam subgroup discovery variants:
SD-ILL (Inverted Laplace, Laplace), using ( ) heuristics combination pair,
SD-IPP (Inverted Precision, Precision), using ( ), SD-IMM (Inverted M-estimate, M-estimate), using
( ), SD-IGG (Inverted Generalization quotient, Generalization quo-
tient), using ( ), SD-GG (Generalization quotient, Generalization quotient), using
(h g , h g ), and SD-WRACC (WRACC), using (h WRACC , h WRACC ) . For the purpose of annotation, we prefix the variants of our
DoubleBeam-SD with SD. The h g heuristic is the generalization quotient proposed in Gamberger and Lavra c (2002) ( Eq. 4 ), while
is its inverted variant defined as . The weighted relative accuracy (WRACC) heuristic is defined in Eq. (5) . It was in- troduced in Lavra c et al. (2004) to measure the unusualness of the induced subgroup describing rules. Note that WRACC is identical to its inverted variant ( Stecher et al., 2014 ).
We compare three state-of-the-art subgroup discovery al- gorithms (SD, CN2-SD, and APRIORI-SD) and the proposed DoubleBeam-SD algorithm with six combinations of refinement and selection heuristics (SD-ILL, SD-IPP, SD-IMM, SD-IGG, SD-GG, and SD-WRACC). We test the DoubleBeam-SD algorithm with each of the six combinations of refinement and selection heuristics, both with and without using the weighted covering algorithm, and with and without using rule subset selection in the post-processing step described in Gamberger and Lavra c (2002) . This resulted in 48 dif-
38 Chapter 4. Descriptive Rule Learning

A. Valmarska et al. / Expert Systems With Applications 81 (2017) 147–162 155 Table 4 Number of classes ( C ), examples ( E ), attributes ( A ), and features ( F ) of the 20 data sets used in the experiments.
Tuning data sets C E A F Evaluation data set C E A F breast-cancer 2 286 10 41 contact-lenses 3 24 5 9 car 4 1728 7 21 futebol 2 14 5 27 glass 7 214 10 31 ionosphere 2 351 35 157 hepatitis 2 155 20 41 iris 3 150 5 14 horse-colic 2 368 23 72 labor 2 57 17 42 hypothyroid 2 3163 26 60 mushroom 2 8124 23 116 idh 3 29 5 14 primary-tumor 22 339 18 37 lymphography 4 148 19 52 soybean 19 683 36 99 monk3 2 122 7 17 tic-tac-toe 2 958 10 27 vote 2 435 17 32 zoo 7 101 18 134 Table 5 Chosen variants of the DoubleBeam-SD algorithm. The overall rank is the rank of the algorithm among the 48 variants.
Heuristics combination Overall rank Average rank Post-processing Weight type WRACC 1 7 .30 No None IMM 2 7 .45 Yes None GG 3 8 .15 No None IGG 9 15 .50 No None ILL 14 19 .95 Yes None IPP 21 24 .45 No Zero
ferent combinations of the DoubleBeam-SD algorithm (6 refine- ment/selection combinations × 2 post-processing/no × 4 weight- ing/no).
We use SD, CN2-SD and APRIORI-SD implementations of al- gorithms that are available in the ClowdFlows platform ( Kranjc, Podpe can, & Lavra c, 2012 ). We use the same 20 UCI classification data sets as Stecher et al. (2014) (see Table 4 ). In order to deter- mine suitable settings, we randomly split the data sets into two groups: we use 10 randomly chosen data sets (shown on the left- hand side of Table 4 ) to determine default parameters of all com- peting methods, and the remaining 10 data sets (shown on the right-hand side of Table 4 ) to compare the best settings. The tun- ing of parameters is described in Section 3.2 , while the methods comparison is presented in Section 3.3 .
To compare the speed and scalability of the algorithms, we use the UCI adult data set which consists of 32,561 instances and 14 attributes. We do not use cross-validation on this data set but split it into training and test sets of different sizes. 3.2. Default parameter setting
We use the 10 left-hand side data sets from Table 4 for set- ting default parameters of the algorithms. The SD algorithm and the APRIORI-SD algorithm are both trained using rule subset se- lection in the post-processing step, as described in Gamberger and Lavra c (2002) . Originally, the CN2-SD algorithm does not use rule selection in the post-processing.
The algorithms are initially tested with 10-fold double-loop cross-validation on each of the 10 data sets used for parameter tuning (named tuning data sets in the rest of this paper). For each algorithm (both the newly proposed algorithms as well as the ex- isting algorithms SD, CN2-SD and APRIORI-SD), a grid of possible parameter values is set in advance. The value of minSup is set to 0.01. Each training set of a given cross-validation iteration is additionally split into an internal training and testing subset. For each algorithm, models were built using the internal training sub- set and the parameters from its own parameter grid. Parameters maximizing the value of unusualness of the produced subgroups on the internal test subest are then chosen for building a model using the whole training set. In the evaluation, we use the sub- group discovery evaluation statistics proposed in Kralj Novak et al.
Fig. 6. Nemenyi test on ranking of subgroup discovery algorithms regarding average WRACC values with a significance level of 0.05. (2005) (originally implemented in the Orange data mining environ- ment Demšar et al., 2013 ): coverage, support, size, complexity, signif- icance, unusualness (WRACC), classification accuracy , and AUC .
We compute average ranks of the 48 combinations of the DoubleBeam-SD algorithm with respect to the unusualness (WRACC) of the produced subgroup describing rules. For each com- bination of refinement and selection heuristics of algorithms de- scribed in Section 3.1 we chose the algorithm setting that had the best average ranking. The chosen algorithm settings are shown in Table 5 .
The default set of parameters for each algorithm consists of the parameters which were chosen in the 10-fold double-loop cross- validation testing phase. This default set of parameters is used for cross-validation testing of the subgroup discovery algorithms on the remaining 10 data sets. 3.3. Experimental results
The WRACC values obtained from the 10-fold cross-validation testing on the 10 evaluation data sets with selected default param- eters are shown in Table 6 . These values are averaged over all the classes for every particular data set.
The results of the Nemenyi test following the Friedman test for statistical significance of differences between average values of WRACC are shown in Fig. 6 . It is evident that SD-WRACC algorithm produces the most interesting subgroups, which are statistically more unusual than the ones produced by the two state-of-the-art algorithms, the SD algorithm and the APRIORI-SD algorithm. How- ever, there are no statistically significant differences between the
4.2. Related Publication 39

156 A. Valmarska et al. / Expert Systems With Applications 81 (2017) 147–162 Table 6 Ten-fold cross-validation WRACC results for subgroup discovery algorithms with default parameters. The best values for each data set are written in bold. We compare existing SD, CN2-SD and APRIORI-SD algorithms with the proposed DoubleBeam algorithms with different refinement and selection heuristics.
Data sets SD CN2-SD APRIORI-SD SD-ILL SD-IPP-w-z SD-IMM SD-WRACC SD-GG SD-IGG contact-lenses 0 .032 0 .071 0 .027 0 .039 0 .035 0 .021 0 .047 0 .081 0 .081 futebol 0 .0 0 0 0 .009 0 .005 0 .005 0 .003 0 .015 0 .0 0 0 0 .006 0 .005 ionosphere 0 .099 0 .111 0 .0 0 0 0 .083 0 .032 0 .105 0 .133 0 .105 0 .107 iris 0 .090 0 .200 0 .142 0 .159 0 .167 0 .146 0 .175 0 .148 0 .148 labor 0 .080 0 .102 0 .041 0 .081 0 .085 0 .085 0 .098 0 .095 0 .094 mushroom 0 .088 0 .163 0 .0 0 0 0 .133 0 .029 0 .134 0 .191 0 .146 0 .131 primary-tumor 0 .011 0 .009 0 .008 0 .006 0 .006 0 .017 0 .019 0 .014 0 .014 soybean 0 .025 0 .037 0 .0 0 0 0 .035 0 .036 0 .043 0 .037 0 .035 tic-tac-toe 0 .022 0 .021 0 .029 0 .024 0 .029 0 .024 0 .041 0 .028 0 .029 zoo 0 .037 0 .097 0 .0 0 0 0 .094 0 .065 0 .096 0 .100 0 .099 0 .094
Table 7 Performance comparison of subgroup discovery algorithms using WRACC score and average rule length (ARL) on the UCI adult data set. The data set is split in 70:30 ratio. Rules are induced using the default parameters.
Measure SD CN2-SD APRIORI-SD SD-ILL SD-IPP-w-z SD-IMM SD-WRACC SD-GG SD-IGG WRACC 0 .023 0 .043 0 .041 0 .011 0 .012 0 .028 0 .076 0 .025 0 .024 ARL 2 .800 2 .150 2 .700 2 .800 1 .300 2 .100 2 .100 2 .600 2 .500
Fig. 7. Nemenyi test on ranking of average rule sizes for subgroup discovery algo- rithms in the second experimental setting with a significance level of 0.05. Note that algorithms are ordered according to the average length of generated rules—
rank 1 would indicate the algorithm producing the longest rules. six chosen variants of the DoubleBeam-SD algorithm and the CN2- SD algorithm. The DoubleBeam-SD algorithm with the combina- tion (h g , h g ) produces statistically more unusual subgroups than the ones produced by the APRIORI-SD algorithm. The rest of the variants of the DoubleBeam-SD algorithm do not produce subgroup describing rules which are statistically more interesting than the ones produced by any of the tested algorithms.
Experimental results reveal that algorithms which use WRACC as their heuristic (the SD-WRACC algorithm and the CN2-SD algo- rithm) produce rules which describe more interesting subgroups. The underperformance of the other considered variants of the DoubleBeam-SD algorithm is due to their respective heuristics, which are specialized towards finding prediction rules and not un- usual rules.
The results of the Nemenyi test following Friedman test for statistical significance of differences of the average rule sizes are shown in Fig. 7 . The DoubleBeam-SD algorithm with the combina- tion (h g , h g ) produces subgroups which are on average described by the longest rules. The SD-GG algorithm generates subgroups de- scribed by rules that are statistically longer only than the ones pro- duced by the SD algorithm and the SD-IPP algorithm with zero- weight covering. There is no statistical evidence that the SD-GG algorithm produces longer rules than other evaluated algorithms. Consequently, these results do not confirm that the DoubleBeam- SD algorithm with inverted refinement heuristic produces statisti- cally longer subgroup descriptions than all other subgroup discov- ery algorithms. This is slightly surprising taking into account the findings of Stecher et al. (2014) in the classification rule learning setting.
Table 7 presents the performance of subgroup discovery algo- rithms on the adult data set in terms of their WRACC score. We split the data set in the 70:30 ratio, leading to 22,793 training and 9768 testing instances. The SD-WRACC algorithm produced the most interesting rules, followed by the CN2-SD algorithm. The re- sults are in accordance with the results presented in Fig. 6 . The al- gorithms SD-ILL, SD, APRIORI-SD and SD-GG generated the longest rules; the SD-ILL and SD-GG algorithms produced the longest rules also on data sets from Fig. 7 .
Fig. 8 presents the training times of subgroup discovery algo- rithms with different numbers of training instances from the adult data set. The APRIORI-SD algorithm is the slowest, followed by the SD-IPP-w-z and CN2-SD algorithms. The other subgroup discovery algorithms are comparable in terms of training time and allow for processing of relatively large data sets.
To the users of subgroup discovery algorithms we recommend the use of the SD-WRACC algorithm with the selection beam width set to 5, and no example weighting or post-processing. Results show that this algorithm on average outperforms other subgroup discovery algorithms considered in this work. 4. DoubleBeam algorithm in classification rule learning
The idea of using two separate heuristics for rule refinement and selection as well as using inverted heuristics in refinement phase was proposed and successfully tested by Stecher et al. (2014) . The previous section shows that this idea can also be suc- cessful in subgroup discovery, where we tested it using a double beam search approach. As Stecher et al. (2014) do not use beam search in rule learning, an obvious extension is to use double beam also in classification rule learning.
In order to test the influence of different selection heuris- tics, refinement heuristics, selection beam width, and refinement beam width, we implemented a DoubleBeam classification rule learning (DoubleBeam-RL) algorithm. This algorithm is adaptation of the DoubleBeam-SD algorithm. It uses a combination of re- finement and selection heuristics for each phase of rule learn- ing. The algorithm has two beams, the selection beam and the refinement beam, where during the process of generating rules it holds potential candidates for refinement and selection, based on their selection and refinement quality. For learning a decision list, it employs the commonly used separate-and-conquer strategy ( Fürnkranz, 1999 ): each time a rule is generated for a given target
40 Chapter 4. Descriptive Rule Learning

A. Valmarska et al. / Expert Systems With Applications 81 (2017) 147–162 157
Fig. 8. Comparison of training times for subgroup discovery on the adult data set. The horizontal axis shows the number of training instances and the vertical axis shows the training time in seconds. class, the positive examples covered by the rule are removed from the data set. The algorithm continues to learn new rules for the same target class on the updated data set as long as rules with a minimal acceptable quality are induced, i.e. if the rule covers more positive than negative examples and covers more positive exam- ples than a chosen threshold (in our case a threshold of 2). The final result is a rule set with acceptable rules for the given target class.
Basically, for learning a single rule, a single beam (in the re- finement phase) is sufficient, unless we want to produce a collec- tion of rules which are post-processed later. If not, we shall set the selection beam width to 1, as we do in our experiments. The DoubleBeam-RL algorithm is outlined in Algorithm 3 . The function
Algorithm 3: DoubleBeam-RL algorithm. Input: : E = P ∪ N
E is the training set, | E| its size, tc is target class, P are positive examples (of class tc), N are negative examples (of classes = tc).
Output: : R , ( R is rule set for tc) Parameters: : rh is refinement heuristic,
sh is selection heuristic, rbw is refinement beam width, sbw is selection beam width.
// rule set for target class tc 1 R ← {} // current data
2 cData ← E 3 do 4 rule ← generateRule (cData, tc, r h, sh, r bw, sbw ) 5 R ← R + rule 6 cData ← removePositiveCovered (cData, rule, tc) 7 while not satisfied ; 8 return R
for generating a single rule when a data set, selection heuristics, refinement heuristics, selection beam width, and refinement beam width are given is outlined in Algorithm 4 . 4.1. Experimental setting
We perform experimental evaluation in two steps. In the first step we determine default parameters for the five best combina-
Algorithm 4: Function for generating rules using two heuris- tics. 1 Function generateRule ( dataset, tc, rh , sh , rbw , sbw )
// candidates for best rule 2 bRC ← DoubleBeam-SD ( dataset , tc, rh , sh , rbw , sbw ) 3 bestRule ← getBestRule (bRC) 4 return bestRule
tions of refinement and selection heuristics on the same randomly chosen 10 data sets in the left-hand side of Table 4 . In the second step, we use 10 fresh data sets (the right-hand side of Table 4 ) to compare these five best configurations with two state-of-the-art algorithms for rule learning, Ripper ( Cohen, 1995 ) and CN2 ( Clark & Niblett, 1989 ). We use the Weka ( Hall et al., 2009 ) implemen- tation of Ripper and the Orange ( Demšar et al., 2013 ) implemen- tation of the CN2 algorithm. For both algorithms we use the de- fault parameters set by their software platforms, respectively. For comparison, we also include the results from the best performing algorithm from Stecher’s ( Stecher et al., 2014 ) experimental work, named SC-ILL.
The quality of the induced rules is measured in terms of the classification accuracy (CA). The process of parameter tuning and variant selection is described in Section 4.3 . We also report the av- erage rule length of produced rules. 4.2. Illustrative example
We compare our approach with the approach of Stecher et al. (2014) with an illustrative example. For the purpose of this com- parison, we chose the same set of attributes used in the mentioned work. Rules in both decision lists are generated with as the refinement heuristic and h lap as the selection heuristic. The width of both refinement and selection beam is set to 1. Fig. 8 shows the decision list learned for the class poisonous on the data set mushroom using the algorithm presented in Stecher et al. (2014) , whereas Fig. 9 presents the rule set learned by our DoubleBeam rule learning algorithm.
Results from Tables 8 and 9 suggest that our approach tends towards finding even more complete rules than the ap- proach taken by Stecher et al. (2014) . The algorithm produces
4.2. Related Publication 41

158 A. Valmarska et al. / Expert Systems With Applications 81 (2017) 147–162 Table 8 Decision list learned for class p ( poisonous ) in the mushroom data set using Stecher’s approach with refinement heuristic and se- lection heuristic h lap . The number of positive examples covered by each rule is also shown. No rule covers any of the negative examples. 2192 p ← veil-color = w, gill-spacing = c, bruises? = f, ring-number = o,
stalk-surface-above-ring = k. 864 p ← veil-color = w, gill-spacing = c, gill-size = n, population = v,
stalk-shape = t. 336 p ← stalk-color-below-ring = w, ring-type = p, stalk-color-above-ring = w,
ring-number = o, cap-surface = s, stalk-root = b, gill-spacing = c. 264 p ← stalk-surface-below-ring = s, stalk-surface-above-ring = s,
ring-type = p, stalk-shape = e, veil-color = w, gill-size = n, bruises? = t. 144 p ← stalk-shape = e, stalk-root = b, stalk-color-below-ring = w, ring-number = o. 72 p ← stalk-shape = e, gill-spacing = c, veil-color = w, gill-size = b,
spore-print-color = r. 44 p ← stalk-surface-below-ring = y, stalk-root = c. Table 9 Rule set learned for the class p ( poisonous ) in the mushroom data set using DoubleBeam rule learning algorithm with refinement heuristic , selection heuristic h lap , and both refinement and selection beam width set to 1. The number of positive examples covered by each rule is shown on the left. No rule covers any negative examples. 2228 p ← p ← gill-spacing = c, veil-color = w, stalk-surface-above-ring = k. 864 p ← gill-color = b. 336 p ← stalk-color-above-ring = w, gill-spacing = c, stalk-root = b,
stalk-color-below-ring = w, gill-attachment = f, cap-surface = s, ring-number = o, ring-type = p.
264 p ← stalk-shape = e, bruises? = t, gill-size = n, gill-attachment = f, stalk-surface-above-ring = s, stalk-surface-below-ring = s, ring-type = p.
144 p ← stalk-shape = e, bruises? = f, stalk-root = b, stalk-color-below-ring = w, gill-attachment = f.
72 p ← stalk-shape = e, spore-print-color = r. 8 p ← veil-color = y.
on average shorter rules which include more or the same number of examples. The DoubleBeam-RL algorithm is able to detect features that do not contribute to the overall im- provement of the rules. Such example is the bruises? = f feature. In the first rule from Stecher’s decision rule, the 2192 covered examples are covered by the conjunction of the fol- lowing features: veil-color = w, gill-spacing = c, ring-number = o, stalk-surface-above-ring = k . Feature bruises? = f was selected during the refinement phase, but does not contribute anything to the final result.
This difference is due to the nature of the applied algorithms. Stecher’s approach is to refine a rule using the inverted heuristics until there are only positive examples covered and then returns the best rule on the refinement path. This approach leads to eliminat- ing possible refinements of a certain rule due to their lower refine- ment quality, even though their selection quality is very high; in our case, one of the possible refinements has even better selection quality than the final rule, chosen by the Stecher’s approach. The DoubleBeam-RL algorithm on the other hand, considers the selec- tion quality of the refined candidates and the rules already in the selection beam. It simultaneously checks for rules with best refine- ment and selection quality and keeps track of all the best rules found in the refinement process.
As an example, consider rules from Table 3 . After the univer- sal rule is refined, the best candidate for further refinement in both approaches is p ← veil-color = w. The DoubleBeam- RL algorithm saves this rule as a candidate for refinement, but chooses rule p ← odor = f as its candidate for best rule. In the next iteration, once more the two algorithms have the best candidate for refinement, p ← veil-color = w, gill-spacing = c. There is no change in the selection beam of the DoubleBeam-RL algorithm, where the selection quality of p ← odor = f (1.0 0 0) is better than the selection quality of p ← veil-color = w, gill-spacing = c (0.575). In the third step, best rule for refinement is p ← veil-color = w, gill-spacing = c, bruises? = f. Both algorithms will
continue with the refinement of this rule, however, the selec- tion beam of the DoubleBeam-RL algorithm will be updated with a refinement of p ← veil-color = w, gill-spacing = c, leading to rule p ← veil-color = w, gill-spacing = c, stalk-surface-above-ring = k, whose selection quality is the same as the selection quality of the rule already stored in the beam (1.0 0 0). When the DoubleBeam-RL algorithm is faced with choosing between two rules with the same selection quality, it always chooses the rule that has covered more positive examples. In case the decision is not straight-forward, it chooses the shortest among the rules in question. The top-down specializa- tion will continue for both algorithms. The algorithm proposed by Stecher will stop when there are only positive examples covered or there is no possible further refinement. At the end, the algo- rithm will return the rule with the best selection quality among all the rules on the refinement path. As it is evident from our example, this will result with longer rules which can have lower coverage than the rules selected by the DoubleBeam-RL algorithm. The DoubleBeam-RL algorithm stops after a predefined number of steps, and returns the rule with the best selection quality among all the investigated refinements. 4.3. Default parameter setting
In the experiments performed to determine the default param- eter values for the DoubleBeam-RL algorithm, we use all combina- tions of the following heuristics in refinement and selection phase: – Laplace h lap - L, – Inverted Laplace - IL, – Precision h prec - P, – Inverted Precision - IP, – M-estimate h m-est - M, – Inverted -M-estimate - IM, and
42 Chapter 4. Descriptive Rule Learning

A. Valmarska et al. / Expert Systems With Applications 81 (2017) 147–162 159 – Weighted Relative ACCuracy h WRACC - W.
As an example, the abbreviation RL-ILL indicates that was used as a refinement heuristic, and h lap as a selection heuristic in the DoubleBeam-RL algorithm. This resulted in 49 variants of the DoubleBeam-RL algorithm. Each variant is tested on the same 10 randomly chosen data sets that were used for parameter tuning in the subgroup discovery context.
The value of the selection beam width is fixed to 1 in all vari- ants (see Section 4 ). In order to select the default width of the re- finement beam for each variant of the DoubleBeam-RL algorithm, we perform a 10-fold double-loop cross-validation of each variant on each of the tuning data sets from Table 4 . Each tuning data set is divided into training and test set. Each training data set is ad- ditionally split into internal training and test subset. A separate model is induced on the internal training subset for each of the possible parameter values. These models are then evaluated using the internal test subset. The parameter values that maximize the value of classification accuracy are chosen as parameters for the construction of the model using the initial training data set. The final cross-validation value of classification accuracy (CA) for each fold is calculated using the model induced with the chosen best parameters and the corresponding test data set.
For each heuristic combination we collected the best parame- ters for refinement beam width across the tested 10 data sets. The most frequently selected parameter was chosen as a default pa- rameter for the considered combination. Our experiments showed that for each variant of the rule learning algorithm, the most ac- curate rules are induced when we use refinement beam width with value 1. This means that the selected best parameters make our algorithm identical to the rule learning algorithm proposed in Stecher et al. (2014) , with the exception that our algorithms can select the best rule from each refinement step (line 2 of Algorithm 4 and line 18 of Algorithm 1 ), while in Stecher et al. (2014) only the final refined rule is selected. This seemingly small difference leads our algorithm to form shorter rules with better coverage and affects also the classification accuracy as presented in Section 4.4 .
Out of the 49 variants of the DoubleBeam-RL algorithm, we eventually selected the following five variants, which had the best average rank performance on the 10 tuning data sets: RL-MM ( h m-est , h m-est ), RL-ILM ( ), RL-WM ( h WRACC , h m-est ), RL- IPM ( ), and RL-PM ( h prec , h m-est ). 4.4. Experimental results
We compare the selected best rule learning algorithm (using the five chosen variants of rule selection heuristics) with two state-of-the art algorithms, Ripper and CN2, and the best perform- ing algorithm from Stecher et al. (2014) ’s work, named SC-ILL. The classification accuracy (CA) values obtained from the 10-fold cross-validation testing on the 10 evaluation data sets from the right-hand side of Table 4 with default parameters are shown in Table 10 .
The Friedman test for statistical differences in CA showed that there are no significant differences between the algorithms which is confirmed by the confidence intervals of the Nemenyi test in Fig. 9 . Nevertheless, the approach taken by Stecher et al. (2014) yields the best results (average rank is 3.00). Three of our five chosen variants of the DoubleBeam-RL algorithm have a bet- ter average rank than the Ripper algorithm. The chosen variants of our algorithm for rule learning on average perform better than the CN2 algorithm.
Fig. 9. Nemenyi test on ranking of classification accuracy values with a significance level of 0.05.
Fig. 10. Nemenyi test on ranking of average classification rule length with a signif- icance level of 0.05.
An interesting observation is that among all the algorithms with two heuristics, the one with the least search performs best i.e. the Stecher et al. (2014) approach. The explanation for this could be the over-searching phenomenon ( Janssen & Fürnkranz, 2009; Quinlan & Cameron-Jones, 1995 ), which indicates that the amount of search shall be adjusted specifically to a data set and search heuristics employed.
The results of the Friedman test and post-hoc Nemenyi test for statistical significance of differences between average rule length of rules induced by the chosen variants of the DoubleBeam-RL al- gorithm and the state-of-the-art algorithms for classification rule learning are shown in Fig. 10 . The results suggest that the vari- ant that uses the inverted heuristic in refinement phase, RL-IPM, induces rules which are statistically longer than the rules in- duced by the standard refinement heuristic, RL-PM. The results in Fig. 10 are in accordance with the conclusions drawn by Stecher et al. (2014) . The approach taken by Stecher et al. (2014) , SC-ILL, produces longest rules, while the CN2 algorithm produces rules with the shortest average rule length. These rules are significantly shorer than the rules produced by the SC-ILL, the Rl-IPM, and the RL-ILM algorithm. Note the average rule length is calculated as the ratio between the sum of all conditions across all induced rules and the total number of rules in the model.
Table 11 shows the performance comparison of classification rule learning algorithms on the adult data set in terms of classifi- cation accuracy and average rule length. Results reveal that all ver- sions of the DoubleBeam-RL algorithm produce rules with better classification accuracy than the CN2 algorithm. Three DoubleBeam- RL algorithms (RL-ILM, RL-WM, and RL-IPM) slightly outperform the Ripper algorithm. Comparison of the results obtained with the algorithms RL-IPM and RL-PM confirm the conclusions of Stecher et al. (2014) : when an inverted heuristic is used in the refinement phase, the produced rules tend to be longer and have better clas- sification accuracy.
Fig. 11 presents the training times of classification rule learn- ing algorithms with different numbers of training instances from the adult data set. The times can only give a rough picture of the algorithms’ performance, as the algorithms are not imple- mented on the same platform: we use the Ripper implementa- tion from Weka, CN2 from Orange, the other algorithms are im- plemented in Python. The training times of the SC-ILL algorithm are not included due to excessive time consumption of the algo-
4.2. Related Publication 43
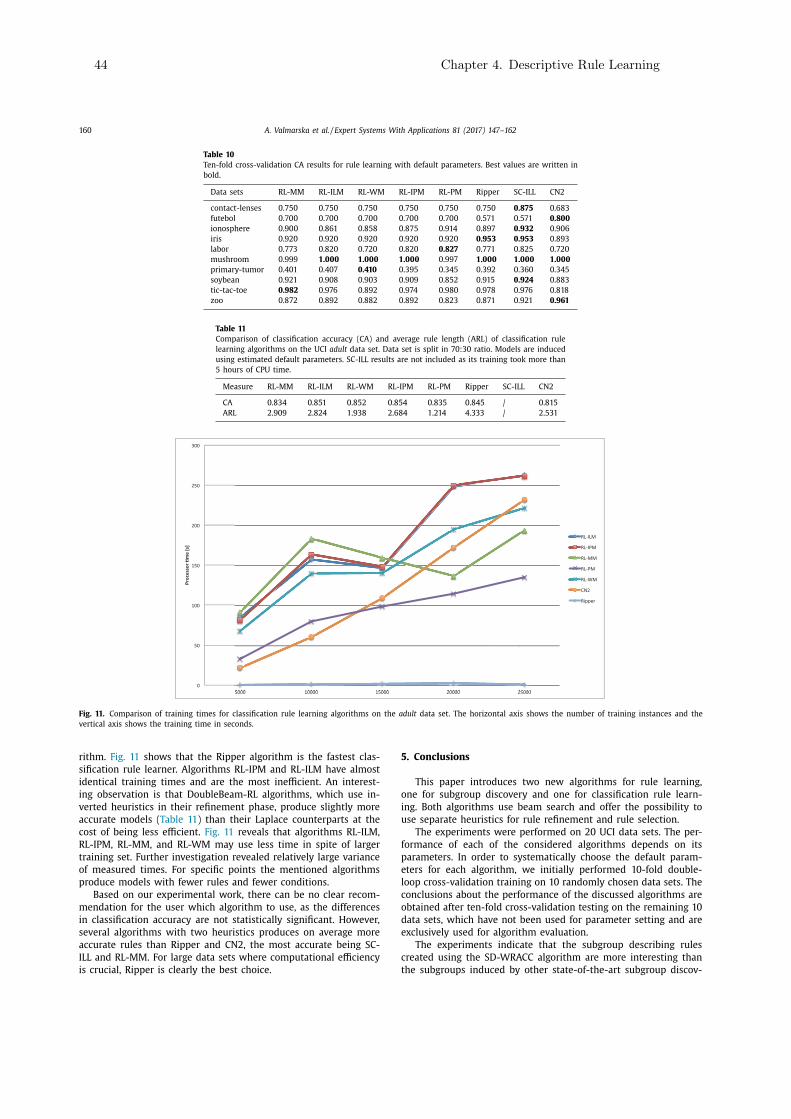
160 A. Valmarska et al. / Expert Systems With Applications 81 (2017) 147–162 Table 10 Ten-fold cross-validation CA results for rule learning with default parameters. Best values are written in bold.
Data sets RL-MM RL-ILM RL-WM RL-IPM RL-PM Ripper S C-ILL CN2 contact-lenses 0 .750 0 .750 0 .750 0 .750 0 .750 0 .750 0 .875 0 .683 futebol 0 .700 0 .700 0 .700 0 .700 0 .700 0 .571 0 .571 0 .800 ionosphere 0 .900 0 .861 0 .858 0 .875 0 .914 0 .897 0 .932 0 .906 iris 0 .920 0 .920 0 .920 0 .920 0 .920 0 .953 0 .953 0 .893 labor 0 .773 0 .820 0 .720 0 .820 0 .827 0 .771 0 .825 0 .720 mushroom 0 .999 1 .0 0 0 1 .0 0 0 1 .0 0 0 0 .997 1 .0 0 0 1 .0 0 0 1 .0 0 0 primary-tumor 0 .401 0 .407 0 .410 0 .395 0 .345 0 .392 0 .360 0 .345 soybean 0 .921 0 .908 0 .903 0 .909 0 .852 0 .915 0 .924 0 .883 tic-tac-toe 0 .982 0 .976 0 .892 0 .974 0 .980 0 .978 0 .976 0 .818 zoo 0 .872 0 .892 0 .882 0 .892 0 .823 0 .871 0 .921 0 .961
Table 11 Comparison of classification accuracy (CA) and average rule length (ARL) of classification rule learning algorithms on the UCI adult data set. Data set is split in 70:30 ratio. Models are induced using estimated default parameters. SC-ILL results are not included as its training took more than 5 hours of CPU time.
Measure RL-MM RL-ILM RL-WM RL-IPM RL-PM Ripper SC-ILL CN2 CA 0 .834 0 .851 0 .852 0 .854 0 .835 0 .845 / 0 .815 ARL 2 .909 2 .824 1 .938 2 .684 1 .214 4 .333 / 2 .531
Fig. 11. Comparison of training times for classification rule learning algorithms on the adult data set. The horizontal axis shows the number of training instances and the vertical axis shows the training time in seconds. rithm. Fig. 11 shows that the Ripper algorithm is the fastest clas- sification rule learner. Algorithms RL-IPM and RL-ILM have almost identical training times and are the most inefficient. An interest- ing observation is that DoubleBeam-RL algorithms, which use in- verted heuristics in their refinement phase, produce slightly more accurate models ( Table 11 ) than their Laplace counterparts at the cost of being less efficient. Fig. 11 reveals that algorithms RL-ILM, RL-IPM, RL-MM, and RL-WM may use less time in spite of larger training set. Further investigation revealed relatively large variance of measured times. For specific points the mentioned algorithms produce models with fewer rules and fewer conditions.
Based on our experimental work, there can be no clear recom- mendation for the user which algorithm to use, as the differences in classification accuracy are not statistically significant. However, several algorithms with two heuristics produces on average more accurate rules than Ripper and CN2, the most accurate being SC- ILL and RL-MM. For large data sets where computational efficiency is crucial, Ripper is clearly the best choice.
5. Conclusions This paper introduces two new algorithms for rule learning,
one for subgroup discovery and one for classification rule learn- ing. Both algorithms use beam search and offer the possibility to use separate heuristics for rule refinement and rule selection.
The experiments were performed on 20 UCI data sets. The per- formance of each of the considered algorithms depends on its parameters. In order to systematically choose the default param- eters for each algorithm, we initially performed 10-fold double- loop cross-validation training on 10 randomly chosen data sets. The conclusions about the performance of the discussed algorithms are obtained after ten-fold cross-validation testing on the remaining 10 data sets, which have not been used for parameter setting and are exclusively used for algorithm evaluation.
The experiments indicate that the subgroup describing rules created using the SD-WRACC algorithm are more interesting than the subgroups induced by other state-of-the-art subgroup discov-
44 Chapter 4. Descriptive Rule Learning
A. Valmarska et al. / Expert Systems With Applications 81 (2017) 147–162 161 ery algorithms. The difference between most of the algorithms are not statistically significant, however SD-WRACC and CN2-SD pro- duce statistically significantly more interesting rules than SD and APRIORI-SD.
In the context of classification rule learning we proposed a new, the DoubleBeam-RL algorithm, which offers the possibility for us- ing separate rule refinement and selection heuristics. Among the tested 49 variants of refinement and selection heuristics inside the DoubleBeam-RL algorithm and their comparison with Ripper and CN2, the best performing variants in terms of classification accuracy were the algorithms that use the m-estimate as their selection heuristic. In particular, the best performing variant of the DoubleBeam-RL algorithm was the variant that uses the m- estimate both as its selection and refinement heuristic. The dif- ferences are, however, not statistically significant. The algorithms which use inverted heuristic perform slightly better than the algo- rithms using the standard heuristics (RL-IPM and RL-ILM compared to RL-PM and RL-WM). All five of our algorithms perform better than the CN2 algorithm, and three of our algorithms perform bet- ter than the Ripper algorithm.
The main advantage of DoubleBeam-SD and DoubleBeam-RL al- gorithms is their ability to use separate heuristics for the refine- ment and selection phase of rule learning. Different heuristics can take advantage of the data properties and contribute to better rules (rules with improved unusualness or rules with improved accuracy). The experimental results suggest that both algorithms provide rules with comparable or better quality than those ob- tained by the state-of-the-art algorithms for rule learning and sub- group discovery, respectively. The use of two beams in combination with separate heuristics for each phase of the learning processes widens the algorithms’ search space thus improving the probabil- ity of finding better quality rules. However, this also increases the chances of data overfitting, an aspect which our algorithms do not explicitly address at this point.
In contrast to the APRIORI-SD algorithm which uses exhaustive search, the DoubleBeam-SD algorithm is a heuristic search algo- rithm (similar to the SD and the CN2-SD algorithm). Despite be- ing faster than the APRIORI-SD algorithm and ability to handle medium size data sets, the current DoubleBeam-SD algorithm is still not able to handle large data sets, due to space and time complexity. In fact, this is one of the main disadvantages of all rule learning algorithms using a covering approach. Lower memory consumption could be achieved with more efficient data structures, while significant speedups could be gained with instance sampling and feature subset selection, as well as with parallelization of the algorithms. Due to two beams, large degree of parallelization could be achieved with DoubleBeam algorithms.
While our DoubleBeam-SD and DoubleBeam-RL algorithms show promising results, their increased search power demands fur- ther research in terms of stopping criteria and rule pruning heuris- tics. Using a post-processing rule pruning step similar to the Rip- per is a promising research direction. We plan to explore also the rule pruning method proposed by Sikora (2011) .
Experimental results on subgroup discovery revealed the advan- tage of using WRACC over the traditional rule learning heuristics in obtaining interesting subgroups. We believe that developing new heuristics specialized for the detection of interesting subgroups is a promising research path.
Subgroup discovery is a useful approach in the analysis of medical data. In line with our work on Parkinson’s disease data ( Valmarska, Miljkovic, Robnik-Šikonja, & Lavra c, 2016 ), we plan a case-study comparing results of different subgroup discovery algo- rithms on Parkinson’s disease patients data set. In order to increase the interpretability of the induced subgroup describing rules we also plan on presenting a method for subgroup visualization. In this way we will assist experts (e.g. physicians) in their decision
whether a certain subgroup discovery rule is interesting and rele- vant for their work. Acknowledgments
The authors acknowledge the financial support from the Slove- nian Research Agency (research core fundings No. P2-0209 and P2-0103). This research has received funding from the European Unions Horizon 2020 research and innovation programme under grant agreement No. 720270 (HBP SGA1). We would like to thank Julius Stecher for interesting discussions on inverted heuristics. References Adhikari, P. R. , Vavpeti c, A. , Kralj, J. , Lavra c, N. , & Hollmén, J. (2014). Explaining mix-
ture models through semantic pattern mining and banded matrix visualization. In Discovery science - 17th international conference, DS 2014, Bled, Slovenia, octo- ber 8–10, 2014. proceedings (pp. 1–12) .
Agrawal, R. , & Srikant, R. (1994). Fast algorithms for mining association rules in large databases. In Vldb’94, Proceedings of 20th international conference on very large data bases, september 12–15, 1994, Santiago de Chile, Chile (pp. 4 87–4 99) .
Atzmueller, M. (2015). Subgroup discovery. Wiley Interdisciplinary Reviews: Data Min- ing and Knowledge Discovery, 5 (1), 35–49 .
Atzmüller, M. , & Puppe, F. (2006). SD-map - A fast algorithm for exhaustive sub- group discovery. In Proceedings of knowledge discovery in databases, PKDD 2006 (pp. 6–17) .
Bay, S. D. , & Pazzani, M. J. (2001). Detecting group differences: Mining contrast sets. Data Mining and Knowledge Discovery, 5 (3), 213–246 .
Bibal, A. , & Frénay, B. (2016). Interpretability of machine learning models and rep- resentations: an introduction. In Computational intelligence and machine learn- ing, proceedings of European symposium on artificial neural networks ESANN 2016 (pp. 77–82) .
Clark, P. , & Niblett, T. (1989). The CN2 induction algorithm. Machine Learning, 3 , 261–283 .
Cohen, W. W. (1995). Fast effective rule induction. In Proceedings of the twelfth in- ternational conference on machine learning (pp. 115–123) .
Demšar, J. , Curk, T. , Erjavec, A. , Crt Gorup , Ho cevar, T. , Milutinovi c, M. , . . . Zu- pan, B. (2013). Orange: Data mining toolbox in Python. Journal of Machine Learn- ing Research, 14 , 2349–2353 .
Dong, G. , & Li, J. (1999). Efficient mining of emerging patterns: Discovering trends and differences. In Proceedings of the 5th ACM SIGKDD international conference on knowledge discovery and data mining, 1999 (pp. 43–52) .
Fürnkranz, J. (1999). Separate-and-conquer rule learning. Artificial Intelligence Re- view, 13 (1), 3–54 .
Fürnkranz, J. , & Flach, P. A. (2005). ROC ’n’ rule learning - Towards a better under- standing of covering algorithms. Machine Learning, 58 (1), 39–77 .
Fürnkranz, J. , Gamberger, D. , & Lavra c, N. (2012). Foundations of rule learning . Springer .
Gamberger, D. , & Lavra c, N. (2002). Expert-guided subgroup discovery: Methodology and application. Journal of Artificial Intelligence Research, 17 , 501–527 .
Gamberger, D. , & Lavra c, N. (20 0 0). Confirmation rule sets. In Proceedings of princi- ples of data mining and knowledge discovery, 4th European conference, PKDD 20 0 0 (pp. 34–43) .
Grosskreutz, H. , & Rüping, S. (2009). On subgroup discovery in numerical domains. Data Mining and Knowledge Discovery, 19 (2), 210–226 .
Hall, M. A. , Frank, E. , Holmes, G. , Pfahringer, B. , Reutemann, P. , & Witten, I. H. (2009). The WEKA data mining software: An update. SIGKDD Explorations, 11 (1), 10–18 .
Hühn, J. , & Hüllermeier, E. (2009). Furia: An algorithm for unordered fuzzy rule in- duction. Data Mining and Knowledge Discovery, 19 (3), 293–319 .
Janssen, F. , & Fürnkranz, J. (2009). A re-evaluation of the over-searching phe- nomenon in inductive rule learning.. In Proceedings of the 2009 SIAM interna- tional conference on data mining (pp. 329–340). SIAM .
Kavšek, B. , Lavra c, N. , & Jovanoski, V. (2003). APRIORI-SD: adapting association rule learning to subgroup discovery. In Advances in intelligent data analysis v, 5th in- ternational symposium on intelligent data analysis, IDA (pp. 230–241) .
Klösgen, W. (1996). Explora: A multipattern and multistrategy discovery assistant. In Advances in knowledge discovery and data mining (pp. 249–271) .
Kralj Novak, P. , Lavra c, N. , & Webb, G. I. (2009). Supervised descriptive rule discov- ery: A unifying survey of contrast set, emerging pattern and subgroup mining. Journal of Machine Learning Research, 10 , 377–403 .
Kralj Novak, P. , Lavra c, N. , Zupan, B. , & Gamberger, D. (2005). Experimental com- parison of three subgroup discovery algorithms: Analysing brain ischemia data. In Proceedings of the 8th international multiconference information society (pp. 220–223) .
Kranjc, J. , Podpe can, V. , & Lavra c, N. (2012). ClowdFlows: A cloud based scientific workflow platform. In Proceedings of machine learning and knowledge discovery in databases - European conference, ECML PKDD 2012 (pp. 816–819) .
Lavra c, N. , Kavšek, B. , Flach, P. A. , & Todorovski, L. (2004). Subgroup discovery with CN2-SD. Journal of Machine Learning Research, 5 , 153–188 .
Lavra c, N. , Železný, F. , & Flach, P. A. (2002). RSD: Relational subgroup discovery through first-order feature construction. In Proceedings of the 12th international conference on inductive logic programming (pp. 149–165) .
4.2. Related Publication 45

162 A. Valmarska et al. / Expert Systems With Applications 81 (2017) 147–162 Lichman, M. (2013). UCI machine learning repository. Michalski, R. S. (1969). On the quasi-minimal solution of the general covering prob-
lem. In Proceedings of the fifth international symposium on information processing . Minnaert, B. , Martens, D. , De Backer, M. , & Baesens, B. (2015). To tune or not to
tune: Rule evaluation for metaheuristic-based sequential covering algorithms. Data Mining and Knowledge Discovery, 29 (1), 237–272 .
Mitchell, T. M. (1982). Generalization as search. Artificial Intelligence, 18 (2), 203–226 . Napierala, K. , & Stefanowski, J. (2015). Addressing imbalanced data with argument
based rule learning. Expert Systems with Applications, 42 (24), 9468–9481 . Parpinelli, R. S. , Lopes, H. S. , & Freitas, A. A. (2002). Data mining with an ant
colony optimization algorithm. IEEE Transactions on Evolutionary Computation, 6 (4), 321–332 .
Pi culin, M. , & Robnik-Šikonja, M. (2014). Handling numeric attributes with ant colony based classifier for medical decision making. Expert Systems with Appli- cations, 41 (16), 7524–7535 .
Quinlan, J. , & Cameron-Jones, R. (1995). Oversearching and layered search in empir- ical learning. In Proceedings of the 14th international joint conference on artificial intelligence, IJCAI’95: 2 (pp. 1019–1024). Morgan Kaufmann Publishers Inc .
Quinlan, J. R. (1983). Learning efficient classification procedures and their applica- tion to chess end games. Machine Learning .
Quinlan, J. R. , & Cameron-Jones, R. M. (1993). FOIL: A midterm report. In Proceed- ings of machine learning: European conference on machine learning - ECML 1993 (pp. 3–20) .
Ruz, G. A. (2016). Improving the performance of inductive learning classifiers through the presentation order of the training patterns. Expert Systems with Ap- plications, 58 , 1–9 .
Sikora, M. (2011). Induction and pruning of classification rules for prediction of microseismic hazards in coal mines. Expert Systems with Applications, 38 (6), 6748–6758 .
Stecher, J. , Janssen, F. , & Fürnkranz, J. (2014). Separating rule refinement and rule selection heuristics in inductive rule learning. In Proceedings of machine learning and knowledge discovery in databases - European conference, ECML PKDD 2014 (pp. 114–129) .
Valmarska, A. , Miljkovic, D. , Robnik-Šikonja, M. , & Lavra c, N. (2016). Multi-view ap- proach to Parkinson’s disease quality of life data analysis. Lecture Notes in Com- puter Science . Springer .
Valmarska, A. , Robnik-Šikonja, M. , & Lavra c, N. (2015). Inverted heuristics in sub- group discovery. In Proceedings of the 18th international multiconference informa- tion society .
Vavpeti c, A. , Novak, P. K. , Gr car, M. , Mozeti c, I. , & Lavra c, N. (2013). Semantic data mining of financial news articles. In Proceedings of the 16th international confer- ence discovery science, DS 2013 (pp. 294–307) .
Wrobel, S. (1997). An algorithm for multi-relational discovery of subgroups. In Pro- ceedings of the first European symposium on principles of data mining and knowl- edge discovery, PKDD 1997 (pp. 78–87) .
Zeng, Q. , Patel, J. M. , & Page, D. (2014). Quickfoil: Scalable inductive logic program- ming. Proceedings of Very Large Databases Conference, 8 (3), 197–208 .
46 Chapter 4. Descriptive Rule Learning

47
Chapter 5
Detection of Parkinson’s DiseaseProgression Patterns
Careful management of patient’s condition is crucial to ensure the patient’s independenceand quality of life. This is achieved by personalized treatment based on individual patient’ssymptoms and medical history. The aim of this chapter is to determine patient groupswith similar disease progression patterns coupled with patterns of medication changes thatlead to the improvement or decline of patients’ quality of life symptoms. To this end,this chapter proposes a new methodology for clustering of short time series of patients’symptoms and prescribed medications data, and time sequence data analysis using skip-grams to monitor disease progression. The chapter is divided into two sections. We firstintroduce the problem description and then we present the published Journal of IntelligentInformation Systems paper that addresses the described problem.
5.1 Problem Description
Parkinson’s disease symptoms affect the quality of life of both the patients and their closestcommunities. There is no cure for Parkinson’s disease and the treatment of patients isdirected towards managing their symptoms with antiparkinson medication and prolongingtheir independence. In time patients begin to lose independence and rely heavily on thesupport of their families. Both the medical treatment and the patients’ inability to play amore active role in their countries economies present a heavy economic pressure on countriesworldwide. Early diagnosis and response to patients’ symptoms in adequate time are ofessential importance to contain the progression and degradation of patients’ normal qualityof life.
Data mining techniques for Parkinson’s disease have been limited to disease diagnosis,symptoms recognition, or subtype detection. An important and still unresearched area isthe problem of disease progression. Patients can have different patterns of disease progres-sion depending both on their symptoms status as well as their clinicians’ reaction to theirstatus with medications. Determining patterns of disease progression can help cliniciansfocus their attention on the therapies that have proven to be best for patients covered bya certain disease progression pattern and thus prolong the independence of their patients.
The progression of patients’ disease can be followed by monitoring their overall statusover time. The PPMI data record patients’ symptoms for each visit to the clinician.The combination of symptoms and their severity a patient experiences on a visit givesinformation about the patient’s status at that time. Based on the experienced symptomsat two consecutive visits, patients’ status can either improve, degrade, or stay unchanged.

48 Chapter 5. Detection of Parkinson’s Disease Progression Patterns
We address the issue of determining the overall status of patients’ by dividing them intogroups of patients with similar symptoms. We use descriptive methods to determine theseverity of patients status in each group. Descriptions of clusters allow for at least partialordering of patients’ status according to the severity of symptoms of their member patients.As the patients’ status changes through time, so will the patients’ cluster membership.Change of patients’ cluster assignment between two consecutive visits indicates a changein their overall status thus drawing the trajectory of their disease progression. Analysisof all trajectories of disease progression will reveal patterns of disease progression sharedamong Parkinson’s disease patients.
As mentioned in Chapter 3, the data describing the status of Parkinson’s disease pa-tients is obtained from multiple sources and describes different aspects of the patients’lives. We address the division of patients into groups in two settings where we look intotheir i) overall status based on the sum of their symptoms severities and ii) the patients’status as presented from multiple angles (multi-view learning). Based on these divisions ofpatients, we demonstrate that motor and autonomic symptoms are the most informativefor evaluating the quality of life of Parkinson’s disease patients.
We also address the issue of medications therapy changes. We are interested in patternsof medications changes that influence the improvement or the degradation of the patients’status. By following the evolution of symptoms for each patient separately, we are able todetermine patterns of medication changes that can lead to the improvement or degradationof the patients’ quality of life.
5.2 Related Publication
The rest of this chapter presents the Journal of Intelligent Information Systems paper.
Publication related to this contribution
Journal Paper
Valmarska, A., Miljkovic, D., Lavrač, N., & Robnik-Šikonja, M. (2018). Analysis of medi-cations change in Parkinson’s disease progression data. Journal of Intelligent Infor-mation Systems. doi:10.1007/s10844-018-0502-y1
This publication contains the following contributions:
• We present the unaddressed issue of Parkinson’s disease progression analysis withdata mining.
• We present our clustering-based methodology for determining patterns of diseaseprogression. The methodology can employ both single or multi-view clustering ap-proaches.
• We use external cluster validation measures to determine the best clusters.
• We empirically show that patients can be divided into clusters with similar symptoms.These clusters can be at least partially ordered based on the severity of symptoms ofpatients assigned to them.
1ERRATUM: Figure 4 and Figure 5 on page 75 of the PhD thesis have mistakenly been switched, whilethe captions of Figure 4 and Figure 5 are correct and correspond to the references in the text.

5.2. Related Publication 49
• We empirically confirm the importance of motor and autonomic symptoms on thepatients’ overall status.
• We present the reasoning behind following the changes of patients’ cluster assign-ments to determine patterns of disease progression and use skip-grams to obtainrobust patterns of disease progression.
• We present patterns of disease progression and the characteristics of patients for afew subjectively chosen patterns of progression.
• We present an algorithm for determining patterns of medications dosage changesthat influence the improvement or decline of the patients’ status. We present thesepatterns.
The authors’ contributions are as follows. Anita Valmarska initiated the idea ofclustering-based analysis of short-time series Parkinson’s disease symptoms and medica-tion data to determine patterns of disease progression and therapy modifications. MarkoRobnik-Šikonja suggested using skip-grams in order to obtain more robust patterns of dis-ease progression. The methodology was designed and developed by Anita Valmarska withthe insights from Marko Robnik-Šikonja. Anita Valmarska implemented the methodologyand performed the experimental work. Marko Robnik-Šikonja and Nada Lavrač supervisedthe implementation of the algorithms. Nada Lavrač has suggested to address the prob-lem of Parkinson’s disease data analysis and gave insightful comments on data mining ofmedical data. Dragana Miljkovic provided insights into data mining of Parkinson’s diseasedata. All authors contributed to the text of the manuscript.


J Intell Inf Systhttps://doi.org/10.1007/s10844-018-0502-y
Analysis of medications change in Parkinson’s diseaseprogression data
Anita Valmarska1,2 ·Dragana Miljkovic1 ·Nada Lavrac1,2,3 ·Marko Robnik-Sikonja4
Received: 17 July 2017 / Revised: 9 February 2018 / Accepted: 19 February 2018© Springer Science+Business Media, LLC, part of Springer Nature 2018
Abstract Parkinson’s disease is a neurodegenerative disorder that affects people world-wide. Careful management of patient’s condition is crucial to ensure the patient’s indepen-dence and quality of life. This is achieved by personalized treatment based on individualpatient’s symptoms and medical history. The aim of this study is to determine patient groupswith similar disease progression patterns coupled with patterns of medications change thatlead to the improvement or decline of patients’ quality of life symptoms. To this end, thispaper proposes a new methodology for clustering of short time series of patients’ symp-toms and prescribed medications data, and time sequence data analysis using skip-grams tomonitor disease progression. The results demonstrate that motor and autonomic symptomsare the most informative for evaluating the quality of life of Parkinson’s disease patients.We show that Parkinson’s disease patients can be divided into clusters ordered in accor-dance with the severity of their symptoms. By following the evolution of symptoms for eachpatient separately, we were able to determine patterns of medications change which can leadto the improvement or worsening of the patients’ quality of life.
! Anita [email protected]
Dragana [email protected]
Nada [email protected]
Marko [email protected]
1 Jozef Stefan Institute, Jamova 39, 1000 Ljubljana, Slovenia
2 Jozef Stefan International Postgraduate School, Jamova 39, 1000 Ljubljana, Slovenia
3 University of Nova Gorica, Vipavska 13, 5000 Nova Gorica, Slovenia
4 Faculty of Computer and Information Science, University of Ljubljana, Vecna pot 113,1000 Ljubljana, Slovenia
5.2. Related Publication 51

J Intell Inf Syst
Keywords Parkinson’s disease · Quality of life indicators · Clustering · Short timeseries · Skip-grams
1 Introduction
Parkinson’s disease is a neurodegenerative disorder that affects people worldwide. Dueto the death of nigral neurons, there are changes in dopamine levels in the human braincausing several motor symptoms: tremor, rigidity, bradykinesia and postural instability.In addition to motor symptoms, Parkinson’s disease is associated also with non-motorsymptoms, which include cognitive, behavioral, and autonomic problems. These symptomssignificantly decrease the quality of life of the patients affected by Parkinson’s disease.
Over 6.3 million people have the condition worldwide (European Parkinson’s DiseaseAssociation 2016). In Europe, more than one million people live with Parkinson’s diseaseand this number is expected to double by 2030 (Dorsey et al. 2007). Parkinson’s diseaseis the second most common neurodegenerative disease (after Alzheimer’s disease) and itsprevalence continues to grow as the population ages. Currently, there is no cure for Parkin-son’s disease. The reasons for the cell death are still poorly understood. The managementof symptoms is of crucial importance for patients’ quality of life, mainly addressed withantiparkinson medication, such as levodopa and dopamine agonists.
While numerous studies address specific aspects of the disease, there are few researchefforts that adopt a holistic approach to disease management (Gatsios et al. 2016). The PER-FORM (Tzallas et al. 2014), REMPARK (Sama et al. 2015) and SENSE-PARK (SENSE-PARK 2016) systems are intelligent closed-loop systems that seamlessly integrate a range ofwearable sensors (mainly accelerometers and gyroscopes), constantly monitoring severalmotor signals of the patients and enabling the prescribing clinicians to remotely assess the sta-tus of the patients, given a real-time image of each patient’s condition. Based on individualpatient’s response to the prescribed therapy (manifested by the change of the motor symp-toms), the physician is able to adjustmedication schedules andpersonalize the treatment (Gat-sios et al. 2016). However, no data mining paradigms are used in the mentioned systems.
In the development of the PD manager’s m-Health platform for patient-centric Parkin-son’s disease management (PD manager: m-Health platform for Parkinson’s disease man-agement 2015), one of the investigated approaches is data mining, aiming to providedecision support to clinicians and patients in personalized disease management. The individ-ual patient’s data, recorded in consecutive visits to the prescribing physician, are collectedfrom different sources offering different ‘views’ of the data describing the same patient bymultiple distinct feature sets. This setting suggests a multi-view learning approach.
Multi-view learning—a relatively new but well-established machine learning technique—is often appropriate for this type of data, as it aims to build models from multiple views(multiple data sets) by considering the diversity of different views (Xu et al. 2013). Theseviews represent data obtained frommultiple sources or different feature subsets and describethe same set of examples. We decided for a multi-view clustering approach, aiming toconstruct disjoint partitioning of objects (patients) described by multiple feature sets. Thispartitioning is aimed at identifying clusters of patients that share similar symptoms whichenables automatic detection of interesting patterns.
Our work explores and tries to give answers to important medical questions which nobody(to the best of our knowledge) has tried to answer: How medications therapy of Parkinson’sdisease patients changes in response to the patients’ change of overall status, and what arethe directions in which the disease would develop based on the patients’ symptoms and
52 Chapter 5. Detection of Parkinson’s Disease Progression Patterns

J Intell Inf Syst
their therapies. The goal of this paper is to develop a new clustering-based methodology fordisease progression data, which will—based on the patients’ allocation to clusters at giventime points and their history of medication therapies—be able to make suggestions aboutmodifications of particular patient’s therapy, with the aim to improve the patient’s quality oflife. Patients’ allocation to clusters represent their disease status, and their changed clusterallocation through time represents their disease progression. The analysis of the clusters canreveal what is the most common status of the patients, and the analysis of cluster changescan reveal how their symptoms change in time. Learning on the history of changes betweenclusters allows us to infer significant features and relevant medications changes for groupsof patients and to suggest medications changes for the individual patients.
In order to increase the robustness of our results, we model the sequences of changes ofpatient’s status between the clusters by using skip-grams (Guthrie et al. 2006), an approachupgrading the more standard n-grams approach (Broder et al. 1997) that is regularly used inthe analysis of data sequences. The introduction of skip-grams results in increased numberof investigated n-grams, providing a more stable distribution of the possible cluster changes.
This paper significantly extends our previous work (Valmarska et al. 2016). We extendedthe methodology for analysis of Parkinson’s disease data to include three threads of cluster-ing (Section 4). A pseudo code of the approach for dividing Parkinson’s disease patients intogroups with similar symptoms and ordering these groups of patients in accordance with theseverity of their overall status is outlined in Section 4.2. The changes of patients antiparkin-son medications dosages in relation to the change of their overall status is explored inSection 4.3, where we introduce Algorithm 2 to determine the change in medications dosagewith respect to the change of patient’s status. In Section 4.4 we present the skip-grams basedapproach for determining groups of patients with different patterns of disease progressionbased on the changes of their overall status. Finally, we have significantly extended theempirical evaluation in Section 5 by updating the previous symptoms analysis and medica-tions analysis results with the results for determining the number of clusters and patterns ofdisease progression. We also present the results of detailed analysis of patients who wereidentified as following a certain pattern of disease progression.
The paper is structured as follows.After presenting themotivation, the background and therelated work in Section 2, Section 3 describes the Parkinson’s ProgressionMarkers Initiative(PPMI)data (Marek et al. 2011) used inour experiments. Section 4proposes themethodologyfor analyzing the Parkinson’s disease data through clustering of short time series symptomsdata and connecting the changes of symptoms-based clustering of patients to the changes inmedication therapies with the goal to find treatment recommendation patterns and diseaseprogression patterns. The latter is addressed by introducing the so-called skip-grams foranalyzing the cluster change patterns and the progression of the disease. Section 5 presentsthe results of data analysis, tested on two data set variants. Finally, Section 6 presents theconclusions and ideas for further work. The paper contains four appendices which containdetailed results of analyzes: comparison of clustering algorithms (Appendix A), unsuper-vised feature selection (Appendix B), evaluation of different views in multi-view clustering(Appendix C), and descriptive rules for multi-view clusters (Appendix D).
2 Background
Parkinson’s disease is a heterogeneous neurodegenerative condition with different clin-ical phenotypes, genetics, pathology, brain imaging characteristics and disease duration(Foltynie et al. 2002). This variability indicates the existence of disease subtypes. Moreover,
5.2. Related Publication 53

J Intell Inf Syst
Parkinson’s disease symptoms overlap with symptoms from other diseases, thus hamperingthe diagnosis of new PD patients and decreasing the overall success of the diagnosis pro-cess. Only 75% of clinical diagnoses of Parkinson’s disease are confirmed to be idiopathicParkinson’s disease at autopsy (Hughes et al. 1992).
Given the heterogeneous nature of Parkinson’s disease (PD), the nature of data describingPD patients is also heterogeneous, possibly gathered in different databases. Our data set(Marek et al. 2011) contains symptoms of patients suffering from Parkinson’s disease wherethe symptoms are divided into several views. We test the union of all views with standardclustering approaches as well as several subsets of views using multi-view clustering inorder to identify clusters of patients that share similar symptoms.
Patients’ symptoms change through time depending on the received therapies, develop-ment of the disease, everyday habits, etc. We treat patients’ symptoms at each time point asone training instance. This leads to patients’ allocation to different clusters in different timepoints depending on the progression of the disease. We aim to suggest modifications of themedication treatments based on identified migration patterns of patients from one cluster toanother with the goal to keep the patients in the clusters with symptoms that allow a goodquality of life. To reach this goal we developed a new clustering-based methodology fordisease progression data.
The reminder of this section presents Parkinson’s disease related data mining research, anoverview of relevant multi-view clustering approaches, and a short overview of methods forshort time series analysis, including the introduction of skip-grams for sequence data analysis.
2.1 Parkinson’s disease related data mining research
Data mining research in the field of Parkinson’s disease (PD) can be divided into fourgroups: classification of PD patients, detection of PD symptoms, detection of subtypes ofPD patients, and assessing success of deep brain stimulation surgery as a last resort in thetreatment of Parkinson’s disease patients.
The use of classification techniques offers decision support to specialists by increas-ing the accuracy and reliability of diagnosis and reducing possible errors. Gil and Johnson(2009) use Artificial Neural Networks (ANN) and Support Vector Machines (SVM) todistinguish PD patients from healthy subjects. Ramani and Sivagami (2011) compare theeffectiveness of different data mining algorithms in the diagnosis of PD patients.
Tremor is one of the symptoms strongly associated with Parkinson’s disease. Severalmethods for numerical assessment of the intensity of tremor have been proposed. Thesemethods include time series analysis (Timmer et al. 1993), spectral analysis (Riviere et al.1997) and non-linear analysis (Riviere et al. 1997) and they address tremor detectionand quantification. Recent works are based on body fixed sensors (BFS) for long-termmonitoring of patients (Patel et al. 2009).
In the course of their disease, patients are prescribed antiparkinson medications therapiesin order to control the troubling symptoms. As the disease progresses, the medications treat-ment can become ineffective and—as a last resort—clinicians use deep brain stimulation(DBS) surgery to control the Parkinson’s disease symptoms. Data mining research confirmsthat DBS significantly improves the patients’ motor function (Liu et al. 2014). Dependingon the chosen method for DBS, a great reduction in dose of medication, or conservationof cognitive functions can be achieved. In order to predict the neurological effects relatedto different electrode-contact stimulation, Szymanski et al. (2015) tracked the connectionsbetween the stimulated part of subthalamic nucleus and the cortex with the help of diffusiontensor imaging (DTI).
54 Chapter 5. Detection of Parkinson’s Disease Progression Patterns

J Intell Inf Syst
Identification of Parkinson’s disease subtypes is presented in the work of Lewis et al.(2005), and has been confirmed by the conclusions from Reijnders et al. (2009) and Maet al. (2015). While clustering usually focuses on patient grouping with the aim of diag-nosing new patients, none of the listed methods follows the progression of the disease,and to the best of our knowledge, no data mining research in the field of Parkinson’s dis-ease analyzed the development of the disease in combination with the medications thatthe patients receive. Identification of groups of patients based on the similarity of theirsymptoms and the clinicians’ reaction with medications modification in order to keep thepatients as stable and in good status as possible, can be helpful in the assignment of per-sonalized therapies and an adequate patient treatment. For that purpose, we propose amethodology for identification of groups of patients based on the severity of their symp-toms, determination of disease progression, and the consequent patterns of medicationsmodifications.
2.2 Multi-view clustering
Multi-view clustering is concerned with clustering of data by considering the informationshared by each of the separate views. Many multi-view clustering algorithms initially trans-form the available views into one common subspace (early integration), where they performthe clustering process (Xu et al. 2013). Chaudhuri et al. (2009) propose a method for multi-view clustering where the translation to a lower vector space is done by using CanonicalCorrelation Analysis (CCA). Tzortzis and Likas (2009) propose a multi-view convex mix-ture model that locates clusters’ representatives (exemplars) using all views simultaneously.These exemplars are identified by defining a convex mixture model distribution for eachview. Cleuziou et al. (2009) present a method where in each view they obtain a specific orga-nization using fuzzy k-means (Bezdek 1981) and introduce a penalty term in order to reducethe disagreement between organizations in the different views. Cai et al. (2013) proposea multi-view k-means clustering algorithm for big data. The algorithm utilizes a commoncluster indicator in order to establish common patterns across the views.
Co-training (Blum and Mitchell 1998) is one of the earliest representatives of multi-view learning. This approach considers two views consisted of both labeled and unlabeleddata. Using labeled data, co-training constructs a separate classifier for each view. The mostconfident predictions of each classifier on the unlabeled data are then used to iterativelyconstruct additional labeled training data. Kumar and III (2011) apply the co-training prin-ciple (Blum and Mitchell 1998) in unsupervised learning. Clustering is performed on bothviews, then cluster points from one view are used to modify the clustering structure of theother view. Appice and Malerba (2016) employ the co-training principle in the multi-viewsetting for process mining clustering. The above-mentioned approaches presume that eachof the respective views is capable of producing clusters of similar quality when consideredseparately. He et al. (2014) do not make that presumption. They combine multiple viewsunder a principled framework, CoNMF (Co-regularized Non-negative Matrix Factoriza-tion), which extends NMF (Non-negative matrix factorization) for multi-view clustering byjointly factorizing the multiple matrices through co-regularization. The matrix factorizationprocess is constrained by maximizing the correlation between pairs of views, thus utilizinginformation from each of the considered views. CoNMF is a multi-view clustering approachwith intermediate integration of views, where different views are fused during the cluster-ing process. The co-regularization of each pair of views makes the clustering process morerobust to noisy views. The decision to use the CoNMF approach in our work was madebased on this algorithm property and on the availability of its Python code.
5.2. Related Publication 55

J Intell Inf Syst
2.3 Analysis of short time series
A time series is a series of data points indexed in time order. Time series data analysis wasused to study a wide range of biological and ecological systems (Bence 1995). The use oftime series allows for studying the dynamics of a system. Short time series (8 points or less)constitute more than 80% of all time series data sets (Ernst et al. 2005). The small numberof available time points does not allow for identification of statistically significant temporalprofiles (Ernst and Bar-Joseph 2006). Bence (1995) examines methods for adjusting con-fidence intervals of the mean and parameters of a linear regression for autocorrelation. DeAlba et al. (2007) suggest that simpler models can be more effective on short time series.They show that the Bayesian approach is superior to the traditional approach when appliedto short time series but inferior when applied on longer time series (De Alba et al. 2007).Most of the research in short time series analysis is related to the analysis of short timeseries microarray gene expression data. Ernst et al. (2005) present a method for clusteringof short time series gene expression data, followed by the introduction of the STEM (ShortTime-series Expression Miner) software program (Ernst and Bar-Joseph 2006) specificallydesigned for the analysis of short time series microarray gene expression data.
In thehealthcare domain,Choi et al. (2017) incorporate temporalmodelingusing the recur-rent neural network (RNN)model to predict heart failure. Imhoff et al. (1998) apply short timeseries analysis to monitor lab variables after liver surgery, and to offer support to cliniciansin their decision-making process for the treatment of acute respiratory distress syndrome.Schieb et al. (2013) evaluate the clustering of stroke hospitalization rates, patterns of theclustering over time, and associations with community level characteristics. They generateclusters of high and low-stroke hospitalization rates during two periods of time. Accordingto the place of residence of patients, counties in USA are assigned to a cluster. Followingthe transition of counties between clusters between these two periods, counties are labeledas having a persistently high, transitional, or persistently low-stroke hospitalization rate.
Murugesan et al. (2017) present a hierarchicalmulti-scale approach for visualizing spatialand functional cluster evaluation patterns. Their visualization method is two-stage methodbased on sequence of community detection at each time stamp and community trackingbetween steps. Greene et al. (2010) address the issue of identifying communities in dynamicnetworks. Appice (2017) uses social network analysis as a basic approach for organizationalmining, aimed at understanding the life cycle of a dynamic organizational structures.
Zhao et al. (2017) explore different representations of temporal data from electronichealth records to improve prediction of adverse drug events. They obtain sequences of sym-bols by transforming time series of individual feature into strings (Lin et al. 2007). Thesestrings reflect the temporal nature of the original values. Results from their empirical inves-tigation show that transformation of sequences to tabular form based on edit distance ofsub-sequences to representative shaplets leads to improvements in the predictive perfor-mance. This approach reduces the feature sequence diversity by finding informative randomsub-sequences. The goal of Zhao et al. (2017) is to predict whether patients will developadverse drug reactions. They use the history of patients symptoms in order to predict a sin-gle event (adverse drug event: yes or no), while we follow the patients’ disease developmentand changes in their overall status as a result of therapy changes. Another difference is ouruse of skip-grams which reduces noise and enforces strong transition patterns.
To the best of our knowledge, the temporal nature of medical data has not been exploredin research directed toward determining the progression of a particular disease and determin-ing the therapy recommendations in order to stabilize the disease progression. We presenta clustering based methodology on short time series symptoms data of Parkinson’s disease
56 Chapter 5. Detection of Parkinson’s Disease Progression Patterns

J Intell Inf Syst
patients in an attempt to discover how the disease develops through time, reflected by thechange of patients’ symptoms. Simultaneously, we use the temporal data about their med-ications therapy to determine how clinicians react to patients’ symptoms changes. EachParkinson’s disease patient is described with his/her symptoms and medications treatmentthrough time. The temporal data is flattened to records from single time points, referred inthis manuscript as instances, where any change of patients’ symptoms between two con-secutive points is referred as change in their status. Changes in status are then connected topossible changes in medications therapies.
2.4 Skip-grams for sequence data analysis
Patient’s allocation to clusters in sequential time points can be viewed as a sequence ofitems. Analysis of contiguous sequences of items for every patient’s cluster allocation canprovide an insight into the disease progression and reveal patterns how (and how often) thepatient’s symptoms improve or degrade.
In this paper we use an approach to sequence data analysis, where we borrow the method-ology initially developed in the field of natural language processing (NLP). In NLP, acontiguous sequence of n items from a given sequence of text or speech is called an n-gram(Broder et al. 1997). Skip-grams are a generalization of n-grams in which the components(typically words) need not be consecutive in the text under consideration but may leavegaps that are skipped over (Guthrie et al. 2006). They provide a way of overcoming the datasparsity problem found with conventional n-gram analysis.
Another use of skip-grams is in producing word embeddings into a vector form to reducedimensionality and sparsity of bag-of-words representation. Mikolov et al. (2013) proposedword2vec embedding based on deep learning, which has subsequently been used in manyNLP applications, including some with clinical text data (Minarro-Gimenez et al. 2013; DeVine et al. 2014) (PubMed abstracts, disease progression reports) and to learn relationshipsbetween clinical processes or unified medical language system (UMLS) concepts (Choiet al. 2017). Our use of skip-grams is entirely different as we do not use embeddings butuse skip-grams directly as a more robust version of n-grams.
In the context of our analysis, skip-grams allow for robust identification of frequent pathsthrough clusters and reveal typical disease progression patterns. The patient’s overall statusat a given visit to the clinician, as determined by the (patient, visit) pair cluster assignment,can be seen as an item, and changes of clusters as sequences of items, which can be analyzedwith the skip-grams based approach developed in NLP. This is novel in the analysis ofParkinson’s disease data and allows us to follow the progression of the patient’s overallstatus without taking into account noise in the form of sudden changes in the patient’s status.Such changes are not necessary due to Parkinson’s disease, but can be attributed to otherstressful events in the patient’s life (such as loss of a pet, loss of a loved one, etc). To the bestof our knowledge, there has not been any study involving skip-grams that uses the actualsymptoms of patients in order to explore patient’s disease progression and the clinicians’response by changing the medications therapy. A formal definition of skip-grams and theiruse are presented in Section 4.4.
3 Data
In this study, we use the PPMI data collection (Marek et al. 2011) gathered in the observa-tional clinical study to verify progression markers in Parkinson’s disease. The PPMI data
5.2. Related Publication 57

J Intell Inf Syst
collection consists of data sets describing different aspects of the patients’ daily life. Belowwe describe the selection of PPMI data used in the experiments.
3.1 PPMI symptoms data sets
The medical condition and the quality of life of a patient suffering from Parkinson’s diseasecan be determined using the Movement Disorder Society (MDS) sponsored revision of Uni-fied Parkinson’s Disease Rating Scale (MDS-UPDRS) (Goetz et al. 2008). It is a question-naire consisting of 65 questions concerning the progression of disease symptoms. MDS-UPDRS is divided into four parts. Part I consists of questions about the ‘non-motor experi-ences of daily living’. These questions address complex behaviors, such as hallucinations,depression, apathy, etc., and patient’s experiences of daily living, such as sleeping prob-lems, daytime sleepiness, urinary problems, etc. Part II expresses ‘motor experiences ofdaily living’. This part of the questionnaire examines whether the patient experiences speechproblems, the need for assistance with the daily routines such as eating or dressing, etc. PartIII is referred to as the ‘motor examination’, while Part IV concerns ‘motor complications’,which are mostly developed when the main antiparkinson drug levodopa is used for a longertime period. Each question is anchored with five responses that are linked to commonlyaccepted clinical terms: 0 = normal (patient’s condition is normal, symptom is not present),1 = slight (symptom is present and has a slight influence on the patient’s quality of life), 2 =mild, 3 = moderate, and 4 = severe (symptom is present and severely affects the normal andindependent functioning of the patient, i.e. her quality of life is significantly decreased).
Montreal Cognitive Assessment (MoCA) (Dalrymple-Alford et al. 2010) is a rapidscreening instrument for mild cognitive dysfunction. It is a 30 point questionnaire consistingof 11 questions, designed to assess different cognitive domains: attention and concentration,executive functions, memory, language, visuoconstructional skills, conceptual thinking,calculations, and orientation.
Scales for Outcomes in Parkinson’s disease – Autonomic (SCOPA-AUT) is a specificscale to assess autonomic dysfunction in Parkinson’s disease patients (Visser et al. 2004).Physical Activity Scale for the Elderly (PASE) (Washburn et al. 1993) is a questionnairewhich is a practical and widely used approach for physical activity assessment in epidemi-ologic investigations. The above data sets are periodically updated to allow the cliniciansto monitor patients’ disease development through time. Answers to the questions from eachquestionnaire form the vectors of attribute values.
Table 1 summarizes the symptoms data sets considered in our research. It lists the numberof considered questions from each questionnaire, the range of attribute values, and the natureof the attribute values. All of the considered questions have ordered values, and—with theexception of questions from MoCA and PASE—increased values suggest higher symptomseverity and decreased quality of life.
When considering the possibility of using a multi-view framework, the independenceof the separate views should be inspected. In their work, Goetz et al. (2008) present thatthe MDS-UPDRS shows high internal consistency (Cronbach’s alpha = 0.79—0.93 acrossparts). MDS-UPDRS across-part correlations range from 0.22 to 0.66. Reliable factor struc-tures for each part are obtained (comparative fit index> 0.90 for each part), which supportsthe use of sum scores for each part, when compared to using a total score of all parts.
3.2 PPMI concomitant medications log
The PPMI data collection offers information about all of the concomitant medications thatthe patients used during their involvement in the study. These medications are described
58 Chapter 5. Detection of Parkinson’s Disease Progression Patterns

J Intell Inf Syst
Table 1 Characteristics of the questionnaire data used in the analysis
Questionnaire Number of Answers Ordered Higher value indicates
questions value range values higher symptom severity
MDS-UPDRS Part I 6 0–4 Yes Yes
MDS-UPDRS Part Ip 7 0–4 Yes Yes
MDS-UPDRS Part II 13 0–4 Yes Yes
MDS-UPDRS Part III 35 0–4 Yes Yes
MoCA 11 0–1 Yes No
PASE 7 1–2 Yes No
SCOPA-AUT 21 0–3 Yes Yes
by their name, the medical condition they are prescribed for, as well as the time whenthe patient started and (if) ended the medications therapy. For the purpose of our research,we initially concentrate only on whether the patient receives a therapy with antiparkinsonmedications, and which combination of antiparkinson medications the patient has receivedbetween each of the time points when the MDS-UPDRS test and the MoCA test wereadministered. The main families of drugs used for treating motor symptoms are levodopa,dopamine agonists and MAO-B inhibitors (National Collaborating Centre for Chronic Con-ditions 2006). Medications which treat Parkinson’s disease-related symptoms but are notfrom the above-mentioned groups of medications are referred to as other.
3.3 Experimental data
Symptoms of patients suffering from Parkinson’s disease are grouped into several data sets,representing distinct views of the data. These views consist of data from MoCA test, motorexperiences of daily living, non-motor experiences of daily living, complex motor exami-nation data, etc. For each patient these data are obtained and updated periodically (on eachpatient’s visit to the clinician)—at the beginning of the patient’s involvement in the PPMIstudy, and approximately every 6 months, in total duration of 5 years—providing the clini-cians with the opportunity to follow the development of the disease. The visits of each patientcan be viewed as time points, and the collected data on each visit is the data about the patient inthe respective time point. All time points collected for one patient form a short time series.
In the experiments we address two settings: the analysis of merged symptoms data andthe analysis of multi-view symptoms data.
Merged symptoms data are represented in a single data table, constructed by using thesums of values of attributes of the following data sets: MDS-UPDRS Part I (subpart 1and subpart 2), Part II, Part III, MoCA, PASE, and SCOPA-AUT.1 Goetz et al. (2015) usesums of symptoms values as an overall severity measure of a given aspect of Parkinson’sdisease. Similarly, we use sums of attribute values from different data sets to present theoverall status of patients concerning respective aspects of their everyday living. Table 2outlines the attributes used to construct the merged symptoms data, together with theirrange of values. This is a simplified representation using seven attributes, each represent-ing the severity of symptoms of a given symptoms group, which proved to be valuable inthe initial experiments (Valmarska et al. 2016).
1Appendix B presents the clustering quality results on data set obtained by feature selection.
5.2. Related Publication 59

J Intell Inf Syst
Table 2 List of attributes used in the merged symptoms data set
Dataset Attribute Value Higher value indicates
name range higher symptom severity
MDS-UPDRS Part I NP1SUM 0–24 Yes
MDS-UPDRS Part Ip NP1PSUM 0–28 Yes
MDS-UPDRS Part II NP2SUM 0–52 Yes
MDS-UPDRS Part III NP3SUM 0–138 Yes
MoCA MCATOT 0–30 No
PASE PASESUM 0–24 No
SCOPA-AUT SCAUSUM 0–63 Yes
Multi-view symptoms data consist of seven data sets: MDS-UPDRS Part I, Part Ip, PartII, Part III, MoCA, SCOPA-AUT, and PASE. Each of these data sets consists of valuesof attributes, which represent answers to the questions from a particular questionnaire.Similarly to Goetz et al. (2015), we added an additional attribute to each data set, whichis the sum of values of attributes in the given data set (this equals the values of individualattributes used in the merged symptoms data).
The experimental data include symptoms and medications data of 405 Parkinson’s dis-ease patients from the PPMI study. Out of these 405 patients, 265 patients are male and140 are female. The youngest patient was 33 years old at the beginning of the study (base-line visit), and the oldest patient was 84 years old. The average age of patients is 61.09years. The experimental data contains from 1 to 5 visits to the clinician. The average num-ber of recorded visits is 3.321. The experimental data consist of 1,345 patient’s visits andeach visit is considered a separate data instance, representing the basic building block of themethodology described in Section 4.
Fig. 1 Outline of the approach to Parkinson’s disease quality of life data analysis
60 Chapter 5. Detection of Parkinson’s Disease Progression Patterns

J Intell Inf Syst
4 Methodology
To assist the clinicians in making decisions regarding the patients’ therapy, we proposea procedure which involves a combination of clustering patients’ symptoms data and theanalysis of histories of patients’ medication treatments, followed by disease progressionanalysis. Figure 1 shows an outline of the proposed methodology, which addresses changesof data over time (i.e. over several patient’s visits) with the goal to suggest possible modifi-cations of the medication treatment. Moreover, our goal is to analyze the rate of progressionof Parkinson’s disease and discover the most frequent patterns of symptoms change; weaddress this goal by using skip-grams on patients’ changes of clusters. The usage of skip-grams can reveal groups of patients with an unusual pattern of symptoms change whichdeserve a more thorough look into the characteristics of that groups.
The input to the methodology are PPMI data sets of patient symptoms (described inSection 3.1) and the PPMI medications log data (described in Section 3.2), and the outputsare treatment recommendation patterns that can assist the clinician in deciding about furthertreatment of a patient, as well as the disease progression patterns providing insight into dis-ease development. The methodology2 consists of three separate threads whose outputs arecombined to identify treatment recommendation patterns and disease progression patterns.
Symptoms analysis. The first thread, referred to as Symptoms analysis in the top part ofFig. 1, finds groups of patients with similar symptoms by grouping the instances, definedas (patient, visit) pairs. It uses clustering and describes the discovered patient groups withinduced classification rules where classes correspond to individual cluster labels. Detailsof this thread are presented in Section 4.2.
Medications analysis. The second thread, referred to asMedication analysis in the bottompart of Fig. 1, is concerned with finding changes of medications and their dosages basedon patients’ symptoms changes between two consecutive visits to the clinician (e.g., dis-ease aggravation, improvement or no change). In this thread we observe the patientsmoving from one cluster to another cluster in two consecutive time points, i.e. two con-secutive visits to the clinician. The outcomes of the two threads are combined to a set oftreatment recommendation patterns (i.e. increased/decreased/unchanged dosage of med-ications) for the four groups of medications mentioned in Section 3.2. We elaborate onthis thread in Section 4.3.
Disease progression analysis. The third thread, referred to as Disease progression analy-sis in the middle part of Fig. 1, is concerned with finding patterns of disease progression,using skip-grams analysis on cluster crossing sequences. Details are given in Section 4.4.
The first step of the methodology is the construction of individual patient-visit pairs(pi, vij ), representing individual instances or items. For each patient pi a set of pairs(pi, vij ) is constructed, where vij describes the symptoms recorded at an individual patient’svisit to the clinician. These instances (patient-visit pairs) are the items representing the basicunit of analysis in the Symptoms analysis thread of the methodology. The attribute valuesof instance (pi, vij ) correspond to symptoms of patient pi on visit j , and vij and vij+1correspond to two consecutive patient’s visits. This is followed by clustering of instances.
The basic unit of the Medications analysis thread of the methodology are (pi, vij , cij ,mij , vij+1, cij+1, mij+1) tuples, where cij is the cluster label for instance (pi, vij ) and mij
are the medications that patient pi takes at the time of visit j . Elements cij+1 andmij+1 are
2The code is available upon request. Please note, we do not have a permission to share the data. Users canobtain permission from the Parkinson’s Progression Markers Initiative (PPMI): http://www.ppmi-info.org/
5.2. Related Publication 61

J Intell Inf Syst
the cluster label and prescribed medications of the same patient on visit j + 1, i.e. at thetime of the next visit.
The basic unit of theDisease progression analysis thread are patients’ sequences of clustercrossings. Patientpi cluster crossing sequence isSeqi , defined as a sequenceof cluster assign-ments for patient pi at time points vi1, vi2, ..., viki , where vij correspond to the symptomsrecorded at visit vij of patient pi , and ki is the number of visits to the clinician by patient pi .
As our methodology is based on clustering, in Section 4.1 we first present cluster validityindices used to asses the quality of clusters produced by different tested methods.
4.1 Cluster validity indices
The number of groups (clusters) of similar patients was unknown before the start of thedata analysis. In order to estimate the optimal number of clusters, we used internal clustervalidity indices (Arbelaitz et al. 2013), which are—in the absence of ground truth labels—used to estimate the quality of generated clusters. The clustering quality is determinedbased on cluster compactness—how close are the related objects in each cluster, and clusterseparation—how distinct or well-separated is each cluster from other clusters.
Many clustering validity indices (i.e. cluster quality measures) exist. We use three ofthe best performing indices from Arbelaitz et al. (2013): Silhouette analysis index (SA)(Rousseeuw 1987), Davies-Bouldin index (DB) (Davies and Bouldin 1979), and Calinski-Harabasz index (CH) (Calinski and Harabasz 1974). Below we present definitions andintuition behind these indices.
Let data set X be a set of N objects represented as vectors in an F -dimensional space,X = {x1, x2, ..., xN } ⊆ ℜF . Clustering ofX is a set of disjoint clusters that partitionsX intoK groups. Clustering C is defined as disjoint partition of objects in X, C = {c1, c2, ..., cK },where
⋃ck∈C ck = X, ck ∩ cl = ∅, ∀k = l. Centroid of a cluster ck is defined as ck =
1|ck |
∑xi∈ck xi . Similarly, the global centroid is defined as X = 1
N
∑xi∈X xi . The Euclidean
distance between two objects xi and xj is denoted as de(xi, xj ) (Arbelaitz et al. 2013).
Silhouette index is a normalized summation-type index. The compactness is measuredbased on the distance between all the objects in the same cluster and the separation is basedon the nearest neighbor distance (Arbelaitz et al. 2013; Rousseeuw 1987; Kaufman andRousseeuw 1990).
SA(C) = 1N
∑
ck∈C
∑
xi∈ck
b(xi, ck) − a(xi, ck)
max {a(xi, ck), b(xi, ck)}(1)
wherea(xi, ck) =
1|ck|
∑
xj∈ckde(xi, xj ) (2)
is the normalized distance of object xi to all the objects in the same cluster (low values ofthis term are indicators of high compactness), and
b(xi, ck) = mincl∈C\ck
⎧⎨
⎩1|cl |
∑
xj∈clde(xi, xj )
⎫⎬
⎭ (3)
is the normalized distance from objectxi to all objecs from its closest neighbor cluster (highvalues of this term are indicators of high separation). For each object, the quotient in (1)is a value between −1 and 1. A value close to 1 indicates that the object is well placedin its current cluster, while a value close to −1 indicates that it would be better placed in
62 Chapter 5. Detection of Parkinson’s Disease Progression Patterns

J Intell Inf Syst
the nearest cluster. Value 0 indicates a borderline quality of placement. An average over allobjects gives an estimate on the overall quality of clusters. If there are too many or too fewclusters as a result of inappropriate choice of the number of clusters K , many quotients willbe low and the average score will reflect that.
Davies-Bouldin index estimates the compactness based on the distance of objects in acluster to its centroid and the separation based on the distance between centroids (Arbelaitzet al. 2013; Davies and Bouldin 1979).
DB(C) = 1K
∑
ck∈Cmax
cl∈C\ck
{S(ck)+ S(cl)
de(ck, cl)
}(4)
whereS(ck) =
1|ck|
∑xi∈ck
de(xi, ck) (5)
is an average distance from objects in a cluster to its centroid. The S(ck) is a measure ofthe compactness for cluster ck (the lower the value the more compact is the cluster). Thequotients in (4) are indicators of separations between two clusters, ck and cl (the lowerthe quotient the better the two clusters are separated). By taking the maximum over thesequotients we get the estimation of the worst case separation (i.e. for cluster ck and its closestcluster). The average over these maxima is the value of DB index, whose lower valuesindicate better clusterings.
Calinski-Harabasz (CH) index estimates the compactness based on the distances fromthe objects in a cluster to its centroid (see the denominator below). The separation is basedon the distance from the centroids to the global centroid X (see the nominator) (Arbelaitzet al. 2013; Calinski and Harabasz 1974).
CH(C) = N − K
K − 1
∑ck∈Cde(ck,X)∑
ck∈CS(ck)(6)
Factor K − 1 normalizes the distances of cluster centroids to global centroid, and factorN − K = ∑K
k=1(|ck| − 1) normalizes the distances of objects to their centroids. Goodclustering should have a large value in the nominator (large distances of clusters to globalcentroid) and a low value in the denominator (low distances of objects to their centroids)and therefore a large value of the CH score.
4.2 Symptoms analysis methodology
After constructing the instances—i.e. (patient, visit) pairs—in step ST1 of the methodology,the symptoms analysis thread (top of Fig. 1) consists of three further steps: clustering, rulelearning and cluster ordering, corresponding to the individual steps ofAlgorithm1 (lines 1-3).
The main input to Algorithm 1 is a set of symptoms views D, describing the same n
instances, which hold the symptoms data about p patients. This collection consists ofm datasets (views). The k-th view (1 ≤ k ≤ m) is defined as Dk , which is a matrix with n rows(the number of instances) and |Ak| attributes. The concatenated data set, denoted as F, is amatrix consisting of n rows and
∑ |Ak| columns (union of attributes across all the views).The medication data set, denoted by M, is a matrix consisting of n rows and 4 columns—i.e. dosage data about the 4 PD medication groups. An auxiliary input is I, a matrix whichholds the indices of instances, defining the (pi , vij ) pairs.
The outputs of the algorithm are the assigned cluster labels c (vector of length n).The clustering of patients uses the provided views (symptoms data sets) and the chosen
5.2. Related Publication 63

J Intell Inf Syst
clustering method (line 1 and line 2). The probability scores of dosage change of Parkin-son’s disease medications when patients’ statuses improve or degrade are computed in line4 with Algorithm 2) and are part of the medications change analysis methodology. Theseprobability scores are estimates of medication impact on the change of symptoms.
In step ST2 of the methodology outlined in Fig. 1, we perform clustering on instances i.e.patient’s i symptoms recorded at a visit v,ij in order to determine groups of patients with sim-ilar symptoms. Note that the clustering step is performed once on the collection of views Dwhich describes the instances. Ourmethodology can address both themerged symptoms dataand the multi-view data analysis setting. The only difference is the clustering method appliedin stepST2 of themethodology. In the case ofmerged symptoms data we performed k-meansclustering (line 1 in Algorithm 1), while for clustering of the multi-view data we used themulti-view clustering approach proposed in He et al. (2014) (line 2 in Algorithm 1).
In the next step, ST3, we use the cluster labels (c) as classes in rule learning in order toobtain meaningful descriptions of patients in each cluster (step ST3, line 3 in Algorithm 1).
64 Chapter 5. Detection of Parkinson’s Disease Progression Patterns

J Intell Inf Syst
Cluster labels obtained in step ST2 are input to step ST3 and are used as class labels inthe rule learning process. The purpose of rule learning in step ST3 is to induce explanatoryrules describing the induced clusters. These rules are presented to the experts (step ST4) toevaluate whether the induced clusters make sense and to determine an ordering of clustersaccording to the severity of symptoms of instances assigned to them. The rule sets describ-ing the data are induced on a concatenated data set consisting of data sets considered in theclustering step ST2 (input F of Algorithm 1).
The rule sets for each class variable are learned using our recently developedDoubleBeam-RL algorithm (Valmarska et al. 2017; Valmarska et al. 2015). This is aseparate-and-conquer classification rule learning algorithm which uses two beams and sep-arate heuristics for rule refinement and rule selection. Stecher et al. (2014) showed that thetwo phases of rule learning, rule refinement and rule selection, should be separated anduse different rule evaluation heuristics in order to obtain rules with improved quality. Theyalso introduce the idea of using the so-called inverted heuristics in the refinement phase inorder to obtain rules that maximize the number of covered positive examples. By using theheuristics that take full advantage of the refinement and selection process separately, theDoubleBeam-RL algorithm is able to find rules which maximize the number of covered pos-itive examples and minimize the number of covered negative examples, which is the goal ofclassification rule learning algorithms (Stecher et al. 2014). The DoubleBeam-RL algorithmgenerates rules with comparable accuracy to the rules generated by the state-of-the-art algo-rithms for classification rule learning (Valmarska et al. 2017), but as a side effect of usingthe inverted heuristics in the refinement phase, the induced rules have more conditions.The resulting longer rules with improved expressive power (Stecher et al. 2014; Michalski1983) are preferred by the clinicians (Gamberger and Lavrac 2002). This is the reason forchoosing the DoubleBeam-RL algorithm as the description tool in step ST 3. Note that theDoubleBeam-RL algorithm does not perform rule pruning.
In the final step, ST4, the experts are presented with the descriptions of the obtained clus-ters, where the expert knowledge is used to interpret the obtained groups of patients and toorder them according to the severity of symptoms exhibited by the patients assigned to them.The produced ordering of clusters may be total (all pairs of clusters are comparable) or partial(some clusters may not be comparable). Our methodology works for both cases as describedbelow, but if in this step we get many incomparable clusters, this may be an indication that wehave toomany irrelevant or redundant attributes andwe shall employ feature subset selection.
Based on the expert’s interpretation of clusters and the ordering it produces, we take intoaccount only comparable clusters and consider these cluster changes to be either positiveor negative. When a patient moves from a cluster described by symptoms indicating worsequality of life to the one described by better quality of life indicators, we consider thischange to be positive. A negative cluster change occurs when the symptoms of a patientdegrade. Transitions between incomparable clusters are left out of our analysis.
In O1, we combine detected medications changes from step ST 8 and cluster severityinformation from step ST4. The combined information contains medications changes forpositive cluster changes and for negative cluster changes i.e. medications changes withimprovement or aggravation of the patients’ symptoms. Cluster changes are determined inline 5 of Algorithm 1 and the approach is further explained in Section 4.3.
4.3 Medications change analysis methodology
In this thread of the methodology (bottom of Fig. 1, lines 4–6 in Algorithm 1) we determinethe medications changes that have occurred simultaneously with moves between clusters
5.2. Related Publication 65

J Intell Inf Syst
observed in patients during two consecutive time points (two consecutive visits). An impor-tant benefit of our approach is that each patient provides a context (similar observed andunobserved variables) for himself/herself. By following the development of symptoms foreach patient separately, we remove the influence of other conditions the patient is treated for.
The information about patients’ assignment to clusters and theirmedication therapy in twoconsecutivevisits is held in (pi, vij , cij , mij , vij+1, cij+1,mij+1) tuples. In stepST 8 onFig. 1we follow all patients through time. For each pair of patient’spi consecutive visits to the clin-ician, we record the cluster change that has occurred between the two visits, cij → cij+1, aswell as the change inmedications prescriptions,!(mij ,mij+1),which the patients received inthe consecutive timepoints. For each antiparkinsondruggroup (levodopa, dopamine agonists,MAO-B inhibitors, and others) we record whether their dosage has increased, decreased orstayed unchanged between the two visits. Dosages of PD medications are translated intoa common Levodopa Equivalent Daily Dosage (LEDD) which allows for comparison ofdifferent therapies (different medications with personalized daily plans of intake).
Algorithm 2 presents the pseudocode of the getMedsChangeP robabilities function. Itdescribes how we determine the changes of medications dosages co-occurring with shifts inpatients’ symptoms (characterized by a change of clusters). This function (called in line 4 ofAlgorithm 1) estimates the probability score of medications dosage changes when patients’symptoms have changed (patients have crossed clusters) or stayed the same (patient didnot change clusters between two consecutive visits). Additionally, it also counts the type ofmedication modifications for each cluster crossing. The algorithm takes as an input patients’medications data M, the index data set I, and the assigned cluster labels c. The output aretwo matrices, medsChangeP rob and medChange of the dimension K ×K × 4× 3 (K isthe number of clusters, we have 4 medication groups and 3 possible changes in severity ofsymptoms). Each cell of the output matrix medsChangeP rob contains a probability thata given medication group will change value (increase, decrease, or stay unchanged) for acertain cluster crossing. Similarly, themedsChange matrix contains the number of changesof each type for each group and each crossing.
For each patient (line 5 in Algorithm 2), we track his/her status development throughtime. For each two consecutive visits (line 7), we register the clusters the patients wereassigned to (lines 8 and 9). These consecutive cluster assignments represent a so-calledcluster crossing (line 10). For each patient, we also follow therapy changes between twoconsecutive visits (lines 11 and 12). We consider therapy changes to be dosage changesof any of the antiparkinsonian medications (line 13). For each medications group, werecord whether the LED dosage between two consecutive time has increased, decreased,or stayed unchanged (line 14). We record the number of therapy changes for each clus-ter crossing (line 15). The probability of medications change is calculated in line 24 ofAlgorithm 2 as the ratio between the recorded number of therapy modifications per clustercrossing and the number of cluster crossings. The output of Algorithm 2 are two matrices,medsChangeP rob and medsChange, described above.
Both matrices are returned to Algorithm 1. Matrix medsChange is further processedin line 5 with function getSummedMedsPatterns. Based on the clusters ordered by theexperts according to the severity of symptoms and the information on medications changesfor each cluster crossing, we determine patterns of medications adaptations, related to theimprovement or aggravation of patients’ symptoms. Cluster crossings are classified as eitherpositive or negative. We aggregate (sum) the medications change patterns from clusterchanges of the same nature (positive or negative) to determine the patterns of medicationmodifications when the patients’ status improved or worsened. The results are visualized inline 6 of Algorithm 1 (for the results, see Fig. 3).
66 Chapter 5. Detection of Parkinson’s Disease Progression Patterns

J Intell Inf Syst
5.2. Related Publication 67

J Intell Inf Syst
4.4 Disease progression analysis using skip-grams
In this thread of the methodology (middle of Fig. 1, step ST 9) we determine patterns ofcluster changes, resulting in O2 combining the patients’ cluster change patterns with thepatients’ medication data. This allows us to determine patterns of disease progression (indi-cated by the patterns of cluster change) and impact of medications on these patterns. OutputsO1 and O2 are presented to the expert for analysis and validation.
Medical status of each patient’s status at successive time points can be expressed as asequence of clusters. The status of patient pi at time point vij is responsible for patient’sassignment to cluster cij at that point. Let Seqi be a sequence of cluster assignments forpatient pi at time points vi1, vi2, ..., viki , denoted as Seqi = (ci1, ci2, ..., ciki ) ⊆ C, whereki is the number of visits to the clinician by patient pi and C = {c1, c2, ..., cK } is theclustering (set of cluster labels) on the symptoms data. We denote the set of all clusterswitching sequences for all patients as Seq
Seq=⋃
1≤i≤p
Seqi, (7)
where p denotes the number of analyzed Parkinson’s disease patients.The approach is inspired by natural language processing (NLP) approaches. In NLP,
an n-gram is defined as a contiguous sequence of n items from a given sequence of textor speech. In order to analyze the patterns of symptoms changes across all the patients,we perform skip-gram analysis on Seq. A patient’s sequence Seqi can be regarded as anindividual document in corpus Seq, where each cluster assignment cij represents the j -thword in document Seqi .
The definition of k-skip-n-grams (Guthrie et al. 2006) for a document constructed fromwords w1...wl can be expressed as
{wi1 , wi2 , ..., win |∑
1≤j≤n
ij − ij−1 < k} (8)
Skip-grams reported for a certain skip distance k allow a total of k or less skips to con-struct the n-gram. Thus, 3-skip-n-gram results include 3 skips, 2 skips, 1 skip, and 0 skips.The 0-skip-n-grams are n-grams formed from adjacent words. The algorithmic construc-tion of k-skip-n-grams starts with unigrams (which are 0-skip-1-grams) and progressivelyincreases both the skip and the length of the sequence until the required k and n arereached.
We use skip-grams to determine the most frequent statuses of patients, and the mostfrequent patterns of their symptoms changes. Using skip-grams, the number of investi-gated n-grams significantly increases, thus providing more reliable introspection into clustercrossings. By skipping certain time points, we take into account that patients’ statuses mayoccasionally result from other factors rather than the natural progression of the disease orthe medication therapy. For example, the patient’s non-motor symptoms (i.e. depression,apathy, etc.) may worsen due to a sudden death in the family, loss of a friend or loss of apet. In other words, skip-grams make the resulting patterns more robust compared to then-grams.
We present an example illustrating the advantage of using skip-grams instead of n-gramsin analyzes of sequences. Lets say that a Parkinson’s disease patient (pi) has had 5 visits tothe clinician. Based on the patient’s symptoms, in each visit the patient was assigned to thefollowing clusters Seqi = (1, 0, 2, 0, 1) (on visit 1, the patient was assigned to the clusterlabeled as 1, on the second visit, the patient was assigned to the cluster with label 0, etc.).
68 Chapter 5. Detection of Parkinson’s Disease Progression Patterns

J Intell Inf Syst
The sets of sequences obtained for bigrams, 2-skip-bigrams, trigrams, and 2-skip-trigramsare presented below:
bigrams: {10, 02, 20, 01}2-skip-bigrams: {10, 12, 10, 02, 00, 01, 20, 21, 01}trigrams: {102, 020, 201}2-skip-trigrams: {102, 100, 101, 120, 121, 101, 020, 021, 001, 201}
Using skip-grams to identify interesting patterns in short series of disease progression(reflected by cluster changes) is novel and we are not aware of other equally effective andnoise-tolerant method for analysis of really short series. Another seemingly related approachwould be to compute frequent itemsets used with association rules (Agrawal et al. 1993)but note that itemsets do not preserve temporal aspect of sequences which is an importantinformation for disease progression.
5 Results of data analysis
The experimental work of this paper is divided into four parts. Initially, we are inter-ested in whether Parkinson’s disease patients can be divided into groups of patients withsimilar symptoms. After determining the appropriate number of clusters in Section 5.1,we report results of two experimental settings: i) using k-means clustering of the mergedsymptoms data set, and ii) using multi-view clustering on seven separate data sets (sevenseparate views). The results of both clustering experiments are presented in Section 5.2.This analysis was followed by an attempt to understand the effects of medications changeson the changes of patients’ symptoms; these results are presented in Section 5.3. Finally, inSection 5.4 we present the results of experiments intended to find patterns in Parkinson’sdisease progression. The four groups of reported results were obtained with methodologydescribed in Sections 4.1, 4.2, 4.3, and 4.4, respectively.
5.1 Determining the number of clusters
In order to determine the optimum number of clusters we ran the k-means clustering algo-rithm on the merged data set using different values for k. The obtained clusters wereevaluated using the cluster validity indices introduced in Section 4.1. In terms of these clus-ter validity indices, better clustering quality is indicated by larger values of SA and CHindexes and lower values of DB index (Liu et al. 2010).
The results of k-means clustering presented in Table 3 show scores obtained for differentvalues of k. The table indicates that k-means clustering produces the best clusters when thevalue of k is set to 2 or 3. The clustering quality decreases for k > 3, as indicated by all ofthe considered cluster validity indices.
We hypothesize that the reason for no difference in DB and CH indexes when k = 2 andk = 3, while there is a significant difference in SA, is due to differences how these indicesare computed: DB and CH compare distances to centroids, while SA uses nearest neighborsbetween the instances.
Setting the value of k to 2 would divide patients into two groups: one with a good statusand the other with a bad status of PD symptoms; this grouping would not take into accountother values of symptoms except the ones characterized as either normal or very problematicfor the patients. For this reason and to provide more variability we set the value of k to 3 toget three patient clusters instead of just two.
5.2. Related Publication 69

J Intell Inf Syst
Table 3 Values of clusteringvalidity scores for differentnumber of clusters. Clusters aregenerated on the merged data set,using the k-means clusteringalgorithm
Number Silhouette Davies-Bouldin Calinski-Harabasz
of clusters index (SA) index (DB) index (CH)
2 0.516 0.916 162.540
3 0.347 0.916 162.540
4 0.371 1.266 54.103
5 0.279 1.133 40.545
6 0.276 1.458 32.412
7 0.258 1.489 26.992
Please note that the selection of k-means approach for clustering the merged data setwas done after series of experiments. We checked three clustering approaches: k-means, k-medoids (Kaufman and Rousseeuw 1987), and DBSCAN (Ester et al. 1996). For each ofthe considered approaches, we evaluated the produced clusters using the validity indicesSA (Rousseeuw 1987), DB (Davies and Bouldin 1979), and CH (Calinski and Harabasz1974). Based on the results, we decided to use k-means as our clustering method of choice.Evaluation details for the considered clustering approaches can be found in Appendix A inTable 5.
5.2 Results of symptoms data analysis
To determine the progression of patients’ symptoms, for each Parkinson’s disease patientfrom our data set and for each two consecutive time points we investigated changes of clus-ters in which the patient participated. With the help of the expert, we order the clustersaccording to the quality of life indicators (i.e. severity of symptoms) of patients in the clus-ters. The evaluation of the quality of discovered clusters is two-fold. Clusters are initiallyevaluated using the internal cluster validity indices: SA, DB, and CH. The generated clustersare described by rules produced with the DoubleBeam-RL algorithm, and these descriptionsare presented to experts. Based on the rules, experts order clusters according to the severityof symptoms of patients involved in each cluster.
5.2.1 Results of merged symptoms data analysis
The classification rules describing the clusters obtained from the merged symptoms dataanalysis are presented in Table 4. The rules indicate that the clusters are linearly ordered(with indexes 0, 1, and 2) and contain instances (patients symptoms recorded at a certaintime point) with different severity of their motor symptoms. Cluster 0 consists of instanceswith the sum of motor symptoms severity up to 22 (out of 138). Patients that have slightlyworse motor symptoms are assigned to Cluster 1 (sum of motor symptoms severity between23 and 42). In Cluster 2 there are patients whose motor symptoms significantly affect theirmotor functions (sum of motor symptoms severity greater than 42). The worsening of motorsymptoms is followed by the aggravation of non-motor symptoms, mostly autonomic symp-toms (sleeping, urinary, or constipation problems). This can be observed by the increasedvalues of attributes SCAUSUM and NP2SUM in the rule sets describing Cluster 1 andCluster 2.
Inspection of the time line of cluster changes for a single patient. In order to illus-trate the cluster changes for a patient, we subjectively chose a patient who already completed
70 Chapter 5. Detection of Parkinson’s Disease Progression Patterns

J Intell Inf Syst
Table 4 Rules describing clusters obtained by k-means clustering on the concatenated data set of attributesums. Variables p and n denote the number of covered true positive and false positive examples respectively.We present the complete rules generated by the DoubleBeam-RL algorithm which does not prune its learnedrules
Rule p n
Rules for cluster 0
NP3SUM ≤ 20 → cluster = 0 488 4
NP3SUM ≤ 21 AND NP2SUM ≤ 6 → cluster = 0 321 0
NP3SUM = (19, 22] AND NP1SUM = 0 → cluster = 0 54 23
Rules for cluster 1
NP3SUM = (22,30] → cluster = 1 323 13
NP3SUM = (30, 39] AND SCAUSUM = (4, 10] → cluster = 1 91 17
NP3SUM = (22, 42] AND NP2SUM = (0, 6] → cluster = 1 206 6
NP3SUM = (22, 34] AND SCAUSUM = (10, 17] AND
PASESUM >9 → cluster = 1 101 6
Rules for cluster 2
NP3SUM >42 → cluster = 2 125 1
NP3SUM >37 AND NP1PSUM >5 AND MCAVFNUM ≤ 18 → cluster = 2 123 6
NP3SUM >30 AND NP2SUM >17 → cluster = 2 82 0
SCAUSUM >20 AND NP2SUM >9 AND MCAVFNUM ≤ 24 → cluster = 2 54 18
NP3SUM >30 AND SCAUSUM >11 AND NP2SUM >12 → cluster = 2 123 2
NP3SUM >36 AND SCAUSUM >6 AND NP2SUM >6 AND
NP1PSUM >2 → cluster = 2 168 6
involvement in the PPMI study, and present her changes in the overall status in Fig. 2. Thedisease status can be tracked through changes in the patient’s cluster assignments recordedduring consecutive visits to the clinician. We also present the changes in medicationstherapy, made in order to keep the patient’s symptoms as stable as possible.
We presented the figure (as well as the symptoms and medications data) to our consultingclinician for interpretation. He commented that the particular treatment was in accordancewith the standard practice and guidelines for the treatment of Parkinson’s disease patients.The usual practice is that clinicians almost always start with MAO-B inhibitors (suchas Azilect) to protect neurons and later introduce dopamine agonists (such as Requip orNeupro) in order to manage Parkinson’s disease (European Parkinson’s Disease Association2016). The usage of levodopa (Carbidopa/Levodopa) is delayed as long as possible—symptoms allowing—in order to avoid the side effects of prolonged usage of levodopa, suchas dyskinesia and on/off fluctuations.
As evident from the diagram, the initial status of the patient was good. The clinicianstarted the treatment of Parkinson’s disease by introducing a MAO-B inhibitor (Azilect).Then clinician increased the dosage, trying to find an appropriate dosage for the specificpatient. Once the patient’s symptoms worsen (as indicated by the cluster changes betweenvisits V04 and V06), the clinician introduced dopamine agonists to stabilize the symptoms.There were several adjustments aiming to find the appropriate dopamine agonist therapy
5.2. Related Publication 71

J Intell Inf Syst
Fig. 2 Inspection of a cluster change time line of a single patient. Points on the time line present visits thepatients has made to the clinician. Patient’s medications therapy is presented by the groups of antiparkinsonmedications the patient has received during her involvement in the PPMI study. The color of medicationstherapy determines the group of antiparkinson medications—MAO-B inhibitors are presented with the greenline, dopamine agonists are presented with the blue line, and levodopa based medications are presented withthe red line on the top. Line width indicates the value of LEDD, i.e. the ticker the line the higher the valueof LEDD. Endpoints of lines indicate beginnings and ends of treatments with particular medications. Forexample, the patient was treated with Requip (a dopamine agonist medication) starting between visit 6 (V06)and visit 8 (V08) and ending sometimes after visit 8. The treatment with Neupro (with almost the samevalue of LEDD) started immediately after the treatment with Requip stopped and was ongoing even after thepatient finished her involvement in the PPMI study (V12)
for the patient: the clinician started with Requip and changed the medication’s dosage sev-eral times (represented by the steep increase of the blue line). The patient initially reactedwell to this change and her overall status was improved (V08). However, the status thenworsened and the clinician changed the therapy by ending the intake of Requip and intro-ducing Neupro. This medication change did not improve the patient’s status at visit V10,and by visit V12 her status got even worse (our methodology assigned the patient to cluster2 at visit V12). Since the patient’s status was bad and the quality of life has significantlydeclined, the clinician was forced to introduce levodopa.
5.2.2 Results of multi-view symptoms data analysis
In addition to analyzing the merged symptoms data, we performed a number of experimentson multi-view symptoms data consisting of seven separate symptoms data sets. In theseexperiments, we used the CoNMF multi-view clustering algorithm (He et al. 2014). Simi-larly to the merged view clustering approach, we tried to compare the clusters obtained bythe multi-view approach by the severity of patients’ symptoms assigned to them. The anal-ysis has revealed that there were no significant intersections of the instances assigned to theclusters obtained by the multi-view approach compared to the clusters obtained by k-means(k = 3) clustering of the merged symptoms data set. Furthermore, given that the distinc-tion between the three produced clusters was unclear, the ordering and comparison of theclusters was not possible This result means that we were not able to interpret the clusteringproduced by the CoNMF algorithm. In Appendix C we present the results of further analysison impact different views have in the multi-view clustering process.
Results from Table 8,3 and Table 10 in Appendix C show that the quality of clustersinduced using the CoNMF approach is lower than the quality of clusters generated on
3Note that in Table 9 we present the Adjusted Random Index values where we compare the cluster similaritybetween the three best performing bi-view clustering settings.
72 Chapter 5. Detection of Parkinson’s Disease Progression Patterns

J Intell Inf Syst
the merged data set. Results reveal that it is beneficial to combine multiple data sets inorder to obtain better clusters and better overall picture of the patients that were assignedto these clusters. However, when including new views, one must be careful, since theinclusion of seemingly uncorrelated views can hinder the performance of the multi-viewapproach. Results from Table 10 show that the best quality clusters are obtained when usingonly three data sets (views): SCOPA-AUT, MDS-UPDRS Part II, and MDS-UPDRS PartIII. Due to low quality of induced clusters, we decided not to investigate the changes ofmedications dosages with respect to the changes of clusters generated in the multi-viewclustering setting. However, in future, we will consider also other multi-view clusteringalgorithms.
Rules discovered with the best multi-view clustering are presented in Tables 11, 12,and 13 in Appendix D. The groups of patients are described mostly by their motor symptomsand descriptions are supported by attributes from the data set SCOPA-AUT. The SCOPA-AUT data set contains information about the autonomic symptoms of patients, namelymostly constipation and urinary problems. Even though the resulting multi-view clusteringis of low quality and the experts were not able to order the produced clusters by the severityof the symptoms of patients involved in them, the consulted experts were pleased with thediscovery that autonomic symptoms from SCOPA-AUT play an important role in producedclusters, as recent research shows that autonomic symptoms can be a potential premotormarker of Parkinson’s disease (Ceravolo et al. 2010).
5.3 Results of medications change analysis
The experts were able to order clusters obtained from the merged symptoms data (presentedin Table 4) by the severity of symptoms. The order was total (all clusters were compara-ble), so we assigned the three clusters indexes 0, 1, and 2 (lower index means lower severityof symptoms). When a patient moves from a cluster with a lower index to the one with ahigher index, the patient’s symptoms have worsened and we consider this change to be neg-ative. A positive cluster change is recorded if the patient’s symptoms have improved and thepatient moves to a cluster with a lower index. The medications change patterns for positiveand negative cluster change were obtained with the approach described in Section 4.3. Theresults are shown in Fig. 3.
Figure 3a shows the medications changes when a positive cluster change has occurred.The red bars represent the number of times the dosage of medications from cer-tain medication group has increased. Similarly, the number of times the medicationdosage has decreased is shown in green. Blue bars present the number of timeswhen a positive cluster change has occurred, but the medication dosage has stayedunchanged.
Figure 3b outlines the medications changes when a negative cluster change has takenplace. These two graphs show patterns of medications modifications as a result of signif-icant changes in the patient’s status (patient’s symptoms in two consecutive time pointschanged significantly, thus prompting a cluster change).
Figure 3 indicates that the patients’ motor symptoms improve when the dosage of med-ications from the levodopa drug group is increased and the dosage of dopamine agonists isdecreased or stays the same. When the dosage of both levodopa medications and dopamineagonists is increased the motor symptoms of the patients worsen. Clinicians prescribe andgradually increase the dosages of levodopa to handle the motor symptoms of patients. Theusage of high dosages of dopamine agonists produces side effects affecting the non-motor
5.2. Related Publication 73

J Intell Inf Syst
Positive cluster change.
Negative cluster change.
(a)
(b)
Fig. 3 Recorded Parkinson’s disease medications changes when patient’s cluster allocation has changed.Clusters were obtained from merged symptoms data set. A positive cluster change indicates that the patient’ssymptoms improved. A negative cluster change occurs when the patient’s symptoms worsen. Medicationgroups are visually divided by vertical dashed lines
symptoms of the patients. A decrease of dosage eliminates these side effects and improvesthe patient’s status.
5.4 Disease progression patterns
Figure 4 presents the results from the 3-skip-2-gram analysis of cluster crossings in themerged symptoms clustering setting. The results indicate that the patients’ status is mostlystable over the considered time points. Patients tend to stay in the clusters they wereinitially assigned to. This is followed by a portion of patients whose symptoms worsen
74 Chapter 5. Detection of Parkinson’s Disease Progression Patterns

J Intell Inf Syst
Fig. 4 Histogram resulting from 3-skip-2-gram analysis. The possible cluster crossings are listed on the X-axis (e.g., 01 indicates that a patient has moved from Cluster 0 to Cluster 1), while the Y-axis represents thenumber of cluster crossings
(cluster crossings 01 and 12) and those whose symptoms improve (cluster crossings 10and 21). These symptoms changes have all occurred gradually—patients have moved tothe adjacent cluster. The number of patients whose symptoms have significantly changed(cluster crossings 02 and 20) is much lower.
The analysis of bigrams (2-grams) in Fig. 4 cannot reveal trends in patients’ status overlonger time period. Figure 5 presents the patterns of 4 almost consecutive cluster crossingsobtained by 3-skip-4-gram analysis of the sequences of cluster crossings on the merged dataset. It confirms the results from Fig. 4 which indicate that patients’ status is usually stableand they tend to stay in the same cluster to which they were initially assigned.
Figure 5 reveals existence of interesting and slightly unexpected patterns of symptomschange: 1001, 0110, and 2000. We selected these sequences (subjectively) as patients’ con-ditions are not steadily deteriorating and use them to illustrate our approach—the patientswith similar symptoms have similar patterns of disease progression. We discuss groups ofpatients with 0110 and 2000 pattern below.
The analysis of patients with the 0110 cluster change pattern reveals that these areyounger patients (50–64 years old) who were enrolled in the PPMI study soon after
Fig. 5 Histogram resulting from 3-skip-4-gram analysis. The possible cluster crossings are listed on theX-axis and the Y-axis represents the number of cluster crossings
5.2. Related Publication 75

J Intell Inf Syst
their Parkinson’s disease diagnosis (in less than 6 months). A common thread of thesepatients is that they have had problems with anxiety at some point of the disease (quan-tified with score 1 – a symptom is present and has a slight influence on the patient’squality of life). Most of these patients have also started feeling a decline in theircognitive functions. These patients were treated with the combinations of dopamine ago-nists and MAO-B inhibitors. When patients motor symptoms have slightly worsened,the clinicians have tried to stabilize them by increasing the dosage of dopamine ago-nists, changing the dopamine agonists medication, or in rare cases introducing levodopa.These treatments are in accordance with the new practices for Parkinson’s disease—clinicians introduce MAO-B inhibitors to protect the neural system of the patient, andprescribe dopamine agonists in order to control motor symptoms that are bothering thepatients, and in that way they prolong the time before levodopa is introduced in thetherapy.
An inspection of patients with cluster change pattern 2000 reveals that two patientswho exhibit this pattern are elder female patients (more than 71 years old), with two yearsbetween the time of their diagnosis and their enrolment into the PPMI study. In the timeof their initial visits, both patients had problems with their facial expression, problemswith fingerntapping, hand movement, pronation-supination, toe-tapping, leg agility, pos-tural tremor, rest tremor amplitude and constancy of rest tremor. For both patients, thesesymptoms were prominent on the left-hand side. In addition to their motor problems, bothpatients have experienced problems with depression and anxiety. Patients’ medications logreveals that once the patients’ motor symptoms were deemed problematic (at that time pointthe patients were assigned to Cluster 2), their respective clinicians started the symptomstreatment with levodopa medications. The introduction of levodopa lead to stabilization ofthe symptoms, and in our research, we observe a crossing of the patients from Cluster 2 toCluster 0.
6 Conclusions
The aim of our research is to develop a methodology which will make suggestions to theclinicians about the possible treatment changes that will improve the patient’s quality oflife. We also aim to discover groups of patients that follow interesting patterns of symptomschange in hope that their disease progression will reveal common symptoms and medica-tions threads, which could benefit the future patients. Our methodology contains trackingthe changes in medication patterns, clustering, rule learning and skip-grams. The resultsconfirm known facts about the Parkinson’s disease: the motor symptoms, tremor, shaking,involuntary movement, etc. are the characteristic symptoms of the disease and significantlyaffect the quality of life of the suffering patient. We show that Parkinson’s disease patientscan be divided into clusters ordered in accordance with the severity of their symptoms. Byfollowing the evolution of symptoms for each patient separately, we were able to determinepatterns of medications change which can lead to the improvement or worsening of thepatients’ quality of life.
We introduced skip-grams as a method for following the progression of the disease. Theanalysis showed that the progression of the disease is mostly steady in the period of fiveyears involvement in the PPMI study—the patients stay in the initially assigned clusters orthey move to the adjacent clusters. Analysis of 3-skip-4-grams outlined groups of patients
76 Chapter 5. Detection of Parkinson’s Disease Progression Patterns

J Intell Inf Syst
with interesting patterns of cluster changes. We detected a group of older patients, who werenot treated for a longer period and whose treatment consists of direct introduction of lev-odopa for treatment of motor symptoms. The other interesting group are younger patients,who were recently diagnosed with Parkinson’s disease and whose treatment included thecombinations of MAO-B inhibitors and dopamine agonists. In further work, we will consultmedical experts for specific patients with interesting sequences and ask them to interprettheir etymological characteristics, motor symptoms, and changes of therapy.
Results from the multi-view clustering setting are underwhelming in terms of the qualityof produced clusters. However, the results reveal the importance of autonomic symptoms tothe quality of life of Parkinson’s disease patients.
The rules describing the obtained clusters were either very general (merged view setting)or very specific (multi-view setting) and may not be of sufficient assistance to clinicians.This is due to the nature of the used data, i.e. a vector of attribute sums (merged view) or ahigh-dimensional vector of attributes with numeric values. In future work, we will test ourmethodology with only a handful of carefully chosen attributes. These attributes, selectedwith the help of Parkinson’s disease specialists, will be described by nominal values usedin the clinicians’ everyday practice i.e. normal, non-problematic, problematic. We believethat by an expert-assisted decrease of feature space dimensionality, we will be able to obtaindescriptions of groups of patients which are even more meaningful and helpful to the clini-cians. Additionally, we will improve the medications suggestion process to produce numeri-cal suggestions of medications dosages which should be prescribed to the patients. An inter-esting direction for further work is to explore other clustering approaches, in particularlyhierarchical clustering. Attributes from the MDS-UPDRS and MoCA questionnaires can beordered hierarchically and exploiting this characteristic may lead to better defined groups ofpatients with similar symptoms. Transitions between such clusters could reveal more spe-cific and detailed patterns of disease progression. Besides skip-grams we plan to exploreother possibilities to handle temporal data. For example, we want to compare the state ofa patient in a given time point with all of its past time points (not only the immediatelypreceding one).
Acknowledgements This work was supported by the PD manager and HBP SGA1 projects, funded withinthe EU Framework Program for Research and Innovation Horizon 2020 grants 643706 and 720270, respec-tively. We acknowledge also the support of the Slovenian Research Agency (research core funding P2-0103and P2-0209).
Data used in the preparation of this article were obtained from the Parkinson’s Progression Markers Ini-tiative (PPMI) (www.ppmi-info.org/data). For up-to-date information on the study, visit www.ppmi-info.org.PPMI—a public-private partnership—is funded by the Michael J. Fox Foundation for Parkinson’s Researchand funding partners. Corporate Funding Partners: AbbVie, Avid Radiopharmaceuticals, Biogen, BioLegend,Bristol-Myers Squibb, GE Healthcare, GLAXOSMITHKLINE (GSK), Eli Lilly and Company, Lundbeck,Merck, Meso Scale Discovery (MSD), Pfizer Inc, Piramal Imaging, Roche, Sanofi Genzyme, Servier, Takeda,Teva, UCB. Philanthropic Funding Partners: Golub Capital. List of funding partners can be also found atwww.ppmi-info.org/fundingpartners.
Appendix A: Comparison of clustering algorithms on merged data set
We considered three clustering approaches for the merged data set: k-means, k-medoids, andDBSCAN. We clustered the merged data into different number of clusters and evaluated thequality of the produced clusters with the internal cluster validity metrics: SA (Rousseeuw
5.2. Related Publication 77

J Intell Inf Syst
Table 5 Cluster validation measures for k-means, k-medoids, and DBSCAN, where k presents the numberof clusters. Clustering was performed on the merged data set. Better clusters quality is marked with highervalues of SA and CH, and lower values of DB
k-means k-medoids DBSCAN
k SA DB CH SA DB CH SA DB CH
2 0.516 0.916 162.540 0.505 0.918 162.539 -0.362 0.996 16.946
3 0.368 0.916 162.540 0.336 0.918 162.539 -0.132 0.996 16.946
4 0.371 1.263 54.103 0.318 1.387 54.099 0.250 0.796 297.712
5 0.287 1.151 40.546 0.259 1.235 40.546 nan nan inf
6 0.275 1.256 32.412 0.253 1.283 32.412 nan nan inf
7 0.284 1.619 26.991 0.253 1.364 26.990 nan nan inf
1987), DB (Davies and Bouldin 1979), and CH (Calinski and Harabasz 1974). Table 5presents the results of cluster validation for the selected clustering methods and the chosennumber of clusters. The results show that the best performing approach is k-means.
Appendix B: Features selected by unsupervised feature selection
We used unsupervised feature subset selection to select the most relevant attributes forclustering algorithms. We used the SPEC algorithm (Zhao and Liu 2007) implemented in
Fig. 6 Attribute rank vs attribute importance as determined by the SPEC algorithm (the most influentialattribute has rank 1)
78 Chapter 5. Detection of Parkinson’s Disease Progression Patterns

J Intell Inf Syst
Table 6 The most importantattributes ordered according toSPEC (see Fig. 6)
Attribute Attribute description Data set
MCAREC4 Delayed recall - daisy MoCA
NHY Hoehn and Yahr score MDS-UPDRS Part III
NP3PTRML Postural tremor (left hand) MDS-UPDRS Part III
NP3SPCH Speech problems MDS-UPDRS Part III
NP2EAT Eating tasks MDS-UPDRS Part II
NP1SLPD Daytime sleepiness MDS-UPDRS Part Ip
NP3RIGLU Rigidity (left arm) MDS-UPDRS Part III
NP1PAIN Pain and other sensations MDS-UPDRS Part Ip
NP3FTAPL Finger tapping (left hand) MDS-UPDRS Part III
NP3RTCON Constancy of rest MDS-UPDRS Part III
Python (Li et al. 2016). Figure 6 presents the evaluation of attributes relevance. Based onthe results, we selected the attributes left from the red line in Fig. 6. This resulted in a listof 10 attributes, presented in detail in Table 6.
In Table 7 we present the cluster validation values on the data set containing only the bestattributes (listed in Table 6). The results reveal that the merged data set (consisting of sumsof attributes) produces better quality clusters than the data set reduced with feature subsetselection.
Results from Tables 5 and 7 show that better clusters are produced when sums of attributevalues from the considered views are used as attributes in the merged data set. Parkinson’sdisease patients experience a whole range of symptoms, both motor and non-motor, andit is tougher for traditional clustering algorithms to separate them into groups of similarpatients. The introduction of sums makes it possible to have a view of the overall statusof the patients concerning particular sets of symptoms (i.e. motor symptoms, non-motorsymptoms, autonomic symtptoms etc.).
Table 7 Cluster validation measures for k-means, k-medoids, and DBSCAN, where k presents the numberof clusters. Clustering was performed on the data set containing only attributes from Table 6
k-means k-medoids DBSCAN
k SA DB CH SA DB CH SA DB CH
2 0.379 1.199 102.657 0.379 1.199 102.657 0.379 1.199 102.657
3 0.337 1.199 102.657 0.283 1.199 102.657 nan 1.199 102.657
4 0.296 1.590 34.168 0.217 1.781 34.168 nan nan inf
5 0.279 1.580 25.608 0.170 1.745 25.607 nan nan inf
6 0.267 1.617 20.471 0.189 1.649 20.471 nan nan inf
7 0.262 1.694 17.046 0.182 1.969 17.047 nan nan inf
5.2. Related Publication 79

J Intell Inf Syst
Appendix C: Evaluation of multi-view clusterings
In order to determine how the choice of data sets influence the results of multi-view clus-tering, we executed multi-view clustering on all 21 pairs of views, i.e. 7·6
2 pairs. Clustersresulting from each pair were evaluated using SA (Rousseeuw 1987) and the results arepresented in Table 8. SA is a normalized value (range from −1 to 1) and is used to com-pare cluster quality on these data sets. Since clustering was performed on different data sets(each pair is effectively a different data set) and values of DB and CH are not comparableacross data sets, we do not present these values. The value of each cell in Table 8 corre-sponds to the quality of clusters obtained by multi-view clustering on the data sets from thecorresponding row and column. For example, SA (Rousseeuw 1987) on clusters obtainedby multi-view clustering on the MDS-UPDRS Part I (NUPDRS1) and MoCA is 0.021. Thebest cluster is marked with bold.
The results show that all pairs produce clusters with low quality, but the three best per-forming pairs according to SA are: (SCOPA-AUT, MDS-UPDRS Part II), (MDS-UPDRSPart III, MDS-UPDRS Part II), and (PASE, MDS-UPDRS Part II).
We used the Adjusted Rand Index (ARI) (Hubert and Arabie 1985) to compare clus-ter structures discovered by different cluster configurations. The value of ARI is 0 for tworandom clusterings and 1 for two identical clusterings. Table 9 presents the ARI score com-puted on pairs of the winning two-view clustering settings. Results reveal that all pairs ofclusterings are quite similar, and the (NUPDRS3, NUPDRS2P) and (PASE, NUPDRS2P)pairs produce almost identical clusters (ARI = 0.966). As the quality of individual pairsis rather low (see Table 8), there is little chance that further combinations of views wouldimprove the quality.
Nevertheless, we constructed two additional settings for multi-view clustering by sys-tematically adding views (data sets) to the winning bi-view clustering setting (SCOPA-AUT,MDS-UPDRS Part III). We in turn added the remaining data sets from the second (MDS-UPDRS Part II and MDS-UPDRS Part III) and third (PASE and MDS-UPDRS PartIII) best performing bi-view clustering setting, thus obtaining two new multi-view set-tings: (SCOPA-AUT, MDS-UPDRS Part II, MDS-UPDRS Part III) and (SCOPA-AUT,MDS-UPDRS Part II, MDS-UPDRS Part III, PASE). We evaluated the quality of clus-ters produced by these three settings and presented the results in Table 10, where we also
Table 8 Value of SA on clusters discovered with multi-view clustering on pairs of data sets. Higher valuesof SA indicate clusters with better quality
MOCA NUPDRS1 NUPDRS1P NUPDRS2P NUPDRS3 PASE
NUPDRS1 0.021
NUPDRS1P 0.023 0.014
NUPDRS2P 0.022 0.033 0.024
NUPDRS3 0.025 0.038 0.015 0.168
PASE 0.023 0.059 0.013 0.162 0.048
SCOPA-AUT 0.024 0.018 0.013 0.173 0.047 0.031
80 Chapter 5. Detection of Parkinson’s Disease Progression Patterns

J Intell Inf Syst
Table 9 ARI scores for the best performing pairs of two-view multi-view clusterings
(NUPDRS3, NUPDRS2P) (PASE, NUPDRS2P)
(SCOPA, NUPDRS2P) 0.488 0.504
(NUPDRS3, NUPDRS2P) 0.966
included the cluster quality measures when all views are considered and the scores of thebest single view clustering on the merged data set. Please note that since clustering wasperformed on different data sets, values of DB and CH are not comparable. SA is a nor-malized value (range from −1 to 1) and is used to compare cluster quality on these datasets.
Based on the SA values from Table 10, clustering with the best clustering is producedon the merged data set that consists only of sums of attribute values from 7 data setsfrom Section 3.3. In the multi-view setting, best results were obtained when three datasets were considered (SCOPA-AUT, MDS-UPDRAS Part II, MDS-UPDRS Part III). TheSCOPA-AUT data set contains attributes describing the autonomic symptoms of patients.The MDS-UPDRS Part II data expresses ‘motor experiences of daily living’, includ-ing speech problems, the need for assistance with the daily routines such as eating ordressing, etc, while the MDS-UPDRS Part III data set describes the motor symptomswhich are the most characteristic symptoms of Parkinson’s disease. Even though the clus-ters produced by the multi-view setting are of lower quality than those produced on themerged data set, results from Table 10 reveal that it might be beneficial to combinemultiple data sets: the inclusion of the MDS-UPDRS Part III data set in the best per-forming bi-view clustering setting (SCOPA-AUT, MDS-UPDRS Part II) (SA = 0.173)produces clusters with an improved quality (SA = 0.205). These results also show thatthe inclusion of other, seemingly uncorrelated data sets (PASE, MOCA, MDS-UPDRSPart I, MDS-UPDRS Part Ip) can lead toward significant decrease in the quality ofclusters.
In addition to the work presented above, we also used unsupervised feature subset selec-tion to select the most relevant attributes from each of the seven views (data sets). Weevaluated the quality of clusters on the newly generated data sets following the procedurepresented in this section. Results showed that the quality of the clusters in these new set-
Table 10 Comparison of clusterquality using silhouette analysis(SA) for different setting ofmulti-view clustering
Data set SA
SCOPA, NUPDRS2P 0.173
SCOPA, NUPDRS2P, NUPDRS3 0.205
SCOPA, NUPDRS2P, NUPDRS3, PASE 0.0195
All 7 data sets 0.0514
Merged data set 0.347The Data set column presents thesymptoms data sets that are usedin the multi-view clustering
5.2. Related Publication 81

J Intell Inf Syst
tings was significantly lower than the quality of clusters presented here. For that reason wedid not include this part of research into the paper.
Appendix D : Rules describing multi-view clusters
We present rules describing clusters obtained by multi-view clustering using three views(SCOPA-AUT, MDS-UPDRS Part II, and MDS-UPDRS Part III) i.e. the best multi-viewclustering according to SA from Table 10. Attributes with the prefix SCAU are symptomsfrom the SCOPA-AUT data set. The suffix in the names of these attributes designates thenature of the autonomic symptoms. Attributes SCAU1-SCAU7 describe gastrointestinalsymptoms, urinary problems are recorded by attributes SCAU8-SCAU13, while attributesSCAU14-SCAU16 hold information about patient’s cardiovascular problems. AttributesSCAU17-SCAU18, SCAU20-SCAU21 describe thermoregulatory problems, while attributeSCAU19 describes any pupillomotor issues that a patient might be experiencing. Attributeprefixes determine the data set of their origin. Attributes with prefix NP2 are from the MDS-UPDRS Part II, while the prefix NP3 designates attributes from the MDS-UPDRS Part IIIdata set (including attributes NHY and DYSKPRES).
Tables 11, 12, and 13 present rules describing cluster 0, cluster 1, and cluster 2 respec-tively, obtained by multi-view clustering. Rules are induced on the data set that is aconcatenation of the three views: SCOPA-AUT, MDS-UPDRS Part II, and MDS-UPDRSPart III. Contrary to the rules obtained by the single view clustering on the merged data setwhere groups of patients were described by the severity of their overall status, the multi-view clusters are described by symptoms. These rules mostly describe the motor status ofParkinson’s disease patients (attributes from MDS-UPDRS Part III), and are supported bytheir motor ability in daily living (attributes fromMDS-UPDRS Part II) and their autonomicsymptoms (SCOPA-AUT).
Table 11 Description rules for cluster 0 of the multi-view clustering approach generating clusters with bestquality. Views were represented by the SCOPA-AUT, MDS-UPDRS Part II, and MDS-UPDRS Part III datasets
Rule p n
IF:
SCAU19 ≤ 2 AND NP3PSTBL ≤ 2 AND NP3HMOVL > 2 AND
NP3GAIT ≤ 1 AND NP3RTARU ≤ 0 ← cluster = 0 58 0
ELSE IF:
NP3RISNG ≤ 1 AND NP3FTAPR ≤ 0 AND NP3HMOVL > 0 AND
NP3HMOVR ≤ 0 AND NP3RTARU ≤ 0 AND NP3FACXP ≤ 2 ← cluster = 0 146 8
ELSE IF:
NP3FTAPL > 1 AND NP2FREZ ≤ 0 AND NP3RTARU ≤ 0 AND
NP3RTALU > 0 ← cluster = 0 87 0
ELSE IF:
NP2SALV ≤ 3 AND NP3FRZGT ≤ 0 AND NP3FTAPL > 2 AND
NP3LGAGL > 0 ← cluster = 0 25 4
82 Chapter 5. Detection of Parkinson’s Disease Progression Patterns

J Intell Inf Syst
Table 12 Description rules for cluster 1 of the multi-view clustering approach generating clusters with bestquality. Views were represented by the SCOPA-AUT, MDS-UPDRS Part II, and MDS-UPDRS Part III datasets
Rule p n
IF:
NP3RIGLU ≤ 0 AND NP3RIGN ≤ 1 AND NP3RTARU > 1 ← cluster = 1 143 3
ELSE IF:
NP3RTCON > 2 AND SCAU18 ≤ 1 AND NP2SUM ≤ 15 AND
NP3RTARU > 1 AND NP3FACXP ≤ 2 ← cluster = 1 83 3
ELSE IF:
NP3RIGLL ≤ 0 AND NHY ≤ 1 AND NP3RTARU > 0 AND
SCAU6 ≤ 1 ← cluster = 1 40 6
ELSE IF:
NP3PRSPL ≤ 0 AND NP3RTCON > 1 AND NP3RTARU > 0 ← cluster = 1 37 2
ELSE IF:
SCAU12 ≤ 1 AND NP3RTALL ≤ 0 AND NP2TRMR > 0 AND
NP2EAT ≤ 0 AND NP3HMOVL ≤ 0 AND SCAU20 ≤ 0 AND
NP3RTARU > 0 AND SCAU7 ≤ 0 ← cluster = 1 15 3
ELSE IF:
NP3RIGLU = (0,1] AND NP3RTCON > 1 AND SCAU17 ≤ 1 AND
NHY ≤ 2 AND NP3RTARU > 1 ← cluster = 1 19 4
ELSE IF:
NP3RTCON > 2 AND NP2HWRT > 0 AND NP3LGAGL ≤ 0 AND
NP3TTAPL = (0,1] AND SCAU6 ≤ 1 ← cluster = 1 7 2
ELSE IF:
NP2SALV ≤ 0 AND NP3RIGLU ≤ 0 AND SCAU17 ≤ 1 AND
NP2WALK ≤ 0 AND NP3RTARL > 0 ← cluster = 1 5 2
ELSE IF:
NP2EAT > 0 AND NP3GAIT ≤ 0 AND NP3RTARU > 0 AND
NP2SPCH ≤ 0 AND SCAU4 ≤ 1 ← cluster = 1 6 1
ELSE IF:
SCAU18 > 0 AND NP2DRES > 0 AND NP3SPCH ≤ 0 AND
NP3RTARU > 1 AND NP3RTALU ≤ 0 ← cluster = 1 4 0
5.2. Related Publication 83

J Intell Inf Syst
Table 13 Description rules for cluster 2 of the multi-view clustering approach generating clusters with bestquality. Views were represented by the SCOPA-AUT, MDS-UPDRS Part II, and MDS-UPDRS Part III datasets
Rule p n
IF:
SCAUSUM > 5 AND NP3RTCON ≤ 0 AND NP3FTAPR > 2 ← cluster = 2 36 1
ELSE IF:
NP3RTCON ≤ 0 AND NP2TRMR ≤ 0 AND NP3TTAPL ≤ 0 ← cluster = 2 53 1
ELSE IF:
NP3RTCON ≤ 0 AND NP3HMOVR > 0 AND NP3TTAPL ≤ 0 ← cluster = 2 52 0
ELSE IF:
NP3RTCON ≤ 0 AND NP3PTRML ≤ 0 AND NP3TTAPR > 1 ← cluster = 2 73 12
ELSE IF:
NP3RTCON = (0,1] AND NP3HMOVR > 2 AND NP3TTAPR > 0 ← cluster = 2 15 1
ELSE IF:
NP3RTALJ ≤ 0 AND NP3GAIT ≤ 1 AND SCAU8 > 2 AND
NP3RTALU ≤ 0 AND SCAU4 ≤ 1 ← cluster = 2 13 2
ELSE IF:
NP3RTCON ≤ 0 AND NP2WALK > 0 AND NP3PSTBL ≤ 2 AND
NP2HWRT > 0 AND NP2SWAL > 1 AND SCAU6 ≤ 2 ← cluster = 2 10 0
ELSE IF:
NHY > 1 AND NP3KTRML ≤ 0 AND PN3RIGRL > 1 AND
NP3RTARU = (0,1] ← cluster = 2 38 23
ELSE IF:
NP3RTCON ≤ 0 AND NP3HMOVL ≤ 0 AND NP3RTARU ≤ 0 AND
NP3TTAPR > 0 ← cluster = 2 23 0
ELSE IF:
NP3PSTBL > 2 AND NP2DRES > 0 AND NP3RTARU > 1 ← cluster = 2 7 0
ELSE IF:
NP3RTCON = (0,1] AND NHY > 1 AND NP3FTAPR > 1 AND
NP3RTARL ≤ 0 AND NP2HOBB ≤ 1 AND NP2SPCH > 0 AND
NP3FACXP > 0 AND NP3RTALU ≤ 0 ← cluster = 2 24 11
ELSE IF:
NP3PRSPL ≤ 0 AND NP3RTCON ≤ 0 AND NP3POSTR ≤ 2 AND
SCAU18 ≤ 1 AND NP3RIGLL ≤ 0 AND NP3RTARU ≤ 0 AND
SCAU3 ≤ 0 ← cluster = 2 20 4
References
Agrawal, R., Imielinski, T., Swami, A. (1993). Mining association rules between sets of items in largedatabases. In ACM sigmod record (Vol. 22, pp. 207–216). ACM.
Appice, A. (2017). Towards mining the organizational structure of a dynamic event scenario. Journal ofIntelligent Information Systems, 1–29.
Appice, A., & Malerba, D. (2016). A co-training strategy for multiple view clustering in process mining.IEEE Trans Services Computing, 9(6), 832–845.
84 Chapter 5. Detection of Parkinson’s Disease Progression Patterns

J Intell Inf Syst
Arbelaitz, O., Gurrutxaga, I., Muguerza, J., Perez, J.M., Perona, I. (2013). An extensive comparative studyof cluster validity indices. Pattern Recognition, 46(1), 243–256.
Bence, J.R. (1995). Analysis of short time series: correcting for autocorrelation. Ecology, 76(2), 628–639.Bezdek, J.C. (1981). Pattern recognition with fuzzy objective function algorithms. New York: Plenum
Press.Blum, A., & Mitchell, T. (1998). Combining labeled and unlabeled data with co-training. In Proceedings of
the eleventh annual conference on computational learning theory, ACM, New York, NY, USA, COLT’(Vol. 98, pp. 92–100).
Broder, A.Z., Glassman, S.C., Manasse, M.S., Zweig, G. (1997). Syntactic clustering of the web. ComputerNetworks and ISDN Systems, 29(8-13), 1157–1166.
Cai, X., Nie, F., Huang, H. (2013). Multi-view k-means clustering on big data. In Proceedings of the 23rdinternational joint conference on artificial intelligence IJCAI 2013, Beijing, China, August 3-9, 2013(pp. 2598–2604).
Calinski, T., & Harabasz, J. (1974). A dendrite method for cluster analysis. Communications in Statistics-theory and Methods, 3(1), 1–27.
Ceravolo, R., Rossi, C., Kiferle, L., Bonuccelli, U. (2010). Nonmotor symptoms in Parkinson’s disease: thedark side of the moon. Future Neurology, 5(6), 851–871.
Chaudhuri, K., Kakade, S.M., Livescu, K., Sridharan, K. (2009). Multi-view clustering via canonical corre-lation analysis. In Proceedings of the 26th annual international conference on machine learning, ICML2009 (pp. 129–136).
Choi, E., Schuetz, A., Stewart, W.F., Sun, J. (2017). Using recurrent neural network models for early detectionof heart failure onset. Journal of the American Medical Informatics Association, 24(2), 361–370.
Cleuziou, G., Exbrayat, M., Martin, L., Sublemontier, J. (2009). CoFKM: a centralized method for multiple-view clustering. In Proceedings of the ninth IEEE international conference on data mining (ICDM 2009),miami, florida, USA, 6-9 December 2009 (pp. 752–757).
Dalrymple-Alford, J., MacAskill, M., Nakas, C., Livingston, L., Graham, C., Crucian, G., Melzer, T., Kir-wan, J., Keenan, R., Wells, S., et al. (2010). The moCA: well-suited screen for cognitive impairment inParkinson disease. Neurology, 75(19), 1717–1725.
Davies, D.L., & Bouldin, D.W. (1979). A cluster separation measure. IEEE Transactions on Pattern Analysisand Machine Intelligence, 1(2), 224–227.
De Alba, E., Mendoza, M., et al. (2007). Bayesian forecasting methods for short time series. TheInternational Journal of Applied Forecasting, 8, 41–44.
De Vine, L., Zuccon, G., Koopman, B., Sitbon, L., Bruza, P. (2014). Medical semantic similarity with a neurallanguage model. In Proceedings of the 23rd ACM international conference on conference on informationand knowledge management (pp. 1819–1822). ACM.
Dorsey, E., Constantinescu, R., Thompson, J., Biglan, K., Holloway, R., Kieburtz, K., Marshall, F., Ravina,B., Schifitto, G., Siderowf, A., et al. (2007). Projected number of people with Parkinson disease in themost populous nations, 2005 through 2030. Neurology, 68(5), 384–386.
Ernst, J., & Bar-Joseph, Z. (2006). STEM: a tool for the analysis of short time series gene expression data.BMC Bioinformatics, 7(1), 191.
Ernst, J., Nau, G.J., Bar-Joseph, Z. (2005). Clustering short time series gene expression data. Bioinformatics,21(suppl 1), i159–i168.
Ester, M., Kriegel, H.P., Sander, J., Xu, X., et al. (1996). A density-based algorithm for discovering clustersin large spatial databases with noise. In KDD (Vol. 96, pp. 226–231).
European Parkinson’s Disease Association (2016). http://www.epda.eu.com/, accessed: 2016/07/01.Foltynie, T., Brayne, C., Barker, R.A. (2002). The heterogeneity of idiopathic Parkinson’s disease. Journal
of Neurology, 249(2), 138–145.Gamberger, D., & Lavrac, N. (2002). Expert-guided subgroup discovery: methodology and application.
Journal of Artificial Intelligence Research, 17, 501–527.Gatsios, D., Rigas, G., Miljkovic, D., Seljak, B.K., Bohanec, M. (2016). m-health platform for Parkin-
son’s disease management. In Proceedings of 18th international conference on biomedicine and healthinformatics CBHI.
Gil, D., & Johnson, M. (2009). Diagnosing Parkinson by using artificial neural networks and support vectormachines. Global Journal of Computer Science and Technology, 9(4), 63–71.
Goetz, C.G., Tilley, B.C., Shaftman, S.R., Stebbins, G.T., Fahn, S., Martinez-Martin, P., Poewe, W., Sampaio,C., Stern, M.B., Dodel, R., et al. (2008). Movement Disorder Society-sponsored Revision of the UnifiedParkinson’s Disease Rating Scale (MDS-UPDRS): scale presentation and clinimetric testing results.Movement Disorders, 23(15), 2129–2170.
Goetz, C.G., Luo, S., Wang, L., Tilley, B.C., LaPelle, N.R., Stebbins, G.T. (2015). Handling missing valuesin the MDS-UPDRS. Movement Disorders, 30(12), 1632–1638.
5.2. Related Publication 85

J Intell Inf Syst
Greene, D., Doyle, D., Cunningham, P. (2010). Tracking the evolution of communities in dynamic socialnetworks. In Advances in social networks analysis and mining (ASONAM), 2010 (pp. 176–183). IEEE.
Guthrie, D., Allison, B., Liu, W., Guthrie, L., Wilks, Y. (2006). A closer look at skip-gram modelling. InProceedings of the 5th international conference on language resources and evaluation (LREC-2006)(pp. 1–4).
He, X., Kan, M.Y., Xie, P., Chen, X. (2014). Comment-based multi-view clustering of Web 2.0 items. InProceedings of the 23rd international conference on World Wide Web (pp. 771–782): ACM.
Hubert, L., & Arabie, P. (1985). Comparing partitions. Journal of Classification, 2(1), 193–218.Hughes, A.J., Daniel, S.E., Kilford, L., Lees, A.J. (1992). Accuracy of clinical diagnosis of idiopathic
Parkinson’s disease: a clinico-pathological study of 100 cases. Journal of Neurology Neurosurgery &Psychiatry, 55(3), 181–184.
Imhoff, M., Bauer, M., Gather, U., Lohlein, D. (1998). Time series analysis in intensive care medicine. Tech.rep. SFB 475: Komplexitatsreduktion in Multivariaten Datenstrukturen, Universitat Dortmund.
Kaufman, L., & Rousseeuw, P. (1987). Clustering by means of medoids. North-Holland.Kaufman, L., & Rousseeuw, P.J. (1990). Finding groups in data. an introduction to cluster analysis. Wiley
Series in Probability and Mathematical Statistics Applied Probability and Statistics.Kumar, A., & III, H.D. (2011). A co-training approach for multi-view spectral clustering. In Proceedings of
the 28th international conference on machine learning, ICML (pp. 393–400).Lewis, S., Foltynie, T., Blackwell, A., Robbins, T., Owen, A., Barker, R. (2005). Heterogeneity of Parkinson’s
disease in the early clinical stages using a data driven approach. Journal of Neurology, Neurosurgery &Psychiatry, 76(3), 343–348.
Li, J., Cheng, K., Wang, S., Morstatter, F., Trevino, R.P., Tang, J., Liu, H. (2016). Feature selection: a dataperspective. arXiv:160107996.
Lin, J., Keogh, E., Wei, L., Lonardi, S. (2007). Experiencing SAX: a novel symbolic representation of timeseries. Data Mining and Knowledge Discovery, 15(2), 107–144.
Liu, Y., Li, Z., Xiong, H., Gao, X., Wu, J. (2010). Understanding of internal clustering validation measures.In Proceedings of IEEE 10th international conference on data mining (ICDM) (pp. 911–916).
Liu, Y., Li, W., Tan, C., Liu, X., Wang, X., Gui, Y., Qin, L., Deng, F., Hu, C., Chen, L. (2014). Meta-analysiscomparing deep brain stimulation of the globus pallidus and subthalamic nucleus to treat advancedParkinson disease: a review. Journal of Neurosurgery, 121(3), 709–718.
Ma, L.Y., Chan, P., Gu, Z.Q., Li, F.F., Feng, T. (2015). Heterogeneity among patients with Parkinson’sdisease: cluster analysis and genetic association. Journal of the Neurological Sciences, 351(1), 41–45.
Marek, K., Jennings, D., Lasch, S., Siderowf, A., Tanner, C., Simuni, T., Coffey, C., Kieburtz, K., Flagg,E., Chowdhury, S., et al. (2011). The Parkinson’s Progression Markers Initiative (PPMI). Progress inNeurobiology, 95(4), 629–635.
Michalski, R.S. (1983). A theory and methodology of inductive learning. Artificial Intelligence, 20(2), 111–161.
Mikolov, T., Chen, K., Corrado, G., Dean, J. (2013). Efficient estimation of word representations in vectorspace. arXiv:13013781.
Minarro-Gimenez, J.A., Marın-alonso, O., Samwald, M. (2013). Exploring the application of deep learningtechniques on medical text corpora. Studies in Health Technology and Informatics, 205, 584–588.
Murugesan, S., Bouchard, K., Chang, E., Dougherty, M., Hamann, B., Weber, G.H. (2017). Multi-scale visualanalysis of time-varying electrocorticography data via clustering of brain regions. BMC Bioinformatics,18(6), 236.
National Collaborating Centre for Chronic Conditions. (2006). Parkinson’s disease: national clinicalguideline for diagnosis and management in primary and secondary care. London: Royal College ofPhysicians.
Patel, S., Lorincz, K., Hughes, R., Huggins, N., Growdon, J., Standaert, D., Akay, M., Dy, J., Welsh, M.,Bonato, P. (2009). Monitoring motor fluctuations in patients with Parkinson’s disease using wearablesensors. IEEE Transactions on Information Technology in Biomedicine, 13(6), 864–873.
PD manager: m-Health platform for Parkinson’s disease management (2015). EU Framework Pro-gramme for Research and Innovation Horizon 2020, Grant number 643706, 2015–2017. http://www.parkinson-manager.eu/.
Ramani, R.G., & Sivagami, G. (2011). Parkinson disease classification using data mining algorithms.International Journal of Computer Applications, 32(9), 17–22.
Reijnders, J., Ehrt, U., Lousberg, R., Aarsland, D., Leentjens, A. (2009). The association between motorsubtypes and psychopathology in Parkinson’s disease. Parkinsonism & Related Disorders, 15(5), 379–382.
Riviere, C.N., Reich, S.G., Thakor, N.V. (1997). Adaptive Fourier modeling for quantification of tremor.Journal of Neuroscience Methods, 74(1), 77–87.
86 Chapter 5. Detection of Parkinson’s Disease Progression Patterns

J Intell Inf Syst
Rousseeuw, P.J. (1987). Silhouettes: a graphical aid to the interpretation and validation of cluster analysis.Journal of Computational and Applied Mathematics, 20, 53–65.
Sama, A., Perez-Lopez, C., Rodrıguez-martın, D., Moreno-arostegui, J.M., Rovira, J., Ahlrichs, C., Cas-tro, R., Graca, R., Guimaraes, V., et al. (2015). A double closed loop to enhance the quality of life ofParkinson’s disease patients: REMPARK system. Innovation in Medicine and Healthcare, 2014(207),115.
Schieb, L.J., Mobley, L.R., George, M., Casper, M. (2013). Tracking stroke hospitalization clusters over timeand associations with county-level socioeconomic and healthcare characteristics. Stroke, 44(1), 146–152.
SENSE-PARK (2016). Project’s website: http://www.sense-park.eu/, accessed: 2016/07/01.Stecher, J., Janssen, F., Furnkranz, J. (2014). Separating rule refinement and rule selection heuristics in
inductive rule learning. In Proceedings of machine learning and knowledge discovery in databases -European conference, ECML PKDD 2014 (pp. 114–129).
Szymanski, A., Kubis, A., Przybyszewski, A.W. (2015). Data mining and neural network simulations canhelp to improve deep brain stimulation effects in Parkinson’s disease. Computer Science, 16(2), 199.
Timmer, J., Gantert, C., Deuschl, G., Honerkamp, J. (1993). Characteristics of hand tremor time series.Biological Cybernetics, 70(1), 75–80.
Tzallas, A.T., Tsipouras, M.G., Rigas, G., Tsalikakis, D.G., Karvounis, E.C., Chondrogiorgi, M., Pso-madellis, F., Cancela, J., Pastorino, M., Waldmeyer, M.T.A., et al. (2014). PERFORM: a system formonitoring, assessment and management of patients with Parkinson’s disease. Sensors, 14(11), 21,329–21,357.
Tzortzis, G., & Likas, A. (2009). Convex mixture models for multi-view clustering. In Proceedings of the19th international conference artificial neural networks - ICANN (Vol. 2009, pp. 205–214).
Valmarska, A., Robnik-Sikonja, M., Lavrac, N. (2015). Inverted heuristics in subgroup discovery. InProceedings of the 18th international multiconference information society.
Valmarska, A., Miljkovic, D., Lavrac, N., Robnik-Sikonja, M. (2016). Towards multi-view approach toParkinson’s disease quality of life data analysis. In Proceedings of the 5th international workshop onnew frontiers in mining complex patterns at ECML-PKDD2016.
Valmarska, A., Lavrac, N., Furnkranz, J., Robnik-Sikonja, M. (2017). Refinement and selection heuristics insubgroup discovery and classification rule learning. Expert Systems with Applications, 81, 147–162.
Visser, M., Marinus, J., Stiggelbout, A.M., Van Hilten, J.J. (2004). Assessment of autonomic dysfunction inParkinson’s disease: the SCOPA-AUT. Movement Disorders, 19(11), 1306–1312.
Washburn, R.A., Smith, K.W., Jette, A.M., Janney, C.A. (1993). The physical activity scale for the elderly(PASE): development and evaluation. Journal of Clinical Epidemiology, 46(2), 153–162.
Xu, C., Tao, D., Xu, C. (2013). A survey on multi-view learning. Neural Computing and Applications, 23(7–8), 2031–2038.
Zhao, J., Papapetrou, P., Asker, L., Bostrom, H. (2017). Learning from heterogeneous temporal data inelectronic health records. Journal of Biomedical Informatics, 65, 105–119.
Zhao, Z., & Liu, H. (2007). Spectral feature selection for supervised and unsupervised learning. InProceedings of the 24th international conference on machine learning (pp. 1151–1157). ACM.
5.2. Related Publication 87


89
Chapter 6
Detection of Medications ChangePatterns
This chapter extends the work presented in Chapter 5 by introducing a Relief-like algorithmfor determining the symptoms that influence the change of Parkinson’s disease patients’quality of life. The algorithm takes into account the temporal nature of symptoms dataand detects influential symptoms that improve or worsen as the status of patients im-proves or degrades. We present a novel methodology for analysis of medication changes inParkinson’s disease progression data using multitask learning—where multiple related tasksare learned simultaneously on a shared attribute space—to simultaneously predict dosagechanges of different groups of antiparkinson medications. Our aim is to establish a basisfor more personalized medications therapy modifications based on the patients’ symptoms.The chapter is divided into two sections: problem description and the published ArtificialIntelligence in Medicine journal paper which addresses the described problem.
6.1 Problem Description
In Chapter 5 we addressed the issue of determining patterns of Parkinson’s disease pro-gression as well as patterns of medications changes that occur when the overall status ofParkinson’s disease patients improves or degrades. However, we did not address exactlywhich symptoms changes cause the change in the patients’ overall status and how theclinicians react with therapy modifications.
The determination of influential symptoms may help the clinicians to focus on a smallset of most important symptoms, of which medications treatment would lead to a morestable status of the patient. In this chapter, we present our algorithm for determiningthe symptoms that affect the progression of the disease. The algorithm builds upon thework presented in Chapter 5 and is closely related to the feature evaluation algorithmsRelief (Kira & Rendell, 1992; Kononenko, 1994; Robnik-Šikonja & Kononenko, 2003). Wedetermine the importance of attributes based on the difference of their values when theoverall status of the patient changes, i.e. when in two consecutive visits the patient isassigned to different clusters.
Similarly to our approach to determining the importance of symptoms for the overalldisease progression, the feature evaluation algorithms Relief and ReliefF also comparefeature values of similar instances from the same class and similar values from a differentclass. However, if applied to our problem, these algorithms cannot take into account thetemporal progress of patients, i.e. they cannot track individual patients on their consecutivevisits to the clinician. In effect, they show which attributes influence the initial assignmentof patients into clusters, but reveal no information about the attributes which are the

90 Chapter 6. Detection of Medications Change Patterns
most influential for changes of the patients’ overall status (i.e. for the crossing of clustersof patients with a similar status).
Modifications of patients’ therapies are motivated by the status of patients. The statusis a result of the symptoms that develop due to the natural progression of the disease as wellas the side-effect symptoms caused by the prolonged usage of antiparkinson medications.The goal of clinicians is to keep the patient’s symptoms stable, preclude the side-effects,and prolong the patients’ independence. Customarily, a clinician will lower the dosageof one group of medications and simultaneously increase the dosage of another group ofmedications. For example, clinicians usually start the treatment of motor symptoms inyounger Parkinson’s disease patients by introducing dopamine agonists. However, a knownside effect of prolonged usage of dopamine agonists is impulsivity. When confronted withsuch conditions, the clinician will lower the dosage of dopamine agonists and simultaneouslyintroduce levodopa in order to keep the motor symptoms stable. Clinicians’ decisionsfor therapy modifications are made based on the patients’ status and follow the officialguidelines for the treatment of Parkinson’s disease, e.g. (Ferreira et al., 2013; Fox et al.,2011; National Collaborating Centre for Chronic Conditions, 2006; Olanow, Watts, &Koller, 2001; Seppi et al., 2011).
These therapy modifications happen simultaneously and are a motivation for multi-task learning. Compared to single-task learning, multitask learning can improve modelgeneralization and prevent overfitting (Caruana, 1997). In this chapter, we address theissue of changes in antiparkinson medications (yes/no model) by modeling them with pre-dictive clustering trees (PCT). The comprehensive models generated by PCT serve threepurposes: i) identification of therapy modification scenarios, ii) identification of symp-toms influencing the therapy modifications, and iii) determining subgroups of patientswith shared similarities in their symptoms and therapy modifications. Multitask learningallows for determining what dosage changes of antiparkinson medications occurred simul-taneously and by following the model we are able to determine the symptoms that affectedthese changes.
6.2 Related Publication
The rest of this chapter presents the Artificial Intelligence in Medicine journal paper.
Publication related to this contribution
Journal Paper
Valmarska, A., Miljkovic, D., Konitsiotis, S., Gatsios, D., Lavrač, N., & Robnik-Šikonja, M.(2018). Symptoms and medications change patterns for Parkinson’s disease patientsstratification. Artificial Intelligence in Medicine (accepted).
This publication contains the following contributions:
• We present an algorithm for determining the symptoms that are influential for theprogression of the disease.
• We present a list of symptoms influencing the improvement or the degradation ofthe patients’ status. This list is supported by a medical interpretation from ourconsulting clinician and references in the medical literature.
• We present a multitask learning based methodology for determining patterns of med-ication dosage changes based on the status of the patients. The methodology usespredictive clustering trees (PCTs) to model changes in patients’ therapies.

6.2. Related Publication 91
• The presented methodology can be interpreted three-fold: i) the tree leaves presentchanges of medications therapies, ii) paths from the tree root to its leaves outline thesymptoms influencing the changes of therapies, and iii) patients covered by the rulesfrom the root of the tree to its leaves form groups of patients that are similar basedon both their symptoms and their medications therapies.
• We empirically show that the changes of medications therapies can be modeled bymultitask learning models. Predictive clustering trees are a good approach as inaddition to the increased classification accuracy of the multitask model over thepredictive performance of single task models, they also offer a simultaneous insightinto what happens to the dosage of all antiparkinson medications.
The authors’ contributions are as follows. The methodology was designed and devel-oped by Anita Valmarska with the insights from Marko Robnik-Šikonja. Nada Lavrač hassuggested using PCTs to model modifications of the patients’ therapies. Anita Valmarskaimplemented the methodology and performed the experimental work. Marko Robnik-Šikonja and Nada Lavrač supervised the implementation of the algorithms. DraganaMiljkovic provided insights into data mining of Parkinson’s disease data. Dimitris Gat-sios and Spiros Konitsiotis helped with the interpretation of the results and their medicaljustification. All authors contributed to the text of the manuscript.


Symptoms and medications change patterns forParkinson’s disease patients stratification
Anita Valmarska( )1,2, Dragana Miljkovic1, Spiros Konitsiotis3,Dimitris Gatsios4, Nada Lavrac1,2, and Marko Robnik-Sikonja5
1 Jozef Stefan Institute, Jamova 39, Ljubljana, Slovenia2 Jozef Stefan International Postgraduate School, Jamova 39, Ljubljana, Slovenia
3 University of Ioannina, Medical School, Department of Neurology, Ioannina, Greece4 University of Ioannina, Department of Biomedical Research, Ioannina, Greece
5 University of Ljubljana, Faculty of Computer and Information Science, Slovenia{anita.valmarska,dragana.miljkovic,nada.lavrac}@ijs.si
[email protected], [email protected], [email protected]
Abstract. Quality of life of patients with Parkinson’s disease degradessignificantly with disease progression. This paper presents a step towardspersonalized management of Parkinson’s disease patients, based on dis-covering groups of similar patients. Similarity is based on patients’ med-ical conditions and changes in the prescribed therapy when the medicalconditions change. We present two novel approaches. The first algorithmdiscovers symptoms’ impact on Parkinson’s disease progression. Exper-iments on the Parkinson Progression Markers Initiative (PPMI) datareveal a subset of symptoms influencing disease progression which arealready established in Parkinson’s disease literature, as well as symp-toms that are considered only recently as possible indicators of diseaseprogression by clinicians. The second novelty is a methodology for detect-ing patterns of medications dosage changes based on the patient status.The methodology combines multitask learning using predictive clusteringtrees and short time series analysis to better understand when a changein medications is required. The experiments on PPMI data demonstratethat, using the proposed methodology, we can identify some clinicallyconfirmed patients’ symptoms suggesting medications change. In termsof predictive performance, our multitask predictive clustering tree ap-proach is comparable to the random forest multitask model, but has anadvantage of model interpretability.
Keywords: Parkinson’s disease; analysis of disease progression; multitask learn-ing; analysis of medications treatment; symptoms impact
1 Introduction
Data mining algorithms have been successfully used to learn predictive modelsand to discover insightful patterns in the data. Predictive and descriptive datamining approaches have been successfully used also in medical data analysis.
6.2. Related Publication 93

The use of data mining methods may improve diagnostics, disease treatment anddetection of causes of diseases. In personalized healthcare [16], data mining canbe used to improve drug recommendations and medical decision support, leadingto reduced costs of medical treatment. The discovered patterns can provide theclinicians with new insights regarding the status of the treated patients and cansupport decisions regarding therapy recommendations.
Parkinson’s disease is the second most common neurodegenerative disease(after Alzheimer’s disease) that a↵ects many people worldwide. Due to the deathof nigral neurons, patients experience both motor and non-motor symptoms, af-fecting their quality of life. The reasons for the cell death are still poorly un-derstood, and there is currently no cure for Parkinson’s disease. Physicians tryto manage patients’ symptoms by introducing medications therapies, using an-tiparkinson medications. Physicians need to carefully prescribe medications ther-apies since the prolonged intake—in particular of higher dosages of antiparkinsonmedications—can have significant side-e↵ects.
Changes of the status of Parkinson’s disease patients through time is a resultof the natural progression of the disease and the medications that the patientsare prescribed in order to keep their status stable as long as possible. Physiciansfollow the guidelines for therapy prescription and the response of patients tomedications is usually recorded in clinical studies using simple statistical meth-ods. For example, in our previous work [43], we describe the disease progressionof a patient who starts with a good status and only of one type of medications(MAO-B inhibitors). As the disease progressed and the patients motor symp-toms worsened, the clinician started the treatment with another type of medica-tions (dopamine agonists) and was successful in keeping the motor symptoms astremor, bradykinesia, and rigidity stable for about two years. As the e↵ective-ness of these medications wore o↵, the clinician was forced into introducing thethird group of medications (levodopa).
To the best of our knowledge, data mining techniques have not yet beenused for analyzing clinicians’ decisions of changing drug prescription as a reac-tion to the change of patients’ symptoms when using antiparkinson medicationsthrough prolonged periods of time. A possible reason for little data mining re-search in the field of Parkinson’s disease progression may be the unavailabilityof a monotone measure/test that determines the stages of Parkinson’s disease,as the currently used Hoehn and Yahr scale [15] determines the stages of Parkin-son’s disease through a subjective evaluation of clinicians and response of pa-tients to the prescribed medications. This paper uses multitask learning withpredictive clustering trees [4] on short time series data—describing the patients’status at multiple time points—in order to determine the symptoms that triggerthe physicians’ decisions to modify the medications therapy. We consider triggersymptoms to be the symptoms that a patient cannot tolerate and the physi-cian is pressed to change the medications therapy in order to control them. Theproposed methodology addresses the task of determining subgroups of patientswith similar symptoms and therapy. As each patient usually receives drugs from
94 Chapter 6. Detection of Medications Change Patterns

several di↵erent groups of medications, predicting their changes with multitasklearning can lead to improved control over drug interactions.
This work significantly extends the conference paper [42] by extending theexperiments, results, and their medical interpretation. We introduce a novel al-gorithm for determining the symptoms that have the highest influence on thechange of the patients’ status, which extends the methodology used to determinethe status of Parkinson’s disease patients based on an extensive set of symptoms[43, 44]. We present a solution to the problem of feature ranking with the aim offinding the most influential symptoms a↵ecting the changed status of patients,which may help the clinicians to focus on a small set of the most importantsymptoms, whose medications treatment would lead to a more stable statusof the patient. Our research provides references to the already known findingsin Parkinson’s disease literature, as well as references to findings about possi-ble influential symptoms that have only recently started being discussed in theParkinson’s disease medical community as early indicators of Parkinson’s diseaseprogression. We significantly extend the experiments with PCT models, analyzedi↵erent sets of attributes, and discuss reasons for particular medications dosagechange patterns from the medical perspective. The consulting clinician takes intoaccount trigger symptoms from the trees as well as the patients’ overall statusconcerning their motor and non-motor symptoms.
This paper is structured into six sections. After presenting the backgroundand related work in Section 2, Section 3 describes the Parkinson’s ProgressionMarkers Initiative (PPMI) symptoms data set [24], together with the data de-scribing the medications used for symptoms control, available from the so-calledPPMI concomitant medications log data set. Section 4 outlines our methodol-ogy. In Section 4.1 we present a new algorithm for determining the most in-fluential symptoms. Section 4.2 proposes a methodology for analyzing Parkin-son’s disease symptoms by learning predictive clustering trees from short datasequences. Results are presented in Section 5. Section 5.1 presents the most in-fluential symptoms, while Section 5.2 describes the results of applying the pro-posed methodology to the detection of changes in symptoms-based clustering ofpatients, connected to the changes in medications therapies and finding patternsof symptoms which trigger therapy modifications. In Section 5.3 we explore theinfluence of the above-mentioned symptoms on clinicians’ decisions regarding themodification of dosages of prescribed medications. Finally, Section 6 presents theconclusions and plans for further work.
2 Background and Related Work
Our work is related to several subareas of data analysis. We first present ap-proaches to Parkinson’s disease data analysis in Section 2.1 and Parkinson’sdisease progression in Section 2.2. In Parkinson’s disease management, severalgroups of medications are used together. We apply multitarget modeling withpredictive clustering trees to capture their joint e↵ects and discuss related workfrom this area in Section 2.3. We are interested in the importance of symptoms
6.2. Related Publication 95

a↵ecting the overall status of the disease, which is a problem addressed in fea-ture ranking/evaluation research. We compare and contrast the algorithm wepropose with existing approaches in Section 2.4.
2.1 Parkinson’s disease data analysis
Data mining research in the field of Parkinson’s disease can be divided into threegroups: classification of Parkinson’s disease patients, detection of Parkinson’sdisease symptoms (computational assessment from e.g., wearable sensors), anddetection of subtypes of Parkinson’s disease patients, as discussed below.
Due to the overlap of Parkinson’s disease symptoms with other diseases, only75% of clinical diagnoses of Parkinson’s disease are confirmed to be idiopathicParkinson disease at autopsy [17]. Classification techniques o↵er decision supportto specialists by increasing the accuracy and reliability of diagnosis and reducingpossible errors. Gil and Johnson [13] use Artificial Neural Networks (ANN) andSupport Vector Machines (SVM) to distinguish Parkinson’s disease patients fromhealthy subjects. Ramani and Sivagami [29] compare the e↵ectiveness of di↵erentdata mining algorithms in the diagnosis of Parkinson’s disease patients, wherethe data set consists of 31 people, 23 of which are Parkinson’s disease patients.
Tremor is a symptom strongly associated with Parkinson’s disease. Severalapproaches to computational assessment of tremor have been proposed. Methodssuch as time series analysis [41], spectral analysis [33], and non-linear analysis[33] have addressed tremor detection and quantification. Many recent works arebased on body fixed sensors (BFS) for long-term monitoring of patients [26].
Parkinson’s disease is a heterogeneous neurodegenerative condition with dif-ferent clinical phenotypes, genetics, pathology, brain imaging characteristics anddisease duration [11]. This variability indicates the existence of disease subtypes.Using k-means clustering, Ma et al. [23] identify four groups of Parkinson’s dis-ease patients which is consistent with the conclusions from [22, 31]. This divisionof Parkinson’s patients into homogeneous subgroups was done on symptoms datarecorded only once for each patient. It does not take into account the progres-sion of the disease and changes in the patients’ status due to the medicationstreatment. Our analysis uses a di↵erent data set (see Section 3) which allows usto take these issues into account.
Classification and clustering models usually focus on diagnosing new patients.None of the listed methods follow the progression of the disease, and to the bestof our knowledge, no data mining research in the field of Parkinson’s disease an-alyzed the development of the disease in combination with the medications thatthe patients receive. Identification of groups of patients based on how they reactto a certain therapy can be helpful in the assignment of personalized therapiesand more adequate patient treatment. To this end, we propose a methodol-ogy for determining trigger symptoms, which influence the physician’s decisionabout therapy modification. In addition, our methodology aims to uncover theside-e↵ects of the modified therapy.
96 Chapter 6. Detection of Medications Change Patterns

2.2 Parkinson’s disease progression
There are no specific medical tests to determine the progression of Parkinson’sdisease for an individual patient. Currently, the clinicians commonly use theHoehn and Yahr scale system [15] to describe the progression of Parkinson’sdisease symptoms. This evaluation can be seen as the clinicians’ aggregate eval-uation of the patient’s motor status. Patient’s status changes through time andeven though the status of the patient is going to get worse during their treat-ment, there are periods where carefully prescribed medications therapies cancause an improvement of the patient’s overall status. This improvement can bereflected in both the patient’s motor and non-motor symptoms.
In our earlier work [43, 44], we first used unsupervised learning (k-means clus-tering) to divide Parkinson’s disease patients from the PPMI study into threegroups with similar severity of their motor and non-motor symptoms. We thenapplied supervised classification rule learning techniques to obtain descriptionsfor each of the obtained groups. The results suggested that these groups can bedescribed with the aggregated severity of their motor symptoms. In addition,the rules also contained the information about the status of their non-motorsymptoms.
The three groups of patients were ordered according to the sum of evalua-tion values for their motor symptoms from MDS-UPDRS Part III (NP3SUM).The first cluster (cluster 0 ) consisted of patients whose motor symptoms wereconsidered as normal, and the sum of MDS-UPDRS Part III was below 22.The second cluster (cluster 1 ) contained patients whose motor symptoms wereslightly worse, and the sum of MDS-UPDRS Part III was between 22 and 42.In the third cluster (cluster 2 ) there were the patients whose sum of evaluationsymptoms values from MDS-UPDRS Part III were higher than 42. Note thatbased on the sum of motor symptoms, the status of patients from cluster 2 isworse than the status of patients from cluster 0 and cluster 1.
The patients’ symptoms are recorded regularly (on their visit to the clin-icians) and based on these symptoms, at each visit, the patients are assignedto a cluster. Assignments to clusters may change during di↵erent visits to theclinicians. Following these assignments to clusters through their recorded visitsto the clinicians gives an overview of the changes in the overall status and onthe disease progresses through time.
The separation of patients into three groups provides the information aboutpatients’ status based on their aggregate score for the motor symptoms. Unfortu-nately, it does not provide any information about the symptoms that are partic-ularly bothersome for the patients, and whose change would have the strongestimpact on the assignment of patients into a given cluster.
The identification of symptoms that strongly influence the change of the pa-tient’s overall status (the patient’s assignment to one of the clusters), can helpclinicians to focus their attention to a smaller set of symptoms when decidingpossible treatment modifications1 of the patients. Using the real world data, our
1 A treatment modification is any change in overall LEDD (levodopa equivalent dailydosage) (change of frequency intake, change of medications group etc.).
6.2. Related Publication 97

aim is to reveal the symptoms that are the most susceptible to improvementor decline when the overall status of the patient changes. When deciding onthe modification of patient’s treatment, the clinicians may consider these symp-toms in order to keep patient’s status stable as long as possible. We present thealgorithm for identification of the most impactful symbols in Section 4.1.
2.3 Multitask learning
In multitask learning (MTL), multiple related tasks are learned simultaneouslyon a shared attribute space. Compared to single task learning, MLT can improvemodel generalization and prevent overfitting [6]. This is achieved by transfer ofintermediate knowledge between jointly learned tasks, e.g., constructed relevantpaths in tree-based models or important joint subconcepts in neural networks.In this way, the learning does not focus on a single task (thus preventing over-fitting) and what is learned for one task can help other tasks (thus improvinggeneralization).
Caruana et al. [7] use knowledge from the future to rank patients accord-ing to their risk to die from pneumonia. The shared attribute space consistsof patients’ at the time they are admitted to the hospital. The multiple taskswhich are learned by the model are a set of hospital tests performed to de-termine whether the patients are of a risk of dying of pneumonia. Zhou etal. [51] use multitask learning to model Alzheimer’s disease progression. Theyuse two clinical/cognitive measures, Mini Mental State Examination (MMSE)and Alzheimer’s Disease Assessment Scale cognitive subscale (ADAS-Cog) asmultiple evaluations to determine the progression of the disease. Zhang et al.[50] propose a multitask model for prediction of multiple regression and clas-sification variables in Alzheimer’s disease, which takes advantage of the multi-modal nature of patient’s symptoms. Similarly to Parkinson’s disease patients,Alzheimer’s patients can be described by symptoms collected from multiplesources. All of these approaches use quantitative data “from the future” (valuesof tests taken in the future) to determine how the disease progresses. The au-thors take historical data and use multitask learning to predict the two years inthe future results of two tests (the MMSE and the ADAS-Cog questionnaire).Using the baseline MRI, FDG-PET, and CSF data they estimate the diseaseprogression by predicting these two values and predicting the conversion of pa-tients with a mild cognitive disorder (MCI) to patients with Alzheimer’s disease(AD). Unfortunately, there are no tests to appropriately measure the progres-sion of Parkinson’s disease. None of the above-mentioned methods look at themedications patients are receiving to decelerate the disease progression.
We use multitask learning with the aim to simultaneously predicting the val-ues of several target attributes (medications in our case). We use a supervisedlearning method called predictive clustering trees (PCTs) [3, 4]. This methodadapts the basic top-down induction of decision trees with clustering and allowsfor multitask learning. The PCT learning algorithm used is implemented in theCLUS data mining framework [4]. We obtain multitask decision trees, simulta-neously predicting three target variables: change of levodopa dosage, change of
98 Chapter 6. Detection of Medications Change Patterns

dopamine agonists dosage, and change of MAO-B inhibitors dosage, referringto three most important medication groups used in Parkinson’s disease patientmanagement. The PCT-based approach is described in Section 4.2, and evalu-ated in Sections 5.2 and 5.3.
2.4 Feature evaluation
Feature subset selection can improve the accuracy, e�ciency, applicability, andcomprehensibility of a learning process and its resulting model [2]. For this rea-son, many feature subset selection approaches have been proposed. In general,three types of feature selection methods exist: wrapper, filter, and embeddedmethods. Wrapper methods use the performance of a given learning algorithmas the criterion to include/exclude attributes. Embedded methods use featureselection as an integral part of their learning process. Filter methods introducesome external criterion independent of the predictor. They evaluate features ac-cording to that criterion, which allows for ranking of features and selection of asuitable subset. This is fit for our purpose.
Our approach to determining the importance of symptoms for the overalldisease progression is strongly related to the well-known Relief family of algo-rithms [19, 34, 32]. These algorithms evaluate attributes based on their ability todistinguish between similar instances with di↵erent class values. Contrary to themajority of feature evaluation heuristics (e.g., information gain, gini index, etc.)that assume conditional independence of attributes w.r.t. the target variable,the Relief approaches do not make this assumption and are suitable for prob-lems that involve feature interaction. The Relief algorithms randomly select aninstance and find the nearest instance from the same class and nearest instancesfrom di↵erent classes. When comparing feature values of near instances the al-gorithm rewards features that separate instances with di↵erent class values andpunishes features that separate instances with the same class value. The wholeprocess is repeated for large enough sample. The approach we propose also usessimilar instances but uses cluster membership as a criterion for similarity insteadof a distance in the feature space. When updating the importance of features ourapproach assesses joint transitions from one cluster to another or from betterpatient status to a worse one, while Relief algorithms use similarities in targetvariable.
Some recent feature selection approaches try to explore the interconnectionbetween the features by exploring the similarity graph of features [30, 38]. Otherapproaches pose feature selection as an optimization problem, for example, Sunet al. [40] use optimization in combination with a game theory based method. Ourapproach also uses a graph of transitions between clusters to assess similarity ofpatients, but we work in an unsupervised scenario and use time order of patients’visits as links between nodes. Details are explained in Sections 4.1 and 4.2.
6.2. Related Publication 99

3 Parkinson’s Disease Data Set
In this paper we use the PPMI data collection [24] gathered in the observationalclinical study to verify progression markers in Parkinson’s disease. In Section3.1 we present the PPMI symptoms data sets and in Section 3.2 we present themedications data used in the experiments. As there are altogether 114 attributesin described data sets, in their everyday practice, physicians focus on a subset ofchosen symptoms to follow the development of the disease and decide when tointervene with medication modifications. The symptoms which are in the focusof physician’s attention are discussed in Section 3.3.
3.1 PPMI symptoms data sets
The medical condition and the quality of life of a patient su↵ering from Parkin-son’s disease is determined using the Movement Disorder Society (MDS)-spon-sored revision of the Unified Parkinson’s Disease Rating Scale (MDS-UPDRS)[14]. This is a four-part questionnaire consisting of 65 questions concerning thedevelopment of the disease symptoms. Part I consists of questions about the“non-motor experiences of daily living”. These questions address complex behav-iors, such as hallucinations, depression, apathy, etc., and patient’s experiencesof daily living, such as sleeping problems, daytime sleepiness, urinary problems,etc. Part II expresses “motor experiences of daily living”. This part of the ques-tionnaire examines whether the patient experiences speech problems, the needfor assistance with the daily routines such as eating or dressing, etc. Part III isreferred to as the “motor examination”, while Part IV concerns “motor complica-tions”, which are mostly developed when the main antiparkinson drug levodopais used for a longer time period. Questions from the MDS-UPDRS representsymptoms characteristic for Parkinson’s disease, while their answers indicatethe symptom’s severity that a patient is experiencing. Each answer is given ona five-point Likert scale, where 0 = normal (patient’s condition is normal, thesymptom is not present), and 4 = severe (symptom is present and severely a↵ectsthe independent functioning of the patient).
Cognitive state of a patient is determined using the Montreal Cognitive As-sessment (MoCA) [8] questionnaire consisting of 11 questions (maximum 30points), assessing di↵erent cognitive domains. In addition to the MoCA data,physicians also use the Questionnaire for Impulsive-Compulsive Disorders (QUIP)[48] to address four major and three minor impulsive-compulsive disorders.
Scales for Outcomes in Parkinson’s disease—Autonomic (SCOPA-AUT) isa specific scale to assess autonomic dysfunction in Parkinson’s disease patients[45]. Physical Activity Scale for the Elderly (PASE) [46] is a questionnaire whichis a practical and widely used approach for physical activity assessment in epi-demiologic investigations. Cognitive Categorization (COGCAT) is a question-naire filled in by clinicians evaluating the cognitive state and possible cognitivedecline of patients. The above data sets are periodically updated to allow theclinicians to monitor patients’ disease development through time. Answers tothe questions from each questionnaire form the vectors of attribute values.
100 Chapter 6. Detection of Medications Change Patterns

Table 1 presents a summary of the symptoms data sets used in our research.2
It lists the number of considered questions from each questionnaire, the range ofattribute values, and the nature of the attribute values. Answers to the questionsfrom questionnaires presented in Table 1 represent the combined set of symptomsused in our research to determine the status of Parkinson’s disease patients. Thetotal number of symptoms from the mentioned questionnaires is 114.
Answers to the considered questions are ordered values and, with the ex-ception of MoCA and PASE questions, larger values suggest higher symptomseverity and decreased quality of life for Parkinson’s disease patients.
Table 1. Characteristics of the questionnaire data used in the analysis.
Questionnaire Number of Answers Ordered Higher value indicatesquestions value range values higher symptom severity
MDS-UPDRS Part I 6 0–4 Yes YesMDS-UPDRS Part Ip 7 0–4 Yes YesMDS-UPDRS Part II 13 0–4 Yes YesMDS-UPDRS Part III 35 0–4 Yes YesMDS-UPDRS Part IV 6 0–4 Yes YesMoCA 11 0–1 Yes NoPASE 7 1–2 Yes NoSCOPA-AUT 21 0–3 Yes YesCOGCAT 4 0–1 Yes YesQUIP 4 0–1 Yes YesTotal 114
3.2 PPMI concomitant medications log
The PPMI data collection o↵ers information about all of the concomitant med-ications that the patients used during their involvement in the study. We con-centrate on whether a patient receives a therapy with antiparkinson medicationsand which combination of antiparkinson medications she/he received betweentwo consecutive time points when the MDS-UPDRS and MoCA tests were ad-ministered. The three main families of drugs used for treating motor symptomsare levodopa, dopamine agonists, and MAO-B inhibitors [25].
The medications therapy for Parkinson’s disease patients is highly person-alized. Patients take di↵erent medications with personalized plans of intake. Inorder to be able to compare di↵erent therapies, dosages of Parkinson’s diseasemedications are translated into a common Levodopa Equivalent Daily Dosage(LEDD).
2 We do not have permission to share the data. Access to data can be obtainedon the PPMI website: http://www.ppmi-info.org/access-data-specimens/download-data/.
6.2. Related Publication 101

3.3 Experimental symptoms data selected by clinicians
In their everyday practice, physicians use a vector of chosen symptoms to followthe development of the disease and decide when to intervene with medicationmodifications. They focus their attention on both motor and non-motor aspectsof patients’ quality of life. Physicians evaluate the motor aspect of patient’s qual-ity of life using the following symptoms: bradykinesia, tremor, gait, dyskinesia,and ON/OFF fluctuations. The non-motor aspect of patient’s quality of life isdetermined using daytime sleepiness, impulsivity, depression, hallucinations, andcognitive disorder. In addition to motor and non-motor symptoms, physiciansalso consider epidemiological symptoms which include age, employment, livingalone, and disease duration. According to the collaborating clinicians, physiciansare inclined to change the therapy of younger patients (younger than 653), whoare still active, who live alone, and for the patients diagnosed with Parkinson’sdisease for a shorter time (less than 8 years). For these patients, physicians willtry more changes to the therapy in order to find the most suitable therapy, ratherthan therapy prolongation with increased medications dosage strategy which isapplied to older Parkinson’s disease patients.
In modifying the patient’s medications based on the numerical evaluation ofsymptoms, the physicians decide whether the symptom is problematic and needstheir immediate attention or not. Table 2 presents the motor and non-motor
symptoms influencing the physicians’ decisions for medications modifications,the data sets they are part of, and the intervals of values that are considerednormal or problematic for Parkinson’s disease patients. For example, the valueof tremor is defined as the mean value of all questions concerning tremor fromMDS-UPDRS Part II and Part III. Intervals of normal and problematic valuesare determined by the clinical expert. For all UPDRS items, value 0 is normal,value 1 is slight or minor, value 2 is mild, 3 is moderate and 4 is severe. Thus, inmost cases and given the progressive nature of Parkinson’s disease, values 0 and1 of symptoms are not problematic and are baring for the patients, but becomeannoying and hampering when they progress in the range 2–4: this leads to dis-tinguishing between values normal and problematic [14]. The selection of these10 motor and non-motor symptoms, and age as an epidemilogical symptom,constituted the subset of attributes considered in the experiments presented inSection 5.2. The reason for excluding employment, living alone, and cognitive
disorder, which could be important epidemilogical attributes, is that the PPMIdata collection does not have data about patients’ employment and living ar-rangements. We omitted the cognitive disorder attribute due to its values in thedatabase, which were either normal or missing
4.For each patient in the data set, the motor and non-motor symptoms data
were obtained and updated periodically (on each patient’s visit to the clinician’s),
3 Retirement age for men (https://en.wikipedia.org/wiki/Retirement_age).4 We explored the option of handling ‘structurally missing’ data, where the cognitive
disorder attribute was kept in the final analysis. Across all attributes a new attributevalue missing was introduced. The generated model had a lower classification accu-racy than the model presented in Section 5.2.
102 Chapter 6. Detection of Medications Change Patterns

Table 2. Description of motor (upper part) and non-motor (lower part) symptomsused by Parkinson’s disease physicians in everyday practice to estimate patient’s qualityof live. The values intervals (normal and problematic) are defined by the clinician.
Symptom Data set Question Normal Problematicnumber values interval values interval
bradykinesia MDS-UPDRS Part III 3.14 0–1 2–4tremor MDS-UPDRS Part II and III mean value 0 1–4gait MDS-UPDRS Part III 3.10 0–1 2–4dyskinesia MDS-UPDRS Part IV 4.3 0–1 2–4ON/OFF fluctuations MDS-UPDRS Part IV 4.5 0 1–4daytime sleepiness MDS-UPDRS Part I 1.8 0–1 2–4impulsivity QUIP SUM 0–1 � 2depression MDS-UPDRS Part I 1.3 0–1 2–4hallucinations MDS-UPDRS Part I 1.2 0–1 2–4cognitive disorder MoCA SUM 26–30 <26
providing the clinicians with the opportunity to follow the development of thedisease. The data set contains 897 instances, containing information about 368PPMI patients. Most of the considered patients have records about two or threevisits to the clinician. The maximum number of visits is 4.
4 Methodology
In this section, we present two methodologies: a methodology for patients’ symp-toms impact on the Parkinson’s disease progression and a methodology for de-tecting medications dosage change patterns as a result of the patient’s symp-toms. Section 4.1 outlines an algorithm for determining which symptoms havethe strongest impact on the patients’ overall status. The patients’ overall sta-tus is determined by the severity of a large set of symptoms (see Section 3.1).This methodology is closely related to our previous research on Parkinson’s dis-ease progression, shortly summarized in Section 2.2 as well as the work doneon feature evaluation (Section 2.4). Results from this methodology, i.e. a list ofsymptoms that our algorithm finds to have the strongest impact on the changeof patients’ overall status are presented in Section 5.1.
Section 4.2 presents our methodology for detecting medications dosage changepatterns as a result of the patient’s symptoms. This methodology serves twoaims: detecting patterns of medications dosage changes based on the patient’soverall status as well as identifying clinically confirmed symptoms suggestingmedications change. Our methodology is related to the work done on multitasklearning (Section 2.3). Results from the evaluation of the methodology on theset of symptoms data selected by clinicians are presented in Section 5.2.
4.1 Symptoms’ impact on Parkinson’s disease progression
This section outlines a pseudo code of the algorithm which estimates the impactof symptoms on the change of patients’ overall status—their change of clus-ters. The most important symptoms found by this algorithm are presented inSection 5.1.
6.2. Related Publication 103

The getAttrChangeProbabilities function, presented in Algorithm 1, is asupervised approach that estimates the probabilities that feature (symptom)values changed when the patients’ overall status also changed (i.e. when thepatients have crossed clusters) or stayed the same (the patients have not changedclusters between two consecutive visits).
As the input Algorithm 1 takes F, patients’ symptoms data described inSection 3.1, the index data set I, and the assigned cluster labels c. The patients’symptoms data F contains the information about the patients’ symptoms valuesat di↵erent visits to the clinicians. It is a matrix of dimension n (number ofinstances) times |A| (number of considered symptoms). The features data set Fcontains the information on 114 motor and non-motor symptoms of Parkinson’sdisease patients. F rows represent the instances (patient pi on visit vij), and thecolumns present patients’ symptoms. The index data set I holds the instanceindexes represented as a combination of patients and their visits. Vector c holdsthe information about the cluster to which a patient in a certain visit has beenassigned to (i.e. cij marks the cluster patient pi was assigned to on visit vij , seeSection 2.2).
The output of the algorithm is two matrices, attrChangeProbability andattrSameProbability, of dimension K ⇥K ⇥ |A| (K is the number of clusters),which hold the probabilities that an attribute will change value or stay the samefor a certain cluster crossing, respectively.
The algorithm first initializes its working spaces and storage matrixes (lines 2- 6). For each patient and for each two consecutive visits, the algorithm comparesthe assigned cluster labels for each instance (for each combination of (pi, vij , cij)and (pi, vij+1, cij+1)) in lines 8 - 24. For each cluster change combination, thealgorithm also takes note of what happens to the symptoms’ values—whetherthey changed or stayed the same (lines 15 - 21). The recorded changes of symp-toms and clusters are normalized with the total number of cluster crossing (lines25 - 37) and the resulting probabilities are returned (line 38).
As a result of Algorithm 1, we get probabilities which reflect the impactof the attributes on cluster changes. This can serve in inference on the diseaseprogression but also to select only the most influential attributes and therebydecrease the dimensionality of attribute space. We discuss the use of Algorithm 1in Section 5.1.
4.2 Medications dosage change patterns
Our goal is to support physicians in their decisions regarding the patients’ ther-apies. The physicians have several groups of medications at their disposal withwhich they try to preserve the good quality of patient’s life. They use and switchbetween di↵erent groups of drugs and their dosages to treat di↵erent symptoms(e.g., levodopa is used for motor symptoms), and also to prevent overuse ofany specific drug in order to reduce side-e↵ects and undesired drug interactions.Our multitask learning approach based on Predictive Clustering Trees (PCTs)[4] (introduced in Section 2.3) allows for modeling of all medication groups si-multaneously. By simultaneously predicting several target variables, the model
104 Chapter 6. Detection of Medications Change Patterns

1 getAttrChangeProbabilities(F,I,c):
Input : F – concatenated view (feature data set);
A – attribute space;
I – indices of patient-visit combinations;
c – assigned cluster labels;
Parameters : K – number of clusters in c;
Output : attrChangeProbability;
attrSameProbability;
// Count for each cluster crossing. Matrix noOfCrossingsK⇥K is initialized to 0.
2 noOfCrossings = {1:K, 1:K} 0
// Number of value changes for each attribute and each cluster crossing.
// Matrix attrChangeNoK⇥K⇥|A| is initialized to 0.
3 attrChangeNo = {1:K, 1:K, 1:|A|} 0
// Probability of value changes for each attribute and each cluster crossing.
// Matrix attrChangeProbabilityK⇥K⇥|A| is initialized to 0.
4 attrChangeProbability = {1:K, 1:K, 1:|A|} 0
// Number of unchanged values for each attribute and each cluster crossing.
// Matrix attrSameNoK⇥K⇥|A| is initialized to 0.
5 attrSameNo = {1:K, 1:K, 1:|A|} 0
// Pobability of unchanged values for each attribute and each cluster crossing.
// Matrix attrSameProbabilityK⇥K⇥|A| is initialized to 0.
6 attrSameProbability = {1:K, 1:K, 1:|A|} 0
7 for patient in [1:p] do
// consecutive visits for a given patient8 patientsVisits I[patient,1:allVisits[patient]]
9 for vj , vj+1 in patientsVisits do
10 prevCluster c[patient][vj ]
11 currCluster c[patient][vj+1]
12 incrementByOne(noOfCrossings[prevCluster, currCluster])
13 prevFeatures F[vj ]
14 currFeatures F[vj+1]
15 for attr in A do
16 if di↵ers(prevFeatures[attr],currFeatures[attr]) then
17 incrementByOne(attrChangeNo[prevCluster, currCluster][attr])
18 end
19 else
20 incrementByOne(attrSameNo[prevCluster, currCluster][attr])
21 end
22 end
23 end
24 end
// Determine the probability of changed/unchanged attribute values// for each cluster crossing.
25 for c1 in [1:K] do
26 for c2 in [1:K] do
27 clusterCrosses = noOfCrossings[c1,c2]
28 for attr in attrChangeNo[c1,c2] do
29 attrChanges = attrChangeNo[c1,c2][attr]
30 attrChangeProbability[c1,c2][attr] =attrChanges
clusterCrosses31 end
32 for attr in attrSameNo[c1,c2] do
33 attrSame = attrSameNo[c1,c2][attr]
34 attrSameProbability[c1,c2][attr] =attrSame
clusterCrosses35 end
36 end
37 end
38 return attrChangeProbability, attrSameProbability
Algorithm 1: Assessment of feature impact on cluster changes.
6.2. Related Publication 105

Fig. 1. Outline of the methodology for determining medications change patterns inPPMI data using predictive clustering trees.
allows physicians to observe the interactions between di↵erent groups of medi-cations, which is not possible with univariate models. As training data, we usetime-stamped symptoms and medications data. Figure 1 outlines the proposedfive-step methodology, which uses symptoms data collected over time (i.e. overseveral patient’s visits) and respective changes in medications therapies. Ourgoal is to identify symptoms scenarios for which the physicians need to considermodifications of therapies.
The input to the methodology are PPMI data sets of patient symptoms(described in Section 3.1) and the PPMI medications log data set (described inSection 3.2). The output of the methodology are patterns of patients’ symptomsfor which particular changes of medications were administered by the clinicians.
In step A we construct a time-stamped symptoms data set consisting of thesymptoms (attributes) described in Section 3.1. This data set consists of patient-visit pairs (pi, vij) describing the patients and their visits to the clinician.
In step B we construct a data set of medications changes which are repre-sented with (pi,mij ,mij+1) tuples, where mij and mij+1 are medication ther-apies of patient pi in two consecutive visits, vij and vij+1. A patient receives atherapy which is any combination of levodopa, dopamine agonists, and MAO-Binhibitors. For each of the three medications groups, we determine whether itsdosage in the time of visit vij+1 has changed (increased or decreased) or re-mained unchanged with respect to the dosage at visit vij . The output of stepB is a data set of medications changes, presented as tuples (Lij , Dij ,Mij), indi-cating whether between visits vij and vij+1 a change of dosage in levodopa (L),dopamine agonist (D), or MAO-B inhibitors (M) took place.
In step C we concatenate the data sets obtained in steps A and B into amerged data set of symptoms and medications data. We use patient-visit pairs(pi, vij) describing patient’s symptoms at visit vij and the changes of medicationsin the same visit with respect to the next visit vij+1. These data consist of a setof attributes describing the condition of the patient, and three attributes (lev-odopa, dopamine agonists, and MAO-B) indicating the changes in their dosage,respectively. The set of symptoms describing the condition of the patient can
106 Chapter 6. Detection of Medications Change Patterns

be preselected by clinicians, automatically selected, or a combination of bothapproaches.
The merged data set is used in step D to determine medications changepatterns. The three medications groups are used as multitask variables (mul-tiple classes) in the predictive clustering trees learning approach. We want todetermine which symptoms influence decisions of physicians to modify the ther-apies that patients receive. The discovered therapy modifications patterns areanalyzed by the physician in step E .
Models produced by the PCT approach serve three aims: determining pat-terns of medications dosage changes, identification of Parkinson’s disease symp-toms suggesting medications dosage changes, and discovering groups of similarpatients. These aims depend on the interpretation of the PCTs. Patterns of med-ications dosage changes are found in the leaves of the tree. Branches from theroot of the tree to its leaves identify the symptoms influencing a particular pat-tern of medications dosage change, while patients experiencing these symptomsand medications dosage changes construct groups of patients that are similarbased on both their symptoms and their medications therapy modifications.
We test the proposed methodology in two experimental settings, using twodi↵erent symptoms data sets described in more detail below. In the first ex-perimental setting, (Section 5.2) we use symptoms which were selected by ourconsulting clinician. In the second experimental setting (Section 5.3), we testthe proposed methodology for determination of the symptoms’ impact (see Sec-tion 4.1) and form a merged data set with symptoms selected by the clinicianand the most influential symptoms according to Algorithm 1. We analyze symp-tom patterns for which the physicians modified the patients’ therapies. We usethe changes of the three medications groups as the target classification variables.Changes in dosage (increase or decrease) are marked with the class label yes,while unchanged drug dosages are marked with the class label no.
5 Evaluation
We split the evaluation of the proposed methodology into three parts. In Section5.1 we use Algorithm 1 to find the most influential symptoms. In Section 5.2we analyze the medications dosage change patterns detected from symptomsselected by clinicians (see Section 3.3). The most influential symptoms fromSection 5.1 together with the symptoms selected by clinicians form a new dataset and are analyzed in Section 5.3.
5.1 The most influential symptoms
When patients change clusters between two consecutive visits, this change canbe considered as positive or negative. A positive cluster change occurs whenbetween two consecutive visits a patient has crossed from a cluster with higherindex (e.g., cluster 2 ) to a cluster with lower index (e.g., cluster 1 ). Given thecluster descriptions from [44], this change indicates that the overall status of
6.2. Related Publication 107

Algorithm1:getAttrChangeProbabilities
Input:F-featuredatasetfromTable1;I–indicesandc- clusterlabelsfromValmarskaetal.(2018);
Output:
ProbabilitiesattrChangeProbabilityandattrSameProbability;
Fig. 2. A flowchart presenting the input, output, and method used for determining themost influential symptoms. Details about the input data can be found in Table 1 and[43, 44].
the patient concerning her/his motor symptoms has improved (indicated withlower MDS-UPDRS values). Contrarily, when in two consecutive visits a patientmoves from a cluster with lower index (e.g., cluster 1 ) to a cluster with higherindex (e.g., cluster 2 ) her/his overall status has worsen (as indicated by the sumof the motor symptom).
We ran the Algorithm 1 twice, the first time using numerical scores of symp-toms (values 0-4 for MDS-UPDRS symptoms), and the second time using dis-cretized values of the symptoms (normal and problematic). A flowchart present-ing the input, output, and method used in this experimental setting is presentedin Figure 2. For each run, the algorithm returned the probabilities of symptomchanges and symptoms staying unchanged. Ranking the symptoms by the de-creased probability of symptom changes and intersecting the top 255 features weget a list of symptoms that have the strongest impact on cluster changes. Theseare symptoms that have most frequently changed values, and whose change ofvalues brought significant improvement (from problematic to normal) or decline(from normal to problematic).
Table 3 presents the intersection of lists obtained by two runs of the algo-rithm, for symptoms whose values have changed most frequently when a clusterchange has occurred. The symptoms are presented with their code names fromthe PPMI data collection and with their descriptions. The results are orderedaccording to the decreased probability of cluster changes (weighted positive andnegative changes).
We can note that the upper part of Table 3 is populated with the motor symp-toms from MDS-UPDRS Part III. This is not surprising since as we mentionedabove, the obtained clusters were ordered in accordance with the aggregate scoreof their motor symptoms from MDS-UPDRS Part III. In addition to the influen-tial motor symptoms, the algorithm finds also a subset of influential non-motorsymptoms whose values vary as the overall status of the patient’s changes.
In practice, positive and negative changes are not treated equally and may notbe caused by the same symptoms. Clinicians try to avoid negative changes andactively promote positive changes. We first report symptoms indicating positivechanges, followed by the symptoms indicating negative changes.
5 The number of top-ranked features was set experimentally so that the length of theintersection list is su�ciently informative and manageable for clinicians.
108 Chapter 6. Detection of Medications Change Patterns

Table 3. List of most influential symptoms according to Algorithm 1. The symptomsare ordered according to their average rank of positive and negative impact.
PPMI attribute Attribute description PPMI data set Attribute importancefor cluster change
NP3BRADY Bradykinesia MDS-UPDRS Part III 0.314NP3TTAPL Toe tapping (left) MDS-UPDRS Part III 0.297NP3RTCON Constancy of rest MDS-UPDRS Part III 0.291NP3FACXP Facial expression MDS-UPDRS Part III 0.282NP3FTAPL Finger tapping (left) MDS-UPDRS Part III 0.273NP3FTAPR Finger tapping (right) MDS-UPDRS Part III 0.255NP3PRSPL Hand pronation/supination (left) MDS-UPDRS Part III 0.244NP3TTAPR Toe tapping (right) MDS-UPDRS Part III 0.239NP3PRSPR Hand pronation/supination (right) MDS-UPDRS Part III 0.203NP1SLPN Sleep problems (night) MDS-UPDRS Part Ip 0.155NP1SLPD Daytime sleepiness MDS-UPDRS Part Ip 0.147NP2HWRT Handwriting MDS-UPDRS Part II 0.144NP1FATG Fatigue MDS-UPDRS Part Ip 0.138NP1URIN Urinary problems MDS-UPDRS Part Ip 0.134NP1PAIN Pain and other sensations MDS-UPDRS Part Ip 0.117MCATOT MoCA total score (cognition) MoCA 0.097
Figure 3 presents the symptoms whose values improve most frequently whenthe patients make a positive cluster change (their overall status between twoconsecutive visits improves). The results suggest that in over 37% of cases whenthe patient’s status improves, also the value of their constancy of rest improves(NP3RTCON). The second most frequently improved symptom is bradykinesia(NP3BRADY), followed by the finger tapping in the left hand (NP3FTAPL).
Figure 4 presents the results for the symptoms whose values degrade mostfrequently when the patients make a negative cluster change and their overallstatus between two consecutive visits worsens. The results suggest that in over30% of cases when the patients’ status worsens, they experience problems withtoe taping, facial expression, and bradykinesia.
Rigidity is a relevant and bothersome symptom for patients that was notdetected by Algorithm 1. A reason for this omission may be the fact that rigidityis reported through five questions from MDS-UPDRS Part III (both hands, bothlegs, and neck). Patients can experience rigidity problems on di↵erent parts ofthe body and each of this parts may not be statistically strong enough to beranked high by Algorithm 1. A way to alleviate this problem would be to combineanswers from multiple questions concerning the same underlying symptom beforerunning Algorithm 1. We plan such detailed analysis for our further work as wellas a selection of two separate lists of symptoms which improve or decline mostfrequently. This could lead to distinguishing the symptoms for which change ofmedications dosage is the most e↵ective, as well as those who are most inclinedto worsening as the disease progresses.
Similarly to our approach to determining the importance of symptoms forthe overall disease progression, the feature evaluation algorithms Relief and Re-liefF [19, 34] also compare feature values of similar instances from the same classand similar values from a di↵erent class. Relief and ReliefF reward the features
6.2. Related Publication 109

Fig. 3. Symptoms whose values improved most frequently when the overall status ofpatients improved. The acronyms are explained in Table 3.
that separate instances with di↵erent class values and punish the features thatseparate the instances with the same class value. If applied to our problem, thesealgorithms cannot take into account temporal progress of patients, i.e. they can-not track individual patients on their consecutive visits to the clinician. In e↵ect,they show which attributes influence the initial assignment of patients into clus-ters, but reveal no information about attributes which are the most influentialfor changes of patients’ overall status (i.e., for crossing of clusters). We notethat the assignment to clusters was done based on the patients’ overall statusrepresented with sums of attributes values from the respective questionnairespresented in Section 3.1. Nevertheless, we evaluated the symptoms using theReliefF algorithm [34, 35]. Out of the best 16 symptoms as evaluated by the Re-liefF algorithm, 9 were selected into the top 16 most most influential symptoms(see Table 3) by Algorithm 1 (MCATOT, NP1SLPD, NP1URIN, NP3RTCON,NP1SLPN, NP1FATG, NP3PRSPL, NP3TTAPR, NP3TTAPL). Symptoms—such as bradykinesia—that are strong indicators of the disease progression wereevaluated as insignificant by the ReliefF algorithm. For this reason, the resultsof ReliefF for symptom evaluation are not included.
110 Chapter 6. Detection of Medications Change Patterns

Fig. 4. Symptoms whose values worsen most frequently when the overall status ofpatients degraded. The acronyms are explained in Table 3.
5.1.1 Medical interpretation of the results
According to the consulting clinician, in general, the computed symptom impor-tance is in accordance with the medical literature on Parkinson’s disease [10, 1].Below we present some further interesting findings.
Cognitive decline, as depicted by the MoCA total score, and bradykinesia arevery important factors when considering changing patients’ medications [10, 1].Braykinesia is a score combining toe tapping [18, 14] (for lower limbs bradykine-sia assessment), hand pronation/supination, and finger tapping (for upper limbsbradykinesia assessment) [21]. As confirmed by the expert, the constancy ofrest tremor and pain are symptoms which are important for some patients whofind these symptoms particularly bothersome and demand an intervention withmedications. Dyskinesia and fluctuations are important symptoms not rankedat the top of the list according to our Algorithm 1. The reason is that the PPMIdatabase includes many newly diagnosed and early-stage patients, for who thesesymptoms do not change values often.
The importance of handwriting is an interesting finding of the study andconfirms recent studies [9] suggesting that handwriting could be a useful markerfor disease diagnosis [36] and progression [27]. Our further analysis of patientswith problematic handwriting revealed that these patients experience more prob-
6.2. Related Publication 111

Methodologyfordeterminingmedicationschangepatterns
(seeFigure1)
Input:S–symptomsdatasetfromTable2;M– medicationsdataset;
Output:
PCTsshowingmedicationschangepatterns.
Fig. 5. A flowchart presenting the input, output, and method used for determiningmedications dosage change patterns detected from symptoms selected by clinicians.Details about the used symptoms data can be found in Table 2.
lems with their motor symptoms (reflected by the sum of symptoms from MDS-UPDRS Part III), and also su↵er from bradykinesia, pain, and rigidity withhigher severity than patients who do not have problems with handwriting. Re-sults of our analysis also suggest that patient’s handwriting sensitively reflectsimprovements and worsening of patients’ motor symptoms.
5.2 Medications dosage change patterns detected from symptomsselected by clinicians
For this set of evaluations, we use the data set composed of symptoms selectedby clinicians (see Section 3.3). A flowchart with the input, output, and methodused in this experimental setting is presented in Figure 5. A pruned predic-tive clustering tree (PCT) model of medications changes based on the patient’sstatus is shown in Figure 6. The PCT models the dosage changes of all three an-tiparkinson medication groups simultaneously, allowing for the detection of druginteractions based on the patient’s status. Notice that in PCT construction, theuser can decide how to prune the tree. In our experiments, we used the defaultpruning method, called C4.5 [39, 28].
The leaves of the predictive clustering tree hold information about the recordedtherapy modifications. The components of the lists presented in each tree leafpredict dosage changes of levodopa, dopamine agonists, and MAO-B inhibitors,respectively. The list of numbers in the leaves represents the total number ofinstances that are described by the symptoms from the root to the leaf. Thenumber of instances for which the proposed medications dosage change has ac-tually happened are written in the square brackets. For example, the list [yes,yes, yes] presented in the first leaf on the left (Path 1), indicates that the dosagesof levodopa, dopamine agonists, and MAO-B changed. The total number of cov-ered instances is 20. Out of these 20 patients, for 17 the dosage of levodopachanged, for 12 the dosage of dopamine agonists changed and for 12 the dosageof MAO-B inhibitors changed.
The attributes of instances (patient-visit pairs) influencing this change arepresented along the path from the tree root to the respective leaf. In this ex-ample, these are the patients who are younger than 65, have problems withON/OFF fluctuations, and have problems with their impulsivity. The leaf [yes,no, no] on the right (Path 2) suggests that physicians only considered changesin levodopa. These dosage changes can be justified by the patients’ symptoms,
112 Chapter 6. Detection of Medications Change Patterns

Fig. 6. Pruned predictive clustering tree modeling dosage changes for three groups ofmedications. Medication dosage changes are modeled by patients’ symptoms.
i.e. patients have problems with ON/OFF fluctuations and no problems withtheir impulsivity. Moreover, in younger patients without ON/OFF fluctuationproblems but with other problematic symptoms: impulsivity, bradykinesia anddaytime sleepiness, the physicians also change only levodopa dosages (Path 4in Figure 6). This might reflect the current clinical practice—many patientswant treatment of their motor symptoms first, which usually improve based onincreased levodopa dosages.
Path 4 in Figure 6 shows that for younger patients with problematic im-pulsivity and without problems with ON/OFF fluctuations and bradykinesia,physicians change the dosages of all three medication groups. These results arein accordance with the literature on Parkinson’s disease [47] and were confirmedby the clinical expert.
The results reveal that if the patient experiences ON/OFF fluctuations prob-lems (left subtree in Figure 6), physicians will react with the change of dosageof levodopa medications [12]. If the patients experience non-motor symptoms(e.g., impulsivity, depression), physicians will react by modifying the dosages ofdopamine agonists [37]. This is in accordance with the literature on Parkinson’sdisease and was confirmed by the expert. Increased dosages of dopamine agonistscan produce non-motor related side-e↵ects. Physicians will react by lowering the
6.2. Related Publication 113
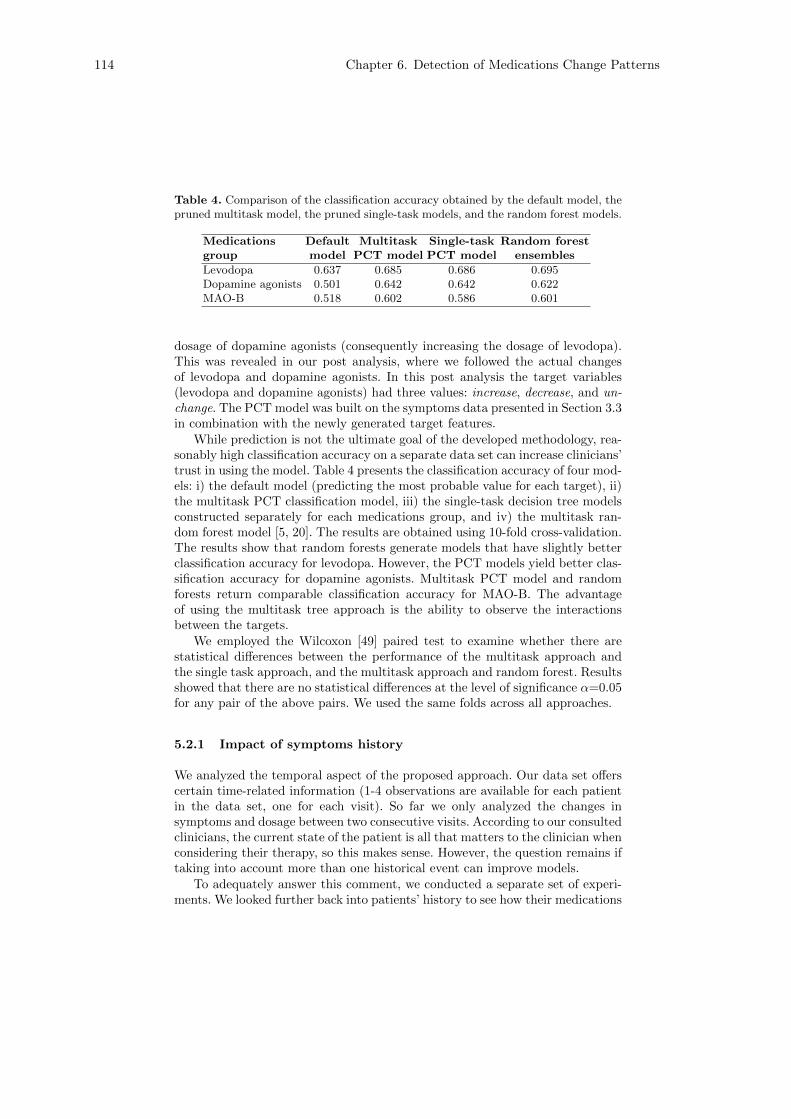
Table 4. Comparison of the classification accuracy obtained by the default model, thepruned multitask model, the pruned single-task models, and the random forest models.
Medications Default Multitask Single-task Random forestgroup model PCT model PCT model ensemblesLevodopa 0.637 0.685 0.686 0.695Dopamine agonists 0.501 0.642 0.642 0.622MAO-B 0.518 0.602 0.586 0.601
dosage of dopamine agonists (consequently increasing the dosage of levodopa).This was revealed in our post analysis, where we followed the actual changesof levodopa and dopamine agonists. In this post analysis the target variables(levodopa and dopamine agonists) had three values: increase, decrease, and un-
change. The PCT model was built on the symptoms data presented in Section 3.3in combination with the newly generated target features.
While prediction is not the ultimate goal of the developed methodology, rea-sonably high classification accuracy on a separate data set can increase clinicians’trust in using the model. Table 4 presents the classification accuracy of four mod-els: i) the default model (predicting the most probable value for each target), ii)the multitask PCT classification model, iii) the single-task decision tree modelsconstructed separately for each medications group, and iv) the multitask ran-dom forest model [5, 20]. The results are obtained using 10-fold cross-validation.The results show that random forests generate models that have slightly betterclassification accuracy for levodopa. However, the PCT models yield better clas-sification accuracy for dopamine agonists. Multitask PCT model and randomforests return comparable classification accuracy for MAO-B. The advantageof using the multitask tree approach is the ability to observe the interactionsbetween the targets.
We employed the Wilcoxon [49] paired test to examine whether there arestatistical di↵erences between the performance of the multitask approach andthe single task approach, and the multitask approach and random forest. Resultsshowed that there are no statistical di↵erences at the level of significance ↵=0.05for any pair of the above pairs. We used the same folds across all approaches.
5.2.1 Impact of symptoms history
We analyzed the temporal aspect of the proposed approach. Our data set o↵erscertain time-related information (1-4 observations are available for each patientin the data set, one for each visit). So far we only analyzed the changes insymptoms and dosage between two consecutive visits. According to our consultedclinicians, the current state of the patient is all that matters to the clinician whenconsidering their therapy, so this makes sense. However, the question remains iftaking into account more than one historical event can improve models.
To adequately answer this comment, we conducted a separate set of experi-ments. We looked further back into patients’ history to see how their medications
114 Chapter 6. Detection of Medications Change Patterns
have changed, based on symptoms from more distant visits. Comparison of 10-fold cross validation classification accuracy on models with di↵erent spans oflook-back showed that the classification accuracy of models decreases as we in-clude references to more distant visits. The highest accuracy is achieved whenwe consider only the actual state of the patients (these results are presented inthis section).
5.3 Medications Dosage Change Patterns Detected from ExtendedSymptoms Data
The PCT model from Section 5.2 was generated on a set of symptoms selectedbased on the expert’s choice. In this Section, we explore the model for dosagechange of antiparkinson medications if in addition to the symptoms that arepre-selected by the clinicians we include also the most influential attributesfrom Table 3. We present the description of the newly introduced symptoms,the predictive clustering tree model generated on this extended data set, shortinterpretation of the tree, the classification accuracy of the models, and a shortdiscussion on the di↵erences between the original model (Section 5.2) and therevised model (Section 5.3.2).
5.3.1 Extended data set
As already mentioned, when monitoring the patient’s status and deciding aboutthe modification of their medications therapy, clinicians think in terms whetherthe symptom’s severity is normal for a Parkinson’s disease patient or it is prob-lematic and a change of dosage of antiparkinson medications is needed. Table 5presents the most influential motor and non-motor symptoms according to Al-gorithm 1 and the intervals for their quantization into normal and problematic
symptoms values. Six of the symptoms from Table 3 were merged into threenew (revised) symptoms. These six symptoms were pairs of three underlyingsymptoms, each concerning a di↵erent side of the body (left or right), and weretherefore paired into three new symptoms. The three new symptoms are: toe tap-ping, finger tapping, and hand pronation/supination. The values of the newlyconstructed symptoms are obtained as the maximum of the two basic symptomsvalues (left and right).
The extended symptoms data set used in the experiments below is presentedin Table 6. These symptoms aremotor, non-motor, and epidemilogical, consistingof the symptoms that were pre-selected by our consulting expert (see Section 3.3)and the most influential symptoms returned by Algorithm 1 (Table 5). We de-cided to omit the cognitive disorder attribute due to the fact that its only valuespresent in the database were normal and missing. The reason for this is that inthis analysis we only consider patients with included medications data.
Note that out of the 16 symptoms that were top-ranked by Algorithm 1, ourconsulting clinician reported 3 as the symptoms they consider when decidingabout the change of Parkinson’s disease patient’s therapy. These symptoms arecognition, daytime sleepiness, and bradykinesia (marked in bold in Table 5).
6.2. Related Publication 115

Table 5. Description of the motor (upper part) and non-motor (lower part) symptomswhich are reported as the most influential by Algorithm 1. Toe tapping, finger tapping,and hand pronation/supination were generated as the maximum value of the basicsymptom on the patient’s left and right side. The values intervals (normal and prob-
lematic) were defined by the clinician. The three symptoms marked with bold typefacewere independently selected by clinicians as the most important.
Symptom Data set Question Normal Problematicnumber values interval values interval
bradykinesia MDS-UPDRS Part III 3.14 0–1 2–4toe tapping MDS-UPDRS Part III max(3.7a, 3.7b) 0–1 2–4constancy of rest MDS-UPDRS Part III 3.18 0–1 2–4facial expression MDS-UPDRS Part III 3.2 0–1 2–4finger tapping MDS-UPDRS Part III max(3.4a, 3.4b) 0–1 2–4hand pronation/supination MDS-UPDRS Part III max(3.6a, 3.6b) 0–1 2–4sleep problems MDS-UPDRS Part Ip 1.7 0–1 2–4daytime sleepiness MDS-UPDRS Part I 1.8 0–1 2–4handwriting MDS-UPDRS Part II 2.7 0–1 2–4fatigue MDS-UPDRS Part Ip 1.13 0–1 2–4urinary problems MDS-UPDRS Part Ip 1.10 0–1 2–4pain and other sensations MDS-UPDRS Part Ip 1.9 0–1 2–4cognitive disorder MoCA SUM 26–30 <26
Table 6. Extended symptoms data set consisting of symptoms handpicked by theexpert and the most influential symptoms ranked by Algorithm 1. Details about thesymptoms can be found in Tables 2 and 5.
Motor symptoms Non-motor symptoms Epidemilogical symptomsbradykinesia daytime sleepiness age
tremor impulsivity disease duration
gait depression
dyskinesia hallucinations
ON/OFF fluctuations sleep problems
toe tapping handwriting
constancy of rest fatigue
facial expression urinary problems
finger tapping pain and other sensations
hand pronation/supination
5.3.2 Revised results and discussion
The extended symptoms data set was used as an input to our methodology fordetermining medications dosage change patterns in PPMI data using predic-tive clustering trees (presented in Section 4.2). A flowchart outlining the input,output, and method used in this experimental setting is presented in Figure 7.The obtained model for symptoms scenarios that caused clinicians reaction withmedications dosage change is presented in Figure 8.
The revised model for dosage changes is slightly di↵erent from the originalmodel presented in Figure 6. The roots of the trees are the same, i.e. the clin-ician’s decision about modifying the patient’s medications treatment is mostlyinfluenced by the age of the patient. For younger patients, the decision is influ-
116 Chapter 6. Detection of Medications Change Patterns

Methodologyfordeterminingmedicationschangepatterns
(seeFigure1)
Input:S–symptomsdatasetfromTable6;M– medicationsdataset;
Output:
PCTsshowingmedicationschangepatterns.
Fig. 7. A flowchart presenting the input, output, and method used for determining pat-terns of medications dosage change from the extended symptoms data. The extendedsymptoms data set is presented in Table 6.
Fig. 8. Pruned predictive clustering tree modeling the dosage changes for three groupsof medications. The model is generated on the extended set of Parkinson’s diseasepatients symptoms. For improved model readability, the minimal number of coveredinstances is set to 20.
enced also by their on/o↵ fluctuations and impulsivity. The right-hand side of thesubtree concerning younger patients is di↵erent. In this subtree, the symptomsthat influence the dosage change of antiparkinson medications are the newly in-troduced symptoms: pain and other sensations, hand pronation/supination, andhandwriting. Path 1 and Path 2 are the same in both models. Path 4 in bothmodels reveals medications change pattern [yes, no, no], indicating that basedon the symptoms patterns (the paths from the root to the leaf of the tree) theclinicians consider changing the dosage of levodopa, and leave the dosages ofdopamine agonists and MAO-B inhibitors unchanged. Paths 3.1 and 3.2 sug-gest that the clinician should consider updating the dosages of all antiparkinsonmedications which is similar to Path 3 of Figure 6.
For each of the medications groups, Table 7 presents the classification accu-racy of the default model, revised multitask PCT model, revised single-task PCT
6.2. Related Publication 117

Table 7. Comparison of the classification accuracy obtained by the default model, thepruned multitask PCT model, the pruned single-task PCT models, and the randomforest ensemble model on the extended symptoms data set.
Medications Default Multitask Single-task Random forestgroup model PCT model PCT model ensembleLevodopa 0.637 0.657 0.671 0.683Dopamine agonists 0.501 0.631 0.630 0.642MAO-B 0.518 0.583 0.572 0.615
models, and random forest multitask model. Results are obtained using 10-foldcross-validation. As it is the case with the model from Figure 6, the accuracyvalues obtained by the multitask PCT model are comparable to those obtainedby the single-task PCT model and are better when compared to the defaultmodel. The multitask random forest ensemble returned the best classificationaccuracy for all targets. This model also has an improved classification accu-racy for dopamine agonists and MAO-B compared to models from Section 5.2(see Figure 6 and Table 4). This improvement can be explained with the ad-ditional information available in the extended set of attributes and non-trivialinteractions between di↵erent targets, which can be captured by ensembles. Themain disadvantage of the ensemble multitask models is their lack of model inter-pretability. The Wilcoxon [49] paired test revealed that for the target variablelevodopa the random forest ensemble performs significantly better than our mul-titask approach (↵=0.05, p-value=0.012). For the target variable MAO-B, themultitask approach performs significantly better than the single-task approach(↵=0.05, p-value=0.018). Other di↵erences were not significant. We used thesame folds across approaches.
The classification accuracy of both the revised multitask PCT model and therevised single-task PCT models are lower than the accuracies of the models gen-erated on the original symptoms data set (Table 2). A reason for this di↵erencemay be the fact that our models are trained on and reflect the history of clin-icians’ decisions, and do not necessarily reflect the actual symptoms cliniciansshould react to.
5.3.3 Medical evaluation of the results
For patients covered by rules from Path 1 and Path 2 it is reasonable to introducelevodopa and try to provide the optimal dosage even in younger patients (averageage of 53 years) when they have on/o↵ fluctuations (i.e. disease is rapidly pro-gressing). The presence of impulsivity dictates the medications dosage changesthe clinician should make. Path 3.1 covers younger patients (average age of52.42 years) who su↵er from severe bradykinesia (NP3BRADY = 1.94± 0.846).Their overall motor symptoms are severe, i.e. the sum of MDS-UPDRS Part III
6 In further analysis of the tree leaves in the model from Figure 8 we calculated averagesymptom values of covered patients.
118 Chapter 6. Detection of Medications Change Patterns

(NP3SUM) is 34.03± 11.99. Patients’ quality of daily living is a↵ected, i.e. thesum of MDS-UPDRS Part II (NP2SUM) is 13.85 ± 6.36. Along with the pres-ence of pain, many changes in medications dosages are done in an e↵ort to bettermanage the advanced disease severity. Patients who do not have problems withpain and are treated with [no,yes,yes] medications dosage change pattern arepatients who also have severe motor symptoms (NP3SUM = 31.06 ± 0.84 anddisturbing bradykinesia (NP3BRADY = 1.71 ± 0.84)). However, their overallstatus is slightly better and the mild problems with pain lead to more dosagechanges of dopamine agonists and MAO-B inhibitors, and a stable treatmentwith levodopa.
Patients covered by Path 4 are overall in a better condition that patientsmentioned in previous paths. Their motor symptoms are less severe (NP3SUM =20.39±9.15), they do not have problems with on/o↵ fluctuations, they have mildbradykinesia, and have no cognitive problems. Their handwriting seems to be auseful marker of disease progression which leads to dosage changes in levodopa.Changes of medication dosages for patients covered by Path 3.2 are imposedby the problematic impulsivity. Dosages of dopamine agonists are lowered tostabilize impulsivity, while levodopa is increased in order to control the motorsymptoms. Younger patients who do not have problems with impulsivity (norproblems with on/o↵ fluctuations, hand pronation/supination, handwriting) andare treated with [no,yes,yes] medications dosage change pattern are patients whoare in better condition than all the other patients included in the predictiveclustering tree from Figure 8. Reasonably, only dopamine agonists and MAO-B inhibitors are modified in an e↵ort for better management of the disease.Levodopa is either not prescribed or only low dosages are prescribed. Olderpatients (average age of 68.45±4.87 years) have problems with many symptoms.The disease is managed with levodopa, and an optimal regime is sought throughchanges.
6 Conclusions
We present the methodology to detect trigger symptoms for change of medica-tions therapy of Parkinson’s disease patients. We consider trigger symptoms tobe the ones which press the physicians to make modifications of the treatment fortheir patients. We test the developed methodology on a chosen subset of time-stamped PPMI data. The data set o↵ers an insight into the patients’ symptomsprogression through time, as well as the response of physicians following prob-lematic states of either motor or non-motor symptoms. We identify clinicallyconfirmed patients’ symptoms indicating the need for medication changes.
The proposed approach allows identifying patient subgroups for which certainmedications modifications have either a positive or a negative e↵ect. By postanalysis of the patients who respond well to the medications modification andthose who do not, and the underlying characteristics of each group, we may beable to assist the physicians with the therapy modifications for a given patientby narrowing the number of possible medication prescriptions scenarios.
6.2. Related Publication 119

We also present an algorithm for determining the symptoms which havethe largest influence on the change of the Parkinson’s disease patients’ overallstatus. These are the symptoms that change most frequently as the status of thepatient improves/declines. We relate this work with our previous work, wherewe developed a methodology for determining groups of patients with similarseverity of symptoms and establishing how the disease progresses in terms of theseverity of several groups of symptoms.
Our results show that some of the most impactful symptoms for changes inthe patients overall status detected by Algorithm 1, are currently not consideredby the clinicians when deciding about the change of antiparkinson medicationdosages. This requires further study and o↵ers an opportunity for improveddisease management in the future.
In future work, we plan to apply model explanation approaches to describerelevant subgroups of patients, therapy change patterns with a positive influenceon the control of symptoms, and therapy patterns which are more likely to leadto side e↵ects. There are some open opportunities in the analysis of more thanone previous time point. Taking longer history into account we might be able todetect groups of patients which do not react well to the changes in antiparkinsonmedications.
Acknowledgements. This work was supported by the PD manager project,funded within the EU Framework Programme for Research and Innovation Hori-zon 2020 grant 643706. We acknowledge the financial support from the SlovenianResearch Agency (research core fundings No. P2-0209 and P2-0103). This re-search has received funding also from the European Unions Horizon 2020 researchand innovation programme under grant agreement No. 720270 (HBP SGA1).
Data used in the preparation of this article were obtained from the ParkinsonsProgression Markers Initiative (PPMI) (www.ppmi-info.org/data). For up-to-date information on the study, visit www.ppmi-info.org. PPMI—a public-private partnership—funded by the Michael J. Fox Foundation for Parkinson’sResearch and funding partners. Corporate Funding Partners are: AbbVie, AvidRadiopharmaceuticals, Biogen, BioLegend, Bristol-Myers Squibb, GE Health-care, GLAXOSMITHKLINE (GSK), Eli Lilly and Company, Lundbeck, Merck,Meso Scale Discovery (MSD), Pfizer Inc, Piramal Imaging, Roche, Sanofi Gen-zyme, Servier, Takeda, Teva, UCB. Philanthropic Funding Partners: Golub Capi-tal. List of funding partners is found at www.ppmi-info.org/fundingpartners.
References
[1] Evidence Based Medicine Publications for Treatment of Motor and Non-motorsymptoms of Parkinson’s disease. http://www.movementdisorders.org/MDS/Resources/Publications-Reviews/EBM-Reviews.htm. Accessed: 2017/10/20.
[2] A. Arauzo-Azofra, J. L. Aznarte, and J. M. Bentez. Empirical study of feature se-lection methods based on individual feature evaluation for classification problems.Expert Systems with Applications, 38(7):8170 – 8177, 2011.
120 Chapter 6. Detection of Medications Change Patterns

[3] H. Blockeel and L. De Raedt. Top-down induction of first-order logical decisiontrees. Artificial Intelligence, 101(1-2):285–297, 1998.
[4] H. Blockeel, L. D. Raedt, and J. Ramon. Top-down induction of clustering trees.In Proceedings of the Fifteenth International Conference on Machine Learning
(ICML), pages 55–63, 1998.[5] L. Breiman. Random forests. Machine Learning, 45(1):5–32, 2001.[6] R. Caruana. Multitask learning. Machine Learning, 28(1):41–75, 1997.[7] R. Caruana, S. Baluja, and T. Mitchell. Using the future to “sort out” the present:
Rankprop and multitask learning for medical risk evaluation. In Advances in
Neural Information Processing Systems, pages 959–965, 1996.[8] J. Dalrymple-Alford, M. MacAskill, C. Nakas, L. Livingston, C. Graham, G. Cru-
cian, T. Melzer, J. Kirwan, R. Keenan, S. Wells, et al. The MoCA: well-suitedscreen for cognitive impairment in Parkinson disease. Neurology, 75(19):1717–1725, 2010.
[9] P. Drotar, J. Mekyska, I. Rektorova, L. Masarova, Z. Smekal, and M. Faundez-Zanuy. Analysis of in-air movement in handwriting: A novel marker for Parkin-son’s disease. Computer Methods and Programs in Biomedicine, 117(3):405–411,2014.
[10] J. Ferreira, R. Katzenschlager, B. Bloem, U. Bonuccelli, D. Burn, G. Deuschl,E. Dietrichs, G. Fabbrini, A. Friedman, P. Kanovsky, et al. Summary of therecommendations of the EFNS/MDS-ES review on therapeutic management ofParkinson’s disease. European Journal of Neurology, 20(1):5–15, 2013.
[11] T. Foltynie, C. Brayne, and R. A. Barker. The heterogeneity of idiopathic Parkin-son’s disease. Journal of Neurology, 249(2):138–145, 2002.
[12] S. H. Fox, R. Katzenschlager, S.-Y. Lim, B. Ravina, K. Seppi, M. Coelho,W. Poewe, O. Rascol, C. G. Goetz, and C. Sampaio. The movement disordersociety evidence-based medicine review update: Treatments for the motor symp-toms of Parkinson’s disease. Movement Disorders, 26(S3):S2–S41, 2011.
[13] D. Gil and M. Johnson. Diagnosing Parkinson by using artificial neural networksand support vector machines. Global Journal of Computer Science and Technol-
ogy, 9(4):63–71, 2009.[14] C. G. Goetz, B. C. Tilley, S. R. Shaftman, G. T. Stebbins, S. Fahn, P. Martinez-
Martin, W. Poewe, C. Sampaio, M. B. Stern, R. Dodel, et al. Movement DisorderSociety-sponsored revision of the Unified Parkinson’s Disease Rating Scale (MDS-UPDRS): Scale presentation and clinimetric testing results. Movement Disorders,23(15):2129–2170, 2008.
[15] M. M. Hoehn and M. D. Yahr. Parkinsonism onset, progression, and mortality.Neurology, 17(5):427–427, 1967.
[16] A. Holzinger. Trends in interactive knowledge discovery for personalized medicine:Cognitive science meets machine learning. IEEE Intelligent Informatics Bulletin,15(1):6–14, 2014.
[17] A. J. Hughes, S. E. Daniel, L. Kilford, and A. J. Lees. Accuracy of clinicaldiagnosis of idiopathic Parkinson’s disease: A clinico-pathological study of 100cases. Journal of Neurology, Neurosurgery & Psychiatry, 55(3):181–184, 1992.
[18] J.-W. Kim, Y. Kwon, Y.-M. Kim, H.-Y. Chung, G.-M. Eom, J.-H. Jun, J.-W. Lee,S.-B. Koh, B. K. Park, and D.-K. Kwon. Analysis of lower limb bradykinesia inParkinson’s disease patients. Geriatrics & Gerontology International, 12(2):257–264, 2012.
[19] K. Kira and L. A. Rendell. The feature selection problem: Traditional methodsand a new algorithm. In Proceedings of the Tenth National Conference on Artificial
Intelligence, volume 2, pages 129–134, 1992.
6.2. Related Publication 121

[20] D. Kocev, C. Vens, J. Struyf, and S. Dzeroski. Ensembles of multi-objectivedecision trees. In European Conference on Machine Learning, pages 624–631.Springer, 2007.
[21] C. Lainscsek, P. Rowat, L. Schettino, D. Lee, D. Song, C. Letellier, and H. Poizner.Finger tapping movements of Parkinson’s disease patients automatically ratedusing nonlinear delay di↵erential equations. Chaos: An Interdisciplinary Journal
of Nonlinear Science, 22(1):013119, 2012.[22] S. Lewis, T. Foltynie, A. Blackwell, T. Robbins, A. Owen, and R. Barker. Het-
erogeneity of Parkinson’s disease in the early clinical stages using a data drivenapproach. Journal of Neurology, Neurosurgery & Psychiatry, 76(3):343–348, 2005.
[23] L.-Y. Ma, P. Chan, Z.-Q. Gu, F.-F. Li, and T. Feng. Heterogeneity among patientswith Parkinson’s disease: Cluster analysis and genetic association. Journal of theNeurological Sciences, 351(1):41–45, 2015.
[24] K. Marek, D. Jennings, S. Lasch, A. Siderowf, C. Tanner, T. Simuni, C. Co↵ey,K. Kieburtz, E. Flagg, S. Chowdhury, et al. The Parkinson’s Progression MarkersInitiative (PPMI). Progress in Neurobiology, 95(4):629–635, 2011.
[25] National Collaborating Centre for Chronic Conditions. Parkinson’s disease: Na-
tional clinical guideline for diagnosis and management in primary and secondary
care. London: Royal College of Physicians, 2006.[26] S. Patel, K. Lorincz, R. Hughes, N. Huggins, J. Growdon, D. Standaert, M. Akay,
J. Dy, M. Welsh, and P. Bonato. Monitoring motor fluctuations in patients withParkinson’s disease using wearable sensors. IEEE Transactions on Information
Technology in Biomedicine, 13(6):864–873, 2009.[27] S. Pinto and J.-L. Velay. Handwriting as a marker for PD progression: a shift in
paradigm. Neurodegenerative Disease Management, 5(5):367–369, 2015.[28] J. R. Quinlan. C4. 5: Programs for machine learning. Elsevier, 2014.[29] R. G. Ramani and G. Sivagami. Parkinson disease classification using data mining
algorithms. International Journal of Computer Applications, 32(9):17–22, 2011.[30] B. Rana, A. Juneja, M. Saxena, S. Gudwani, S. S. Kumaran, M. Behari, and
R. Agrawal. Graph-theory-based spectral feature selection for computer aideddiagnosis of Parkinson’s disease using T1-weighted MRI. International Journal
of Imaging Systems and Technology, 25(3):245–255, 2015.[31] J. Reijnders, U. Ehrt, R. Lousberg, D. Aarsland, and A. Leentjens. The as-
sociation between motor subtypes and psychopathology in Parkinson’s disease.Parkinsonism & Related Disorders, 15(5):379–382, 2009.
[32] O. Reyes, C. Morell, and S. Ventura. Scalable extensions of the ReliefF algo-rithm for weighting and selecting features on the multi-label learning context.Neurocomputing, 161:168–182, 2015.
[33] C. N. Riviere, S. G. Reich, and N. V. Thakor. Adaptive Fourier modeling forquantification of tremor. Journal of Neuroscience Methods, 74(1):77–87, 1997.
[34] M. Robnik-Sikonja and I. Kononenko. Theoretical and empirical analysis of Re-liefF and RReliefF. Machine learning, 53(1-2):23–69, 2003.
[35] M. Robnik-Sikonja and P. Savicky. Corelearn: Classification, regression and fea-ture evaluation, r package version 0.9. 45 (2015). URL http://CRAN. R-project.
org/package= CORElearn.[36] S. Rosenblum, M. Samuel, S. Zlotnik, I. Erikh, and I. Schlesinger. Handwrit-
ing as an objective tool for Parkinson’s disease diagnosis. Journal of Neurology,260(9):2357–2361, 2013.
[37] K. Seppi, D. Weintraub, M. Coelho, S. Perez-Lloret, S. H. Fox, R. Katzenschlager,E.-M. Hametner, W. Poewe, O. Rascol, C. G. Goetz, et al. The movement disorder
122 Chapter 6. Detection of Medications Change Patterns

society evidence-based medicine review update: Treatments for the non-motorsymptoms of Parkinson’s disease. Movement Disorders, 26(S3), 2011.
[38] R. Shang, W. Wang, R. Stolkin, and L. Jiao. Subspace learning-based graphregularized feature selection. Knowledge-Based Systems, 112:152–165, 2016.
[39] J. Struyf, B. Zenko, H. Blockeel, C. Vens, and S. Dzeroski. Clus: User’s manual,2010.
[40] X. Sun, Y. Liu, J. Li, J. Zhu, X. Liu, and H. Chen. Using cooperative game theoryto optimize the feature selection problem. Neurocomputing, 97:86–93, 2012.
[41] J. Timmer, C. Gantert, G. Deuschl, and J. Honerkamp. Characteristics of handtremor time series. Biological Cybernetics, 70(1):75–80, 1993.
[42] A. Valmarska, D. Miljkovic, S. Konitsiotis, D. Gatsios, N. Lavrac, and M. Robnik-Sikonja. Combining multitask learning and short time series analysis in Parkin-son’s disease patients stratification. In Proceedings of the Conference on Artificial
Intelligence in Medicine in Europe, pages 116–125. Springer, 2017.[43] A. Valmarska, D. Miljkovic, N. Lavrac, and M. Robnik-Sikonja. Analysis of med-
ications change in Parkinson’s disease progression data. Journal of Intelligent
Information Systems, 2018.[44] A. Valmarska, D. Miljkovic, M. Robnik-Sikonja, and N. Lavrac. Multi-view ap-
proach to Parkinson’s disease quality of life data analysis. In Proceedings of the
International Workshop on New Frontiers in Mining Complex Patterns, pages163–178. Springer, 2016.
[45] M. Visser, J. Marinus, A. M. Stiggelbout, and J. J. Van Hilten. Assessmentof autonomic dysfunction in Parkinson’s disease: The SCOPA-AUT. Movement
Disorders, 19(11):1306–1312, 2004.[46] R. A. Washburn, K. W. Smith, A. M. Jette, and C. A. Janney. The physical
activity scale for the elderly (PASE): development and evaluation. Journal of
Clinical Epidemiology, 46(2):153–162, 1993.[47] D. Weintraub, J. Koester, M. N. Potenza, A. D. Siderowf, M. Stacy, V. Voon,
J. Whetteckey, G. R. Wunderlich, and A. E. Lang. Impulse control disorders inParkinson disease: a cross-sectional study of 3090 patients. Archives of Neurology,67(5):589–595, 2010.
[48] D. Weintraub, E. Mamikonyan, K. Papay, J. A. Shea, S. X. Xie, and A. Siderowf.Questionnaire for impulsive-compulsive disorders in Parkinson’s disease–ratingscale. Movement Disorders, 27(2):242–247, 2012.
[49] F. Wilcoxon. Individual comparisons by ranking methods. Biometrics Bulletin,1(6):80–83, 1945.
[50] D. Zhang, D. Shen, and ADNI. Multi-modal multi-task learning for joint pre-diction of multiple regression and classification variables in Alzheimer’s disease.NeuroImage, 59(2):895–907, 2012.
[51] J. Zhou, J. Liu, V. A. Narayan, J. Ye, and ADNI. Modeling disease progressionvia multi-task learning. NeuroImage, 78:233–248, 2013.
6.2. Related Publication 123


125
Chapter 7
Conclusions
Our work provides novel approaches to descriptive data mining of Parkinson’s disease data.We address Parkinson’s disease progression and therapy modification. In this chapter, weprovide a summary of the hypotheses from Chapter 1 and the scientific contributionscovered in Chapters 4, 5 and 6. We conclude our work with ideas for future work.
7.1 Summary of Contributions
The thesis presents improvements in three research problems related to Parkinson’s diseaseprogression management.
1. Development of improved algorithms for classification rule learning and subgroup dis-covery. We examined the advantage of separating the refinement and selection phaseof the rule learning process. For that purpose, in Chapter 4 we introduced two newbeam search algorithms for rule learning, one for subgroup discovery (DoubleBeam-SD) and one for classification rule learning (DoubleBeam-RL). Both algorithms em-ploy a two-step phase separation: i) they use separate beams for the refinementand selection phase of rule learning and ii) they offer the possibility to use sepa-rate heuristics for rule refinement and rule selection. The deployment of separateheuristics exploiting specifics of the refinement and selection phase and the utiliza-tion of separate beams widens the search space and can construct rules which mightotherwise not have been found by the current state-of-the-art algorithms.
We compared the performance of the DoubleBeam-SD algorithm and the DoubleBeam-RL to their state-of-the-art counterparts. Experiments on 20 UCI data sets showedthat the performance of each of the considered algorithms depends on their param-eters. In the classification rule learning, the experimental results confirm previouslyshown benefits of using two separate heuristics for rule refinement and rule selec-tion—comparable or increased predictive power and rules with better descriptivepower. In subgroup discovery, DoubleBeam-SD algorithm variants outperform sev-eral state-of-the-art related algorithms.
2. Development of a methodology for Parkinson’s disease progression. We developeda methodology for the analysis of short time series Parkinson’s disease data. Themethodology is based on clustering of temporal symptoms data (Chapter 4). Weshow that patients are divided into groups which can be characterized with similarsymptoms, i.e. their overall status. The results show that these groups of patientscan be ordered (either totally or partially) in accordance with the severity of thesymptoms indicating the patients’ overall status. Since the status of patients is

126 Chapter 7. Conclusions
bound to change through time due to both the natural progression of the disease aswell as the antiparkinson therapies, the patients change cluster membership betweentime points, thus indicating the improvement or degradation of their status.
As a starting point for determining frequent patterns of disease progression, we usepatient’s assignment to clusters. Since the number of available time points for eachpatient is limited, we adapted the skip-grams approach to obtain more robust andmore reliable patterns of disease progression. Post analysis showed that patientsthat share similar patterns of disease progression also share etymological, motor, andnon-motor symptoms.
3. Development of a methodology for detection of medications changes. We presenteda methodology for detecting patterns of medications dosage changes based on thepatients’ status (Chapter 6). We introduced a predictive clustering trees (PCT)-based methodology for detection of medications changes. The generated modelsserve three purposes: i) determine which symptoms influence the clinicians to modifythe patients’ therapies, ii) determine patterns of antiparkinson medications dosagechanges in response to the patients’ symptoms, and iii) identify groups of patientsthat are similar in regards to both the symptoms they are experiencing as well asthe prescribed therapy modifications.
The experiments show that the multitask models exhibit comparable or better predic-tive performance in comparison to the respective single task models, with the addedadvantage of simultaneously assessing changes in patients’ therapies. The identifi-cation of patterns in therapy modifications and groups of similar patients is a stepcloser to a more personalized treatment of Parkinson’s disease patients. The method-ology can be adapted to other areas where the status conditioned on actual changesneed to be examined. The methodology can be used as a foundation for building adecision support system, where the expert knowledge and the knowledge obtainedfrom our methodology are merged. We also present the algorithm which detects thesymptoms with the strongest impact on significant changes in the patients’ overallstatus.
7.2 Summary of Hypotheses Confirmations
In Section 1.3 we hypothesized that the separation of the two phases of the rule learn-ing process will lead towards the classification rule learning algorithms and the subgroupdiscovery algorithms generating rules with the improved quality compared to the rules pro-duced by their state-of-the-art counterparts. We also hypothesized that the introductionof two beams and separate heuristics for each of the phases in the rule learning process willwiden the search space and enable the algorithms to encounter rules which would otherwisebe missed by standard algorithms. We address these issues in the publication included inSection 4.2. We present two new algorithms for subgroup discovery and rule learning, andwe empirically show that the two-fold separation of the rule learning phases can widenthe search place and thus enable the new algorithms to generate rules which would haveotherwise been missed. The hypothesis was partly confirmed since the rules generated byour algorithms are comparable and in some cases better than the rules generated by thestate-of-the-art algorithms used in the comparison.
Our second hypothesis was that Parkinson’s disease patients can be divided into groupsof patients with similar symptoms. These groups of patients can be partially orderedaccording to the severity of the symptoms describing each of the clusters. We addressthese issues in the publication included in Section 5.2. The hypothesis was confirmed. We

7.3. Strenghts and Limitations of the Developed Approaches 127
empirically show that the patients’ status will change through time and will be reflectedthrough patients’ membership in different groups at separate time points. We show thatthe clusters are at least partially ordered, and the transition between two clusters canindicate a transition in the overall status of the patient, thus signaling an improvement ora deterioration of the patients’ quality of life. Using skip-grams we were able to discoverrobust patterns of disease progression based on the patients’ change of cluster assignments.
Our third hypothesis was that by using multitask approach we will be able to determinesymptoms that trigger changes in medication dosages. The hypothesis was confirmed. Inthe published publication from Section 6.2 we empirically show that therapy dosage mod-ifications are the result of the patients’ status reflected by the clinical evaluation of theirsymptoms. We also include the consulting clinicians’ interpretation of modifications of pa-tients’ therapies as well as references to the medical literature for treatment of Parkinson’sdisease patients.
7.3 Strenghts and Limitations of the Developed Approaches
In this section, we analyze the strengths of the algorithms and methodologies presented inthe thesis, and critically evaluate their limitations.
7.3.1 Strenghts
The developed algorithms and methodologies are directed towards improved methods forthe analysis of Parkinson’s disease progression data, emphasizing the importance of usingdescriptive data mining methods for medical data analysis for a more personalized care ofpatients.
• The DoubleBeam-SD and DoubleBeam-RL algorithms exploit the use of separateheuristics for the refinement and selection phase in the rule learning process.
• The introduction of two beams and separate heuristics for each phase widens thesearch space thus allowing for the discovery of good rules which might have otherwisebeen overlooked.
• Side effects of the presented inverted heuristics are longer rules which may offer higherdescriptive power to the built models.
• DoubleBeam-RL and DoubleBeam-SD algorithms are publicly available on GitHuband in the ClowdFlows platform which allows for the repeatability of experiments.
• The proposed methodologies address an important issue of determining patternsof disease progression and medication therapy modifications in order to keep thepatients’ status stable.
• The methodology for determining disease progression patterns using skip-grams pre-serves the temporal nature of patients’ data which is not the case when using othermethods for pattern detection such as itemsets from association rule learning.
• The methodologies for the analysis of Parkinson’s disease progression and medicationsdosage changes preserve the individuality of each patient. Patterns are determinedbased on the changes in the overall status or in therapy modifications of each patientseparately.

128 Chapter 7. Conclusions
7.3.2 Limitations
Users of the algorithms and methodologies presented in the thesis should be aware of thefollowing issues:
• The DoubleBeam-SD and DoubleBeam-RL algorithms do not employ pruning tech-niques. The increased search space can lead to overfitting. Users can use a separatevalidation data set to select the optimal size of the rules.
• The DoubleBeam-SD and DoubleBeam-RL algorithms are unable to handle big data.
• The performance of the DoubleBeam-RL algorithm and the DoubleBeam-SD algo-rithm depends on their parameters. As a start, the users can use the default pa-rameters from Chapter 4. We suggest using cross-validation to determine optimalparameter values.
• Patterns of disease progression are based on clustering computed on the aggregatedata presenting the overall status of Parkinson’s disease patients. Even thoughParkinson’s disease clinicians often use this approach as a validator of the overallstatus of their patients (Goetz et al., 2008), the approach does not reveal the actualsymptoms affecting the change of patients’ status over time. A possible solution arebetter multi-view clustering approaches.
• Discovered patterns of medications change are overly general. We obtain them witha yes/no model indicating whether a change in the LEDD value of a particularantiparkinson medication has occurred or not. Further investigation of the modelsand instances covered by each pattern can reveal what are the actual medicationsdosage changes that have occurred. This is a time-consuming process which is notyet automated.
• The methodology is able to handle only preprocessed PPMI data and cannot handledata from wearable sensors of Parkinson’s disease patients. The performance of ourmethodologies depends on the quality of the used data, which can be subjectivelyinfluenced by both the clinicians and the patients when evaluating the symptoms.Even though the clinicians follow the guidelines for the evaluation of Parkinson’sdisease patients, the final mark is subject to their own personal decision.
• The results are evaluated by consulting clinicians and either confirmed or refusedwith references from the Parkinson’s disease medical literature. The disadvantageof this approach is that the clinicians may confirm or deny findings based on theirexperience and knowledge, and not based on objective criteria.
• The methods developed in Chapters 5 and 6 are not made publicly available due totheir close dependence and integration with the data sets used. The interested readeris welcome to contact the author.
7.4 Further Work
The three main research contributions described in Chapters 4, 5, and 6 show promisingresults and deserve further investigation.
The newly developed algorithms for rule learning and subgroup discovery (DoubleBeam-RL and DoubleBeam-SD) demand further research in terms of stopping criteria and rulepruning heuristics, e.g., a post-processing rule pruning similar to the one available in Rip-per. In the subgroup discovery setting, experimental results showed the advantage of using

7.4. Further Work 129
WRACC over the traditional rule learning heuristics in obtaining interesting subgroups.Given the interest of clinicians in detecting interesting subgroups of patients, the develop-ment of new heuristics specialized for the detection of interesting subgroups is a promisingresearch path which should be explored in the future. An interesting approach is to evalu-ate the performance of lift, the heuristic used in the Hedwig system (Vavpetič et al., 2013)for semantic subgroup discovery.
Despite being faster than the APRIORI-SD algorithm and the ability to handle mediumsize data sets, the DoubleBeam-SD algorithm is not able to handle large data sets dueto space and time complexity. Also, DoubleBeam-RL cannot handle very large data sets.This is one of the main disadvantages of rule learning algorithms using a covering approach.Lower memory consumption could be achieved with more efficient data structures, whilesignificant speedups could be gained with instance sampling and feature subset selection,as well as with parallelization of the algorithms. Due to the two beams, a degree ofparallelization could be achieved with DoubleBeam algorithms.
Results from the multi-view clustering setting for determining groups of similar patientsare underwhelming in terms of the quality of produced clusters. However, the results showthe importance of autonomic symptoms for the quality of life of Parkinson’s disease pa-tients. Other approaches to multi-view learning should be explored as this could revealinteresting knowledge about the importance of symptoms and possibly new patterns ofdisease progression. An interesting direction for further work is also to explore other clus-tering approaches, in particular, hierarchical clustering. Attributes from the MDS-UPDRSand MoCA questionnaires can be ordered hierarchically and exploiting this characteristicmay lead to better-defined groups of patients with similar symptoms. Transitions betweensuch clusters could reveal more specific and detailed patterns of disease progression.
The rules describing the obtained clusters are either very general (merged view setting)or very specific (multi-view setting) and may not be of sufficient assistance to the clinicians.This is due to the nature of the used data, i.e. a vector of attribute sums (merged view)or a high-dimensional vector of attributes with numeric values. The performance of themethodology for disease progression patterns should be tested with only a handful ofcarefully chosen attributes. Current symptoms’ evaluations are mainly numerical valueswhich can include evaluation bias either by the clinicians or by the patients. Quantizationof attribute evaluation by nominal values used in the clinicians’ everyday practice (i.e.normal, non-problematic, problematic) could decrease the variance in attribute evaluation,potentially improving the performance of the methodology. An expert-assisted decrease offeature space dimensionality may contribute to more meaningful and helpful descriptionsof groups of patients.
The discovered groups of patients with similar patterns of disease progression requirefurther study and offer an opportunity for improved disease management. Investigationof the symptoms, mostly epidemiological, that are significant for the patients from eachgroup can provide knowledge that can help the clinicians to prepare trajectories of diseaseprogression for their patients and decide what steps they can take to slow the disease pro-gression. An interesting route is to look also into the intersection of disease progressionand medication therapy modification patterns described in Chapter 6. Knowing the char-acteristics of groups of patients that react well to therapy modifications and have a stabledisease progression can rank therapies according to their success.
Descriptive models could be used to describe relevant subgroups of patients for whomcertain therapy change patterns can have a positive influence on the control of symptoms,or therapy patterns which are more likely to lead to undesired side effects.
In time series analysis there are opportunities for analyzing more than one previoustime point. Taking longer history into account might lead to the detection of groups of

130 Chapter 7. Conclusions
patients which do not react well to the changes in antiparkinson medications.In terms of therapy modifications, the issue of actual dosage changes in antiparkinson
medications (increase, decrease, or unchanged medication dosage) should be addressed.One step closer towards a more personalized treatment of Parkinson’s disease patients isto numerically predict dosage changes. Another interesting path for research is to seehow the actual therapy influences the status of the patients. Currently, this thesis onlyaddresses the Levodopa Equivalent Daily Dosage of antiparkinson medications and doesnot take into account any knowledge of how the frequency and prescribed dosage for oneintake influence the improvement of the patients’ status. We will also explore the impactof medication changes on the patients’ status and their future symptoms.
Finally, the proposed technologies have to be integrated into the medical practice.We see an opportunity for this through recent initiatives for personalized medicine andexploitation of electronic health records. The methodology can be used as a foundationfor building a decision support system, where the expert knowledge and the knowledgeobtained from our methodology are combined in order to generate better decision supportmodels.

131
Appendix A
A.1 Appendix to Chapter 5
Algorithm A.1 presents the pseudo code of the methodology for detection disease pro-gression patterns using skip-grams. The groundwork for this methodology is presented inChapter 5. The input to the methodology is the vector of assigned cluster labels (see Al-gorithm 1 in Chapter 5) and output is the vector of detected disease progression patterns.The output is generated over the cluster crossing sequences for all patients. More detailscan be found in Chapter 5.
Algorithm A.1: Pseudo code of the methodology for detection disease progres-sion patterns using skip-grams. This methodology is presented in Chapter 5.
Input: : c — assigned cluster labels;
p — number of patients;
Output: : diseaseProgressionPatterns — patterns of disease progression;
Parameters: : s — number of skips;
n — lenght of n-gram;
// Initialize the vector of cluster crossing sequences to an empty list.
clusterCrossingSequences []
// Fill the vector for cluster crossing sequences with sequences from all patients.
for patient in [1 : p] do
clusterCrossingSequences getClusterCrossingSequence(c, pi)end
// Get patterns of disease progression using skip-grams.
patterns skipGrams(clusterCrossingSequences, s, n)
diseaseProgressionPatterns sort.ByDecreasingFrequency(patterns)
A.2 Appendix to Chapter 6
Algorithm A.2 presents the pseudo code of the methodology for detection of medicationschange patterns as a result of the current status of the patient. This is a multitask learn-ing methodology that uses predictive clustering trees to detect dosage changes for allthree groups of antiparkinson medications: levodopa, dopamine agonsists, and MAO-Binhibitors. The methodology is presented in Chapter 6.
A very important step in the methodology is the preparation of data. After the initialtime-stamping of both the symptoms and medications data, the symptoms data is pre-processed, constructed, and evaluated according to the consulting clinicians’ instructions.A short description of these instructions can be found in Chapter 6. Medication data ispreprocessed in such a way that for each patient and each medication group, the algorithm

132 Appendix A.
records dosage changes which occurred between two consecutive visits. These changes areassociated with the current.
The symptoms are merged with the medication changes between the current and thenext visit. Medication change patterns are detected using multitask predictive clusteringtrees (PCT).
Algorithm A.2: Pseudo code of the methodology for detection of medicationschange patterns from Chapter 6.
Input: : S — PPMI symptoms data;
M — PPMI medications data;
Output: : PCT tree with medications change patterns;
// Time-stamp symptoms data. Associate the symptoms with the patient and the visit.
TS timeStampData(S)
// Time-stamp medications data. Associate the medications data with the patient and the
visit.
TM timeStampData(M)
// Pre-process symptoms data. Select, construct, and evaluate symptoms according to the
clinicians’ instructions.
PTS preProcessSymptomsData(TS)
// Pre-process medications data. For each instance (patient-visit pair) and each
medications group record whether a dosage change has occurred between two consecutive
time points (yes/no ).PTM timeStampData(TM)
// Merge pre-processed symptoms and medications data.
data mergeData(PTS, PTM)
// Detect medication change patterns using multitask predictive clustering trees (PCT).
Target variables are the three antiparkinsonian medications groups: levodopa, dopamine
agonists, and MAO-B inhibitors.
PCT trainPCT(data, targetVariables = {levodopa, dopag, MAOB})

133
References
Adeli, E., Wu, G., Saghafi, B., An, L., Shi, F., & Shen, D. (2017). Kernel-based jointfeature selection and max-margin classification for early diagnosis of Parkinson’sdisease. Scientific Reports, 7 (41069).
Adhikari, P. R., Vavpetič, A., Kralj, J., Lavrač, N., & Hollmén, J. (2014). Explainingmixture models through semantic pattern mining and banded matrix visualization.In Proceedings of the 17th International Conference on Discovery Science, DS 2014(pp. 1–12).
Agrawal, R., & Srikant, R. (1994). Fast algorithms for mining association rules in largedatabases. In Proceedings of the 20th International Conference on Very Large DataBases, VLDB’94 (pp. 487–499).
Alberio, T., Bucci, E., Natale, M., Bonino, D., Di Giovanni, M., Bottacchi, E., & Fasano,M. (2013). Parkinson’s disease plasma biomarkers: An automated literature analysisfollowed by experimental validation. Journal of Proteomics, 90, 107–114.
Aliferis, C., Statnikov, A., Tsamardinos, I., Mani, S., & Koutsoukos, X. (2010a). Localcausal and Markov blanket induction for causal discovery and feature selection forclassification part I: Algorithms and empirical evaluation. Journal of Machine Learn-ing Research, 11 (Jan), 171–234.
Aliferis, C., Statnikov, A., Tsamardinos, I., Mani, S., & Koutsoukos, X. (2010b). Localcausal and Markov blanket induction for causal discovery and feature selection forclassification part II: Analysis and extensions. Journal of Machine Learning Research,11 (Jan), 235–284.
Aliferis, C., Tsamardinos, I., & Statnikov, A. (2003). HITON: A novel Markov blanket algo-rithm for optimal variable selection. In Proceedings of the AMIA Annual Symposium(Vol. 2003, pp. 21–25). American Medical Informatics Association.
Appice, A. (2017). Towards mining the organizational structure of a dynamic event sce-nario. Journal of Intelligent Information Systems, 1–29.
Appice, A., & Malerba, D. (2016). A co-training strategy for multiple view clustering inprocess mining. IEEE Transactions Services Computing, 9 (6), 832–845.
Arauzo-Azofra, A., Aznarte, J. L., & Benítez, J. M. (2011). Empirical study of featureselection methods based on individual feature evaluation for classification problems.Expert Systems with Applications, 38 (7), 8170–8177.
Atzmüller, M. (2015). Subgroup discovery. Wiley Interdisciplinary Reviews: Data Miningand Knowledge Discovery, 5 (1), 35–49.
Atzmüller, M., & Puppe, F. (2006). SD-Map - A fast algorithm for exhaustive subgroupdiscovery. In Proceedings of Knowledge Discovery in Databases, PKDD 2006 (pp. 6–17).
Bazazeh, D., Shubair, R. M., & Malik, W. Q. (2016). Biomarker discovery and validation forParkinson’s disease: A machine learning approach. In In Proceedings of the IEEE In-ternational Conference on Bio-engineering for Smart Technologies, BioSMART 2016(pp. 1–6). IEEE.

134 References
Bega, D. (2017). Queen Square Brain Bank Diagnostic Criteria for Parkinson’s Disease.http://bestpractice.bmj.com/topics/en-gb/147. Accessed: 2017/12/18.
Bence, J. R. (1995). Analysis of short time series: Correcting for autocorrelation. Ecology,76 (2), 628–639.
Bezdek, J. C. (1981). Pattern Recognition With Fuzzy Objective Function Algorithms.Plenum Press, New York.
Bibal, A., & Frénay, B. (2016). Interpretability of machine learning models and represen-tations: An introduction. In Proceedings of the European Symposium on ArtificialNeural Networks, ESANN 2016 (pp. 77–82).
Blockeel, H. (1998). Top-down induction of first order logical decision trees (Doctoral dis-sertation, Department of Computer Science, K.U.Leuven, Leuven, Belgium).
Blockeel, H., & De Raedt, L. (1998). Top-down induction of first-order logical decisiontrees. Artificial Intelligence, 101 (1-2), 285–297.
Blockeel, H., Raedt, L. D., & Ramon, J. (1998). Top-down induction of clustering trees. InProceedings of the 15th International Conference on Machine Learning, ICML 1998(pp. 55–63).
Blum, A., & Mitchell, T. (1998). Combining labeled and unlabeled data with co-training.In Proceedings of the 11th Annual Conference on Computational Learning Theory,COLT 1998 (pp. 92–100). ACM.
Broder, A. Z., Glassman, S. C., Manasse, M. S., & Zweig, G. (1997). Syntactic clusteringof the web. Computer Networks and ISDN Systems, 29 (8-13), 1157–1166.
Cai, X., Nie, F., & Huang, H. (2013). Multi-view k-means clustering on big data. In Pro-ceedings of the 23rd International Joint Conference on Artificial Intelligence, IJCAI2013 (pp. 2598–2604).
Caruana, R. (1997). Multitask learning. Machine Learning, 28 (1), 41–75.Caruana, R., Baluja, S., & Mitchell, T. (1996). Using the future to “sort out” the present:
Rankprop and multitask learning for medical risk evaluation. In Advances in NeuralInformation Processing Systems (pp. 959–965).
Chaudhuri, K., Kakade, S. M., Livescu, K., & Sridharan, K. (2009). Multi-view clusteringvia canonical correlation analysis. In Proceedings of the 26th Annual InternationalConference on Machine Learning, ICML 2009 (pp. 129–136).
Choi, E., Schuetz, A., Stewart, W. F., & Sun, J. (2017). Using recurrent neural networkmodels for early detection of heart failure onset. Journal of the American MedicalInformatics Association, 24 (2), 361–370.
Clark, P., & Niblett, T. (1989). The CN2 induction algorithm. Machine Learning, 3, 261–283.
Cleuziou, G., Exbrayat, M., Martin, L., & Sublemontier, J. (2009). CoFKM: A centralizedmethod for multiple-view clustering. In Proceedings of the 9th IEEE InternationalConference on Data Mining, ICDM 2009 (pp. 752–757).
Cohen, W. W. (1995). Fast effective rule induction. In Proceedings of the 12th InternationalConference on Machine Learning (pp. 115–123).
Cronbach, L. J. (1951). Coefficient alpha and the internal structure of tests. Psychometrika,16 (3), 297–334.
Dalrymple-Alford, J., MacAskill, M., Nakas, C., Livingston, L., Graham, C., Crucian, G.,. . . Wells, S., et al. (2010). The MoCA: Well-suited screen for cognitive impairmentin Parkinson disease. Neurology, 75 (19), 1717–1725.
De Alba, E., Mendoza, M. et al. (2007). Bayesian forecasting methods for short time series.The International Journal of Applied Forecasting, 8, 41–44.

References 135
De Raedt, L., & Blockeel, H. (1997). Using logical decision trees for clustering. In Pro-ceedings of the IJCAI-97 Workshop on Frontiers of Inductive Logic Programming(pp. 133–140). Springer.
De Vine, L., Zuccon, G., Koopman, B., Sitbon, L., & Bruza, P. (2014). Medical seman-tic similarity with a neural language model. In Proceedings of the 23rd ACM In-ternational Conference on Conference on Information and Knowledge Management(pp. 1819–1822). ACM.
Ernst, J., & Bar-Joseph, Z. (2006). STEM: A tool for the analysis of short time series geneexpression data. BMC Bioinformatics, 7 (1), 191.
Ernst, J., Nau, G. J., & Bar-Joseph, Z. (2005). Clustering short time series gene expressiondata. Bioinformatics, 21 (suppl 1), i159–i168.
Eskidere, Ö., Ertaş, F., & Hanilçi, C. (2012). A comparison of regression methods for remotetracking of Parkinson’s disease progression. Expert Systems with Applications, 39 (5),5523–5528.
European Parkinson’s Disease Association. (2016). http://www.epda.eu.com/. Accessed:2016/07/01.
Ferreira, J., Katzenschlager, R., Bloem, B., Bonuccelli, U., Burn, D., Deuschl, G., . . .Kanovsky, P., et al. (2013). Summary of the recommendations of the EFNS/MDS-ES review on therapeutic management of Parkinson’s disease. European Journal ofNeurology, 20 (1), 5–15.
Fox, S. H., Katzenschlager, R., Lim, S.-Y., Ravina, B., Seppi, K., Coelho, M., . . . Sampaio,C. (2011). The movement disorder society evidence-based medicine review update:Treatments for the motor symptoms of Parkinson’s disease. Movement Disorders,26 (S3), S2–S41.
Fürnkranz, J., Gamberger, D., & Lavrač, N. (2012). Foundations of Rule Learning. Springer.Gamberger, D., & Lavrač, N. (2000). Confirmation rule sets. In Proceedings of the 4th
European Conference on Principles of Data Mining and Knowledge Discovery, PKDD2000 (pp. 34–43).
Gamberger, D., & Lavrač, N. (2002). Expert-guided subgroup discovery: Methodology andapplication. Journal of Artificial Intelligence Research, 17, 501–527.
Gatsios, D., Rigas, G., Miljkovic, D., Seljak, B. K., & Bohanec, M. (2016). m-health plat-form for Parkinson’s disease management. In Proceedings of 18th International Con-ference on Biomedicine and Health Informatics, CBHI 2016.
Gil, D., & Johnson, M. (2009). Diagnosing Parkinson by using artificial neural networksand support vector machines. Global Journal of Computer Science and Technology,9 (4), 63–71.
Goebel, G., Seppi, K., Donnemiller, E., Warwitz, B., Wenning, G. K., Virgolini, I., . . .Scherfler, C. (2011). A novel computer-assisted image analysis of [123 I] �-CITSPECT images improves the diagnostic accuracy of parkinsonian disorders. Euro-pean Journal of Nuclear Medicine and Molecular Imaging, 38 (4), 702–710.
Goetz, C., Luo, S., Wang, L., Tilley, B., LaPelle, N., & Stebbins, G. (2015). Handlingmissing values in the MDS-UPDRS. Movement Disorders, 30 (12), 1632–1638.
Goetz, C., Tilley, B., Shaftman, S., Stebbins, G., Fahn, S., Martinez-Martin, P., . . . Zweig,R. (2008). Movement disorder society-sponsored revision of the unified Parkinson’sdisease rating scale (MDS-UPDRS): Scale presentation and clinimetric testing results.Movement Disorders, 23 (15), 2129–2170. doi:10.1002/mds.22340
Greene, D., Doyle, D., & Cunningham, P. (2010). Tracking the evolution of communitiesin dynamic social networks. In Proceedings of Advances in Social Networks Analysisand Mining, ASONAM 2010 (pp. 176–183). IEEE.

136 References
Guthrie, D., Allison, B., Liu, W., Guthrie, L., & Wilks, Y. (2006). A closer look at skip-gram modelling. In Proceedings of the 5th International Conference on LanguageResources and Evaluation, LREC 2006 (pp. 1–4).
Guyon, I., & Elisseeff, A. (2003). An introduction to variable and feature selection. Journalof Machine Learning Research, 3 (Mar), 1157–1182.
Guyon, I., Gunn, S., Nikravesh, M., & Zadeh, L. A. (2008). Feature Extraction: Foundationsand Applications. Springer.
He, X., Kan, M.-Y., Xie, P., & Chen, X. (2014). Comment-based multi-view clustering ofWeb 2.0 items. In Proceedings of the 23rd International Conference on World WideWeb (pp. 771–782). ACM.
Hühn, J., & Hüllermeier, E. (2009). FURIA: An algorithm for unordered fuzzy rule induc-tion. Data Mining and Knowledge Discovery, 19 (3), 293–319.
Imhoff, M., Bauer, M., Gather, U., & Löhlein, D. (1998). Time Series Analysis in IntensiveCare Medicine. SFB 475: Komplexitätsreduktion in Multivariaten Datenstrukturen,Universität Dortmund.
Kavšek, B., Lavrač, N., & Jovanoski, V. (2003). APRIORI-SD: Adapting association rulelearning to subgroup discovery. In Proceedings of 5th International Symposium onIntelligent Data Analysis (pp. 230–241).
Kira, K., & Rendell, L. A. (1992). The feature selection problem: Traditional methods anda new algorithm. In Proceedings of AAAI 1992 (Vol. 2, pp. 129–134).
Klösgen, W. (1996). Explora: A multipattern and multistrategy discovery assistant. InProceedings of Advances in Knowledge Discovery and Data Mining (pp. 249–271).
Kocev, D., Vens, C., Struyf, J., & Džeroski, S. (2007). Ensembles of multi-objective decisiontrees. In Proceedings of the 18th European Conference on Machine Learning, ECML2007 (pp. 624–631). Springer.
Kononenko, I. (1994). Estimating attributes: Analysis and extensions of Relief. In Proceed-ings of the European Conference on Machine Learning (pp. 171–182). Springer.
Kralj Novak, P., Lavrač, N., Zupan, B., & Gamberger, D. (2005). Experimental comparisonof three subgroup discovery algorithms: Analysing brain ischemia data. In Proceedingsof the 8th International Multiconference Information Society (pp. 220–223).
Kranjc, J., Podpečan, V., & Lavrač, N. (2012). ClowdFlows: A cloud based scientific work-flow platform. In Proceedings of the European Conference on Machine Learning andKnowledge Discovery in Databases, ECML PKDD 2012 (pp. 816–819).
Kumar, A., & Daumé, H. (2011). A co-training approach for multi-view spectral clustering.In Proceedings of the 28th International Conference on Machine Learning, ICML 2011(pp. 393–400).
Lavrač, N., Kavšek, B., Flach, P. A., & Todorovski, L. (2004). Subgroup discovery withCN2-SD. Journal of Machine Learning Research, 5, 153–188.
Lewis, S., Foltynie, T., Blackwell, A., Robbins, T., Owen, A., & Barker, R. (2005). Hetero-geneity of Parkinson’s disease in the early clinical stages using a data driven approach.Journal of Neurology, Neurosurgery & Psychiatry, 76 (3), 343–348.
Lin, J., Keogh, E., Wei, L., & Lonardi, S. (2007). Experiencing SAX: A novel symbolicrepresentation of time series. Data Mining and Knowledge Discovery, 15 (2), 107–144.
Liu, L., Wang, Q., Adeli, E., Zhang, L., Zhang, H., & Shen, D. (2018). Exploring diagnosisand imaging biomarkers of Parkinson’s disease via iterative canonical correlationanalysis based feature selection. Computerized Medical Imaging and Graphics, 67,21–29.
Liu, Y., Li, W., Tan, C., Liu, X., Wang, X., Gui, Y., . . . Chen, L. (2014). Meta-analysiscomparing deep brain stimulation of the globus pallidus and subthalamic nucleus to

References 137
treat advanced Parkinson disease: A review. Journal of Neurosurgery, 121 (3), 709–718.
Ma, L.-Y., Chan, P., Gu, Z.-Q., Li, F.-F., & Feng, T. (2015). Heterogeneity among patientswith Parkinson’s disease: Cluster analysis and genetic association. Journal of theNeurological Sciences, 351 (1), 41–45.
Marek, K., Jennings, D., Lasch, S., Siderowf, A., Tanner, C., Simuni, T., . . . Chowdhury,S., et al. (2011). The Parkinson’s Progression Markers Initiative (PPMI). Progress inNeurobiology, 95 (4), 629–635.
Michalski, R. S. (1969). On the quasi-minimal solution of the general covering problem.In Proceedings of the 5th International Symposium on Information Processing, FCIP1969 (Vol. A3, pp. 125–128).
Mikolov, T., Chen, K., Corrado, G., & Dean, J. (2013). Efficient estimation of word repre-sentations in vector space. arXiv preprint arXiv:1301.3781.
Mileva-Boshkoska, B., Miljkovic, D., Valmarska, A., Gatsios, D., Rigas, G., Konitsiotis,S., . . . Bohanec, M. (2017). A state-transition decision support model for medica-tion change of Parkinson’s disease patients. In Proceedings of the 20th InternationalMulticonference Information Society, IS 2017 (pp. 63–66).
Miller, D. B., & O’Callaghan, J. P. (2015). Biomarkers of Parkinson’s disease: Present andfuture. Metabolism-Clinical and Experimental, 64 (3), S40–S46.
Minnaert, B., Martens, D., De Backer, M., & Baesens, B. (2015). To tune or not to tune:Rule evaluation for metaheuristic-based sequential covering algorithms. Data Miningand Knowledge Discovery, 29 (1), 237–272.
Mitchell, T. M. (1982). Generalization as search. Artificial Intelligence, 18 (2), 203–226.Murugesan, S., Bouchard, K., Chang, E., Dougherty, M., Hamann, B., & Weber, G. H.
(2017). Multi-scale visual analysis of time-varying electrocorticography data via clus-tering of brain regions. BMC Bioinformatics, 18 (6), 236.
Napierala, K., & Stefanowski, J. (2015). Addressing imbalanced data with argument basedrule learning. Expert Systems with Applications, 42 (24), 9468–9481.
National Collaborating Centre for Chronic Conditions. (2006). Parkinson’s disease: Na-tional Clinical Guideline for Diagnosis and Management in Primary and SecondaryCare. London: Royal College of Physicians.
Olanow, W., Watts, R., & Koller, W. (2001). An algorithm (decision tree) for the man-agement of Parkinson’s disease (2001): Treatment guidelines. Neurology, 56 (suppl 5),S1–S88.
Olesen, J., Gustavsson, A., Svensson, M., Wittchen, H.-U., & Jönsson, B. (2012). Theeconomic cost of brain disorders in Europe. European Journal of Neurology, 19 (1),155–162.
Parpinelli, R. S., Lopes, H. S., & Freitas, A. A. (2002). Data mining with an ant colonyoptimization algorithm. IEEE Transactions on Evolutionary Computation, 6 (4), 321–332.
Patel, S., Lorincz, K., Hughes, R., Huggins, N., Growdon, J., Standaert, D., . . . Bonato,P. (2009). Monitoring motor fluctuations in patients with Parkinson’s disease usingwearable sensors. IEEE Transactions on Information Technology in Biomedicine,13 (6), 864–873.
PD_manager: m-Health platform for Parkinson’s disease management. (2015). EU Frame-work Programme for Research and Innovation Horizon 2020, Grant number 643706,2015–2017. http://www.parkinson-manager.eu/.
Piccart, B., Struyf, J., & Blockeel, H. (2008). Empirical asymmetric selective transferin multi-objective decision trees. In Proceedings of the International Conference onDiscovery Science, DS 2008 (pp. 64–75). Springer.

138 References
Pičulin, M., & Robnik-Šikonja, M. (2014). Handling numeric attributes with ant colonybased classifier for medical decision making. Expert Systems with Applications, 41 (16),7524–7535.
Quinlan, J. R. (1983). Learning efficient classification procedures and their application tochess end games. Machine Learning. An Artificial Inteligence Approach, 1, 463–482.
Quinlan, J. R., & Cameron-Jones, R. M. (1993). FOIL: A midterm report. In Proceedings ofMachine Learning: European Conference on Machine Learning, ECML 1993 (pp. 3–20).
Ramani, R. G., & Sivagami, G. (2011). Parkinson disease classification using data miningalgorithms. International Journal of Computer Applications, 32 (9), 17–22.
Rana, B., Juneja, A., Saxena, M., Gudwani, S., Kumaran, S. S., Behari, M., & Agrawal,R. (2015). Graph-theory-based spectral feature selection for computer aided diagno-sis of Parkinson’s disease using T1-weighted MRI. International Journal of ImagingSystems and Technology, 25 (3), 245–255.
Reijnders, J., Ehrt, U., Lousberg, R., Aarsland, D., & Leentjens, A. (2009). The associationbetween motor subtypes and psychopathology in Parkinson’s disease. Parkinsonism& Related Disorders, 15 (5), 379–382.
Reyes, O., Morell, C., & Ventura, S. (2015). Scalable extensions of the ReliefF algorithm forweighting and selecting features on the multi-label learning context. Neurocomputing,161, 168–182.
Riviere, C. N., Reich, S. G., & Thakor, N. V. (1997). Adaptive Fourier modeling forquantification of tremor. Journal of Neuroscience Methods, 74 (1), 77–87.
Robnik-Šikonja, M., & Kononenko, I. (2003). Theoretical and empirical analysis of ReliefFand RReliefF. Machine Learning, 53 (1-2), 23–69.
Ruz, G. A. (2016). Improving the performance of inductive learning classifiers through thepresentation order of the training patterns. Expert Systems with Applications, 58,1–9.
Schieb, L. J., Mobley, L. R., George, M., & Casper, M. (2013). Tracking stroke hospi-talization clusters over time and associations with county-level socioeconomic andhealthcare characteristics. Stroke, 44 (1), 146–152.
Seppi, K., Weintraub, D., Coelho, M., Perez-Lloret, S., Fox, S. H., Katzenschlager, R.[Regina], . . . Goetz, C., et al. (2011). The movement disorder society evidence-basedmedicine review update: Treatments for the non-motor symptoms of Parkinson’sdisease. Movement Disorders, 26 (S3).
Shang, R., Wang, W., Stolkin, R., & Jiao, L. (2016). Subspace learning-based graph regu-larized feature selection. Knowledge-Based Systems, 112, 152–165.
Singh, G., & Samavedham, L. (2015). Unsupervised learning based feature extraction fordifferential diagnosis of neurodegenerative diseases: A case study on early-stage di-agnosis of Parkinson disease. Journal of Neuroscience Methods, 256, 30–40.
Stecher, J., Janssen, F., & Fürnkranz, J. (2014). Separating rule refinement and rule selec-tion heuristics in inductive rule learning. In Proceedings of the European Conferenceon Machine Learning and Knowledge Discovery in Databases, ECML PKDD 2014(pp. 114–129).
Sun, X., Liu, Y., Li, J., Zhu, J., Liu, X., & Chen, H. (2012). Using cooperative game theoryto optimize the feature selection problem. Neurocomputing, 97, 86–93.
Szymański, A., Kubis, A., & Przybyszewski, A. W. (2015). Data mining and neural networksimulations can help to improve deep brain stimulation effects in Parkinson’s disease.Computer Science, 16 (2), 199.
Timmer, J., Gantert, C., Deuschl, G., & Honerkamp, J. (1993). Characteristics of handtremor time series. Biological Cybernetics, 70 (1), 75–80.

References 139
Tsanas, A. (2012). Accurate telemonitoring of Parkinson’s disease symptom severity usingnonlinear speech signal processing and statistical machine learning (Doctoral disser-tation, Oxford University, UK).
Tsanas, A., Little, M. A., McSharry, P. E., & Ramig, L. O. (2010). Enhanced classicaldysphonia measures and sparse regression for telemonitoring of Parkinson’s diseaseprogression. In In Proceedings of the IEEE International Conference on AcousticsSpeech and Signal Processing, ICASSP 2010 (pp. 594–597). IEEE.
Tsanas, A., Little, M. A., McSharry, P. E., Spielman, J., & Ramig, L. O. (2012). Novelspeech signal processing algorithms for high-accuracy classification of Parkinson’sdisease. IEEE Transactions on Biomedical Engineering, 59 (5), 1264–1271.
Tsanas, A., Little, M., McSharry, P., & Ramig, L. (2010). Accurate telemonitoring ofParkinson’s disease progression by noninvasive speech tests. IEEE Transactions onBiomedical Engineering, 57 (4), 884–893.
Tzortzis, G., & Likas, A. (2009). Convex mixture models for multi-view clustering. InProceedings of the 19th International Conference Artificial Neural Networks, ICANN2009 (pp. 205–214).
Vavpetič, A., Kralj Novak, P., Grčar, M., Mozetič, I., & Lavrač, N. (2013). Semantic datamining of financial news articles. In Proceedings of the 16th International Conferenceon Discovery Science, DS 2013 (pp. 294–307).
Visser, M., Marinus, J., Stiggelbout, A. M., & Van Hilten, J. J. (2004). Assessment of au-tonomic dysfunction in Parkinson’s disease: The SCOPA-AUT. Movement Disorders,19 (11), 1306–1312.
Washburn, R. A., Smith, K. W., Jette, A. M., & Janney, C. A. (1993). The physicalactivity scale for the elderly (PASE): Development and evaluation. Journal of ClinicalEpidemiology, 46 (2), 153–162.
Weintraub, D., Mamikonyan, E., Papay, K., Shea, J. A., Xie, S. X., & Siderowf, A. (2012).Questionnaire for impulsive-compulsive disorders in Parkinson’s disease–rating scale.Movement Disorders, 27 (2), 242–247.
White, M., Zhang, X., Schuurmans, D., & Yu, Y. (2012). Convex multi-view subspace learn-ing. In Proceedings of Advances in Neural Information Processing Systems (pp. 1673–1681).
Wrobel, S. (1997). An algorithm for multi-relational discovery of subgroups. In Proceed-ings of the 1st European Symposium on Principles of Data Mining and KnowledgeDiscovery, PKDD 1997 (pp. 78–87).
Xu, C., Tao, D., & Xu, C. (2013). A survey on multi-view learning. Neural Computing andApplications, 23 (7–8), 2031–2038.
Zeng, Q., Patel, J. M., & Page, D. (2014). QuickFOIL: Scalable inductive logic program-ming. VLDB Endowment, 8 (3), 197–208.
Zhang, D., Shen, D., & ADNI. (2012). Multi-modal multi-task learning for joint predictionof multiple regression and classification variables in Alzheimer’s disease. NeuroImage,59 (2), 895–907.
Zhao, J., Papapetrou, P., Asker, L., & Boström, H. (2017). Learning from heterogeneoustemporal data in electronic health records. Journal of Biomedical Informatics, 65,105–119.
Zhou, J., Liu, J., Narayan, V. A., Ye, J., & ADNI. (2013). Modeling disease progressionvia multi-task learning. NeuroImage, 78, 233–248.


141
Bibliography
Publications Related to the Thesis
Journal Articles
Valmarska, A., Lavrač, N., Fürnkranz, J., & Robnik-Šikonja, M. (2017). Refinement andselection heuristics in subgroup discovery and classification rule learning. Expert Sys-tems with Applications, 81, 147–162. doi:10.1016/j.eswa.2017.03.041
Valmarska, A., Miljkovic, D., Lavrač, N., & Robnik-Šikonja, M. (2018). Analysis of medi-cations change in Parkinson’s disease progression data. Journal of Intelligent Infor-mation Systems. doi:10.1007/s10844-018-0502-y
Valmarska, A., Miljkovic, D., Konitsiotis, S., Gatsios, D., Lavrač, N., & Robnik-Šikonja, M.(2018). Symptoms and medications change patterns for Parkinson’s disease patientsstratification. Artificial Intelligence in Medicine (accepted).
Conference Papers
Valmarska, A., Robnik-Šikonja, M., & Lavrač, N. (2015). Inverted heuristics in subgroupdiscovery. In Proceedings of the 18th International Multiconference Information So-ciety (Vol. 178, pp. 41–44).
Valmarska, A., Miljkovic, D., Robnik-Šikonja, M., & Lavrač, N. (2016). Multi-view ap-proach to Parkinson’s disease quality of life data analysis. In Proceedings of the In-ternational Workshop on New Frontiers in Mining Complex Patterns (pp. 163–178).Springer.
Valmarska, A., Miljkovic, D., Konitsiotis, S., Gatsios, D., Lavrač, N., & Robnik-Šikonja,M. (2017). Combining multitask learning and short time series analysis in Parkin-son’s disease patients stratification. In Proceedings of the Conference on ArtificialIntelligence in Medicine in Europe (pp. 116–125). Springer.


143
Biography
Anita Valmarska was born on June 12, 1987 in Berovo, Macedonia. She finished primaryschool in Berovo in 2002 and secondary education in Maribor in 2006. In 2006, she startedher studies at the University of Ljubljana, Faculty of Computer and Information Science.She defended her BSc thesis entitled “Analysis of Citation Networks” under the supervisionof Prof. Dr. Janez Demšar in 2014. During her secondary and university educationshe received scholarships for talented students awarded by the Macedonian and SlovenianMinistry of Education.
In 2014, she was employed as a junior researcher at the Jožef Stefan Institute, Slove-nia, under the supervision of Prof. Dr. Nada Lavrač at the Department of KnowledgeTechnologies. In the same year, she started her doctoral studies in the PhD programme“Information and Communication Technologies” at the Jožef Stefan International Postgrad-uate School under the supervision of Prof. Dr. Marko Robnik-Šikonja and co-supervisionof Prof. Dr. Nada Lavrač.
Her research is in the field of Parkinson’s disease patients data analysis with datamining methods, and development of new methods for descriptive learning (algorithms forclassification rule learning and subgroup discovery). In the field of Parkinson’s diseasepatients data analysis, she works on new methods for disease progression analysis. Shecollaborated in the EU-funded project PD_manager, where she developed new analyticalapproaches for Parkinson’s disease patient quality of life management. She attended severalcourses and summer/winter schools including: BigData 2015, the 2nd HBP EducationWorkshop on Future Medicine, and DeepLearn 2017. She presented her work in publishedjournal papers and at international conferences and workshops.