Embed Size (px)
Citation preview

DEPARTMENT OF WATER AFFAIRS AND FORESTRY
WESTERN CAPE WATER SUPPLY SYSTEM RECONCILIATION STRATEGY STUDY
Report No. 5 of 7
Treatment of Effluent to Potable Standards for Supply from the Faure Water Treatment Plant
FINAL
June 2007
SUBMITTED BY
Ninham Shand (Pty) Ltd UWP Consulting (Pty) Ltd P O Box 1347 P O Box 9311 Cape Town Centurion 8000 0046 Tel : 021 - 481 2400 Tel : 012 - 664 9230 Fax : 021 - 424 5588 Fax : 012 - 664 7870 e-mail : [email protected]

P WMA 19/000/00/0507
WESTERN CAPE RECONCILIATION STRATEGY STUDY
VOLUME NUMBER REPORT TITLE
1 Reconciliation Strategy
2 Determination of Future Water Requirements
3 Scenario Planning for Reconciliation of Water Supply and Requirement
4 Overview of Water Conservation and Demand Management in the City of Cape Town
5 Treatment of Effluent to Potable Standards for Supply from the Faure Water Treatment Plant
6 Overview of Water Re-use potential from Wastewater Treatment Plants
7 Summary Report

ACKNOWLEDGEMENTS
The assistance of the following persons in conducting this investigation is hereby acknowledged:
Mr J Vos Grahamtek Systems (Pty) Ltd
Mr M Killick ex-City of Cape Town
Mr K Fawcett City of Cape Town
Mr D Peart City of Cape Town
Grahamtek Systems undertook the design, supply, commissioning and operation of the Singapore Water
Reclamation Plant referred to in this report and are currently in the process of designing and
implementing a 15 Ml/day water reclamation plant for direct re-use in a neighbouring country.

Treatment of Effluent to Potable Standards for Supply from the Faure Water Treatment Plant i
WCWSS Reconciliation Strategy Study June 2007
THE WESTERN CAPE WATER SUPPLY SYSTEM RECONCILIATION STRATEGY
EXECUTIVE SUMMARY
Background On account of the recent water shortages (droughts) experienced in the Western Cape, the environmental sensitivity of the river systems in the region, the limited yields from existing resources and the ever increasing costs of developing additional surface water augmentation schemes, both the Department of Water Affairs (DWAF) and the City of Cape Town (CCT) are considering developing alternative water sources, in their quest to reconcile future water requirements and supplies for the Western Cape Water Supply System (WCWSS). The following "non-conventional" water supply augmentation options have been identified as benchmarks against which future "conventional" surface water augmentation options should be evaluated:
Sea water desalination; and Reclamation of treated effluent to potable water standards.
Previous/ongoing investigations The CCT has already committed itself to the development of a pilot desalination plant for the treatment of seawater to potable standards, with a view to assessing first hand the costs and practicalities of operating such a desalination plant. Investigations in this regard are currently ongoing.
During the 1980s the CCT, in conjunction with the Water Research Commission, operated a pilot plant to reclaim treated effluent to potable standards by means of physical-chemical processes, whilst in 2000 it undertook a reconnaissance level study of a large scale scheme delivering potable water from treated effluent. The scheme entailed the pumping of treated effluent from the four Falsebay Waste Water Treatment Works (Cape Flats, Mitchell’s Plain, Zandvliet and Macassar) to the Faure Water Treatment Plant (FWTP) for further treatment by physical-chemical processes, before the reclaimed water would be introduced into the water supply system for distribution.
The proposed yield from this scheme was to be limited to 125 Ml/day, due to the following constraints:
Blending ratios: The Department of Health (DoH) requires that treated effluent, further treated by
means of physical-chemical processes for potable water use, be blended with potable water at a ratio of 1:4 before it can be made available for human consumption.
Treatment capacity: The treatment capacity of the Faure Water Treatment Plant (FWTP) was assumed to be 1 000 Ml/day (being the capacity after the planned future upgrade), with a peak factor of 1.5.
Although not considered at that time, the following additional constraints would limit the optimal utilisation of treated effluent via the scheme described above:
Winter demands: The winter domestic water demands in the Western Cape are significantly lower than the summer demands. The average winter demand from the FWTP supply area is currently in the order of 175 Ml/day.
Growth areas: The current high growth areas in the Western Cape are located in the northern suburbs of Cape Town, which are largely supplied from the Glengarry Reservoir. As this

Treatment of Effluent to Potable Standards for Supply from the Faure Water Treatment Plant ii
WCWSS Reconciliation Strategy Study June 2007
reservoir is not serviced from the FWTP, the upgrading of these works from the present 500 Ml/day to the originally planned 1 000 Ml/day, has been placed on hold.
System optimisation: The WCWSS is operated in a manner aiming to maximize the combined yield from all the dams supplying the system. In particular, this involves maximizing the winter run-off from the Palmiet sub-system (limited storage), which is also treated at the FWTP. The yield with 98% assurance of supply from this sub-system is 22 Mm³/a (average of 60 Ml/day), but the Firlands Pump Station (which abstracts water from the Palmiet sub-system via transfers to Steenbras Upper Dam) has been operated at an average of 175 Ml/day over the past few years, with winter monthly peaks reaching 270 Ml/day. Furthermore, winter run-off (in the order of 100 Ml/day) from the Kleinplaas Dam, which can be treated at either the FTWP or the Blackheath WTP, also needs to be harnessed for system optimisation.
The above-mentioned constraints would limit the maximum yield from the proposed scheme to between 40 Ml/day and 50 Ml/day. Purpose of this investigation The advancement of membrane technologies (micro-filtration and reverse osmosis) in recent years has provided opportunity to consider the application of these technologies for the reclamation of treated effluent to potable water standards. In particular, the application of these technologies for the augmentation scheme proposed during the earlier investigations would eliminate the need to blend "reclaimed" water with "conventional" potable water, thereby increasing the yield possible from the scheme. The purposes of this conceptual level investigation are therefore to:
Assess the suitability of using membrane technology for the reclamation of treated effluent for potable use in general, and in particular, the implications of its use in the augmentation scheme proposed during earlier investigations; and
Review the operating and infrastructure constraints inhibiting the optimal use of treated effluent via the scheme previously proposed, as well as the particular implications of transferring reclaimed water from the Faure Water Treatment Plant to the Blackheath Water Treatment Plant/Reservoirs.
Results of this investigation
The processes for the treatment of sea water and treated effluent via ultra filtration and reverse osmosis to potable standards are similar. However, the capital, operating and maintenance costs of the reclamation plants are directly related to the TDS content of the influent, and therefore these costs are significantly lower for the reclamation of treated effluent as opposed to sea water;
The indirect re-use of reclaimed treated effluent for potable use (i.e. used as a raw water source), is used fairly extensively elsewhere in the world. In most instances, the treated effluent is reclaimed by membrane technology systems before being introduced into conventional raw water resources;
The direct re-use of reclaimed treated effluent for potable use, irrespective of the reclamation process involved, is not practiced extensively at present, and appears to be limited to a few African countries only. In most instances, the reclaimed water is blended with "conventional" potable water supplies before being made available for consumption;
A pilot study conducted in Singapore indicates that the use of membrane technology in the reclamation of treated effluent for potable use, can provide a reliable and robust system that can cost-effectively produce potable water that is safe for human consumption, either via in-direct or direct input to the water distribution system; and
Treatment of Effluent to Potable Standards for Supply from the Faure Water Treatment Plant iii
WCWSS Reconciliation Strategy Study June 2007
By adopting variations in the configuration of the scheme proposed during the earlier studies, the application of membrane technology can deliver a viable and cost effective augmentation scheme that includes brine handling.
Conclusion Treated effluent is a valuable water resource which, with using membrane technology, can reliably and cost-effectively be utilised as a source for bulk potable water supply. Without providing dedicated bulk storage dams, or re-introducing the treated effluent or reclaimed water into existing storage facilities, the ability to maximise the use of treated effluent via the scheme proposed, is significantly reduced, due to system operation considerations during the winter months. By adopting a particular variation to the scheme proposed during earlier studies, it would be possible to implement a scheme within a relatively short time period, that could deliver some 22 Mm³/a of reclaimed water into the system via the Faure Reservoirs, at a blending ratio of at least 1:2.5 (reclaimed to conventional). These blending ratios could be increased further, if the reclaimed water is also delivered into the system from the Blackheath and Glengarry Reservoirs. Recommendations Based on the findings of this investigation, the following recommendations are made:
The previous study regarding the Strategic Evaluation of Bulk Wastewater should be reviewed and a Policy and Implementation Strategy developed, similar to the Water Conservation and Demand Management Strategy recently completed by the CCT, and
More detailed investigations should be conducted to refine the results of this investigation as well as to optimise the proposed scheme layouts and component sizes, including investigating storage opportunities.
Treatment of Effluent to Potable Standards for Supply from the Faure Water Treatment Plant i
WCWSS Reconciliation Strategy Study June 2007
DEPARTMENT OF WATER AFFAIRS AND FORESTRY Directorate National Water Resource Planning
WWEESSTTEERRNN CCAAPPEE WWAATTEERR SSUUPPPPLLYY SSYYSSTTEEMM RREECCOONNCCIILLIIAATTIIOONN SSTTRRAATTEEGGYY Treatment of Effluent to Potable Standards for Supply
from the Faure Water Treatment Plant TTAABBLLEE OOFF CCOONNTTEENNTTSS
Page No.
1. INTRODUCTION..............................................................................................................................1 1.1 General Background Information .....................................................................................................1 1.2 Scope for Use of Treated Effluent ....................................................................................................2 1.3 Previous "Potable Use" Investigations .............................................................................................2 1.4 Unsolicited Bid..................................................................................................................................3 1.5 Summary ..........................................................................................................................................3 2. PURPOSE OF THIS INVESTIGATION............................................................................................5 3. INVESTIGATIONS ...........................................................................................................................6 4. USE OF TREATED EFFLUENT FOR POTABLE SUPPLIES ELSEWHERE IN THE WORLD.....7 4.1 Introduction .......................................................................................................................................7 4.2 The Singapore Pilot Study................................................................................................................7 5. DESCRIPTION OF THE PROPOSED SCHEME.............................................................................9 6. SIZING/YIELD OF THE SCHEME .................................................................................................10 6.1 Introduction .....................................................................................................................................10 6.2 Scheme Yield .................................................................................................................................10
6.2.1 Source Yield ...................................................................................................................10 6.2.2 Demand on Recipient Zone ...........................................................................................11 6.2.3 System Operating Considerations .................................................................................11 6.2.4 Final Scheme Yields ......................................................................................................12
6.3 Treated Effluent Conveyance Systems ..........................................................................................14 6.4 Reclamation Plant ..........................................................................................................................14 6.5 Brine Outfall....................................................................................................................................14 6.6 Potable Water Storage ...................................................................................................................14 6.7 Potable Water Conveyance System...............................................................................................15 6.8 Faure/Blackheath Link Pipeline......................................................................................................15 7. COSTING OF INFRASTRUCTURE...............................................................................................16 7.1 Capital Costs ..................................................................................................................................16 7.2 Operating Costs..............................................................................................................................16 8. ECONOMIC EVALUATION ...........................................................................................................17 9. ENVIRONMENTAL IMPACT .........................................................................................................18 10. SOCIO-ECONOMIC IMPACT........................................................................................................19

Treatment of Effluent to Potable Standards for Supply from the Faure Water Treatment Plant ii
WCWSS Reconciliation Strategy Study June 2007
11. STRATEGIC EVALUATION ..........................................................................................................20 12. CONCLUSIONS.............................................................................................................................21 13. RECOMMENDATIONS..................................................................................................................22 13.1 General ...........................................................................................................................................22 13.2 Scheme Specific.............................................................................................................................22 TABLES Table 6.1 Re-use at Existing WWTW ...................................................................................................11 Table 6.2 Water Demands at Faure and Blackheath WTPs ................................................................11 Table 6.3 Proposed P peline and Pump Station Sizes.........................................................................14 Table 8.1 Costs of Proposed Options...................................................................................................17 APPENDICES APPENDIX A: Singapore Water Reclamation Study: Expert Panel Review and Findings APPENDIX B: Layout Plan and Schematics of the Proposed Scheme APPENDIX C: Costing Tables for the Proposed Scheme APPENDIX D: Theoretical Power output of the Turbine at the Faure Water Treatment Works I:\HYDRO\400818 WC Reconciliation\FINAL REPORTS\Effluent reuse Faure case study\Treated Effluent.doc

Treatment of Effluent to Potable Standards for Supply from the Faure Water Treatment Plant i
WCWSS Reconciliation Strategy Study June 2007
DEFINITIONS The following definitions are applicable for this investigation: Treated effluent : The effluent from a waste water treatment works, which has been treated to at
least General Standard Limits, and is therefore suitable for discharge to a water course.
Treated effluent is therefore considered a potential water resource, which can be
used to augment existing water supplies. Reclaimed Water : "Treated Effluent" which has been further treated by means of ultra-filtration,
reverse osmosis, sterilisation and stabilisation and is suitable for potable use. Influent : The untreated waste waters, primarily of domestic origin, which enters a waste
water treatment works. Brine : The reject water from the ultra-filtration and reverse osmosis treatment
processes.
Treatment of Effluent to Potable Standards for Supply from the Faure Water Treatment Plant ii
WCWSS Reconciliation Strategy Study June 2007
ABBREVIATIONS AND ACRONYMS
CCT City of Cape Town DWAF Department of Water Affairs and Forestry FWTP Faure Water Treatment Plant TDS Total Dissolved Solids WCWSS Western Cape Water Supply System WTP Water Treatment Plant WWTW Waste Water Treatment Works

Treatment of Effluent to Potable Standards for Supply from the Faure Water Treatment Plant 1
WCWSS Reconciliation Strategy Study June 2007
1. INTRODUCTION 1.1 General Background Information On account of the recent water shortages (droughts) experienced in the Western Cape, the environmental sensitivity of the region, the limited yields of existing resources and the ever increasing costs of developing additional surface water augmentation schemes, both the Department of Water Affairs (DWAF) and the City of Cape Town (CCT) are considering developing alternative water sources, in their quest to reconcile future water requirements and supplies for the Western Cape Water Supply System (WCWSS). It is for that reason that in 2005 the DWAF commissioned the “Western Cape Water Supply System Reconciliation Strategy Study”, in order to develop a strategy to ensure the reconciliation of future water requirements with supply for the WCWSS. Amongst the many “conventional” water resource development options that will be considered as part of the Strategy, the following “non-conventional” water supply augmentation options have been identified, which could be used as benchmarks for evaluating future augmentation options:
Sea water desalination; and Reclamation of treated effluent to potable water standards.
The scope of this supporting report, which forms part of the aforementioned Study, is to re-evaluate a previously identified augmentation option, involving the reclamation of treated effluent for potable water supply, taking into consideration the recent advancements in the use of membrane technologies in the treatment of “raw waters” and the identified system constraints. Desalination: The CCT has already committed itself to developing a pilot desalination plant in order to assess first hand the costs and practicalities of operating such a desalination plant. Investigations in this regard have been commissioned by the CCT. Re-Use of treated effluent: In 2000, the CCT undertook a reconnaissance level investigation of the re-use of treated effluent for various uses, including: • Non-potable use:
Providing treated effluent to commercial farmers in exchange for their raw water allocations;
Local irrigation (e.g. sports fields and public open spaces); Industrial use (process water);and Dedicated supplies for toilet flushing and gardening purposes.
• Potable use:
Potable use at large scale, using additional physical-chemical treatment processes. The nature of the demand pattern in the region (low water demands in winter and high demands in summer), the relatively low potential demand for treated effluent by identified “non-potable” consumers
Treatment of Effluent to Potable Standards for Supply from the Faure Water Treatment Plant 2
WCWSS Reconciliation Strategy Study June 2007
and the high volumes of treated effluent available for utilisation, indicate that treated effluent should be re-used for potable water supplies, in order to fully utilise this resource. Furthermore, unless treated effluent can be reclaimed for direct potable use, it would be necessary to provide dedicated bulk storage dams for the treated effluent, to return it to existing storage dams or to return it to rivers and/or aquifers (with or without further treatment) before it can be used as a raw water source for potable water supply. During the 1980s the CCT, in conjunction with the Water Research Commission, operated a pilot reclamation plant from the Cape Flats Wastewater Treatment Works over a four year period. Treated effluent was subjected to further treatment using a physical-chemical process, in order to achieve potable water standards. The aim of this pilot study was to establish the costs and practicalities of reclaiming treated effluent for direct potable water supply. In view of the technological development of membrane technologies (micro-filtration and reverse osmosis) in recent years, these technologies should also be considered for reclaiming treated effluent to potable water standards. The processes for the treatment of sea water and treated effluent are similar. However, as the capital, operation and maintenance costs of reclamation plants are directly related to the TDS content of the influent, these costs are significantly lower for the reclamation of treated effluent than for sea water. Furthermore, the use of treated effluent would have a positive environmental impact on the river and vlei systems in the region (return of seasonal flows). These facts indicate that the use of micro filtration and reverse osmosis for the reclamation of treated effluent for potable water supply could be a viable intervention as outlined below. 1.2 Scope for Use of Treated Effluent CCT currently operates some sixteen (16) waste water treatment works (WWTW) distributed throughout the municipal area, with a combined treatment capacity of around 663 Ml/day. At present, summer return flows are in the order of 473 Ml/day, with winter flows generally being about 10% to 15% higher than the summer flows (attributed to storm water ingress). CCT also operates four (4) sewer outfalls, which have a combined capacity of 44 Ml/day. Studies conducted to date indicate that the combined demand potential of all the "non-potable use" options would utilise about 45% of the total treated effluent available in summer and only about 15% of the effluent available in winter. These seasonal differences arise because most of the “non-potable use” options entail the irrigation of sports fields, gardens, public open spaces and agricultural crops, which is not required during the winter months. Therefore, in order to fully harness the potential of treated effluent as a water resource for the WCWSS, one needs to consider using it as a raw water source for potable water supply. 1.3 Previous "Potable Use" Investigations The CCT has undertaken the following studies, which included investigations into the reclamation of treated effluent for potable water supply:
"Strategic Evaluation of Bulk Waste Water"; 1999; and "Integrated Water Resource Planning Study"; 2001.
In these studies, the specific option for potable use investigated would entail the pumping of treated effluent from the four Falsebay Waste Water Treatment Works (Cape Flats, Mitchell’s Plain, Zandvliet and

Treatment of Effluent to Potable Standards for Supply from the Faure Water Treatment Plant 3
WCWSS Reconciliation Strategy Study June 2007
Macassar) to the Faure Water Treatment Plant (FWTP), where it would be further treated by physical-chemical processes before being introduced into the system for distribution. The yield from this option was limited to 125 Ml/day on account of the following constraints:
Blending ratios: The Department of Health (DoH) requires that treated effluent, further treated by means of physical-chemical processes for potable water use, be blended with potable water at a ratio of 1:4 before it can be made available for human consumption.
Treatment capacity: The treatment capacity of the Faure Water Treatment Plant (FWTP) was taken as 1000 Ml/day (being the capacity after the planned future upgrade), with an operating peak factor of 1.5.
Although not considered at that time, the following additional constraints would limit the optimal utilization of treated effluent via the scheme described above:
Winter demands: The winter domestic water demands in the Western Cape are significantly lower than the summer demands. The average winter demand from the FWTP supply area is currently in the order of 175 Ml/day as opposed to approximately 260 Ml/d in summer.
Growth areas: The current high growth areas in the Western Cape are located in the northern suburbs of Cape Town, which are largely supplied from the Glengarry Reservoir. As it is currently not the intention of the CCT to service this reservoir from the FWTP, the upgrading of these works from the present 500 Ml/day to the originally planned 1 000 Ml/day, has been placed on hold.
System optimisation: The WCWSS is operated in a manner aiming to maximize the combined yield from the various dams supplying the system. In particular, this involves maximising the winter run-off from the Palmiet sub-system (limited storage), which is also treated at the FWTP. The yield with assurance of 98% from this sub-system is 22.5 Mm³/a (average of 60 Ml/day), but it has been operated at an average of 175 Ml/day over the past few years, with winter monthly peaks reaching 270 Ml/day. Furthermore, winter run-off from the Kleinplaas Dam, which can be treated either at the FWTP or the Blackheath WTP, also needs to be harnessed in order to optimise the system yield. The winter run-off is estimated to be in the order of 100 Ml/day.
The effect of the abovementioned infrastructure and system operating rule constraints are that the demands on the FWTP would currently be insufficient to fully utilise the treated effluent available, together with the Palmiet (and possibly Kleinplaas) waters, especially when considering the 1:4 blending requirement. Therefore the maximum yields possible from the scheme proposed during the earlier investigations, would be in the order of 40 to 50 Ml/day (14.6 to 18.3 Mm3/a). 1.4 Unsolicited Bid In 2005, the CCT received an unsolicited bid for a scheme, which would entail the use of treated effluent for potable water supply. The top management committee of the City (Ikhwezi) subsequently decided not to pursue the unsolicited bid, but rather to allow for interested parties to submit a tender for the use of treated effluent. 1.5 Summary In view of the unsolicited bid and the fact that treated effluent could be an important water resource in the future, DWAF and CCT have requested that the investigation into the reclamation of treated effluent for potable supply be fast-tracked as part of the WCWSS Reconciliation Strategy Study. The CCT also
Treatment of Effluent to Potable Standards for Supply from the Faure Water Treatment Plant 4
WCWSS Reconciliation Strategy Study June 2007
specifically requested that the option investigated during the earlier studies, be reviewed at a conceptual level, taking the following into consideration:
Recent developments in membrane treatment technologies (e.g. reverse osmosis and ultra-filtration), which could remove the need for blending the reclaimed water; and
The constraints related to getting the water from this source to the distribution network, by conveying the reclaimed water from the Faure WTP to the Blackheath WTP, which is connected via the bulk distribution system to the Glengarry Reservoir (feed point for the current high growth area in the system).
Treatment of Effluent to Potable Standards for Supply from the Faure Water Treatment Plant 5
WCWSS Reconciliation Strategy Study June 2007
2. PURPOSE OF THIS INVESTIGATION The purposes of this investigation are as follows: • To investigate at a conceptual level, an augmentation option, whereby treated effluent from the
Cape Flats, Mitchell’s Plain, Zandvliet and Macassar WWTWs is collected, treated further by means of membrane technologies and then made available for distribution from the Faure, Blackheath and Glengarry reservoirs;
• To assess the suitability of current membrane technology for this application and to provide an indication of its use for treatment for potable use elsewhere in the world;
• To determine the capital, operation and maintenance costs of the option proposed, and to determine its unit reference value;
• To assess the impact of varying influent qualities on the functioning of the proposed scheme, and • To assess the likely social and environmental impacts of the proposed scheme.

Treatment of Effluent to Potable Standards for Supply from the Faure Water Treatment Plant 6
WCWSS Reconciliation Strategy Study June 2007
3. INVESTIGATIONS The following investigations were undertaken:
Literature review of membrane technology options available and its use in similar applications for potable use elsewhere in the world;
Interviews with manufacturers of ultra-filtration and reverse osmosis systems, and in particular with Grahamtek Systems of Somerset West;
Interview with Mr D Peart of the City of Cape Town regarding the possible use of the turbine at the Faure WTP, to generate part of the electricity requirements for the proposed scheme;
Interviews with Mr K Fawcett and Mr P King of the City of Cape Town regarding effluent availability and quality from the various WWTWs;
Interview with Mr M Killick of the City of Cape Town regarding other investigations being undertaken by CCT and the philosophy to be adopted in sizing the Faure/Blackheath link pipeline;
Conceptual layout, sizing and costing of the proposed scheme; An economic evaluation of the proposed scheme; Cursory assessment of the possible environmental impacts of the proposed scheme; and Recommendations.
Treatment of Effluent to Potable Standards for Supply from the Faure Water Treatment Plant 7
WCWSS Reconciliation Strategy Study June 2007
4. USE OF TREATED EFFLUENT FOR POTABLE SUPPLIES ELSEWHERE IN THE WORLD
4.1 Introduction Based on the literature review and interviews conducted as part of this study, it appears that the direct use of reclaimed treated effluent for potable supplies, is not being used extensively in the world at present. This appears to be limited to a few African countries, where the reclaimed water is often blended with potable water supplies from conventional sources (surface/groundwater), before being fed into the distribution system. The indirect use of reclaimed treated effluent, specifically for irrigation and industrial use, appears to be gaining momentum. Reclaimed treated effluent is either injected into ground water or returned to storage (dams), prior to being used by "conventional" means (i.e. is used as a raw water source). Where the reclaimed treated effluent is to be used for potable supplies, it is treated to a high quality (often using membrane technology) before it is added to the "conventional" resources for further use. The main sources of information for the review included: • Grahamtek Systems (interview and literature review); • The Western Australia Water Corporation (literature review); and • Zenon Environmental Inc. (literature review).
4.2 The Singapore Pilot Study The Singapore Water Reclamation Study was the most comprehensive study reviewed as part of this investigation. The study addresses the viability of using treated effluent, reclaimed for potable supplies using membrane technologies, either by indirect or direct means. A copy of the expert panel review and findings of the study is contained in Appendix A of this report. The Reclamation Study included the following: • The design, supply, commissioning and operation of a 10 Ml/day pilot reclamation plant located immediately
downstream of an existing wastewater treatment works, which receives more than 95% of its effluent from domestic sources. The effluent from the works is treated by micro filtration, reverse osmosis and ultra violet treatment, for later potable use;
• A sampling and monitoring programme of the physical, chemical and microbiological properties of the reclaimed water, to assess its suitability for potable use; and
• A health-effects testing programme to determine the safety of the reclaimed treated effluent (i.e. toxicological testing).
The results of the Study are contained in the attached review report in Appendix A and are summarised as follows: • The plant provides a safe and robust multiple-barrier system to chemical contaminants and microbiological
pathogens; • The plant can meet the sustained production of 10 Ml/day specified; • Recovery rates of between 84% and 90% can be maintained;
Treatment of Effluent to Potable Standards for Supply from the Faure Water Treatment Plant 8
WCWSS Reconciliation Strategy Study June 2007
• Operating the plant at recovery rates of between 80% to 82%, is optimal for controlling organic fouling; • Power consumption is in the order of 0.7 to 0.9 kWh/m3; • The conductivity of the feed water affects the quality of the final water i.e. there is a need to minimize the
variation in the feed water conductivity; • The plant can tolerate high turbidity variations (up to 20 NTU), without adversely affecting production.
Recovery of 90% can be maintained where feed water turbidity is maintained below 2 NTU; • Viruses, bacteria and parasites are removed by the reverse osmosis process (i.e. disinfection is just an
added safeguard); and • There appears to be no health impacts associated with the potable use of the reclaimed water. The conclusion drawn by the expert panel on the results of two years of operation of the plant is that the reclamation of treated effluent using dual membrane technologies can consistently and reliably produce raw water suitable for potable use. Although the pilot scheme returns the reclaimed water to a storage dam before use (i.e. indirect re-use), it can be seen from the test results conducted as part of the Study, that the water produced by the plant would be suitable for direct potable use. Therefore, the reclamation of treated effluent for potable use by means of membrane technology appears to be a viable augmentation option. However, the issue of whether to use the reclaimed water indirectly or directly, either with or without blending, may require further investigation.
Treatment of Effluent to Potable Standards for Supply from the Faure Water Treatment Plant 9
WCWSS Reconciliation Strategy Study June 2007
5. DESCRIPTION OF THE PROPOSED SCHEME As it appears viable to use membrane technology to reclaim treated effluent for direct potable use, its application in the Western Cape context was considered further as part of this investigation. The scheme considered as part of this investigation is a variation of the scheme proposed during the earlier studies. The primary reason for the variation is to address the following: • Brine accommodation; and • Providing safeguards for system failure (i.e. the discharge of the treated effluent in the event of system
failure). The proposed scheme entails the use of the treated effluent from the Cape Flats, Mitchell’s Plain, Zandvliet and Macassar Waste Water Treatment Works, which primarily receive domestic effluent, but instead of pumping the effluent to the FWTP for further treatment, it is proposed that the treated effluent be pumped to and treated at a Reclamation Plant to be constructed at the site of the existing Zandvliet WWTW. The reclaimed water would then be pumped to the FWTP, where it could either be treated again or be fed directly into the main distribution reservoirs. Appendix B of this report provides a layout plan and schematic of the proposed scheme. The benefits of this scheme are: • There appears to be adequate space available at the existing site to accommodate both the reclamation
plant and any future upgrades; • The distance from the works to the sea is relatively small and therefore, should environmental
considerations prevent the discharge of the reject water(brine) into the river adjacent to these works, it could be discharged via a sea outfall at relatively small costs; and
• The location of the site is such that water from of the Eerste Rivier, Lourens River and even the Cape Flats Aquifer, could be treated at these works. However treatment of water from the Eerste and Lourens Rivers is very problematic as there would be high flow rates of short duration occurring during the winter months.
In order to maximize the utilisation of the available "treated effluent", it is proposed that a pumping main be constructed to link the Faure Reservoir directly with the Blackheath Reservoirs (Upper and Lower). As the Blackheath Upper Reservoir is linked to the Glengarry Reservoir via an existing 1 525 mm diameter pipeline, the proposed Faure/Blackheath link pipeline will have the added benefit of being able to feed the reclaimed water to both the Blackheath and Glengarry Reservoir supply zones (either directly or via the Blackheath Upper Reservoir). This link would also provide the CCT with additional flexibility in managing the use of the respective resources within the WCWSS.
Treatment of Effluent to Potable Standards for Supply from the Faure Water Treatment Plant 10
WCWSS Reconciliation Strategy Study June 2007
6. SIZING/YIELD OF THE SCHEME
6.1 Introduction The sizing of the scheme will be discussed in terms of its various components, which would be optimised during a later pre-feasibility study. The optimisation of the various infrastructure components would to a large extent be determined by other planning initiatives, risk management issues and system management considerations, which are beyond the scope of this investigation. The components of the scheme are as follows: • Treated effluent conveyance system, i.e. pump stations and pumping mains from the respective
WWTW to the reclamation plant; • The reclamation plant including brine outfall; • The potable water conveyance system, i.e. pump station and pumping main from the reclamation
plant to the Faure WTP and • The potable water bulk conveyance systems, i.e. pump station and pumping main from the Faure
WTP/Reservoir to the Blackheath Reservoirs. Appendix B of this report shows a possible layout plan and schematic of the proposed scheme. 6.2 Scheme Yield The various constraints to be taken into consideration in sizing this scheme are the source yield, the winter demands in the recipient zones, the existing infrastructure capacities and layouts and the system operating rules. 6.2.1 Source Yield It was previously identified that treated effluent from the respective WWTWs could also be used for local irrigation and for exchange for raw water allocations with commercial farmers. These options would entail lower treatment standards and therefore the operational costs to deliver reclaimed water to these “non-potable” consumers, would be lower than those for the potable use consumers. Therefore, one should give preference to meeting the potential non-potable demands before considering the potable use demands. The non-potable demands should be subtracted from the total yields available to determine the volume/yield of treated effluent available for reclamation to potable standards. However, as the commercial irrigation exchange option did not receive substantial support at the first screening workshop (held in August 2005), these demands have not been considered in determining the yields available for the proposed potable supply scheme. The existing capacities of the various wastewater treatment works, their current average summer inflows, the envisaged extent of local irrigation possible from these works (based on the BVi study of 2004) and the volumes of treated effluent available as a source for potable use, are as tabulated in Table 6.1.

Treatment of Effluent to Potable Standards for Supply from the Faure Water Treatment Plant 11
WCWSS Reconciliation Strategy Study June 2007
Table 6.1 Re-use at Existing WWTW
Treatment Works
Capacity (Ml/day)
Current Average Summer Inflows
(Ml/day) Local Irrigation
(Ml/day) Available as Source
for Potable Use (Ml/day)
Current AverageWinter
Inflows (Ml/day)
Cape Flats 200 124 14 110 153
Mitchell’s Plain 48 31 6 25 31
Zandvliet 59 49 5 45 45
Macassar 57 37 12 25 42
Total 364 240 37 205 271 The following pending developments should also be noted: • CCT are currently undertaking investigations, which may result in the capacity of the Macassar WWTW
being downgraded to 54 Ml/day; • CCT are at present upgrading the capacity of the Zandvliet works by 18 Ml/day (with biological nutrient
removal); • CCT are currently in the process of installing a sewer to facilitate the diversion of 8 Ml/day from the
Macassar WWTW to the Zandvliet WWTW; and • CCT are investigating the possibility of diverting all Gordon’s Bay flows to the Macassar WWTW.
6.2.2 Demand on Recipient Zone As the proposed scheme would not provide any storage, both supply and demand side constraints need to be considered in sizing the scheme. The demands for the zones supplied by the Faure and Blackheath WTPs represent the maximum volumes that could be utilised by those sub-systems, without also conveying water to the Glengarry Reservoir. The average demands from these works over the past three years are shown in Table 6.2. Table 6.2 Water demands at Faure and Blackheath WTPs
Supply Zone Average Winter Demands
(Ml/day) Average Summer Demands
(Ml/day)
Faure WTP 175 250
Blackheath WTP 105 286
Sub-total 280 536
Glengarry Reservoir 125 140
Total 405 676
It must be noted that these demands were recorded during a drought period and therefore they could be lower than those during normal conditions. Furthermore, the water requirements are likely to grow in the future as housing standards on the Cape Flats improve and densification of the higher income areas take place. 6.2.3 System Operating Considerations Based on the assessed yield of the Palmiet sub-system (22.5 Mm3/a at 98% assurance of supply), at least 120 Ml/day and more during drought periods, must be distributed from Palmiet during the winter
Treatment of Effluent to Potable Standards for Supply from the Faure Water Treatment Plant 12
WCWSS Reconciliation Strategy Study June 2007
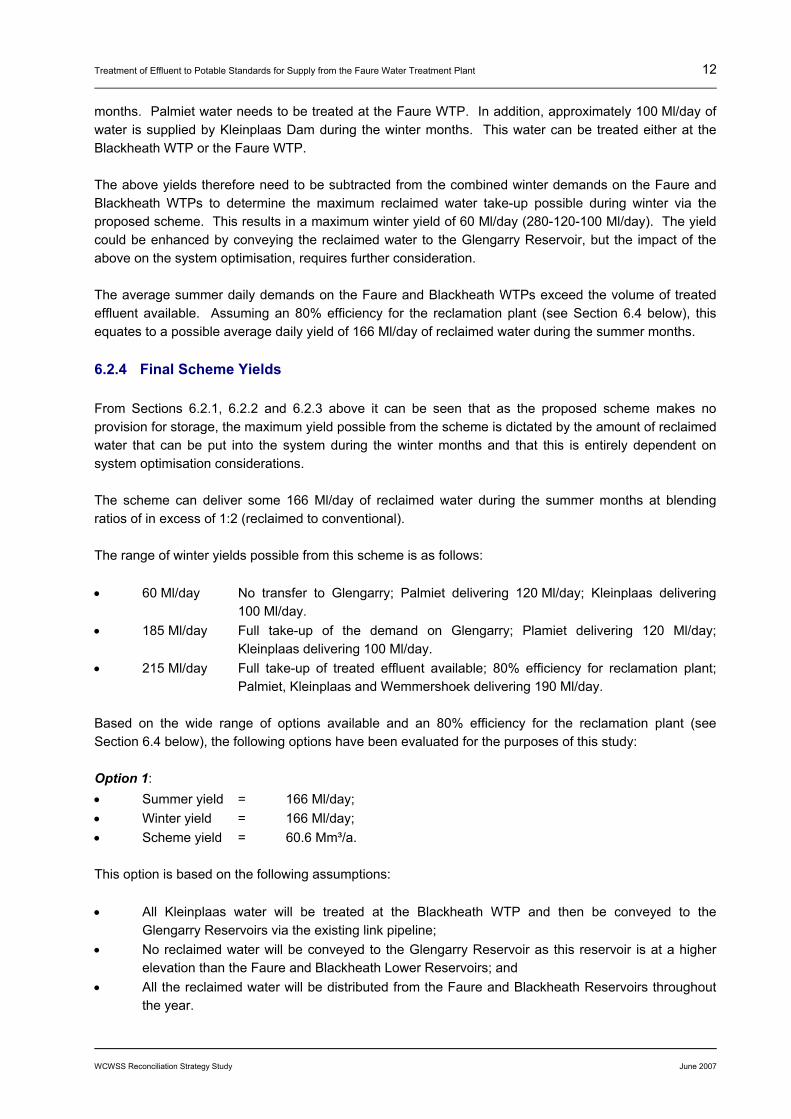
months. Palmiet water needs to be treated at the Faure WTP. In addition, approximately 100 Ml/day of water is supplied by Kleinplaas Dam during the winter months. This water can be treated either at the Blackheath WTP or the Faure WTP. The above yields therefore need to be subtracted from the combined winter demands on the Faure and Blackheath WTPs to determine the maximum reclaimed water take-up possible during winter via the proposed scheme. This results in a maximum winter yield of 60 Ml/day (280-120-100 Ml/day). The yield could be enhanced by conveying the reclaimed water to the Glengarry Reservoir, but the impact of the above on the system optimisation, requires further consideration. The average summer daily demands on the Faure and Blackheath WTPs exceed the volume of treated effluent available. Assuming an 80% efficiency for the reclamation plant (see Section 6.4 below), this equates to a possible average daily yield of 166 Ml/day of reclaimed water during the summer months. 6.2.4 Final Scheme Yields From Sections 6.2.1, 6.2.2 and 6.2.3 above it can be seen that as the proposed scheme makes no provision for storage, the maximum yield possible from the scheme is dictated by the amount of reclaimed water that can be put into the system during the winter months and that this is entirely dependent on system optimisation considerations. The scheme can deliver some 166 Ml/day of reclaimed water during the summer months at blending ratios of in excess of 1:2 (reclaimed to conventional). The range of winter yields possible from this scheme is as follows: • 60 Ml/day No transfer to Glengarry; Palmiet delivering 120 Ml/day; Kleinplaas delivering
100 Ml/day. • 185 Ml/day Full take-up of the demand on Glengarry; Plamiet delivering 120 Ml/day;
Kleinplaas delivering 100 Ml/day. • 215 Ml/day Full take-up of treated effluent available; 80% efficiency for reclamation plant;
Palmiet, Kleinplaas and Wemmershoek delivering 190 Ml/day. Based on the wide range of options available and an 80% efficiency for the reclamation plant (see Section 6.4 below), the following options have been evaluated for the purposes of this study: Option 1: • Summer yield = 166 Ml/day; • Winter yield = 166 Ml/day; • Scheme yield = 60.6 Mm³/a. This option is based on the following assumptions: • All Kleinplaas water will be treated at the Blackheath WTP and then be conveyed to the
Glengarry Reservoirs via the existing link pipeline; • No reclaimed water will be conveyed to the Glengarry Reservoir as this reservoir is at a higher
elevation than the Faure and Blackheath Lower Reservoirs; and • All the reclaimed water will be distributed from the Faure and Blackheath Reservoirs throughout
the year.
Treatment of Effluent to Potable Standards for Supply from the Faure Water Treatment Plant 13
WCWSS Reconciliation Strategy Study June 2007
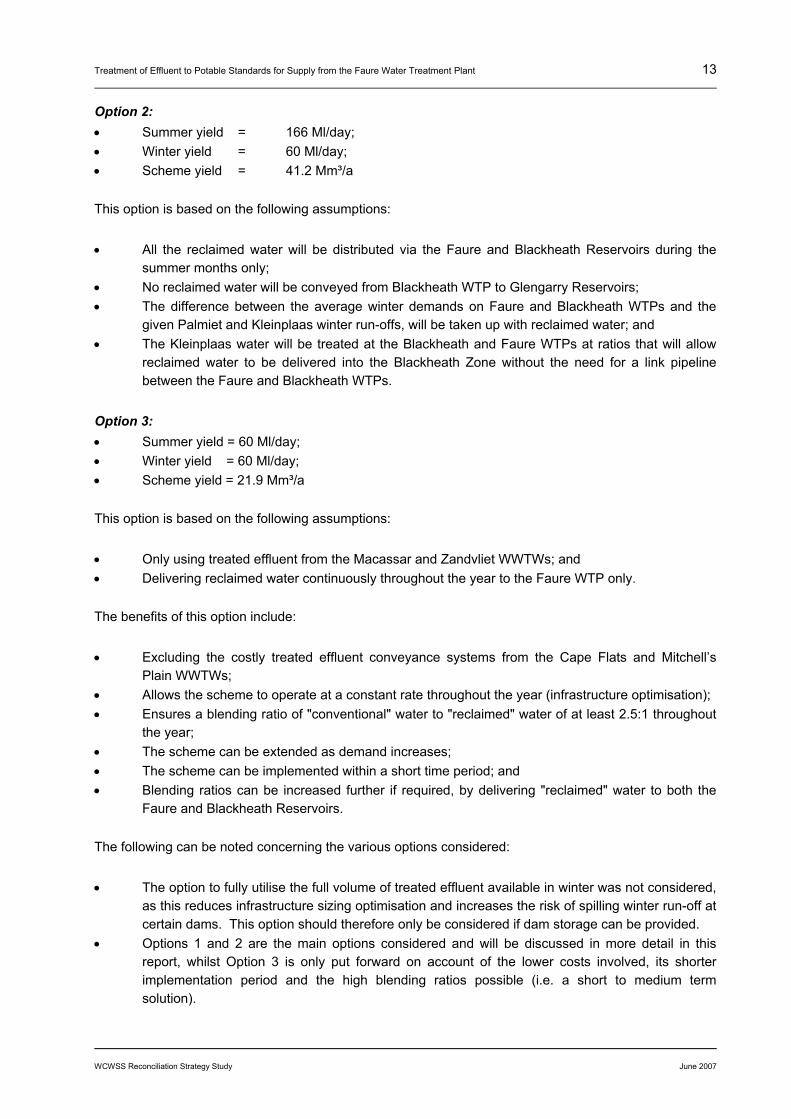
Option 2: • Summer yield = 166 Ml/day; • Winter yield = 60 Ml/day; • Scheme yield = 41.2 Mm³/a This option is based on the following assumptions: • All the reclaimed water will be distributed via the Faure and Blackheath Reservoirs during the
summer months only; • No reclaimed water will be conveyed from Blackheath WTP to Glengarry Reservoirs; • The difference between the average winter demands on Faure and Blackheath WTPs and the
given Palmiet and Kleinplaas winter run-offs, will be taken up with reclaimed water; and • The Kleinplaas water will be treated at the Blackheath and Faure WTPs at ratios that will allow
reclaimed water to be delivered into the Blackheath Zone without the need for a link pipeline between the Faure and Blackheath WTPs.
Option 3: • Summer yield = 60 Ml/day; • Winter yield = 60 Ml/day; • Scheme yield = 21.9 Mm³/a This option is based on the following assumptions: • Only using treated effluent from the Macassar and Zandvliet WWTWs; and • Delivering reclaimed water continuously throughout the year to the Faure WTP only. The benefits of this option include: • Excluding the costly treated effluent conveyance systems from the Cape Flats and Mitchell’s
Plain WWTWs; • Allows the scheme to operate at a constant rate throughout the year (infrastructure optimisation); • Ensures a blending ratio of "conventional" water to "reclaimed" water of at least 2.5:1 throughout
the year; • The scheme can be extended as demand increases; • The scheme can be implemented within a short time period; and • Blending ratios can be increased further if required, by delivering "reclaimed" water to both the
Faure and Blackheath Reservoirs. The following can be noted concerning the various options considered: • The option to fully utilise the full volume of treated effluent available in winter was not considered,
as this reduces infrastructure sizing optimisation and increases the risk of spilling winter run-off at certain dams. This option should therefore only be considered if dam storage can be provided.
• Options 1 and 2 are the main options considered and will be discussed in more detail in this report, whilst Option 3 is only put forward on account of the lower costs involved, its shorter implementation period and the high blending ratios possible (i.e. a short to medium term solution).
Treatment of Effluent to Potable Standards for Supply from the Faure Water Treatment Plant 14
WCWSS Reconciliation Strategy Study June 2007
• As Options 1 and 2 entail the full utilisation of treated effluent available in summer, these yields have been used in sizing the respective infrastructure components.
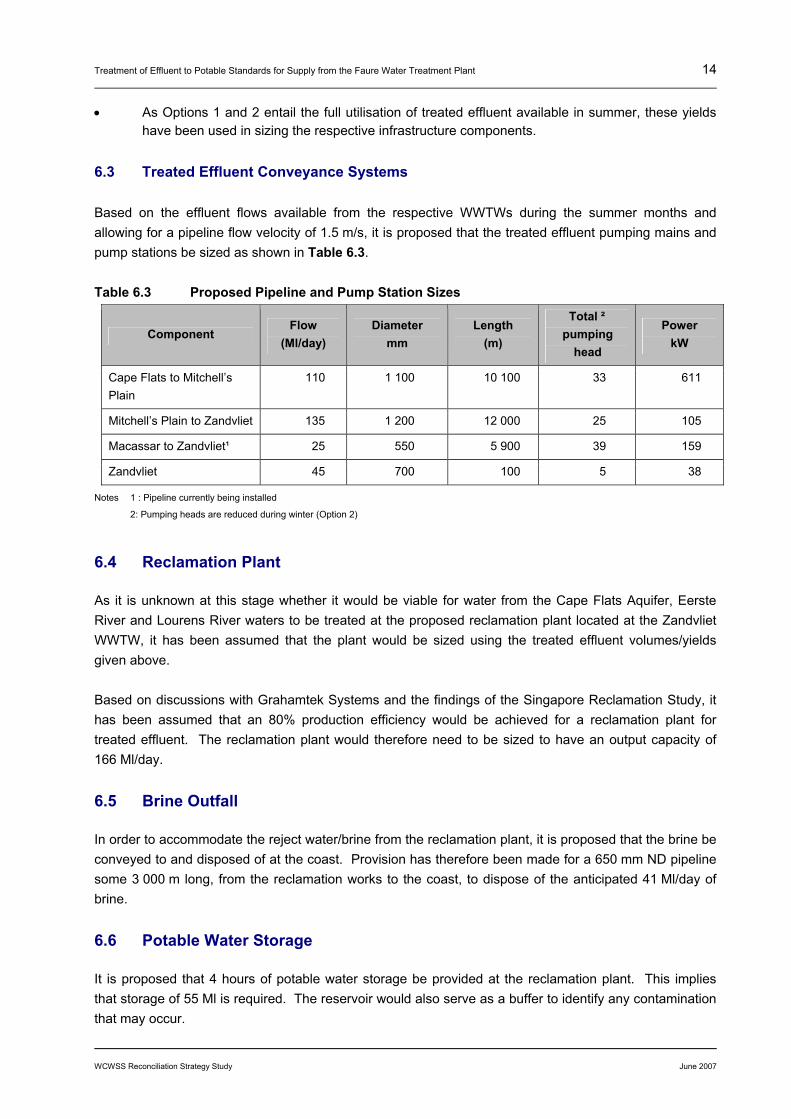
6.3 Treated Effluent Conveyance Systems Based on the effluent flows available from the respective WWTWs during the summer months and allowing for a pipeline flow velocity of 1.5 m/s, it is proposed that the treated effluent pumping mains and pump stations be sized as shown in Table 6.3. Table 6.3 Proposed Pipeline and Pump Station Sizes
Component Flow
(Ml/day) Diameter
mm Length
(m)
Total ² pumping
head
Power kW
Cape Flats to Mitchell’s Plain
110 1 100 10 100 33 611
Mitchell’s Plain to Zandvliet 135 1 200 12 000 25 105
Macassar to Zandvliet¹ 25 550 5 900 39 159
Zandvliet 45 700 100 5 38
Notes 1 : Pipeline currently being installed
2: Pumping heads are reduced during winter (Option 2)
6.4 Reclamation Plant As it is unknown at this stage whether it would be viable for water from the Cape Flats Aquifer, Eerste River and Lourens River waters to be treated at the proposed reclamation plant located at the Zandvliet WWTW, it has been assumed that the plant would be sized using the treated effluent volumes/yields given above. Based on discussions with Grahamtek Systems and the findings of the Singapore Reclamation Study, it has been assumed that an 80% production efficiency would be achieved for a reclamation plant for treated effluent. The reclamation plant would therefore need to be sized to have an output capacity of 166 Ml/day.
6.5 Brine Outfall In order to accommodate the reject water/brine from the reclamation plant, it is proposed that the brine be conveyed to and disposed of at the coast. Provision has therefore been made for a 650 mm ND pipeline some 3 000 m long, from the reclamation works to the coast, to dispose of the anticipated 41 Ml/day of brine.
6.6 Potable Water Storage It is proposed that 4 hours of potable water storage be provided at the reclamation plant. This implies that storage of 55 Ml is required. The reservoir would also serve as a buffer to identify any contamination that may occur.

Treatment of Effluent to Potable Standards for Supply from the Faure Water Treatment Plant 15
WCWSS Reconciliation Strategy Study June 2007
6.7 Potable Water Conveyance System The incorporation of the Cape Flats Aquifer, Lourens River and Eerste River waters in the Western Cape System could affect the utilisation of water from the proposed treated effluent schemes, however these have been ignored for the purpose of sizing the new scheme. Therefore the conveyance system between the reclamation plant and the FWTP has been sized to convey the identified 166 Ml/day (the capacity of the reclamation plant). The details of the system are therefore as follows: • Pipe length : 5 500 m • Pipe size : 1 400 mm ND • Total pumping head : 78 m • Power demand : 2 150 kW 6.8 Faure/Blackheath Link Pipeline It is anticipated that the ultimate sizing of the pipeline between the Faure and Blackheath WTPs will be entirely dependent on system flexibility and other operational considerations. For the purpose of this investigation the system has been sized to accommodate the average winter demand on the Blackheath WTP, which amounts to 105 Ml/day. The details of the system are therefore as follows: • Pipe length : 14 000 m • Pipe size : 1 100 mm ND • Total pumping head : 22 m • Power demand : 389 kW It should be noted that if one were to convey reclaimed water to the Glengarry Reservoir, one would need to do so via the Blackheath Upper Reservoir, which would require the installation of a much larger pump station at the FWTP due to the relative height differences between the respective reservoirs.

Treatment of Effluent to Potable Standards for Supply from the Faure Water Treatment Plant 16
WCWSS Reconciliation Strategy Study June 2007
7. COSTING OF INFRASTRUCTURE 7.1 Capital Costs The estimated total capital cost of the required infrastructure (including engineering fees) amounts to R 676 222 041 incl. VAT as summarised below: • Treated effluent pipelines : R 115 843 000 • Treated effluent pump stations : R 17 977 951 • Reclamation Plant : R 303 453 333 • Potable water pipelines : R 112 052 500 • Potable water pump stations : R 36 920 445 • Waste water treatment works : R 6 930 000 • Sub-total R 593 199 229 ex VAT • VAT R 83 044 812 • Total R 676 222 041 incl. VAT These capital costs are applicable to both Options 1 and 2. However, detailed cost breakdowns of Options 1, 2 and 3 are presented in Appendix C of this report.
7.2 Operating Costs Based on a power consumption of 1 kW/m3 of water supplied by the reclamation plant, the operation and maintenance costs and the replacement of all membranes and electro-mechanical plant every 10 years, the average annual operating costs of the system over a 50 year period at current costs are estimated to be R39.7 million including VAT per annum. This figure reduces to R29.9 million incl. VAT per annum for Option 2. Appendix C of this report contains the cost breakdowns of the scheme operation and maintenance costs for Options 1, 2 and 3.
Treatment of Effluent to Potable Standards for Supply from the Faure Water Treatment Plant 17
WCWSS Reconciliation Strategy Study June 2007
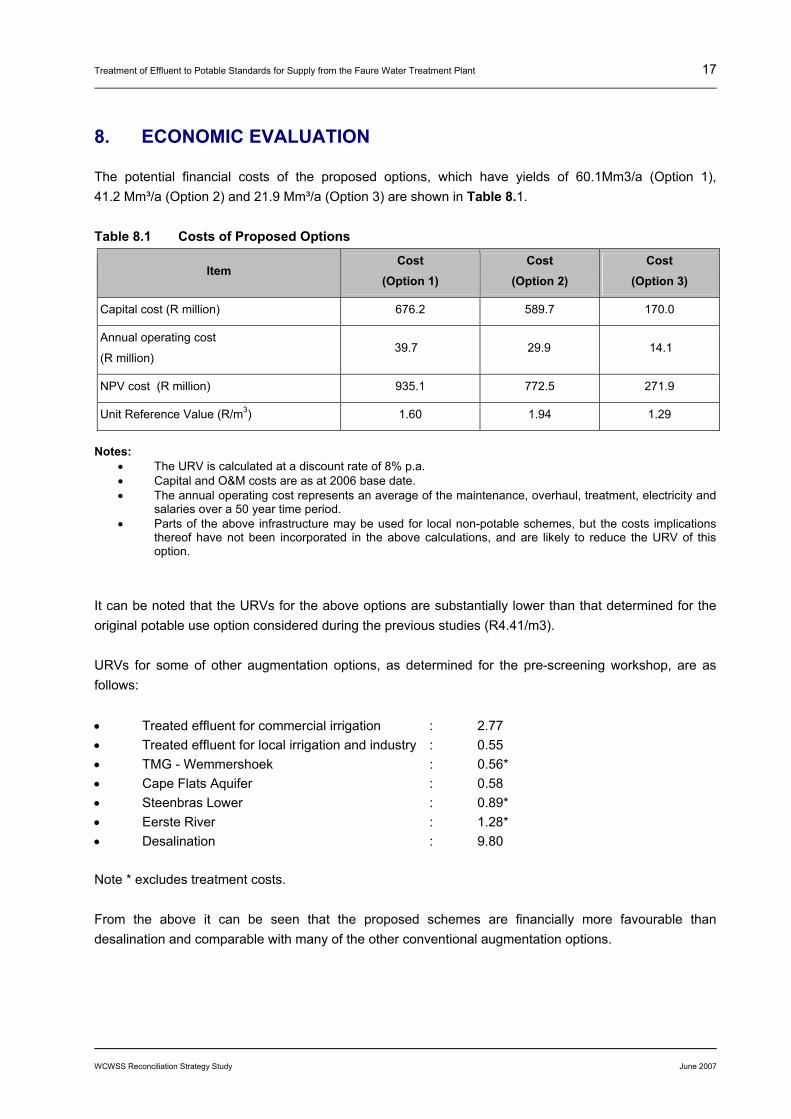
8. ECONOMIC EVALUATION The potential financial costs of the proposed options, which have yields of 60.1Mm3/a (Option 1), 41.2 Mm³/a (Option 2) and 21.9 Mm³/a (Option 3) are shown in Table 8.1. Table 8.1 Costs of Proposed Options
Item Cost
(Option 1) Cost
(Option 2) Cost
(Option 3)
Capital cost (R million) 676.2 589.7 170.0
Annual operating cost
(R million) 39.7 29.9 14.1
NPV cost (R million) 935.1 772.5 271.9
Unit Reference Value (R/m3) 1.60 1.94 1.29
Notes:
• The URV is calculated at a discount rate of 8% p.a. • Capital and O&M costs are as at 2006 base date. • The annual operating cost represents an average of the maintenance, overhaul, treatment, electricity and
salaries over a 50 year time period. • Parts of the above infrastructure may be used for local non-potable schemes, but the costs implications
thereof have not been incorporated in the above calculations, and are likely to reduce the URV of this option.
It can be noted that the URVs for the above options are substantially lower than that determined for the original potable use option considered during the previous studies (R4.41/m3). URVs for some of other augmentation options, as determined for the pre-screening workshop, are as follows: • Treated effluent for commercial irrigation : 2.77 • Treated effluent for local irrigation and industry : 0.55 • TMG - Wemmershoek : 0.56* • Cape Flats Aquifer : 0.58 • Steenbras Lower : 0.89* • Eerste River : 1.28* • Desalination : 9.80 Note * excludes treatment costs. From the above it can be seen that the proposed schemes are financially more favourable than desalination and comparable with many of the other conventional augmentation options.
Treatment of Effluent to Potable Standards for Supply from the Faure Water Treatment Plant 18
WCWSS Reconciliation Strategy Study June 2007
9. ENVIRONMENTAL IMPACT It is anticipated that in general, this scheme will have a positive environmental impact. Positive impacts include the following: • Return of seasonal flows to local river and vlei systems; • Reduced dependence on surface water resources. Possible negative impacts include: • Reject water/brine disposal into the sea and/or local river system; and • Impacts related to the construction of the scheme.

Treatment of Effluent to Potable Standards for Supply from the Faure Water Treatment Plant 19
WCWSS Reconciliation Strategy Study June 2007
10. SOCIO-ECONOMIC IMPACT The proposed scheme will have slight positive economic impact, by creating employment opportunities. Despite the initial findings of the Singapore Study, it is possible that there may still be some negative health impacts related to the use of reclaimed treated effluent, especially for direct re-use. The greatest risk to health could arise as a result of incorrect operation of the system or an undetected malfunction that releases untreated effluent into the water reticulation system. However, this impact would be reduced for Option 3, given the relatively high blending ratios. It is still likely that there will be some community aversion to the use of reclaimed treated effluent for potable use, particularly by certain religious groupings and communities residing in the recipient zones. This could possibly be averted by allowing further blending of the reclaimed water, although this would probably increase the URV of the scheme.

Treatment of Effluent to Potable Standards for Supply from the Faure Water Treatment Plant 20
WCWSS Reconciliation Strategy Study June 2007
11. STRATEGIC EVALUATION The specific strengths and weaknesses of Options 1 and 2 include: Strengths • They have a relative high yield; • They have a moderate URV; • They will generally have positive environmental impacts; • The technology for this specific option is being continuously improved and is currently used fairly
extensively in similar applications throughout the world, albeit via in-direct use; • The pending new DWAF standards for permitting discharges of treated effluent may enhance the
quality and consistency of the influent to the reclamation plant, thereby enhancing the operational efficiency of the plant;
• The options have the ability of addressing the water quality concerns related with the identified Cape Flats Aquifer, Eerste River and Lourens River augmentation options, by incorporating these schemes in the scheme proposed as part of this investigation; and
• Option 3 has the added benefits of high blending ratios and short implementation periods.
Weaknesses • Public aversion to the notion of drinking reclaimed treated wastewater; • Institutional implications in terms of the operation and maintenance of the respective waste water
treatment works and reclamation plant; • Possible health implications and risks; and • Limited direct re-use elsewhere in the world other than in Nambia and Botswana, although the
potential for direct re-use is being studied in a pilot plant at Singapore.

Treatment of Effluent to Potable Standards for Supply from the Faure Water Treatment Plant 21
WCWSS Reconciliation Strategy Study June 2007
12. CONCLUSIONS The following conclusions can be drawn from this investigation: • "Treated effluent" to potable standard constitutes a potentially valuable water resource that needs
to be considered in the quest to reconcile supply and demands on the WCWSS into the future; • The reclamation of "treated effluent" for potable use via membrane technology appears to be a
viable option for the augmentation of the WCWSS and warrants more detailed studies, in order both to optimise the scheme proposed as well as to identify and investigate alternative options;
• The yields possible from the scheme identified are restricted by the take-up of reclaimed water and system operation considerations during the winter months. Hence, without the provision of storage dams, the use of treated effluent cannot be maximised via the scheme proposed.
• Options exist to allow for the partial take-up of reclaimed water at constant rates throughout the year, allowing for scheme infrastructure optimisation and blending ratios of "reclaimed" to "conventional" water of at least 1:2.5 throughout the year. These ratios could be increased further by undertaking certain extensions to the scheme.
• The utilisation of treated effluent for direct potable water use has been limited to date and could pose health risks due to malfunction or incorrect operation. Therefore consideration should also be given to a scheme involving indirect reuse, replacement of river reserves and irrigation use.
Treatment of Effluent to Potable Standards for Supply from the Faure Water Treatment Plant 22
WCWSS Reconciliation Strategy Study June 2007
13. RECOMMENDATIONS The recommendations made, based on the findings of this investigation, are divided into general recommendations regarding the use of treated effluent and scheme specific recommendations.
13.1 General As it is considered that treated effluent is a valuable water resource warranting further investigation, it is recommended that: • The earlier investigation entitled "Strategic Evaluation of Bulk Wastewater" be reviewed and that
a Policy and Implementation Strategy, similar to the Water Conservation and Demand Management Strategy recently completed by the CCT, be developed;
• The Policy and Implementation Strategy be developed for the area as a whole and in particular, the range of potable and non-potable uses for specific treatment works needs to be evaluated and optimised, based on certain key strategic decisions;
• Following the completion of the above investigation, the wastewater treatment works capable of producing treated effluent suitable as a raw water source for future tertiary treatment to potable standards, need to be identified. This may necessitate that future development in the various waste water drainage zones be regulated e.g. industries not being permitted in certain zones unless separate waste water treatment streams are provided; and
• The full potential of effluent reuse to potable standards (or irrigation exchange) be investigated within the Western Cape Water Supply System. This investigation should identify all possible effluent re-use schemes, so that they can be further costed and evaluated as stand-alone schemes. The investigation would also have to take into account the potential effluent re-use constraints when the scheme is integrated into the WCWSS.
13.2 Scheme Specific The specific scheme proposed, and its various alternatives, have been investigated at a conceptual level. These investigations show that the proposed direct re-use of waste water treatment works' effluent treated to potable standards via membrane technologies could be a viable augmentation option worthy of further consideration, but that indirect re-use or other means may be preferable on account of social acceptability and the potential health risk of direct re-use implementation. Therefore, in order to confirm these findings or to optimise the scheme further, at least the following additional investigations are recommended: • Possible incorporation of the Cape Flats Aquifer, Lourens River and Eerste River augmentation
options with this option; • The provision of storage with the above options to both facilitate blending and to enhance system
yields; • Optimisation of the Faure/Blackheath link pipeline to facilitate the optimisation of the WCWSS as
a whole, including the transfer of reclaimed water for use at the Glengarry Reservoir. Coupled with the Glengarry transfer, the impact of the proposed scheme on the operation of the WCWSS and the risk of spilling at Wemmershoek, which may impact on the optimal yield of the scheme.
• The accommodation of the brine;
Treatment of Effluent to Potable Standards for Supply from the Faure Water Treatment Plant 23
WCWSS Reconciliation Strategy Study June 2007
• The optimum operating regime to maximise this utilisation of treated effluent and the possible phasing of the works; and
• Option for indirect use of waste water treated to potable standard or to supply irrigators along the Berg River and also to supply river and estuarine reserves.
Treatment of Effluent to Potable Standards for Supply from the Faure Water Treatment Plant 24
WCWSS Reconciliation Strategy Study June 2007
REFERENCES
Bornman, T G and Kloges, N T W. 2004. Effects of brine discharge from the reverse osmosis plant on the salinity and temperature of the Bushman River Estuary. Specialist Report. Bornman, T G and Kloges, N T W. 2004. Upgrade of Kenton-on-Sea/Bushmans River Mouth Bulk Water Supply. Environmental Scoping Report. Cape Town Metropolitan Council. 1999. Strategic Evaluation of Bulk Wastewater Water Reclamation: a Strategic Guideline. Cape Wastewater Consultants in association with Abbot, Grobicki (Pty) Ltd. Report 25 of 37. City of Cape Town, CMC Administration. 2001. Integrated Water Resource Planning Study – Potential for the use of treated wastewater within the CMA. Report 8 of 12; City of Cape Town. 2003. Investigation into the distribution of treated effluent. BVi Consulting Engineers. Reports C1093/1 to C1093/13. Klages, N T W and Bornman, T G. 2005. Gonubie Valley Golf Estate, Desalination as an Option of Addressing the Water Needs. Specialist Report. Public Utilities Board. 2002. Singapore Water Reclamation Study – Expert Panel Review and Findings. Schutte, C F. 1983. Desalination: A South African Perspective. Water Research Commission. Water Corporation of Western Australia. 2005. Integrated Water Supply Scheme Source Development Plan – Planning Horizon 2005-2050 Western Australia. Water Corporation of Western Australia. 2005. Desalination and Water Reuse: Forging ahead in Western Australia. Paper presented at the International Desalination Association World Congress. Water Corporation of Western Australia. 2005. The Application of Desalination in Western Australia and its Role in Economic Development. Paper presented at the International Desalination Association World Congress. I:\HYDRO\400818 WC Reconciliation\FINAL REPORTS\Effluent reuse Faure case study\Treated Effluent.doc

APPENDIX A
Singapore Reclamation Study Expert Panel Review and Findings
___________________________________________________________________________________
________________________________________________________________
SINGAPORE
WATER RECLAMATION STUDY
EXPERT PANEL REVIEW
AND
FINDINGS
JUNE 2002

___________________________________________________________________________________
________________________________________________________________ Expert Panel Review and Findings Page AB-1
June 2002
1. INTRODUCTION
1.1 Project Overview
The Singapore Water Reclamation Study (“NEWater Study”) was first conceptualised in 1998 as a joint initiative between Public Utilities Board (PUB) and Ministry of the Environment (ENV). The primary objective of the joint initiative was to determine the suitability of using NEWater as a source of raw water to supplement Singapore’s water supply. NEWater is treated used water that has undergone stringent purification and treatment process using advanced dual-membrane (microfiltration and reverse osmosis) and ultraviolet technologies. NEWater could be mixed and blended with reservoir water and then undergo conventional water treatment to produce drinking water (defined here as Planned Indirect Potable Reuse or Planned IPR).
Planned IPR as a source of water supply is not new. It has been practised in several parts of the United States for more than 20 years. At Water Factory 21, Orange County Water District, Southern California, high quality water reclaimed from treated used water has been injected into ground water since 1976. Similarly, at Upper Occoquan Sewage Authority (UOSA), Virginia, high quality reclaimed water is discharged into Occoquan Reservoir since 1978. Occoquan Reservoir is a source of water supply for more than one million people located in the vicinity of Washington DC.
Water reclamation is a growing trend in the U.S. and around the world. In the U.S., there are several other water reclamation projects in the municipal scale that are either being planned or under construction. Two of them are at Gwinnett near Atlanta, Georgia and Scottsdale near Phoenix, Arizona.
___________________________________________________________________________________
________________________________________________________________ Expert Panel Review and Findings Page AB-2
June 2002
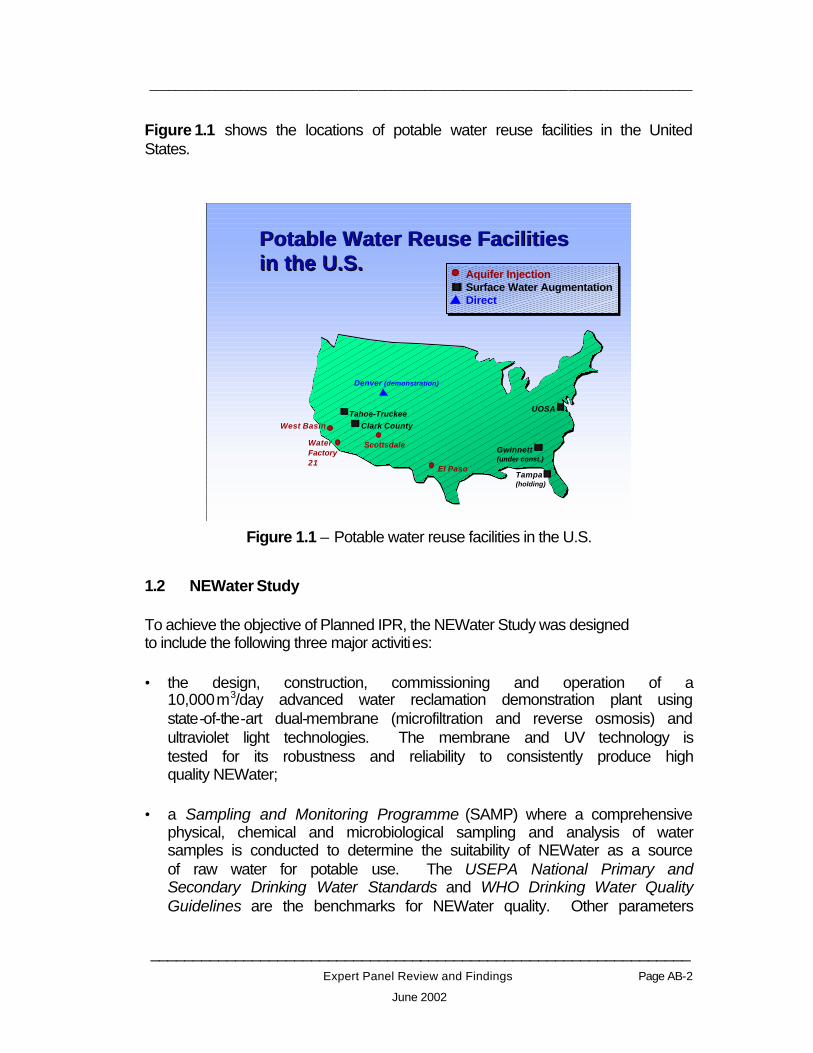
Figure 1.1 shows the locations of potable water reuse facilities in the United States.
Potable Water Reuse FacilitiesPotable Water Reuse Facilitiesin the U.S.in the U.S.
Aquifer InjectionSurface Water AugmentationDirect
Tampa(holding)
Gwinnett(under const.)
UOSA
Denver (demonstration)
El Paso
West Basin
WaterFactory21
Tahoe-Truckee
Scottsdale
Clark County
Figure 1.1 – Potable water reuse facilities in the U.S.
1.2 NEWater Study
To achieve the objective of Planned IPR, the NEWater Study was designed to include the following three major activities:
• the design, construction, commissioning and operation of a 10,000 m3/day advanced water reclamation demonstration plant using state-of-the-art dual-membrane (microfiltration and reverse osmosis) and ultraviolet light technologies. The membrane and UV technology is tested for its robustness and reliability to consistently produce high quality NEWater;
• a Sampling and Monitoring Programme (SAMP) where a comprehensive physical, chemical and microbiological sampling and analysis of water samples is conducted to determine the suitability of NEWater as a source of raw water for potable use. The USEPA National Primary and Secondary Drinking Water Standards and WHO Drinking Water Quality Guidelines are the benchmarks for NEWater quality. Other parameters
___________________________________________________________________________________
________________________________________________________________ Expert Panel Review and Findings Page AB-3
June 2002
of potential concern, but not listed in these standards/guidelines are also routinely tested for; and
• a Health Effects Testing Programme (HETP) to complement the comprehensive SAMP to determine the safety of NEWater. The HETP is ongoing. It involves the toxicological assessment of NEWater against PUB source water from Bedok Reservoir. The HETP covering both short and long term health effects is carried out using two animal species i.e. mice and fish. The fish are also being used for estrogenic (reproductive and developmental) assessment.
1.3 Expert Panel
The Expert Panel consisting of both local and foreign experts in engineering, biomedical science, chemistry and water technology was formed in January 1999 to provide independent advice to PUB and ENV on the NEWater Study. The scope of the Expert Panel is defined as follows:
• review and advise on the planning and implementation of the NEWater Study;
• review and advise on the sampling and analysis of water, toxicological and carcinogenic risk assessment, and other relevant health studies;
• review the findings for the Study; and
• evaluate the findings and make recommendations with regard to the suitability of NEWater as a source of raw water for potable use.
___________________________________________________________________________________
________________________________________________________________ Expert Panel Review and Findings Page AB-4
June 2002
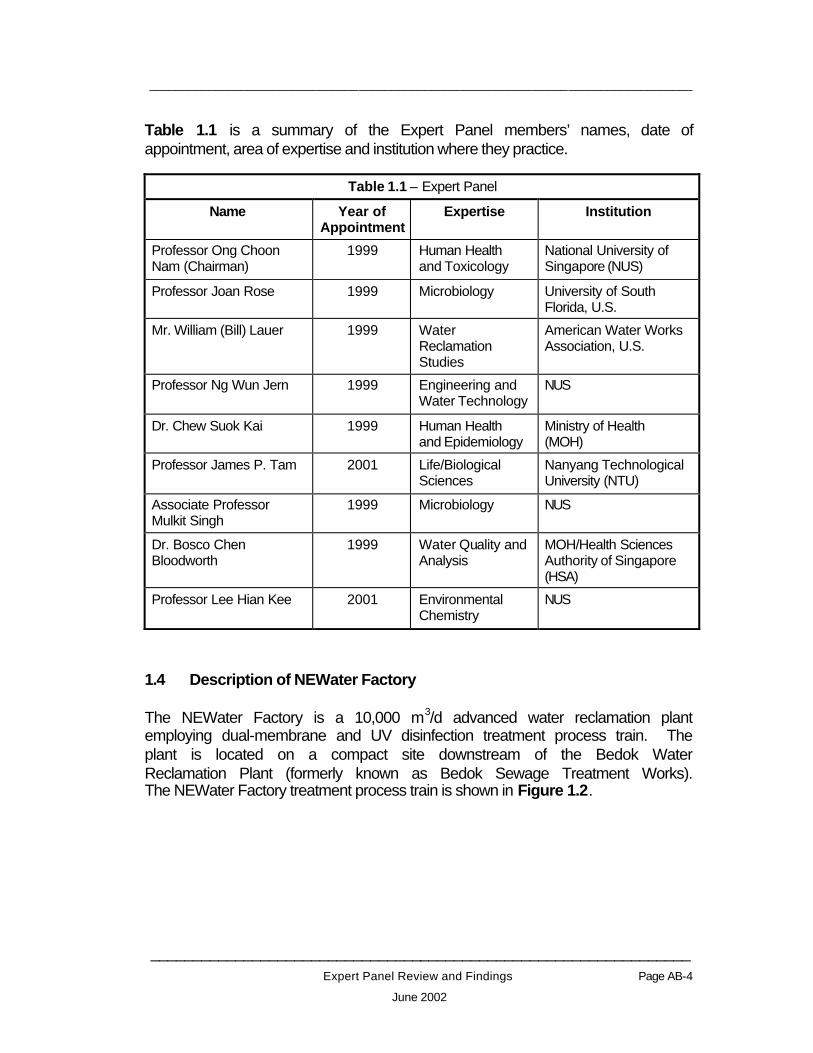
Table 1.1 is a summary of the Expert Panel members’ names, date of appointment, area of expertise and institution where they practice.
Table 1.1 – Expert Panel
Name Year of Appointment
Expertise Institution
Professor Ong Choon Nam (Chairman)
1999 Human Health and Toxicology
National University of Singapore (NUS)
Professor Joan Rose 1999 Microbiology University of South Florida, U.S.
Mr. William (Bill) Lauer 1999 Water Reclamation Studies
American Water Works Association, U.S.
Professor Ng Wun Jern 1999 Engineering and Water Technology
NUS
Dr. Chew Suok Kai 1999 Human Health and Epidemiology
Ministry of Health (MOH)
Professor James P. Tam 2001 Life/Biological Sciences
Nanyang Technological University (NTU)
Associate Professor Mulkit Singh
1999 Microbiology NUS
Dr. Bosco Chen Bloodworth
1999 Water Quality and Analysis
MOH/Health Sciences Authority of Singapore (HSA)
Professor Lee Hian Kee 2001 Environmental Chemistry
NUS
1.4 Description of NEWater Factory
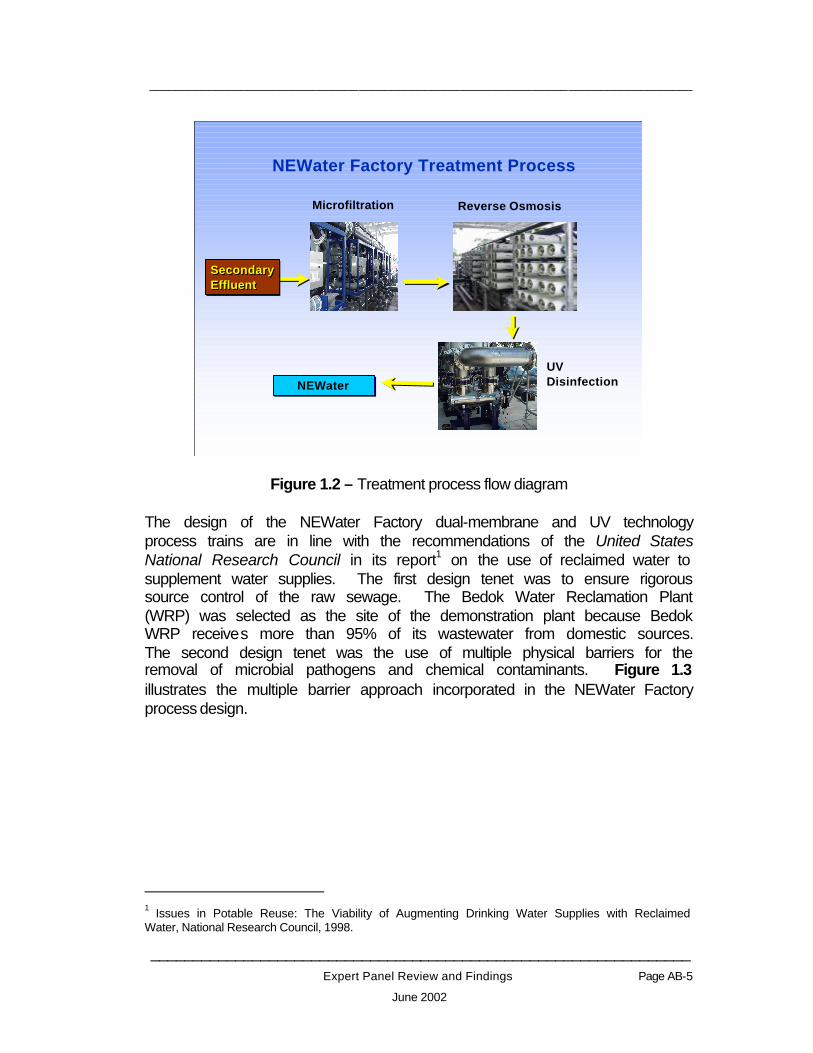
The NEWater Factory is a 10,000 m3/d advanced water reclamation plant employing dual-membrane and UV disinfection treatment process train. The plant is located on a compact site downstream of the Bedok Water Reclamation Plant (formerly known as Bedok Sewage Treatment Works). The NEWater Factory treatment process train is shown in Figure 1.2.
___________________________________________________________________________________
________________________________________________________________ Expert Panel Review and Findings Page AB-5
June 2002
SecondaryEffluentSecondarySecondaryEffluentEffluent
NEWater Factory Treatment Process
NEWaterNEWater
Microfiltration Reverse Osmosis
UVDisinfection
Figure 1.2 – Treatment process flow diagram
The design of the NEWater Factory dual-membrane and UV technology process trains are in line with the recommendations of the United States National Research Council in its report1 on the use of reclaimed water to supplement water supplies. The first design tenet was to ensure rigorous source control of the raw sewage. The Bedok Water Reclamation Plant (WRP) was selected as the site of the demonstration plant because Bedok WRP receives more than 95% of its wastewater from domestic sources. The second design tenet was the use of multiple physical barriers for the removal of microbial pathogens and chemical contaminants. Figure 1.3 illustrates the multiple barrier approach incorporated in the NEWater Factory process design.
1 Issues in Potable Reuse: The Viability of Augmenting Drinking Water Supplies with Reclaimed Water, National Research Council, 1998.

___________________________________________________________________________________
________________________________________________________________ Expert Panel Review and Findings Page AB-6
June 2002
REJECT REJECT
Removaln Turbidityr Inorganicsr Virusn Bacterian Protozoar Organics
Removaln Turbidityn Inorganicsn Virusn Bacterian Protozoan Organics
Removaln Turbidityn Inorganics
n Virusn Bacterian Protozoar Organics
MicrofiltrationMicrofiltration Reverse OsmosisReverse Osmosis DisinfectionDisinfectionNEWaterNEWater
SecondaryEffluentContaminants
SecondaryEffluentContaminantsn Turbidityn Inorganicsn Virusn Bacterian Protozoan Organics
n Turbidityn Inorganicsn Virusn Bacterian Protozoan Organics
Figure 1.3 – Multiple barrier approach for microbial and chemical contaminant removal
Feed water to the demonstration plant is clarified secondary effluent from an activated sludge treatment process, that typically contains: 10 mg/L BOD5, 10 mg/L TSS, 6 mg/L ammonia-nitrogen and 400 to 1,600 mg/L total dissolved solids (TDS) including 12 mg/L of total organic carbon (TOC).
The secondary effluent is first microscreened (0.3 mm), followed by microfiltration (MF) to 0.2 µm to remove fine solids and particles, and then demineralised with reverse osmosis (RO). For the final step, the RO permeate is disinfected by ultraviolet irradiation. Chlorine is added at two points before and after MF to control the rate of biofouling in the membrane systems.
Two parallel 5,000 m3/d (5 ML/d) reverse osmosis trains are provided, each fitted with thin-film aromatic polyamide composite membranes configured for 80 to 85% recovery in a three-stage array. This is followed by three UV units in series equipped with broad-spectrum medium pressure UV lamps delivering a minimum design total UV dosage of 60 mJ/cm2. The end product is called NEWater.
___________________________________________________________________________________
________________________________________________________________ Expert Panel Review and Findings Page AB-7
June 2002
1.5 Indirect Potable Reuse
When discussing the reuse of treated effluent for potable purposes, the following definitions are useful to distinguish between “indirect” and “direct” potable reuse and between “planned” and “unplanned” potable reuse.
Planned Indirect Potable Reuse is the abstraction, treatment, and distribution of water for drinking from a natural source water (river, lake or aquifer) that is intentionally and partially fed by the discharge of treated wastewater effluent (NRC, 1998). This type of potable reuse is becoming more common as other viable water sources become scarcer because of population growth and watershed urbanisation. Some U.S. examples are Water Factory 21, Orange County Water District, Southern California and Upper Occoquan Sewage Authority (UOSA), Virginia.
Unplanned Indirect Potable Reuse occurs when a water supply is abstracted for potable purposes from natural source (surface or groundwater) that is fed in part by the discharge/disposal of wastewater effluent (treated or not). The subsequent potable reuse of the wastewater effluent was not an intentional part of the effluent disposal plan. This type of potable reuse occurs whenever an upstream water user discharges wastewater effluent into a water source (river, lake or aquifer) that serves as a water supply for a downstream user. As noted later, many large communities unintentionally have been practising unplanned indirect potable reuse. Some examples are the Rhine and Thames rivers in Europe, Mississippi River in the U.S., Yangtze River in China, and Mekong River in Indo-China.
Direct Potable Reuse is the immediate addition of reclaimed water to the potable water distribution system. This practice has not been adopted by, or approved for, any water system in the U.S. (NRC, 1998), although, it is being practised in Windhoek, Namibia, Africa. Hence, direct potable reuse is not considered a viable option for Singapore and will not be discussed from hereon.

___________________________________________________________________________________
________________________________________________________________ Expert Panel Review and Findings Page AB-8
June 2002
2. PLANT OPERATIONS
2.1 General
The NEWater Factory commenced operation in May 2000, and continues to perform satisfactorily and within design expectations. Table 2.1 below compares the original plant design criteria against actual plant performance (monthly averages) since operation in May 2000.
Table 2.1 – Design Specification versus actual performance
Parameter Specified/Design Actual
pH None 5.9
TOC Removal (%) >97 >99
Ammonia Removal (%) >90 >94
TDS Removal (%) >97 >97
MF Filtrate Turbidity (NTU) ≤0.1 ≤0.1
2.2 Reliability and Safety of Plant Design and Operation
Potable reuse projects require more robust multiple barriers to chemical contaminants and microbial pathogens than conventional water treatment systems (NRC 1998). For water systems, the systematic reduction of risk to human health to waterborne contaminants is comprehensively known as “multiple barriers”. The provision of independent multiple barriers, or redundant safety measures, as well as a continuous, vigilant monitoring and surveillance programme will ensure the greatest level of safe, reliable operation of a potable reuse water system.
The NEWater Factory is designed with a number of fail-safe features to ensure the NEWater produced is of high quality, as well as protect the plant equipment from adverse operating conditions. Some of the fail-safe features are as follows:
• Routine membrane integrity testing;
• Standby units are provided for all critical equipment;
• Routine calibration and verification of the on-line monitoring instrumentation;
• Provision of automatic warning systems to alert the operator of abnormal plant conditions;
___________________________________________________________________________________
________________________________________________________________ Expert Panel Review and Findings Page AB-9
June 2002
• Automatic shutdown of the plant in the event of adverse operating conditions; and
• Computerised data acquisition and trending of the operational data in real-time.
2.3 Plant Production
The NEWater Factory has been challenge-tested to prove that the constructed plant could meet or better all design specification requirements. The trials proved that the plant is capable of a production capacity of 10,000 CMD (m3/d).
2.4 Water Recovery Rates
Water recovery for the RO membranes has been deliberately kept within the range of 80 to 82%. Operational experience shows that this water recovery rate is optimal to control organic fouling of the RO membranes and therefore decrease the frequency of membrane cleaning.
The CMF water recovery rate is below the design criteria of ≥90%, ranging from 84 to 90%, with an average of 87% (±1.9 standard deviation).
Despite these challenges, the NEWater Factory has shown itself to be reliable, robust and capable of producing consistently high quality NEWater, under a wide and diverse range of feedwater conditions.
2.5 Unit Power Consumption
To date the average unit power consumption at NEWater Factory has not varied from the range of 0.7 to 0.9 kWh/m3. This is better than the specification requirement of 1.2 kWh/m3.
2.6 Plant Feedwater Issues
Conductivity
Higher incoming Plant Feedwater conductivity causes plant production to decrease and the conductivity of NEWater to increase.
The designs of future full-production dual-membrane water reclamation plants have incorporated measures and features to minimise the impact of high variations in the Plant Feedwater conductivity.
___________________________________________________________________________________
________________________________________________________________ Expert Panel Review and Findings Page AB-10
June 2002
Turbidity
Operating experience gained from the NEWater Factory shows that the CMF could tolerate high turbidity up to 20 NTU without adversely affecting plant production. At turbidity below 2 NTU, the water recovery would be at least 90%, while at turbidity >10 NTU, the water recovery could be as low as 84%.
2.7 CMF Operations
The average CMF membrane cleaning frequency at 13.4 days betters the specified design requirement of 10 days per clean per unit.
2.8 RO Operations
A greater than six months RO membrane cleaning interval was achieved for the first stage of RO recovery, while a more than three months RO membrane cleaning interval was achieved for the second and third stages. These are much better than the 60 days design criteria.
2.9 UV Operations
Viruses, bacteria and parasites are removed after the RO process treatment. UV disinfection is provided as an added safeguard against microbial contaminants. UV light works by inactivating viruses, bacteria and parasites. The UV Disinfection System at NEWater Factory was designed for 4-log (99.99%) inactivation of microbes. Testing has shown that better than 7-log (99.99999%) is being achieved by the UV System.
2.10 Summary
After two years of operation, the NEWater Factory has demonstrated that NEWater can be consistently and reliably produced on a large scale.
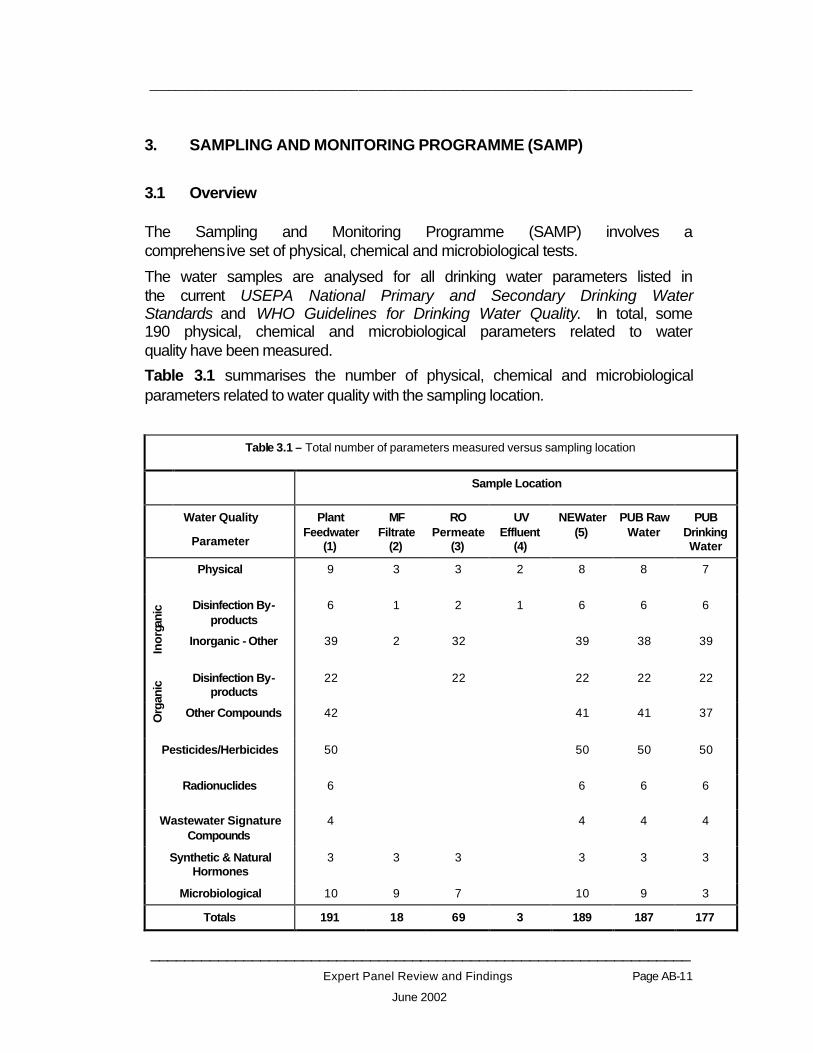
___________________________________________________________________________________
________________________________________________________________ Expert Panel Review and Findings Page AB-11
June 2002
3. SAMPLING AND MONITORING PROGRAMME (SAMP)
3.1 Overview
The Sampling and Monitoring Programme (SAMP) involves a comprehensive set of physical, chemical and microbiological tests.
The water samples are analysed for all drinking water parameters listed in the current USEPA National Primary and Secondary Drinking Water Standards and WHO Guidelines for Drinking Water Quality. In total, some 190 physical, chemical and microbiological parameters related to water quality have been measured. Table 3.1 summarises the number of physical, chemical and microbiological parameters related to water quality with the sampling location.
Table 3.1 – Total number of parameters measured versus sampling location
Sample Location
Water Quality
Parameter
Plant Feedwater
(1)
MF Filtrate
(2)
RO Permeate
(3)
UV Effluent
(4)
NEWater (5)
PUB Raw Water
PUB Drinking Water
Physical 9 3 3 2 8 8 7
Disinfection By-products
6 1 2 1 6 6 6
Ino
rgan
ic
Inorganic - Other 39 2 32 39 38 39
Disinfection By-products
22 22 22 22 22
Org
anic
Other Compounds 42 41 41 37
Pesticides/Herbicides 50 50 50 50
Radionuclides 6 6 6 6
Wastewater Signature Compounds
4 4 4 4
Synthetic & Natural Hormones
3 3 3 3 3 3
Microbiological 10 9 7 10 9 3
Totals 191 18 69 3 189 187 177
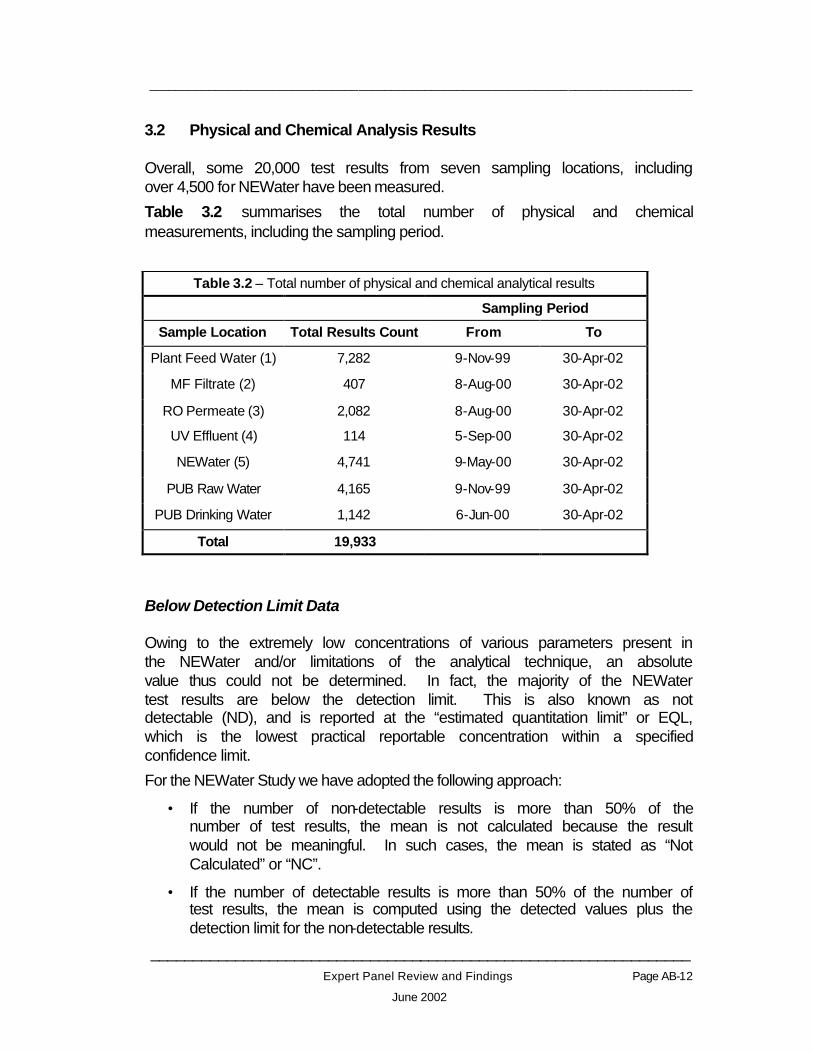
___________________________________________________________________________________
________________________________________________________________ Expert Panel Review and Findings Page AB-12
June 2002
3.2 Physical and Chemical Analysis Results
Overall, some 20,000 test results from seven sampling locations, including over 4,500 for NEWater have been measured. Table 3.2 summarises the total number of physical and chemical measurements, including the sampling period.
Table 3.2 – Total number of physical and chemical analytical results
Sampling Period
Sample Location Total Results Count From To
Plant Feed Water (1) 7,282 9-Nov-99 30-Apr-02
MF Filtrate (2) 407 8-Aug-00 30-Apr-02
RO Permeate (3) 2,082 8-Aug-00 30-Apr-02
UV Effluent (4) 114 5-Sep-00 30-Apr-02
NEWater (5) 4,741 9-May-00 30-Apr-02
PUB Raw Water 4,165 9-Nov-99 30-Apr-02
PUB Drinking Water 1,142 6-Jun-00 30-Apr-02
Total 19,933
Below Detection Limit Data
Owing to the extremely low concentrations of various parameters present in the NEWater and/or limitations of the analytical technique, an absolute value thus could not be determined. In fact, the majority of the NEWater test results are below the detection limit. This is also known as not detectable (ND), and is reported at the “estimated quantitation limit” or EQL, which is the lowest practical reportable concentration within a specified confidence limit. For the NEWater Study we have adopted the following approach:
• If the number of non-detectable results is more than 50% of the number of test results, the mean is not calculated because the result would not be meaningful. In such cases, the mean is stated as “Not Calculated” or “NC”.
• If the number of detectable results is more than 50% of the number of test results, the mean is computed using the detected values plus the detection limit for the non-detectable results.

___________________________________________________________________________________
________________________________________________________________ Expert Panel Review and Findings Page AB-13
June 2002
• A mean will not be computed if the number of test results is fewer than seven. Some of the newer tests may fall into this category.
It should be noted that this method of handling non-detectable data will tend to slightly overestimate the arithmetic mean.
It is necessary to stress that the lowest or more stringent of either the current USEPA National Primary and Secondary Drinking Water Standards or WHO Guidelines for Drinking Water Quality has been used in these comparisons.
Physical Characteristics
Overall data have demonstrated that NEWater achieves the current drinking water quality standards and guidelines for all physical water quality parameters, with the minor exception of pH that averages around pH 5.9. The pH of USEPA and WHO standard/guideline are set at a range 6.5 to 8.5 for aesthetics and corrosion protection reasons.
However, the pH increases to seven upon standing and exposure to open air for two to three hours. This is due to the release of dissolved carbon dioxide present in NEWater after RO treatment. Table 3.3 is a summary of the physical water quality results for NEWater. True colour in NEWater was not detectable in any of the 96 samples collected and tested.
Table 3.3 – Summary of NEWater physical water quality parameters with detectable results
Standard/Guideline Number of Results
Parameter Units USEPA WHO Mean* Min.* Max.* Total Detectable Not Detectable
pH Units 6.5-8.5 6.5-8.5 5.9 5.3 6.7 96 96 0
Temperature °C - - 29.6 26.4 30.9 7 7 0
Total dissolved solids (TDS)
mg/L 500 1,000 48.3 11 118 95 95 0
Turbidity NTU 5 5 NC ND 0.4 96 15 81
Conductivity µS/cm - - 92.2 28.6 256 96 96 0
Suspended Solids
mg/L - - NC ND 0.6 94 1 93
UV 254 Absorbance
cm-1 - - NC ND 0.011 96 6 90
*Notes:
1. NC – Not calculated.
2. ND – Not detectable (below detectable concentration).
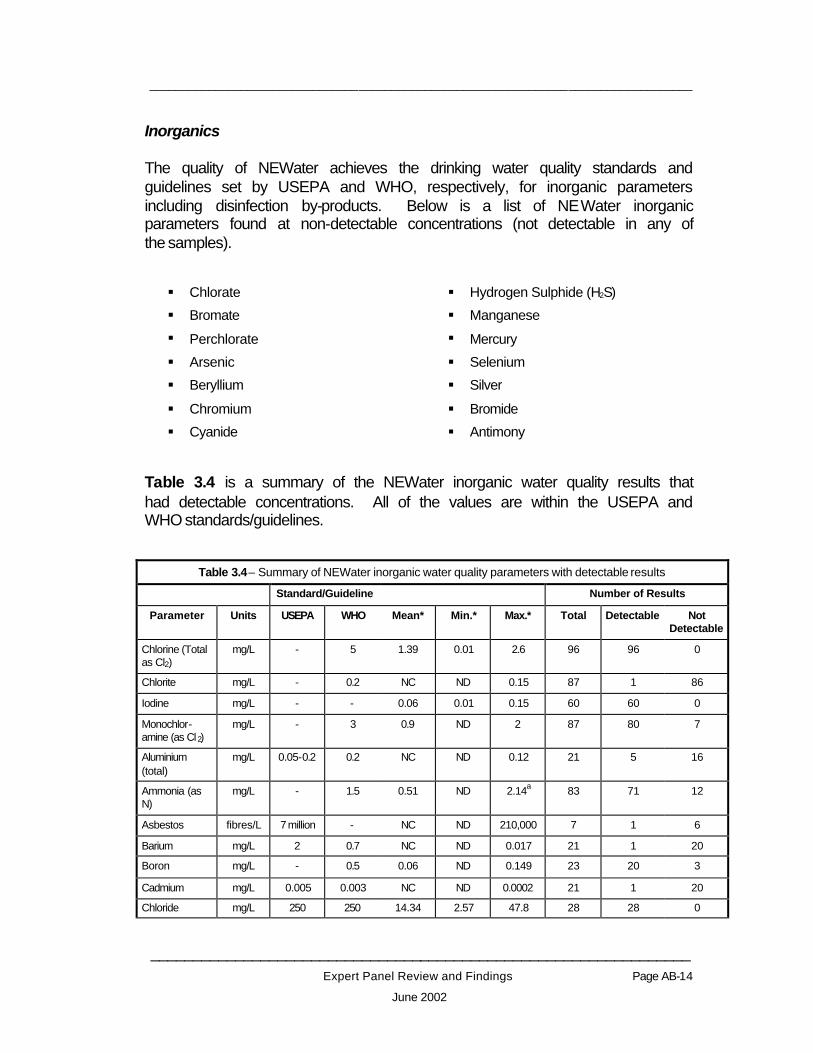
___________________________________________________________________________________
________________________________________________________________ Expert Panel Review and Findings Page AB-14
June 2002
Inorganics
The quality of NEWater achieves the drinking water quality standards and guidelines set by USEPA and WHO, respectively, for inorganic parameters including disinfection by-products. Below is a list of NEWater inorganic parameters found at non-detectable concentrations (not detectable in any of the samples).
§ Chlorate § Hydrogen Sulphide (H2S)
§ Bromate § Manganese
§ Perchlorate § Mercury
§ Arsenic § Selenium
§ Beryllium § Silver
§ Chromium § Bromide
§ Cyanide § Antimony
Table 3.4 is a summary of the NEWater inorganic water quality results that had detectable concentrations. All of the values are within the USEPA and WHO standards/guidelines.
Table 3.4 – Summary of NEWater inorganic water quality parameters with detectable results
Standard/Guideline Number of Results
Parameter Units USEPA WHO Mean* Min.* Max.* Total Detectable Not Detectable
Chlorine (Total as Cl2)
mg/L - 5 1.39 0.01 2.6 96 96 0
Chlorite mg/L - 0.2 NC ND 0.15 87 1 86
Iodine mg/L - - 0.06 0.01 0.15 60 60 0
Monochlor-amine (as Cl2)
mg/L - 3 0.9 ND 2 87 80 7
Aluminium (total)
mg/L 0.05-0.2 0.2 NC ND 0.12 21 5 16
Ammonia (as N)
mg/L - 1.5 0.51 ND 2.14a 83 71 12
Asbestos fibres/L 7 million - NC ND 210,000 7 1 6
Barium mg/L 2 0.7 NC ND 0.017 21 1 20
Boron mg/L - 0.5 0.06 ND 0.149 23 20 3
Cadmium mg/L 0.005 0.003 NC ND 0.0002 21 1 20
Chloride mg/L 250 250 14.34 2.57 47.8 28 28 0

___________________________________________________________________________________
________________________________________________________________ Expert Panel Review and Findings Page AB-15
June 2002
Copper mg/L 1.3 2 NC ND 0.003 21 1 20
Fluoride mg/L 4 1.5 0.16 0.04 0.41 28 28 0
Iron mg/L 0.3 0.3 NC ND 0.009 28 5 23
Lead mg/L 0.015 0.01 NC ND 0.002 21 4 17
Molybdenum mg/L - 0.07 NC ND 0.018 21 1 20
Nickel mg/L - 0.02 NC ND 0.013 21 1 20
Nitrate (as N) mg/L 10 11.3 2.01 0.02 5.4 44 44 0
Nitrite (as N) mg/L 1 0.91 NC ND 0.38 28 8 20
Sodium mg/L - 200 13.35 3.16 42.1 28 28 0
Sulphate mg/L 250 250 0.15 ND 0.54 28 22 6
Thallium mg/L 0.002 - NC ND 0.0018 21 3 18
Zinc mg/L 5 3 NC ND 0.041 21 2 19
Calcium mg/L - - 0.17 0.044 0.514 21 21 0
Potassium mg/L - - 1.08 0.504 3.07 10 10 0
Silica (SiO2) mg/L - - 0.88 ND 4.95 17 15 2
Strontium (Sr2+)
mg/L - - NC ND 0.021 21 3 18
Total Alkalinity mg/L - - 8.63 5 16 21 21 0
Total Nitrogen mg/L - - 3.28 ND 11 20 19 1
Total Phosphorous
mg/L - - 0.03 ND 0.084 21 19 2
Magnesium mg/L - - 0.13 0.03 0.45 10 10 0 a An outlier one out of 83 determinations. Not statistically significant.
*Notes:
1. NC – Not calculated.
2. ND – Not detectable (below detectable concentration).
3. Original monochloramine values have been converted to mg/L as chlorine.
Organic Compounds
Below is a list of the NEWater organic compounds that had non-detectable concentrations (not detectable in any of the samples).
§ Chloropicrin § 1,3-Dichlorobenzene
§ Cyanogen chloride (as cyanide) § 1,4-Dichlorobenzene
§ Chloral Hydrate (trichloroacetaldehyde) § 1,2,4-Trichlorobenzene
§ Chloroacetic acid § Trichlorobenzenes (total)
§ Dichloroacetic acid (DCAA) § Carbon Tetrachloride
§ Trichloroacetic acid (TCAA) § Dichloromethane (methylene chloride)

___________________________________________________________________________________
________________________________________________________________ Expert Panel Review and Findings Page AB-16
June 2002
§ 2-chlorophenol § 1,1-Dichloroethane
§ 2,4-dichlorophenol § 1,2-Dichloroethane
§ 2,4,6-Trichlorophenol § 1,1,1-Trichloroethane
§ Dichloroacetonitrile § 1,1,2-Trichloroethane
§ Trichloroacetonitrile § 1,1-Dichloroethene
§ Dibromoacetonitrile § 1,2-Dichloroethene (cis & trans)
§ Bromochloroacetonitrile § Tetrachloroethene
§ Acrylamide § Vinyl Chloride
§ Epichlorohydrin § Tributyltin oxide
§ Hexachlorobutadiene § Di(2-ethylhexyl) phthalate
§ Microcystin-LR § Di(2-ethylhexyl) adipate
§ Polychlorinated biphenyls (PCBs) § Benzo(a)pyrene
§ Benzene § Dioxin (2,3,7,8-TCDD)
§ Ethylbenzene § Haloacetic Acids (HAA5)
§ Styrene § MTBE
§ Toluene § Mirex
§ Xylenes (total) § Furan (2,3,7,8-TCDF)
§ Chlorobenzene § Haloacetic Acids (HAA7)
§ 1,2-Dichlorobenzene
Table 3.5 is a summary of the NEWater organic compounds that had occasionally been detected, but these concentrations are within the USEPA and WHO standards/guidelines or considered insignificant because of rarity and/or low concentrations.
Table 3.5 – Summary of NEWater organic compounds with detectable results
Standard/Guideline Number of Results
Parameter Units USEPA WHO Mean* Min.* Max.* Total Detectable Not Detectable
Total Trihalomethanes (THM's)
µg/L 80 R<1 (see notes
below)
NC ND 86.5a 53 1 52
Bromodichloro-methane
µg/L - 60 NC ND 7.9 53 4 49
Bromoform (CHBr 3)
µg/L - 100 NC ND 48.3 53 1 52
Chloroform (CHC13)
µg/L - 200 NC ND 5 53 1 52
Dibromochloro-methane
µg/L - 100 NC ND 25 53 4 49
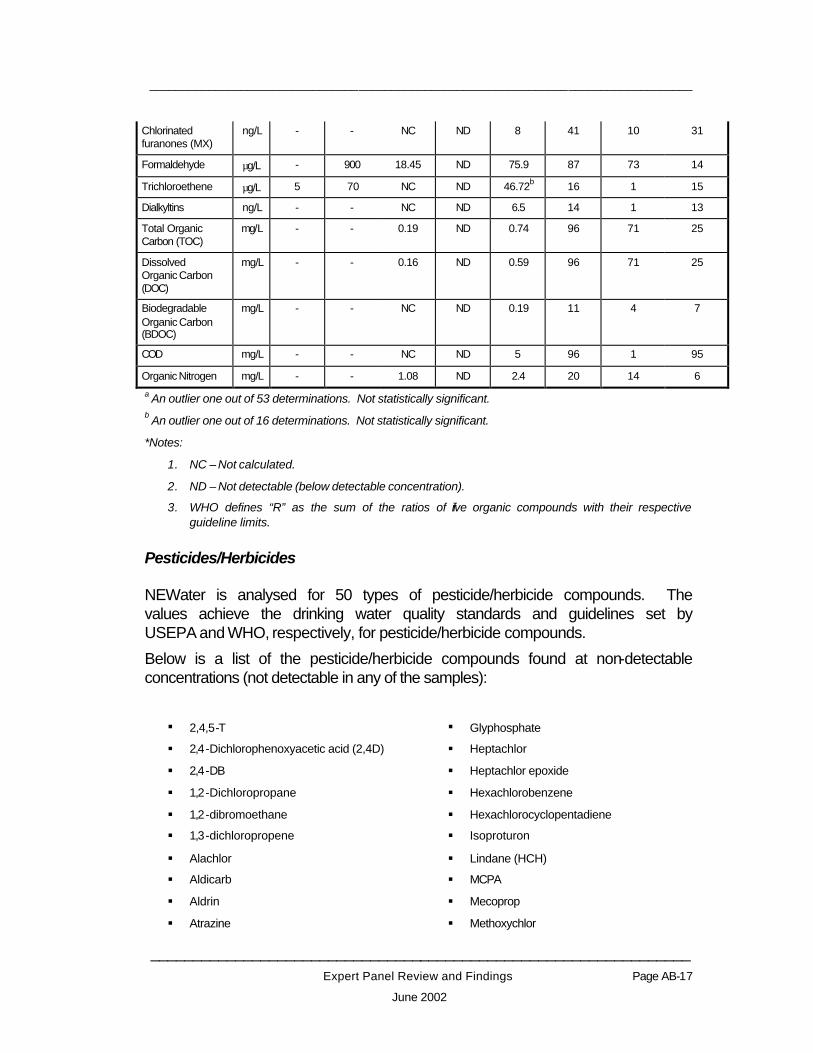
___________________________________________________________________________________
________________________________________________________________ Expert Panel Review and Findings Page AB-17
June 2002
Chlorinated furanones (MX)
ng/L - - NC ND 8 41 10 31
Formaldehyde µg/L - 900 18.45 ND 75.9 87 73 14
Trichloroethene µg/L 5 70 NC ND 46.72b 16 1 15
Dialkyltins ng/L - - NC ND 6.5 14 1 13
Total Organic Carbon (TOC)
mg/L - - 0.19 ND 0.74 96 71 25
Dissolved Organic Carbon (DOC)
mg/L - - 0.16 ND 0.59 96 71 25
Biodegradable Organic Carbon (BDOC)
mg/L - - NC ND 0.19 11 4 7
COD mg/L - - NC ND 5 96 1 95
Organic Nitrogen mg/L - - 1.08 ND 2.4 20 14 6 a An outlier one out of 53 determinations. Not statistically significant. b An outlier one out of 16 determinations. Not statistically significant.
*Notes:
1. NC – Not calculated.
2. ND – Not detectable (below detectable concentration).
3. WHO defines “R” as the sum of the ratios of five organic compounds with their respective guideline limits.
Pesticides/Herbicides
NEWater is analysed for 50 types of pesticide/herbicide compounds. The values achieve the drinking water quality standards and guidelines set by USEPA and WHO, respectively, for pesticide/herbicide compounds.
Below is a list of the pesticide/herbicide compounds found at non-detectable concentrations (not detectable in any of the samples):
§ 2,4,5-T § Glyphosphate
§ 2,4-Dichlorophenoxyacetic acid (2,4D) § Heptachlor
§ 2,4-DB § Heptachlor epoxide
§ 1,2-Dichloropropane § Hexachlorobenzene
§ 1,2-dibromoethane § Hexachlorocyclopentadiene
§ 1,3-dichloropropene § Isoproturon
§ Alachlor § Lindane (HCH)
§ Aldicarb § MCPA
§ Aldrin § Mecoprop
§ Atrazine § Methoxychlor
___________________________________________________________________________________
________________________________________________________________ Expert Panel Review and Findings Page AB-18
June 2002
§ Bentazone § Metolachlor
§ Carbofuran § Molinate
§ Chlorotoluron § Oxamyl
§ Cynazine § Pendimethalin
§ DDT and derivatives (total isomers) § Pentachlorophenol
§ Dalapon § Permethrin
§ Dinoseb § Picloram
§ Dichlorprop § Propanil
§ Dieldrin § Pyridate
§ Diquat § Silvex (2,4,5 -TP)
§ Endothall § Simazine
§ Endrin § Terbuthylazine (TBA)
§ Ethylene dibromide § Tifluralin
§ Fenoprop
Table 3.6 is a summary of the NEWater pesticide/herbicide compounds that had occasional detectable concentrations, but these concentrations are within the USEPA and WHO standards/guidelines or consider insignificant because of rarity and/or low concentrations.
Table 3.6– Summary of NEWater pesticide/herbicide compounds with detectable results
Standard/Guideline Number of Results
Parameter Units USEPA WHO Mean* Min.* Max.* Total Detectable Not Detectable
1,2-Dibromo-3-chloropropane (DBCP)
µg/L 0.2 1 NC ND 0.57a 23 1 22
Chlordane (total isomers)
µg/L 2 0.2 NC ND 0.02 18 3 15
Toxaphene µg/L 3 - NC ND 0.1 11 2 9
a An outlier one of 23 determinations. Not statistically significant.
*Notes:
1. NC – Not calculated.
2. ND – Not detectable (below detectable concentration).
Radionuclides
The radionuclide concentrations in NEWater are within the drinking water quality standards/guidelines stipulated by USEPA and WHO. Six
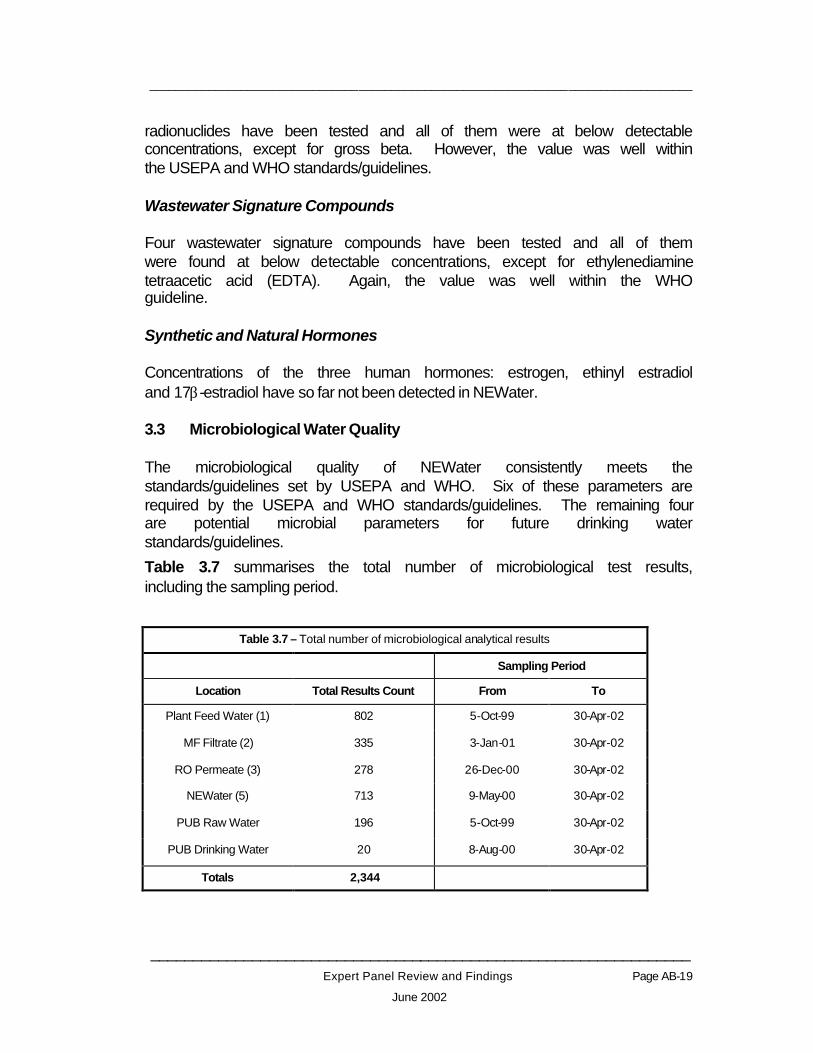
___________________________________________________________________________________
________________________________________________________________ Expert Panel Review and Findings Page AB-19
June 2002
radionuclides have been tested and all of them were at below detectable concentrations, except for gross beta. However, the value was well within the USEPA and WHO standards/guidelines.
Wastewater Signature Compounds
Four wastewater signature compounds have been tested and all of them were found at below detectable concentrations, except for ethylenediamine tetraacetic acid (EDTA). Again, the value was well within the WHO guideline.
Synthetic and Natural Hormones
Concentrations of the three human hormones: estrogen, ethinyl estradiol and 17β-estradiol have so far not been detected in NEWater.
3.3 Microbiological Water Quality
The microbiological quality of NEWater consistently meets the standards/guidelines set by USEPA and WHO. Six of these parameters are required by the USEPA and WHO standards/guidelines. The remaining four are potential microbial parameters for future drinking water standards/guidelines. Table 3.7 summarises the total number of microbiological test results, including the sampling period.
Table 3.7 – Total number of microbiological analytical results
Sampling Period
Location Total Results Count From To
Plant Feed Water (1) 802 5-Oct-99 30-Apr-02
MF Filtrate (2) 335 3-Jan-01 30-Apr-02
RO Permeate (3) 278 26-Dec-00 30-Apr-02
NEWater (5) 713 9-May-00 30-Apr-02
PUB Raw Water 196 5-Oct-99 30-Apr-02
PUB Drinking Water 20 8-Aug-00 30-Apr-02
Totals 2,344

___________________________________________________________________________________
________________________________________________________________ Expert Panel Review and Findings Page AB-20
June 2002
Table 3.8 is the summary of the SAMP microbiological results for NEWater.
Table 3.8 – Summary of NEWater microbiological results
Parameter Units Mean Min. Max. No. Samples
No. Detectable
No. Not Detectable
Faecal Coliforms
CFU/100 mL NC ND ND 99 0 99
Total Coliforms CFU/100 mL NC ND ND 99 0 99
HPC CFU/mL 5.2 1.1 80 97 80 17
Coliphage-Somatic*
PFU/100 mL NC ND ND 87 0 87
Coliphage-Male Specific*
PFU/100 mL NC ND ND 87 0 87
Enterococcus* CFU/100 mL NC ND 2.00E-01 99 1 98
Clostridium perfringens*
CFU/100 mL NC ND ND 91 0 91
Giardia cysts/100 L NC ND ND 16 0 16
Cryptosporidium oocysts/100 L NC ND ND 17 0 17
Enterovirus Present/Absent Absent - - 21 0 21
* These parameters are additional to those listed in the USEPA and WHO standards/guidelines.
Note:
1. ND = Not Detectable. NC = Not Calculated
2. Arithmetic means are shown.
Out of the 10 microbiological water quality parameters, only HPC (heterotrophic plate counts) are consistently detected in NEWater. The HPC concentration is well within the USEPA Drinking Water Standards. NEWater HPC concentration (5.2 CFU/mL) is lower than those observed for PUB Drinking Water (15.2 CFU/mL) and PUB Raw Water (3,850 CFU/mL)
Figure 3.1 plots the arithmetic means of total coliforms and faecal coliforms against sampling locations. The microfiltration, reverse osmosis and UV disinfection systems provides effective “multiple barriers” to microbial pathogens. The microfiltration process demonstrates a 4 to 5-log removal (99.99 to 99.999%) of faecal coliforms and total coliforms. The results for PUB Raw Water and PUB Drinking Water are shown for comparison purposes.

___________________________________________________________________________________
________________________________________________________________ Expert Panel Review and Findings Page AB-21
June 2002
Faecal & Total Coliforms (Means)
1.00E+00
1.00E+01
1.00E+02
1.00E+03
1.00E+04
1.00E+05
1.00E+06
1.00E+07
Plant F
eedw
ater
MF Filtra
te
RO Perm
eate
NEWate
r
PUB R
aw W
ater
PUB D
rinking
Wate
r
Sample Location
Co
nce
ntr
atio
n (C
FU
/100
mL
)
Faecal ColiformTotal Coliform
Figure 3.1 – Mean total and faecal coliforms at various treatment stages
3.4 Summary
The physical, chemical and microbiological data for NEWater are well within the latest requirements of the USEPA National Primary and Secondary Drinking Water Standards and WHO Drinking Water Quality Guidelines.

___________________________________________________________________________________
________________________________________________________________ Expert Panel Review and Findings Page AB-22
June 2002
4. HEALTH EFFECTS STUDY
4.1 Overview
The Health Effects Testing Programme (HETP) involves the evaluation of the long-term chronic toxicity and estrogenic effects of the NEWater product in comparison to PUB Raw Water (reservoir water); the latter is drawn from the Bedok Reservoir. The HETP is complementary to the comprehensive physical, chemical and microbiological SAMP discussed in Section 3 earlier and is ongoing.
The HETP is based on the use of mice and fish toxicological assessment. The mice test started in October 2000 and the final sacrifice is scheduled for October 2002, after 24 months of life-long exposure. The final pathological report will be due six months later in April 2003.
The fish toxicological and estrogenic study commenced in January 2001 and is ongoing. This study is expected to be completed by mid-2003.
4.2 Mice Study Results
The long-term chronic toxicity and carcinogenicity potential of NEWater compared to PUB Raw Water is being tested by the mice study. The test mouse is the B6C3F1 strain, one of the most sensitive mouse strains used for toxicological and carcinogenicity assessment. It is widely used for conducting long-term health effects studies of new pharmaceuticals.
Groups of mice are fed NEWater and PUB Raw Water concentrates at 500 and 150 times, over a period of 24 months, with sacrifices taking place after three, 12 and 24 months of exposure.
The mice study is scheduled for completion in October 2002, after 24 months of life-long exposure. Pathology reports received for the short- and long-term mice study at 3-month and 12-month exposure times show that the exposure to concentrated NEWater at 500 and 150 times does not cause any tissue abnormalities or health effects attributable to its consumption.
The final (life-long at 24-month exposure) sacrifice is scheduled for October 2002.
___________________________________________________________________________________
________________________________________________________________ Expert Panel Review and Findings Page AB-23
June 2002
4.3 Fish Study Results
Fish has been used in recent years as a model for human disease studies. The U.S. National Institute of Health (NIH) and National Research Council (NRC) have also recommended using this model for toxicological assessment.
The orange-red strain of the Japanese medaka fish (Oryzias latipes) is the test animal selected for the study because of its extensive biological database. The long-term chronic toxicity, as well as the estrogenic potential (reproductive and developmental) are currently being assessed.
The fish testing is conducted over a 12-month period with two generations of fish. The fish study commenced in January 2001. The pathology reports for the first and second fish generations showed no evidence of carcinogenic or estrogenic effects from exposure to NEWater.
However, the fish study is being repeated owing to design deficiencies of the aquarium system, fish husbandry issues and weaknesses in the study protocols. The Expert Panel requested the fish study be repeated with improvements to the study protocol. An extensive review of the fish study was completed with the collaboration of Agri-food and Veterinary Authority of Singapore (AVA). The repeat fish study commenced in late-April 2002 using the improved protocol, and is expected to be completed in mid-2003.
4.4 Summary
The HETP complements the comprehensive physical, chemical and microbiological SAMP. The ongoing HETP will provide further information on the safety of NEWater. The parallel use of mice and fish in long-term (carcinogenic and estrogenic potential) testing is unique and more sophisticated than previously reported health effects studies of water reclamation.
To date, the findings of the NEWater Study’s HETP show that exposure to or consumption of NEWater does not have carcinogenic (cancer causing) effect on the mice and fish, or estrogenic (reproductive or developmental interference) effect on the fish.
___________________________________________________________________________________
________________________________________________________________ Expert Panel Review and Findings Page AB-24
June 2002
5. EXPERT PANEL FINDINGS AND RECOMMENDATIONS
After evaluating the data and reports presented during the reviews, the Expert Panel has arrived at the following conclusions:
(a) NEWater is considered safe for potable use, based on the comprehensive physical, chemical and microbiological analysis of NEWater conducted over two years. The quality of NEWater consistently meets the latest requirements of the U.S. Environmental Protection Agency’s National Primary and Secondary Drinking Water Standards and World Health Organisation’s Drinking Water Quality Guidelines;
(b) Singapore should adopt the approach of indirect potable reuse (IPR) based on the following reasons:
• Blending with reservoir water will provide trace minerals, which have been removed in the reverse osmosis process, necessary for health and taste;
• Storage provides additional safety beyond the advanced technologies used to produce safe high quality NEWater;
• Public acceptance.
This approach is similar to the precedent practice in the U.S. with planned indirect potable reuse;
(c) The Singapore Government should consider the use of NEWater for indirect potable reuse, as it is a safe supplement to the existing water supply; and
(d) A vigilant and continuous monitoring and testing programme be carried out if a Planned IPR scheme is implemented.
*** End of Report ***

APPENDIX B
Locality Plan and Layout Schematics


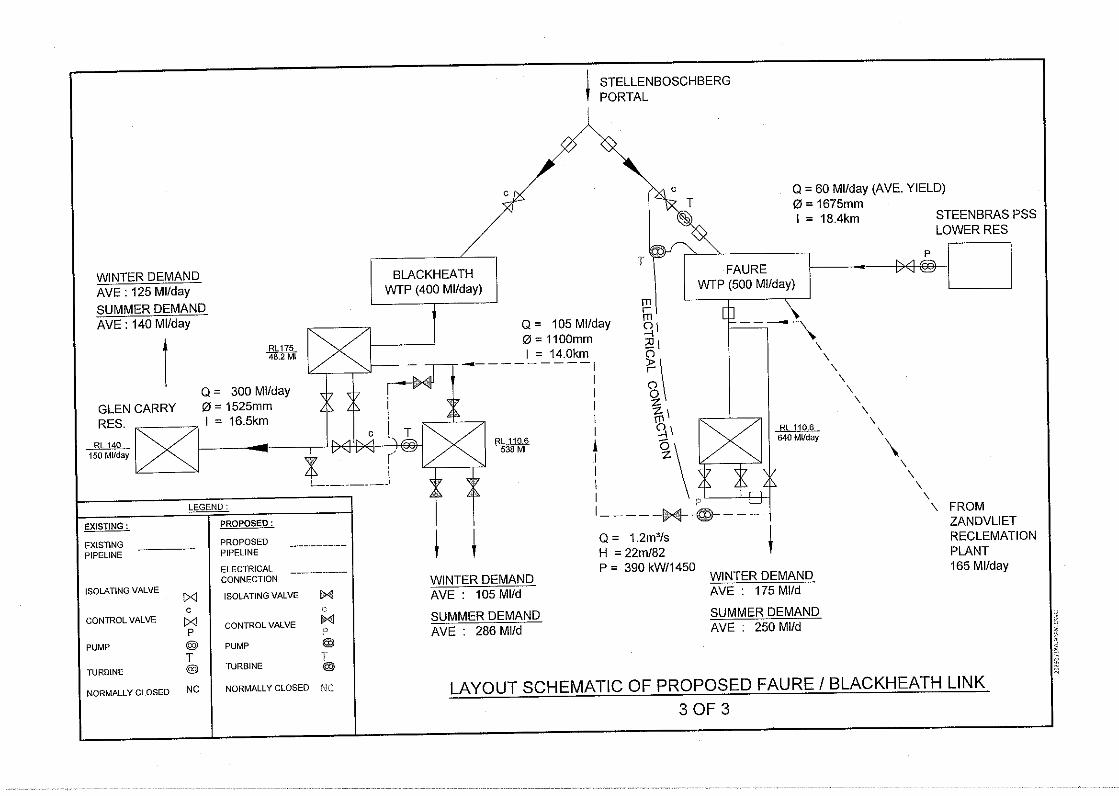
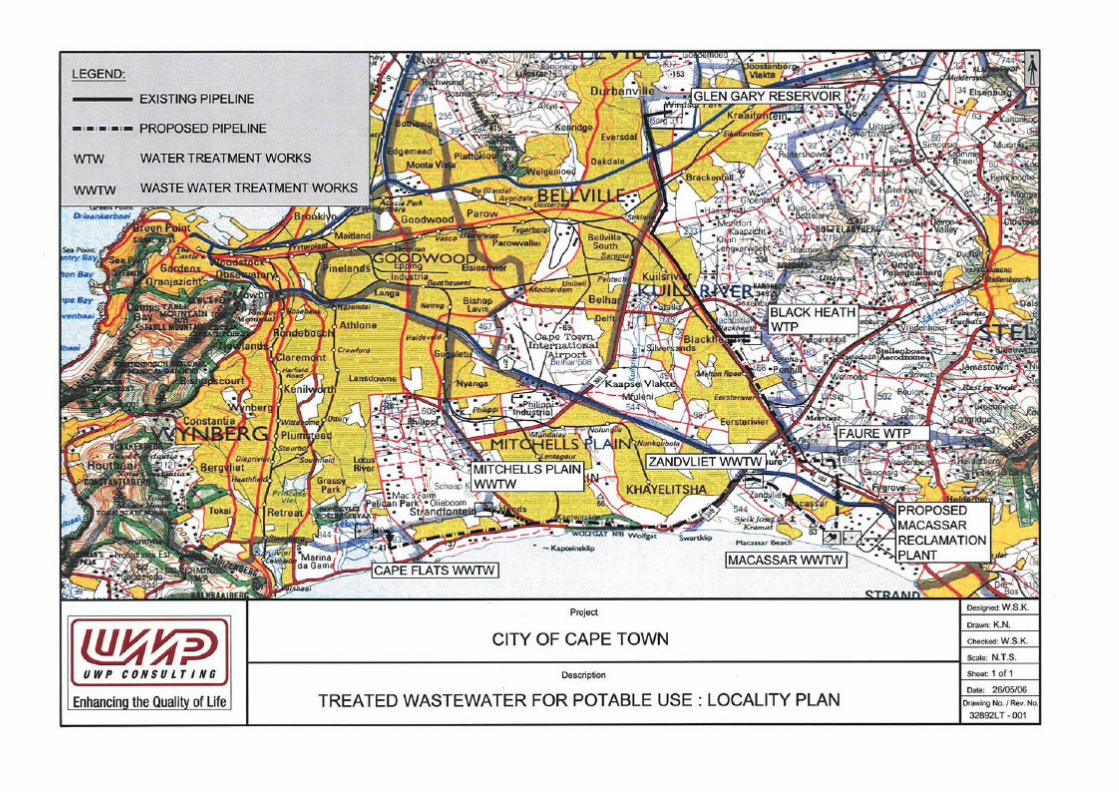

APPENDIX C Costing Tables
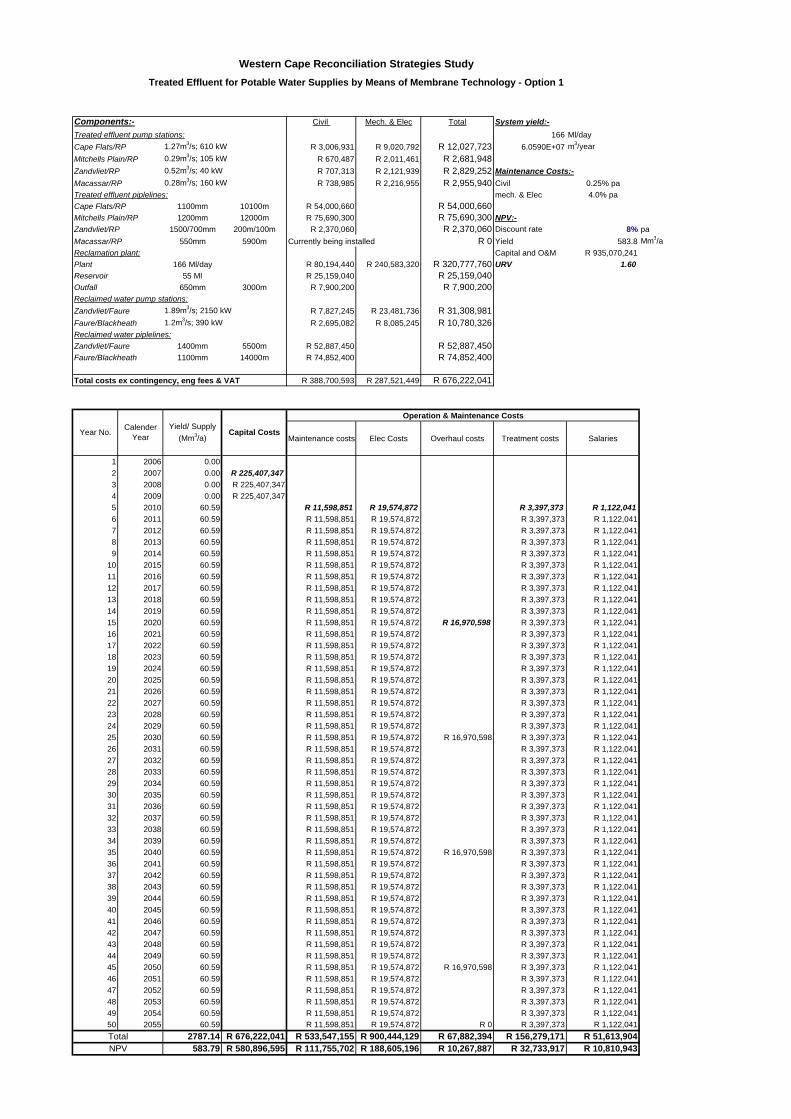
Components:- Civil Mech. & Elec Total System yield:-
Treated effluent pump stations: 166 Ml/dayCape Flats/RP 1.27m3/s; 610 kW R 3,006,931 R 9,020,792 R 12,027,723 6.0590E+07 m3/year
Mitchells Plain/RP 0.29m3/s; 105 kW R 670,487 R 2,011,461 R 2,681,948Zandvliet/RP 0.52m3/s; 40 kW R 707,313 R 2,121,939 R 2,829,252 Maintenance Costs:-Macassar/RP 0.28m3/s; 160 kW R 738,985 R 2,216,955 R 2,955,940 Civil 0.25% paTreated effluent piplelines: mech. & Elec 4.0% paCape Flats/RP 1100mm 10100m R 54,000,660 R 54,000,660Mitchells Plain/RP 1200mm 12000m R 75,690,300 R 75,690,300 NPV:-Zandvliet/RP 1500/700mm 200m/100m R 2,370,060 R 2,370,060 Discount rate 8% paMacassar/RP 550mm 5900m Currently being installed R 0 Yield 583.8 Mm3/aReclamation plant: Capital and O&M R 935,070,241Plant 166 Ml/day R 80,194,440 R 240,583,320 R 320,777,760 URV 1.60Reservoir 55 Ml R 25,159,040 R 25,159,040Outfall 650mm 3000m R 7,900,200 R 7,900,200Reclaimed water pump stations:
Zandvliet/Faure 1.89m3/s; 2150 kW R 7,827,245 R 23,481,736 R 31,308,981Faure/Blackheath 1.2m3/s; 390 kW R 2,695,082 R 8,085,245 R 10,780,326Reclaimed water piplelines:Zandvliet/Faure 1400mm 5500m R 52,887,450 R 52,887,450Faure/Blackheath 1100mm 14000m R 74,852,400 R 74,852,400
Total costs ex contingency, eng fees & VAT R 388,700,593 R 287,521,449 R 676,222,041
Maintenance costs Elec Costs Overhaul costs Treatment costs Salaries
1 2006 0.002 2007 0.00 R 225,407,3473 2008 0.00 R 225,407,3474 2009 0.00 R 225,407,3475 2010 60.59 R 11,598,851 R 19,574,872 R 3,397,373 R 1,122,0416 2011 60.59 R 11,598,851 R 19,574,872 R 3,397,373 R 1,122,0417 2012 60.59 R 11,598,851 R 19,574,872 R 3,397,373 R 1,122,0418 2013 60.59 R 11,598,851 R 19,574,872 R 3,397,373 R 1,122,0419 2014 60.59 R 11,598,851 R 19,574,872 R 3,397,373 R 1,122,041
10 2015 60.59 R 11,598,851 R 19,574,872 R 3,397,373 R 1,122,04111 2016 60.59 R 11,598,851 R 19,574,872 R 3,397,373 R 1,122,04112 2017 60.59 R 11,598,851 R 19,574,872 R 3,397,373 R 1,122,04113 2018 60.59 R 11,598,851 R 19,574,872 R 3,397,373 R 1,122,04114 2019 60.59 R 11,598,851 R 19,574,872 R 3,397,373 R 1,122,04115 2020 60.59 R 11,598,851 R 19,574,872 R 16,970,598 R 3,397,373 R 1,122,04116 2021 60.59 R 11,598,851 R 19,574,872 R 3,397,373 R 1,122,04117 2022 60.59 R 11,598,851 R 19,574,872 R 3,397,373 R 1,122,04118 2023 60.59 R 11,598,851 R 19,574,872 R 3,397,373 R 1,122,04119 2024 60.59 R 11,598,851 R 19,574,872 R 3,397,373 R 1,122,04120 2025 60.59 R 11,598,851 R 19,574,872 R 3,397,373 R 1,122,04121 2026 60.59 R 11,598,851 R 19,574,872 R 3,397,373 R 1,122,04122 2027 60.59 R 11,598,851 R 19,574,872 R 3,397,373 R 1,122,04123 2028 60.59 R 11,598,851 R 19,574,872 R 3,397,373 R 1,122,04124 2029 60.59 R 11,598,851 R 19,574,872 R 3,397,373 R 1,122,04125 2030 60.59 R 11,598,851 R 19,574,872 R 16,970,598 R 3,397,373 R 1,122,04126 2031 60.59 R 11,598,851 R 19,574,872 R 3,397,373 R 1,122,04127 2032 60.59 R 11,598,851 R 19,574,872 R 3,397,373 R 1,122,04128 2033 60.59 R 11,598,851 R 19,574,872 R 3,397,373 R 1,122,04129 2034 60.59 R 11,598,851 R 19,574,872 R 3,397,373 R 1,122,04130 2035 60.59 R 11,598,851 R 19,574,872 R 3,397,373 R 1,122,04131 2036 60.59 R 11,598,851 R 19,574,872 R 3,397,373 R 1,122,04132 2037 60.59 R 11,598,851 R 19,574,872 R 3,397,373 R 1,122,04133 2038 60.59 R 11,598,851 R 19,574,872 R 3,397,373 R 1,122,04134 2039 60.59 R 11,598,851 R 19,574,872 R 3,397,373 R 1,122,04135 2040 60.59 R 11,598,851 R 19,574,872 R 16,970,598 R 3,397,373 R 1,122,04136 2041 60.59 R 11,598,851 R 19,574,872 R 3,397,373 R 1,122,04137 2042 60.59 R 11,598,851 R 19,574,872 R 3,397,373 R 1,122,04138 2043 60.59 R 11,598,851 R 19,574,872 R 3,397,373 R 1,122,04139 2044 60.59 R 11,598,851 R 19,574,872 R 3,397,373 R 1,122,04140 2045 60.59 R 11,598,851 R 19,574,872 R 3,397,373 R 1,122,04141 2046 60.59 R 11,598,851 R 19,574,872 R 3,397,373 R 1,122,04142 2047 60.59 R 11,598,851 R 19,574,872 R 3,397,373 R 1,122,04143 2048 60.59 R 11,598,851 R 19,574,872 R 3,397,373 R 1,122,04144 2049 60.59 R 11,598,851 R 19,574,872 R 3,397,373 R 1,122,04145 2050 60.59 R 11,598,851 R 19,574,872 R 16,970,598 R 3,397,373 R 1,122,04146 2051 60.59 R 11,598,851 R 19,574,872 R 3,397,373 R 1,122,04147 2052 60.59 R 11,598,851 R 19,574,872 R 3,397,373 R 1,122,04148 2053 60.59 R 11,598,851 R 19,574,872 R 3,397,373 R 1,122,04149 2054 60.59 R 11,598,851 R 19,574,872 R 3,397,373 R 1,122,04150 2055 60.59 R 11,598,851 R 19,574,872 R 0 R 3,397,373 R 1,122,041
2787.14 R 676,222,041 R 533,547,155 R 900,444,129 R 67,882,394 R 156,279,171 R 51,613,904583.79 R 580,896,595 R 111,755,702 R 188,605,196 R 10,267,887 R 32,733,917 R 10,810,943NPV
Year No.
Western Cape Reconciliation Strategies Study
Treated Effluent for Potable Water Supplies by Means of Membrane Technology - Option 1
Total
Operation & Maintenance Costs
Capital CostsYield/ Supply
(Mm3/a)Calender
Year
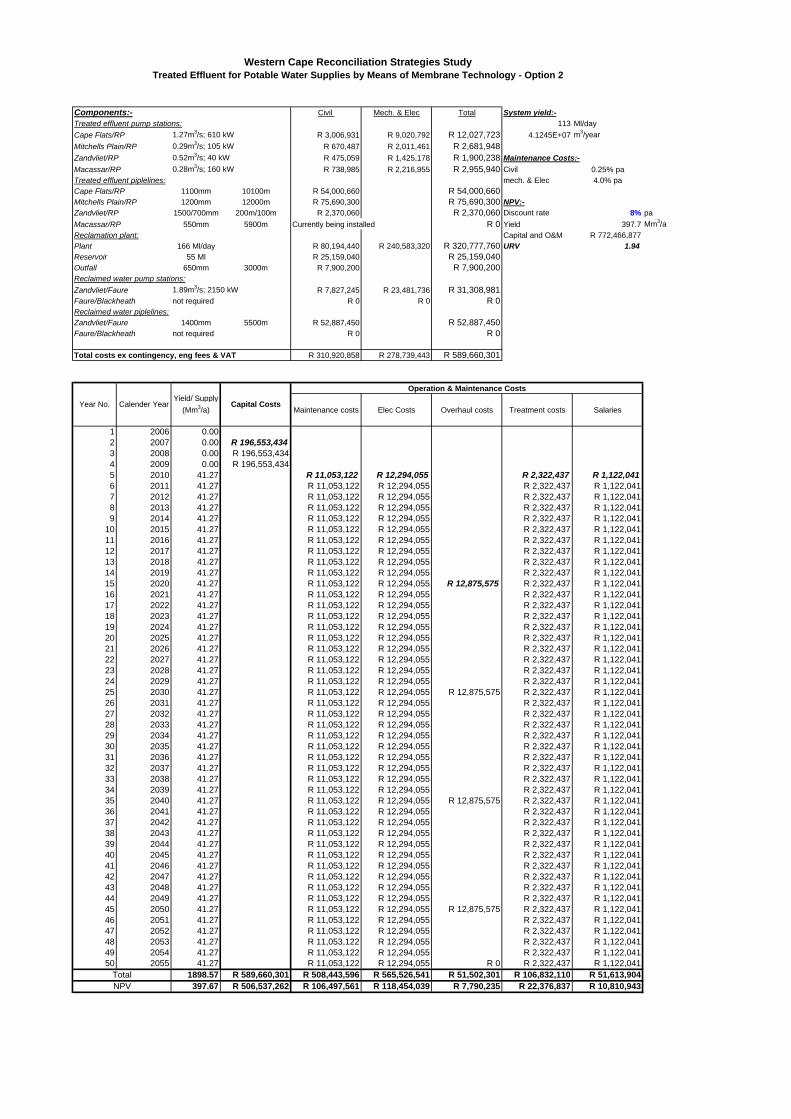
Components:- Civil Mech. & Elec Total System yield:-Treated effluent pump stations: 113 Ml/dayCape Flats/RP 1.27m3/s; 610 kW R 3,006,931 R 9,020,792 R 12,027,723 4.1245E+07 m3/yearMitchells Plain/RP 0.29m3/s; 105 kW R 670,487 R 2,011,461 R 2,681,948Zandvliet/RP 0.52m3/s; 40 kW R 475,059 R 1,425,178 R 1,900,238 Maintenance Costs:-Macassar/RP 0.28m3/s; 160 kW R 738,985 R 2,216,955 R 2,955,940 Civil 0.25% paTreated effluent piplelines: mech. & Elec 4.0% paCape Flats/RP 1100mm 10100m R 54,000,660 R 54,000,660Mitchells Plain/RP 1200mm 12000m R 75,690,300 R 75,690,300 NPV:-Zandvliet/RP 1500/700mm 200m/100m R 2,370,060 R 2,370,060 Discount rate 8% paMacassar/RP 550mm 5900m Currently being installed R 0 Yield 397.7 Mm3/aReclamation plant: Capital and O&M R 772,466,877Plant 166 Ml/day R 80,194,440 R 240,583,320 R 320,777,760 URV 1.94Reservoir 55 Ml R 25,159,040 R 25,159,040Outfall 650mm 3000m R 7,900,200 R 7,900,200Reclaimed water pump stations:Zandvliet/Faure 1.89m3/s; 2150 kW R 7,827,245 R 23,481,736 R 31,308,981Faure/Blackheath not required R 0 R 0 R 0Reclaimed water piplelines:Zandvliet/Faure 1400mm 5500m R 52,887,450 R 52,887,450Faure/Blackheath not required R 0 R 0
Total costs ex contingency, eng fees & VAT R 310,920,858 R 278,739,443 R 589,660,301
Maintenance costs Elec Costs Overhaul costs Treatment costs Salaries
1 2006 0.002 2007 0.00 R 196,553,4343 2008 0.00 R 196,553,4344 2009 0.00 R 196,553,4345 2010 41.27 R 11,053,122 R 12,294,055 R 2,322,437 R 1,122,0416 2011 41.27 R 11,053,122 R 12,294,055 R 2,322,437 R 1,122,0417 2012 41.27 R 11,053,122 R 12,294,055 R 2,322,437 R 1,122,0418 2013 41.27 R 11,053,122 R 12,294,055 R 2,322,437 R 1,122,0419 2014 41.27 R 11,053,122 R 12,294,055 R 2,322,437 R 1,122,041
10 2015 41.27 R 11,053,122 R 12,294,055 R 2,322,437 R 1,122,04111 2016 41.27 R 11,053,122 R 12,294,055 R 2,322,437 R 1,122,04112 2017 41.27 R 11,053,122 R 12,294,055 R 2,322,437 R 1,122,04113 2018 41.27 R 11,053,122 R 12,294,055 R 2,322,437 R 1,122,04114 2019 41.27 R 11,053,122 R 12,294,055 R 2,322,437 R 1,122,04115 2020 41.27 R 11,053,122 R 12,294,055 R 12,875,575 R 2,322,437 R 1,122,04116 2021 41.27 R 11,053,122 R 12,294,055 R 2,322,437 R 1,122,04117 2022 41.27 R 11,053,122 R 12,294,055 R 2,322,437 R 1,122,04118 2023 41.27 R 11,053,122 R 12,294,055 R 2,322,437 R 1,122,04119 2024 41.27 R 11,053,122 R 12,294,055 R 2,322,437 R 1,122,04120 2025 41.27 R 11,053,122 R 12,294,055 R 2,322,437 R 1,122,04121 2026 41.27 R 11,053,122 R 12,294,055 R 2,322,437 R 1,122,04122 2027 41.27 R 11,053,122 R 12,294,055 R 2,322,437 R 1,122,04123 2028 41.27 R 11,053,122 R 12,294,055 R 2,322,437 R 1,122,04124 2029 41.27 R 11,053,122 R 12,294,055 R 2,322,437 R 1,122,04125 2030 41.27 R 11,053,122 R 12,294,055 R 12,875,575 R 2,322,437 R 1,122,04126 2031 41.27 R 11,053,122 R 12,294,055 R 2,322,437 R 1,122,04127 2032 41.27 R 11,053,122 R 12,294,055 R 2,322,437 R 1,122,04128 2033 41.27 R 11,053,122 R 12,294,055 R 2,322,437 R 1,122,04129 2034 41.27 R 11,053,122 R 12,294,055 R 2,322,437 R 1,122,04130 2035 41.27 R 11,053,122 R 12,294,055 R 2,322,437 R 1,122,04131 2036 41.27 R 11,053,122 R 12,294,055 R 2,322,437 R 1,122,04132 2037 41.27 R 11,053,122 R 12,294,055 R 2,322,437 R 1,122,04133 2038 41.27 R 11,053,122 R 12,294,055 R 2,322,437 R 1,122,04134 2039 41.27 R 11,053,122 R 12,294,055 R 2,322,437 R 1,122,04135 2040 41.27 R 11,053,122 R 12,294,055 R 12,875,575 R 2,322,437 R 1,122,04136 2041 41.27 R 11,053,122 R 12,294,055 R 2,322,437 R 1,122,04137 2042 41.27 R 11,053,122 R 12,294,055 R 2,322,437 R 1,122,04138 2043 41.27 R 11,053,122 R 12,294,055 R 2,322,437 R 1,122,04139 2044 41.27 R 11,053,122 R 12,294,055 R 2,322,437 R 1,122,04140 2045 41.27 R 11,053,122 R 12,294,055 R 2,322,437 R 1,122,04141 2046 41.27 R 11,053,122 R 12,294,055 R 2,322,437 R 1,122,04142 2047 41.27 R 11,053,122 R 12,294,055 R 2,322,437 R 1,122,04143 2048 41.27 R 11,053,122 R 12,294,055 R 2,322,437 R 1,122,04144 2049 41.27 R 11,053,122 R 12,294,055 R 2,322,437 R 1,122,04145 2050 41.27 R 11,053,122 R 12,294,055 R 12,875,575 R 2,322,437 R 1,122,04146 2051 41.27 R 11,053,122 R 12,294,055 R 2,322,437 R 1,122,04147 2052 41.27 R 11,053,122 R 12,294,055 R 2,322,437 R 1,122,04148 2053 41.27 R 11,053,122 R 12,294,055 R 2,322,437 R 1,122,04149 2054 41.27 R 11,053,122 R 12,294,055 R 2,322,437 R 1,122,04150 2055 41.27 R 11,053,122 R 12,294,055 R 0 R 2,322,437 R 1,122,041
1898.57 R 589,660,301 R 508,443,596 R 565,526,541 R 51,502,301 R 106,832,110 R 51,613,904397.67 R 506,537,262 R 106,497,561 R 118,454,039 R 7,790,235 R 22,376,837 R 10,810,943NPV
Total
Western Cape Reconciliation Strategies StudyTreated Effluent for Potable Water Supplies by Means of Membrane Technology - Option 2
Year No. Calender YearYield/ Supply
(Mm3/a)Capital Costs
Operation & Maintenance Costs
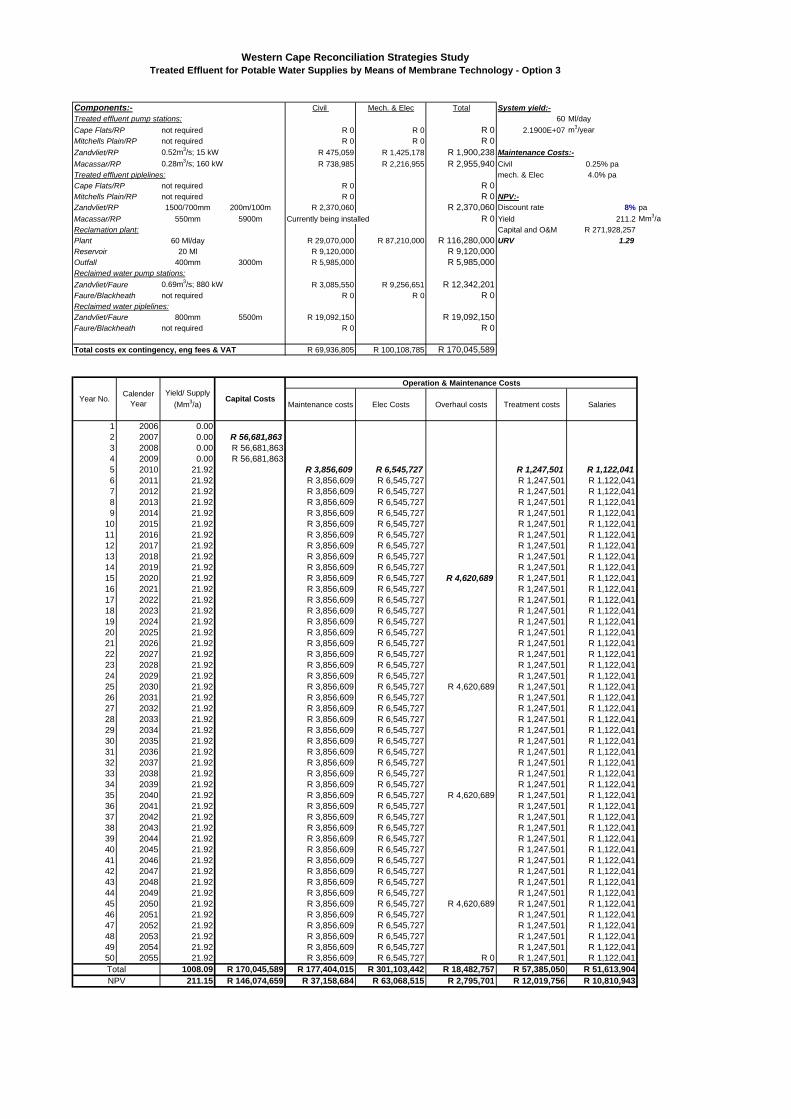
Components:- Civil Mech. & Elec Total System yield:-Treated effluent pump stations: 60 Ml/dayCape Flats/RP not required R 0 R 0 R 0 2.1900E+07 m3/yearMitchells Plain/RP not required R 0 R 0 R 0Zandvliet/RP 0.52m3/s; 15 kW R 475,059 R 1,425,178 R 1,900,238 Maintenance Costs:-Macassar/RP 0.28m3/s; 160 kW R 738,985 R 2,216,955 R 2,955,940 Civil 0.25% paTreated effluent piplelines: mech. & Elec 4.0% paCape Flats/RP not required R 0 R 0Mitchells Plain/RP not required R 0 R 0 NPV:-Zandvliet/RP 1500/700mm 200m/100m R 2,370,060 R 2,370,060 Discount rate 8% paMacassar/RP 550mm 5900m Currently being installed R 0 Yield 211.2 Mm3/aReclamation plant: Capital and O&M R 271,928,257Plant 60 Ml/day R 29,070,000 R 87,210,000 R 116,280,000 URV 1.29Reservoir 20 Ml R 9,120,000 R 9,120,000Outfall 400mm 3000m R 5,985,000 R 5,985,000Reclaimed water pump stations:Zandvliet/Faure 0.69m3/s; 880 kW R 3,085,550 R 9,256,651 R 12,342,201Faure/Blackheath not required R 0 R 0 R 0Reclaimed water piplelines:Zandvliet/Faure 800mm 5500m R 19,092,150 R 19,092,150Faure/Blackheath not required R 0 R 0
Total costs ex contingency, eng fees & VAT R 69,936,805 R 100,108,785 R 170,045,589
Maintenance costs Elec Costs Overhaul costs Treatment costs Salaries
1 2006 0.002 2007 0.00 R 56,681,8633 2008 0.00 R 56,681,8634 2009 0.00 R 56,681,8635 2010 21.92 R 3,856,609 R 6,545,727 R 1,247,501 R 1,122,0416 2011 21.92 R 3,856,609 R 6,545,727 R 1,247,501 R 1,122,0417 2012 21.92 R 3,856,609 R 6,545,727 R 1,247,501 R 1,122,0418 2013 21.92 R 3,856,609 R 6,545,727 R 1,247,501 R 1,122,0419 2014 21.92 R 3,856,609 R 6,545,727 R 1,247,501 R 1,122,041
10 2015 21.92 R 3,856,609 R 6,545,727 R 1,247,501 R 1,122,04111 2016 21.92 R 3,856,609 R 6,545,727 R 1,247,501 R 1,122,04112 2017 21.92 R 3,856,609 R 6,545,727 R 1,247,501 R 1,122,04113 2018 21.92 R 3,856,609 R 6,545,727 R 1,247,501 R 1,122,04114 2019 21.92 R 3,856,609 R 6,545,727 R 1,247,501 R 1,122,04115 2020 21.92 R 3,856,609 R 6,545,727 R 4,620,689 R 1,247,501 R 1,122,04116 2021 21.92 R 3,856,609 R 6,545,727 R 1,247,501 R 1,122,04117 2022 21.92 R 3,856,609 R 6,545,727 R 1,247,501 R 1,122,04118 2023 21.92 R 3,856,609 R 6,545,727 R 1,247,501 R 1,122,04119 2024 21.92 R 3,856,609 R 6,545,727 R 1,247,501 R 1,122,04120 2025 21.92 R 3,856,609 R 6,545,727 R 1,247,501 R 1,122,04121 2026 21.92 R 3,856,609 R 6,545,727 R 1,247,501 R 1,122,04122 2027 21.92 R 3,856,609 R 6,545,727 R 1,247,501 R 1,122,04123 2028 21.92 R 3,856,609 R 6,545,727 R 1,247,501 R 1,122,04124 2029 21.92 R 3,856,609 R 6,545,727 R 1,247,501 R 1,122,04125 2030 21.92 R 3,856,609 R 6,545,727 R 4,620,689 R 1,247,501 R 1,122,04126 2031 21.92 R 3,856,609 R 6,545,727 R 1,247,501 R 1,122,04127 2032 21.92 R 3,856,609 R 6,545,727 R 1,247,501 R 1,122,04128 2033 21.92 R 3,856,609 R 6,545,727 R 1,247,501 R 1,122,04129 2034 21.92 R 3,856,609 R 6,545,727 R 1,247,501 R 1,122,04130 2035 21.92 R 3,856,609 R 6,545,727 R 1,247,501 R 1,122,04131 2036 21.92 R 3,856,609 R 6,545,727 R 1,247,501 R 1,122,04132 2037 21.92 R 3,856,609 R 6,545,727 R 1,247,501 R 1,122,04133 2038 21.92 R 3,856,609 R 6,545,727 R 1,247,501 R 1,122,04134 2039 21.92 R 3,856,609 R 6,545,727 R 1,247,501 R 1,122,04135 2040 21.92 R 3,856,609 R 6,545,727 R 4,620,689 R 1,247,501 R 1,122,04136 2041 21.92 R 3,856,609 R 6,545,727 R 1,247,501 R 1,122,04137 2042 21.92 R 3,856,609 R 6,545,727 R 1,247,501 R 1,122,04138 2043 21.92 R 3,856,609 R 6,545,727 R 1,247,501 R 1,122,04139 2044 21.92 R 3,856,609 R 6,545,727 R 1,247,501 R 1,122,04140 2045 21.92 R 3,856,609 R 6,545,727 R 1,247,501 R 1,122,04141 2046 21.92 R 3,856,609 R 6,545,727 R 1,247,501 R 1,122,04142 2047 21.92 R 3,856,609 R 6,545,727 R 1,247,501 R 1,122,04143 2048 21.92 R 3,856,609 R 6,545,727 R 1,247,501 R 1,122,04144 2049 21.92 R 3,856,609 R 6,545,727 R 1,247,501 R 1,122,04145 2050 21.92 R 3,856,609 R 6,545,727 R 4,620,689 R 1,247,501 R 1,122,04146 2051 21.92 R 3,856,609 R 6,545,727 R 1,247,501 R 1,122,04147 2052 21.92 R 3,856,609 R 6,545,727 R 1,247,501 R 1,122,04148 2053 21.92 R 3,856,609 R 6,545,727 R 1,247,501 R 1,122,04149 2054 21.92 R 3,856,609 R 6,545,727 R 1,247,501 R 1,122,04150 2055 21.92 R 3,856,609 R 6,545,727 R 0 R 1,247,501 R 1,122,041
1008.09 R 170,045,589 R 177,404,015 R 301,103,442 R 18,482,757 R 57,385,050 R 51,613,904211.15 R 146,074,659 R 37,158,684 R 63,068,515 R 2,795,701 R 12,019,756 R 10,810,943
Western Cape Reconciliation Strategies StudyTreated Effluent for Potable Water Supplies by Means of Membrane Technology - Option 3
TotalNPV
Year No.Calender
YearYield/ Supply
(Mm3/a)Capital Costs
Operation & Maintenance Costs

APPENDIX D
Theoretical Power Output of the Turbine at the Faure Water Treatment Works
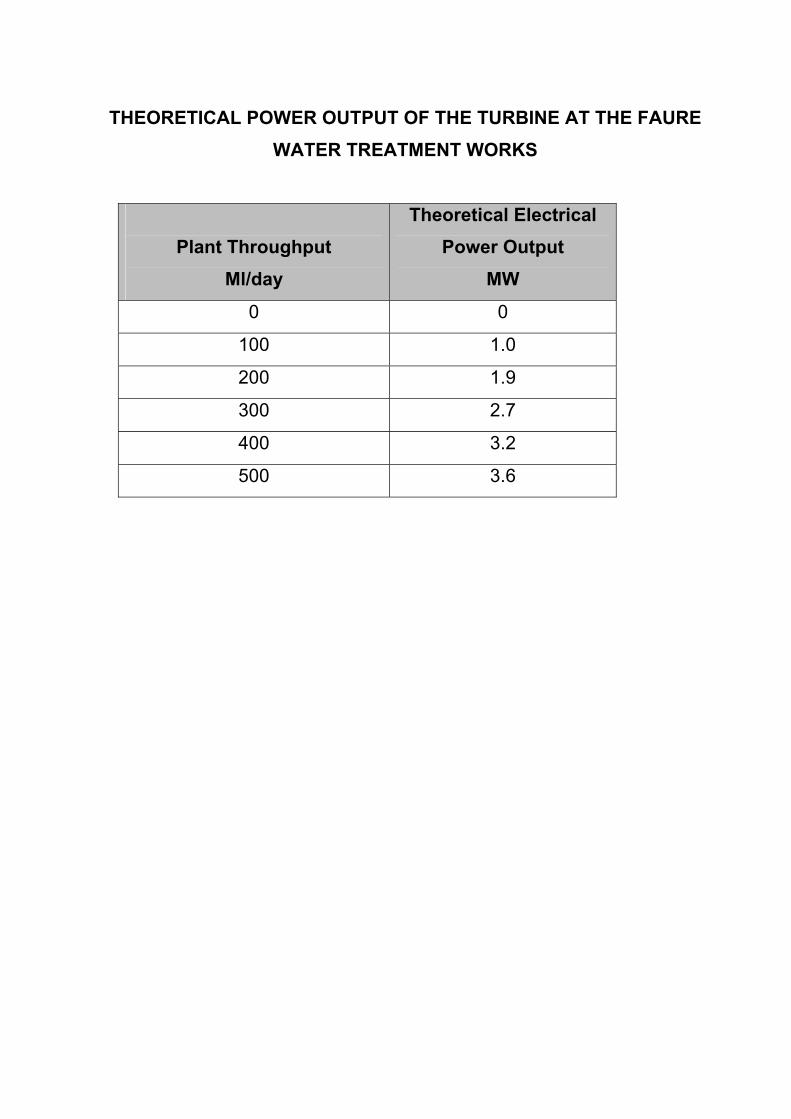
THEORETICAL POWER OUTPUT OF THE TURBINE AT THE FAURE WATER TREATMENT WORKS
Plant Throughput
Ml/day
Theoretical Electrical Power Output
MW
0 0
100 1.0
200 1.9
300 2.7
400 3.2
500 3.6