Embed Size (px)
Citation preview
Internal Strategic Perspective Internal Strategic Perspective
Thukela Water Management Area
Version 1
NOVEMBER 2004
DEPARTMENT OF WATER AFFAIRS AND FORESTRYDirectorate: National Water Resource Planning
REPORT NO: P WMA 07/000//00/0304
DEPARTMENT OF WATER AFFAIRS AND FORESTRY
DIRECTORATE: NATIONAL WATER RESOURCEPLANNING
INTERNAL STRATEGIC PERSPECTIVE:THUKELA WATER MANAGEMENT AREA
Version 1: November 2004

Thukela Water Management Area Internal Strategic Perspective
DEPARTMENT OF WATER AFFAIRS AND FORESTRYDIRECTORATE NATIONAL WATER RESOURCE PLANNING
INTERNAL STRATEGIC PERSPECTIVE
THUKELA WATER MANAGEMENT AREA
APPROVAL
Title Thukela WMA:Internal Strategic Perspective
DWAF Report No : P WMA 07/000/00/0304
Consultants : Tlou & Matji (Pty) Ltd in association with WRP (Pty) Ltd and DMM cc
Report Status : Version 1: November 2004
Version Controller : Mr N Ward
Date : November 2004
STUDY TEAM:
Approved for Tlou & Matji (Pty) Ltd
………………………………..SJL Mallory Director
DEPARTMENT OF WATER AFFAIRS AND FORESTRYDirectorate National Water Resource PlanningApproved for Department of Water Affairs and Forestry
……………………………….. ……………………………………NJ Van Wyk J A Van RooyenProject Manager Manager: NWRP
Page 1

Thukela Water Management Area Internal Strategic Perspective
REFERENCE
This report is to be referred to in bibliographies as:
Department of Water Affairs and Forestry, South Africa. 2004. Internal Strategic Perspective:Thukela Water Management Area : Prepared by Tlou & Matji (Pty) Ltd, WRP (Pty) Ltd, andDMM cc on behalf of the Directorate: National Water Resource Planning (East). DWAF ReportNo. P WMA 07/000/00/0304.
INVITATION TO COMMENT
This report will be updated on a regular basis until it is eventually superceded bythe Catchment Management Strategy. Water users and other stakeholders in theThukela WMA and other areas are encouraged to study this report and to submitany comments they may have to the Version Controller (see box overleaf).
ELECTRONIC VERSION
This report is also available in electronic format as follows:
· DWAF website:- Internet: http://www.dwaf.gov.za/documents/
· iiOn CD which can be obtained from the DWAF Map Office at:157 Schoeman Street, Pretoria (Emanzini Building)+27 12 336 7813mailto:[email protected]
or from the Version Controller (see box overleaf)
The CD contains the following reports (all available on DWAF website)
- Thukela Internal Strategic Perspective (This Report)(Report No: P WMA 07/000/00/0304
- The National Water Resource Strategy- The Thukela WMA – Overview of Water Resources Availability and
Utilisation (Report No: P WMA 07/000/00/0203- The Thukela WMA – Water Resources Situation Assessment
(Report No: P WMA 07/000/00/0301)
Page 2
Thukela Water Management Area Internal Strategic Perspective
LATEST VERSION
This report is a living document and will be updated on a regular basis. If theversion of this report is older than 12 months, please check whether a later versionis not available.
This can be done on the DWAF website: http://www.dwaf.gov.za/documents/
or by contacting the Version Controller (see box)
VERSION CONTROL
THUKELA WMAINTERNAL STRATEGIC PERSPECTIVE
Version 1 November 2004
(List of Previous Versions) (Dates)
Current Version Controller N Ward
DWAF KwaZulu-Natal RegionalOfficeP O Box 1018DURBAN4000+27 31 336 [email protected]
The most significant amendments included in the latest version will beindicated here.
Page 3

Thukela Water Management Area Internal Strategic Perspective
EXECUTIVE SUMMARY
1. INTRODUCTION
This Internal Strategic Perspective (ISP) aims to ensure synergy within the Department ofWater Affairs and Forestry (DWAF) regarding water resources management in the ThukelaWMA. The ISP presents a common and consistent departmental approach to guide officialswhen addressing water management related queries and evaluating water licence applications.
2. BACKGROUND AND APPROACH
Water is one of the key and most fundamental and indispensable of all our natural resources. Itis fundamental to life (and the quality of life), the environment, food production, hygiene,industry, and power generation. Water can be the limiting factor when it comes to economicgrowth and social development, especially in South Africa where it is a relatively scarceresource that is distributed unevenly both geographically and through time as well as socio-politically. Prosperity for South Africa depends upon sound management and utilisation of ourmany natural and other resources, with water playing a pivotal role.
DWAF is striving for an integrated planning and management approach, referred to asIntegrated Water Resource Management (IWRM). The ultimate aim of this IWRM process is toarrive at:
· an allocation schedule that meets the requirements of the National Water Act (NWA) (Act36 of 1998);
· water resources yield and other models that are representative of the flow regime of theriver systems in the area;
· management class scenarios for the river (i.e. Reserve and Resource Quality Objectivesset);
· a catchment management strategy
These deliverables can only be finalised once the Catchment Management Agencies (CMA)assume responsibility for managing the water resources of their respective Water ManagementAreas (WMA). In the interim, DWAF’s Regional Offices will continue to manage the waterresources in their area of jurisdiction until such time as they can hand over these managementfunctions to established and fully operational CMAs. In accordance with the NWA, DWAF (theMinister) will still remain ultimately responsible for the management of the water resources.
In light of this responsibility, DWAF’s corporate perspective (including all relevant Directoratesin the Department) on how the water resources should be managed needs to be formallyexpressed in order to manage the water resources in a consistent and predictable manner. Thepurpose of the ISP is to document these perspectives and offer sound motivation todemonstrate proper and reasonable governance.
3. OVERVIEW OF THE THUKELA WMA
The Thukela Water Management Area (WMA) consists of the entire catchment of the ThukelaRiver, also referred to as the ‘V’ Hydrological Drainage Region (Midgeley et al, 1994). TheThukela River rises in the Drakensberg mountains very close to the border with Lesotho andmeanders through central KwaZulu-Natal and discharges into the Indian Ocean (see Figure2.1). The Little Thukela, Klip, Bloukrans, Bushmans, Sundays, Mooi and Buffalo rivers are the
Page 4

Thukela Water Management Area Internal Strategic Perspective
major tributaries of the Thukela, which together make up the WMA with its 88 quaternarycatchments. The total area of the Thukela River catchment is approximately 30 000 km2 inextent.
Due to the mountainous nature of the Thukela WMA and its proximity to the Indian Ocean, therainfall is high by South African standards, ranging from over 1 500 mm per annum in themountains to about 650 mm per annum in the central parts of the catchment. As a result ofthe high rainfall, there is substantial runoff from the Thukela catchment, with the Mean AnnualRunoff (MAR), estimated at 3 799 million m3/a (DWAF, 2002a). Rainfall is however erratic andyears of prolonged drought in the central and lower catchment alternate with very wet periods.
For analysis and reporting purposes, the Thukela WMA was divided into catchment areas,referred to in this report as Key Areas. These Key Areas are defined as follows:
· Upper Thukela (tertiary catchments V11, V12, V14 and quaternaries, V60G, H and J);
· Little Thukela (tertiary catchment V13);
· Bushmans (tertiary catchment V70);
· Sundays (quaternary catchments V60A, B, C, D, E and F);
· Mooi (tertiary catchment V20);
· Buffalo (tertiary catchments V31, V32 and quaternaries, V33A and B);
· Lower Thukela (tertiary catchments V40, V50 and quaternaries, V33C, D and V60K);
· The locations of the various Key Areas are shown Figure 3.1. This figure also shows the
four sub-areas as defined and used for the balance calculations in the NWRS.
The Upper Thukela Key AreaThe Upper Thukela Key Area lies in the upper reaches of the Thukela River upstream of theconfluence with the Bushmans River and includes the towns of Bergville, Ladysmith, Colensoand Weenen. The Thukela and Klip Rivers are the main rivers in this catchment. This area isthe source of water for the Thukela-Vaal Transfer Scheme, which, inter alia, transfers water tothe Vaal River System. The transfer capacity of this scheme represents a large portion (about30%) of the water resources available in the Upper Vaal WMA, which is the economic heart ofSouth Africa.
The proposed Jana Dam, which forms part of the Thukela Water Project, will also be located inthis area on the Thukela River should this project proceed. It is important that the optimal long-term benefits be derived from the development of Thukela, and that both the national and localinterests be appropriately addressed.
Due to the strategic nature of the Upper Thukela, it is not surprising that by far the largest useof the water derived from this catchment is for transfer to the Vaal System. With theinfrastructure in place, consisting primarily of Woodstock Dam, Driel Barrage, canals and theEskom Pumped Storage scheme, it is possible to transfer on average 530 million m3/a to theVaal System. In contrast to this, local use within the Upper Thukela is estimated to be only 114million m3/a, with irrigation making up the bulk of this use (87 million m3/a) while urban use inthe towns of Ladysmith, Colenso and Bergville are also significant (17 million m3/a).
Despite the huge demands on the water resources of the Upper Thukela Key Area, there issurplus water available. This is due to the under-utilisation of the Spioenkop Dam which wasconstructed to supply local water requirements. New allocations can therefore be made in this
Page 5

Thukela Water Management Area Internal Strategic Perspective
Key Area, provided they are downstream of the Driel Barrage, so as not to impact on theThukela-Vaal transfer.
The Little Thukela Key AreaThe Little Thukela Key Area consists of the catchment of the Little Thukela River, a tributary ofthe Thukela River. The catchment is characterised by large irrigation requirements (36 millionm3/a) while the water resource remains relatively undeveloped. Other water use is insignificant.The only significant dam in this Key Area is the small Bell Park Dam. The upper areas of theKey Area are located in a nature reserve with the implication that no development in this area islikely. Areas adjacent to the nature reserve have however developed rapidly into popular touristresorts in recent years with the concomitant pressures of human habitation.
Due to limited water resources in the catchment and the large irrigation requirements, this KeyArea is considered to be stressed, with the water requirement far in excess of the sustainableyield. As a result there is no scope for any additional water allocations in this Key Area. Theconstruction of farm dams would be acceptable however since this would improve theassurance of supply to water users in this area.
Due to the stressed nature of this Key Area, the implementation of the ecological Reserve willbe problematical and it is recommended that this be done in a phased manner. Compulsorylicencing may be required in order to implement the Reserve fully.
The Bushmans Key AreaThe Bushmans Key Area consists of the Bushmans River catchment. This river rises in theDrakensberg Mountain range and flows in a north-easterly direction past the town of Estcourt tojoin the Thukela River near the town of Weenen.
Water use in this Key Area is dominated by irrigation, with an estimated requirement of 31million m3/a. The only significant town in the area is Escourt, with a water requirement of 4million m3/a.
The Wagendrift Dam, with a full supply capacity of 56 million m3, is situated in the BushmansRiver Key Area. It was constructed to supply irrigation and the town of Escourt but is currentlyunderutilised. The surplus could be allocated to emerging farmers, but this decision will need tobe carefully analysed in the light of the new allocations to the Fairbreeze mine and theecological Reserve of the lower Thukela, which will required support from either the Wagendriftor the Spioenkop Dam, or both.
Potential for further development of surface water resources exists and a site downstream ofthe Wagendrift Dam has been earmarked for the Mielietuin Dam which forms part of theThukela Water Project.
The Sundays River Key AreaThe Sundays River Key Area comprises the Sundays River catchment. The Sundays Riverflows in a south-easterly direction from the eastern escarpment to its confluence with theThukela River near the Bushmans River confluence.
Commercial dryland agriculture dominates the area and there are also fairly large tracts of tribal/ communal land in the lower reaches of the catchment. By far the largest water use in this KeyArea is irrigation, with an estimated requirement of 26 million m3/a. This is supplied from smallfarm dams or from run-of-river flows. Other than the Slangdraai Dam, which has a full supplycapacity of 10,3 million m3, there is no significant storage in this Key Area.
Coal mining abounds in the upper areas of the catchment which causes water quality problems.
Page 6

Thukela Water Management Area Internal Strategic Perspective
As with the Little Thukela Key Area, the water requirements of the Sundays River Key Area isfar in excess of the sustainable yield and the catchment is considered to be stressed. There issome doubt as to the balance in this Key Area, however, due to the huge discrepancy betweenthe registered irrigation water use and the irrigation water use estimated in other studies. Thisissue must be resolved before any further water allocations can be considered to the irrigationsector in this Key Area.
The Buffalo River Key AreaThe Buffalo River is the main northern tributary of the Thukela River and flows in a south-easterly direction from the eastern escarpment (Newcastle area) to its confluence with theThukela River near Nkandla. The area includes the towns of Dundee, Newcastle, Danhauser,Utrecht and Madadeni.
There are two major dams in the Buffalo River Key Area. These are the Ntshingwayo Dam(previously known as Chelmsford) with a full supply capacity of 199 million m3, and theZaaihoek Dam with a full supply capacity of 193 million m3. The Ntshingwayo Dam supplieswater to Newcastle while water is transferred out of the WMA from the Zaaihoek Dam to theUpper Vaal WMA.
While the largest water use in the Buffalo Key Area is again irrigation, with a requirement of 50million m3/a, domestic and industrial use are also significant in the Key Area, as are thetransfers out to the Upper Vaal WMA, estimated at 55 million m3.
There is surplus water available in the Buffalo River Key Area that can be allocated. Prioritymust be given to redressing of inequities and poverty eradication. Allocations must however bedealt with cautiously and the location of the surplus identified before making allocations. Newallocations should not be made upstream of the Zaaihoek or Ntshingwayo dams.
Water quality is a major concern in the Buffalo Key Area and the water quality in the BuffaloRiver all the way down to its confluence with the Thukela is considered to be very poor.
The Mooi River Key AreaThe Mooi River rises in the Drakensberg Mountains and flows parallel to the Bushmans Riverin a north-easterly direction to join the Thukela River near Muden. The only town of anysignificance in the catchment is Mooi River. The predominant land use in the catchment iscommercial agriculture and there is large-scale irrigation of pastures and summer cash crops,with an estimated water requirement of 49 million m3/a. The other large water use is transfersout to the Mgeni WMA. The transfer scheme situated at Mearns can transfer water at a rate ofup to 3.2 m3/s to the Mgeni River System.
The only major dam in this Key Area is Craigieburn Dam, with a capacity of 23.5 million m3.The dam supplements water supplies to approximately 2000 ha of predominantly citrusfarming irrigation downstream of the dam and along the Mooi River at Muden. However, thereis an abundance of farm dams in the Key Area, especially in the upper reaches of the MooiRiver.
The catchment currently experiences a small deficit, with the water requirements slightly inexcess of the available resource. There is a strong possibility that additional allocations arepossible for summer use only, but this will need to evaluated in more detail.
The Mooi River has long been recognised as the most feasible source from which to augmentthe Mgeni System. The first phase of the two-phase Mooi-Mgeni Transfer Scheme has already
Page 7
Thukela Water Management Area Internal Strategic Perspective
been implemented, this being the construction of the Mearns Weir and this is expected to befollowed shortly with the construction of the Spring Grove Dam.
The Lower Thukela Key AreaThe Lower Thukela Key Area consists of the Thukela River catchment from the BushmansRiver confluence down to the river mouth at the Indian Ocean. The area includes the town ofMandini and the Isithebe industrial area, both located close to the river mouth.
Unlike all the other Key Areas in the Thukela WMA, irrigation in the Lower Thukela is not thelargest water requirement, although still significant at an estimated 22 million m3/a. The largestwater use in this area is that of the Sappi paper mill, with an estimated water requirement of24 million m3/a.
Water sourced from the Lower Thukela is transferred out of the WMA to the MhlathuzeCatchment to augment the water supply to Richards Bay. The impact of this transfer on theavailable resource of the Lower Thukela Key Area is estimated at 38 million m3/a.
A large allocation has recently been made for the proposed Fairbreeze mine - 32 million m3/aallocated for the mine and a further 15 million m3/a (at a lower assurance) allocated forproposed new irrigation along the pipeline route.
A reconciliation of the water requirements and the available water resource of the LowerThukela Key Area indicates a large deficit, but this reconciliation allows for the allocation to theFairbreeze mine which is not yet being abstracted. This allocation will be supported by releasesfrom the Spioenkop Dam or Wagendrift Dam, or both.
4. RECONCILIATION OF WATER REQUIREMENTS AND AVAILABLE WATER RESOURCES
A reconciliation of the water requirements and available water resources in the Thukela WMAis shown in Table 1. This differs in many respects from the reconciliation given in the NWRS.Based on the detailed analysis of the water requirements and resource given in Chapter 4, thefollowing major differences to the NWRS strategy are noted and motivated:-
1. The irrigation requirement used in this ISP is much higher than that of the NWRS and theregistered water use by the irrigation sector. This ISP sourced its irrigation requirementsfrom the latest study in the area, namely, the Thukela Reserve Determination Study.However, considering the large discrepancy between this estimate and the registeredirrigation water use, verification of the irrigation water requirements is clearly required.
2. The water resource of the Thukela WMA, as determined for this ISP using the WaterResources Yield Model setup for the Thukela WMA is higher than given in the NWRS. Thisis mainly due to the reduction in yield due to the ecological Reserve, as used in the NWRS(which was based on desktop estimates), being much higher than that recently determinedthrough the Thukela Reserve Determination Study (DWAF, 2004a). The latter Reserve hasbeen approved by DWAF and hence is the accepted Reserve for the WMA.
Page 8

Thukela Water Management Area Internal Strategic Perspective
Table 1 : Reconciliation of water requirements and available water resources for the Thukela WMA for the year 2005 (million m3/a).
Key AreaAvailable water Water requirements/allocations
Local yield TransfersIn Total Local
requirements Transfers out Total
Balance
Upper Thukela 506 0 506 114 377+111 502 4Little Thukela 8 0 8 38 0 38 (30)
Bushmans 80 0 80 40 291 69 11
Sundays 8 0 8 32 0 32 (24)
Mooi 64 0 64 52 22 74 (10)
Buffalo 174 0 174 96 55 151 23Lower Thukela 105 402 145 58 87 145 0
Total 945 0 945 430 541 971 (26)
Allocable 383
Notes:1. Releases to support the Lower Thukela Key Area.
2. Supplied from Spioenkop and Wagendrift dams.
3. Since it is not feasible to supply the shortages in the Little Thukela, Sundays or Mooi Key Areasfrom the surpluses in the Upper Thukela, Buffalo or Bushmans Key Areas, there is at least 38million m3/a available for allocation in the Thukela WMA.
5. WATER RESOURCES MANAGEMENT ISSUES AND STRATEGIES
The following are the most pressing issues which have been identified through this ISP study,as well as proposed broad strategies to deal with these issues:
· The resources of the Thukela River are predominantly used to support requirements forwater in other parts of the country, with large transfers of water to all three neighbouringwater management areas. The need for increased and additional transfers in future havebeen identified and investigated in detail although no decision on this has as yet been made.
· Nevertheless, there are surpluses which can be allocated. These surpluses are located inthe Ntshingwayo, Spioenkop and Wagendrift dams and can be allocated either directly fromthe dams, or released to users downstream of these dams. Preference should be given topoverty alleviation and the redressing of inequities in allocating these surpluses.
Page 9

Thukela Water Management Area Internal Strategic Perspective
TABLE OF CONTENTS1. INTRODUCTION................................................................................................................................................... 1
1.1 LOCATION OF THE THUKELA WMA........................................................................................................................................11.2 WATER LEGISLATION MANAGEMENT....................................................................................................................................... 1
1.2.1 The National Water Act (NWA).................................................................................................................................. 21.2.2 The National Water Resource Strategy (NWRS......................................................................................................... 21.2.3 Catchment Management Strategies (CMS)...............................................................................................................2
1.3 INTERNAL STRATEGIC PERSPECTIVES (ISPS)..............................................................................................................................31.3.1 The Objectives of the ISP Process..............................................................................................................................31.3.2 Approach Adopted in Developing the ISP................................................................................................................ 31.3.3 Updating of the ISP Report........................................................................................................................................ 41.3.4 The Authority of Information Contained in the ISP................................................................................................... 4
1.4 INTEGRATED WATER RESOURCE MANAGEMENT (IWRM)......................................................................................................... 51.5 CARING FOR THE ENVIRONMENT.............................................................................................................................................. 71.6 THE SOCIAL ENVIRONMENT................................................................................................................................................... 81.7 WATER QUALITY MANAGEMENT............................................................................................................................................ 91.8 GROUNDWATER.................................................................................................................................................................. 101.9 PUBLIC RECREATION – THE USE OF DAMS AND RIVERS..............................................................................................................111.10 CO-OPERATIVE GOVERNANCE – THE PLACE OF THE ISP........................................................................................................... 11
2. OVERVIEW OF THE THUKELA WMA...........................................................................................................12
2.1 SOURCES OF INFORMATION................................................................................................................................................... 122.2 LOCALITY AND PHYSICAL CHARACTERISTICS..............................................................................................................................12
2.2.1 Geographic subdivision............................................................................................................................................122.2.2 Topography.............................................................................................................................................................. 122.2.3 Geology and Soils.....................................................................................................................................................122.2.4 Climate .................................................................................................................................................................... 132.2.5 Vegetation.................................................................................................................................................................132.2.6 Indigenous Fauna.....................................................................................................................................................132.2.7 Environmentally Sensitive Areas..............................................................................................................................14
2.3 DEMOGRAPHY, LAND USE AND DEVELOPMENT...........................................................................................................................142.3.1 Population and Domestic Water Supply.................................................................................................................. 142.3.2 Land use................................................................................................................................................................... 152.3.3 Existing water related infrastructure....................................................................................................................... 16
2.4 REGIONAL ECONOMY.......................................................................................................................................................... 172.5 NATIONAL AND REGIONAL WATER PLANS AND OTHER LEGISLATION..............................................................................................182.6 INSTITUTIONS......................................................................................................................................................................18
3. GROUNDWATER.............................................................................................................................................. 20
3.1 INTRODUCTION.................................................................................................................................................................. 203.2 GEOLOGY........................................................................................................................................................................ 203.3 CONCLUSION.....................................................................................................................................................................22
4. WATER RESOURCES MANAGEMENT PERSPECTIVES OF THE THUKELA WMA........................23
4.1 INTRODUCTION................................................................................................................................................................... 234.2 WATER RESOURCE EVALUATION METHODOLOGY..................................................................................................................23
4.2.1 Source of information...............................................................................................................................................244.2.2 Ecological Reserve Scenario....................................................................................................................................244.2.3 Simulation record..................................................................................................................................................... 244.2.4 User requirements.................................................................................................................................................... 24
4.3 RECONCILIATION METHODOLOGY........................................................................................................................................... 244.3.1 Water resource........................................................................................................................................................ 254.3.2 Analysis of the transfers........................................................................................................................................... 254.3.4 Impact of the Ecological Reserve.............................................................................................................................25
4.4 OVERALL PERSPECTIVE........................................................................................................................................................254.5 UPPER THUKELA KEY AREA................................................................................................................................................26
Page 10
Thukela Water Management Area Internal Strategic Perspective
4.5.1 Introduction............................................................................................................................................................. 264.5.2 Water availability..................................................................................................................................................... 274.5.3 Water requirements.................................................................................................................................................. 284.5.4 Water balance..........................................................................................................................................................294.5.5 Reconciliation perspective...................................................................................................................................... 294.5.6 Water quality............................................................................................................................................................ 304.5.7 Summary, key issues and strategies......................................................................................................................... 30
4.6 LITTLE THUKELA KEY AREA.............................................................................................................................................. 314.6.1 Introduction.............................................................................................................................................................. 314.6.2 Water availability..................................................................................................................................................... 314.6.3 Water requirements.................................................................................................................................................. 324.6.4 Water balance ..........................................................................................................................................................334.6.5 Reconciliation perspective....................................................................................................................................... 334.6.6 Water quality............................................................................................................................................................ 344.6.7 Summary, key issues and strategies......................................................................................................................... 34
4.7 BUSHMANS RIVER KEY AREA..............................................................................................................................................344.7.1 Introduction.............................................................................................................................................................. 344.7.2 Water availability.................................................................................................................................................... 354.7.3 Water requirements................................................................................................................................................. 354.7.4 Water balance..........................................................................................................................................................354.7.5 Reconciliation perspective....................................................................................................................................... 364.7.6 Water quality............................................................................................................................................................ 364.7.7 Summary, key issues and strategies......................................................................................................................... 36
4.8 SUNDAYS RIVER KEY AREA................................................................................................................................................ 374.8.1 Introduction............................................................................................................................................................. 374.8.2 Water availability..................................................................................................................................................... 374.8.3 Water requirements.................................................................................................................................................. 374.8.4 Water balance..........................................................................................................................................................384.8.5 Reconciliation perspective....................................................................................................................................... 384.8.6 Water quality............................................................................................................................................................ 384.8.7 Summary, key issues and strategies......................................................................................................................... 39
4.9 BUFFALO RIVER KEY AREA................................................................................................................................................394.9.1 Introduction............................................................................................................................................................. 394.9.2 Water availability.................................................................................................................................................... 404.9.3 Water requirements................................................................................................................................................. 404.9.5 Reconciliation perspective....................................................................................................................................... 414.9.6 Water quality............................................................................................................................................................ 424.9.7 Summary, key issues and strategies......................................................................................................................... 42
4.10 MOOI RIVER KEY AREA................................................................................................................................................... 434.10.1 Introduction............................................................................................................................................................ 434.10.2 Water availability.................................................................................................................................................. 434.10.3 Water requirements................................................................................................................................................ 444.10.5 Reconciliation perspective..................................................................................................................................... 464.10.6 Water quality.......................................................................................................................................................... 464.10.7 Summary, key issues and strategies....................................................................................................................... 46
4.11 LOWER THUKELA KEY AREA.............................................................................................................................................474.11.1 Introduction............................................................................................................................................................ 474.11.2 Water availability.................................................................................................................................................. 474.11.3 Water requirements............................................................................................................................................... 484.11.4 Water Balance........................................................................................................................................................ 484.11.5 Reconciliation perspective..................................................................................................................................... 494.11.6 Water quality.......................................................................................................................................................... 494.11.7 Key issues and strategies........................................................................................................................................49
4.12 OVERALL WATER BALANCE...................................................................................................................................................504.13 COMPARISON WITH THE FIRST EDITION NWRS....................................................................................................................51
4.13.1 Introduction............................................................................................................................................................ 514.13.2 Water requirements................................................................................................................................................ 514.13.3 Water resource....................................................................................................................................................... 534.13.4 Reconciliation of requirements and availability.................................................................................................... 53
BIBLIOGRAPHY..........................................................................................................................................................55
Page 11

Thukela Water Management Area Internal Strategic Perspective
LIST OF FIGURES
Figure 1.1: Location of the Thukela WMA
Figure 1.2: Diagram showing DWAF's integrated water resources management approach
Figure 2.1: Locality map of the Thukela WMA
Figure 2.2: Geology of the Thukela WMA
Figure 2.3: Soil Map of the Thukela WMA
Figure 2.4: Rainfall in the Thukela WMA
Figure 2.5: Population distribution in the Thukela WMA
Figure 2.6: Tribal land in the Thukela WMA
Figure 2.7: District Municipalities in the Thukela WMA
Figure 2.8: Local Municipalities in the Thukela WMA
Figure 3.1: Key Areas of the Thukela WMA
Page 12

Thukela Water Management Area Internal Strategic Perspective
LIST OF TABLES
Table 2.1: Comparison of irrigation water requirements from different sources
Table 2.2: Estimates of the extent of commercial forestry in the Thukela WMA
Table 4.1: Overview of the water availability in the Upper Thukela Key Area
Table 4.2: Water Requirements in the Upper Thukela Key Area in 2005
Table 4.3: Water balance in the Upper Thukela Key Area in 2005
Table 4.4: Overview of the water availability in the little Thukela Key Area
Table 4.5: Registered water use and source of supply in the Little Thukela Key Area
Table 4.6: Water Requirements in the Little Thukela Key Area in 2005
Table 4.7: Water balance in the Little Thukela Key Area in 2005
Table 4.8: Assurance of supply to irrigators in the Little Thukela Key Area
Table 4.9: Overview of the water availability in the Bushmans River Key Area
Table 4.10: Water requirements in the Bushmans River Key Area in 2005
Table 4.11: Water balance in the Bushmans River Key Area in 2005
Table 4.12: Overview of the water availability in the Sundays River Key Area
Table 4.13: Water Requirements in the Sundays River Key Area in 2005
Table 4.14: Water balance in the Sunday River Key Area in 2005
Table 4.15: Overview of the water availability in the Buffalo River Key Area
Table 4.16: Water Requirements in the Buffalo River Key Area in 2005
Table 4.17: Water balance in the Buffalo Key Area in 2005
Table 4.18: Water availability in the Mooi River Key Area (prior to the construction of Spring
Grove Dam).
Table 4.19: Water availability in the Mooi River Key Area after completion of the Spring
Grove Dam
Table 4.20: Water requirements in the Mooi River Key Area in 2005
Table 4.21: Water requirements in the Mooi River Key Area after completion of the Spring
Grove Dam
Table 4.22: Water balance in the Mooi River Key Area in 2005
Table 4.23: Water balance in the Mooi River Key Area after completion of the Spring Grove
Dam
Table 4.24: Overview of the water availability in the Lower Thukela Key Area.
Table 4.25: Water requirements in the Lower Thukela Key Area in 2005 9million m3/a
Table 4.26: Water balance in the Lower Thukela Key Area 2005 (million m3/a)
Table 4.27: Reconciliation of requirements and available water for the Thukela WMA
assuming support from Wagendrift and Spioenkop dams for the year 2005
(million m3/a)
Page 13
Thukela Water Management Area Internal Strategic Perspective
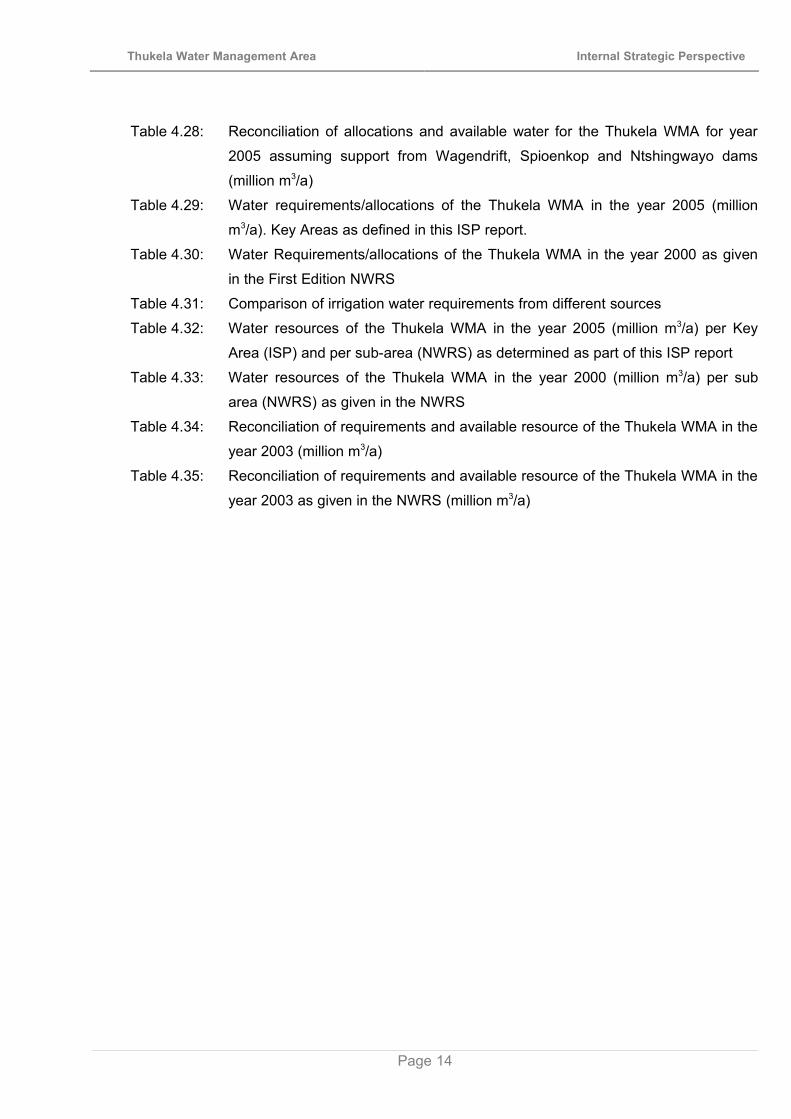
Table 4.28: Reconciliation of allocations and available water for the Thukela WMA for year
2005 assuming support from Wagendrift, Spioenkop and Ntshingwayo dams
(million m3/a)
Table 4.29: Water requirements/allocations of the Thukela WMA in the year 2005 (million
m3/a). Key Areas as defined in this ISP report.
Table 4.30: Water Requirements/allocations of the Thukela WMA in the year 2000 as given
in the First Edition NWRS
Table 4.31: Comparison of irrigation water requirements from different sources
Table 4.32: Water resources of the Thukela WMA in the year 2005 (million m3/a) per Key
Area (ISP) and per sub-area (NWRS) as determined as part of this ISP report
Table 4.33: Water resources of the Thukela WMA in the year 2000 (million m3/a) per sub
area (NWRS) as given in the NWRS
Table 4.34: Reconciliation of requirements and available resource of the Thukela WMA in the
year 2003 (million m3/a)
Table 4.35: Reconciliation of requirements and available resource of the Thukela WMA in the
year 2003 as given in the NWRS (million m3/a)
Page 14

Thukela Water Management Area Internal Strategic Perspective
LIST OF ANNEXURES
Annexure A: Summary of previous water resource planning studies
Annexure B: Registered dams in the Thukela WMA
Page 15
Thukela Water Management Area Internal Strategic Perspective
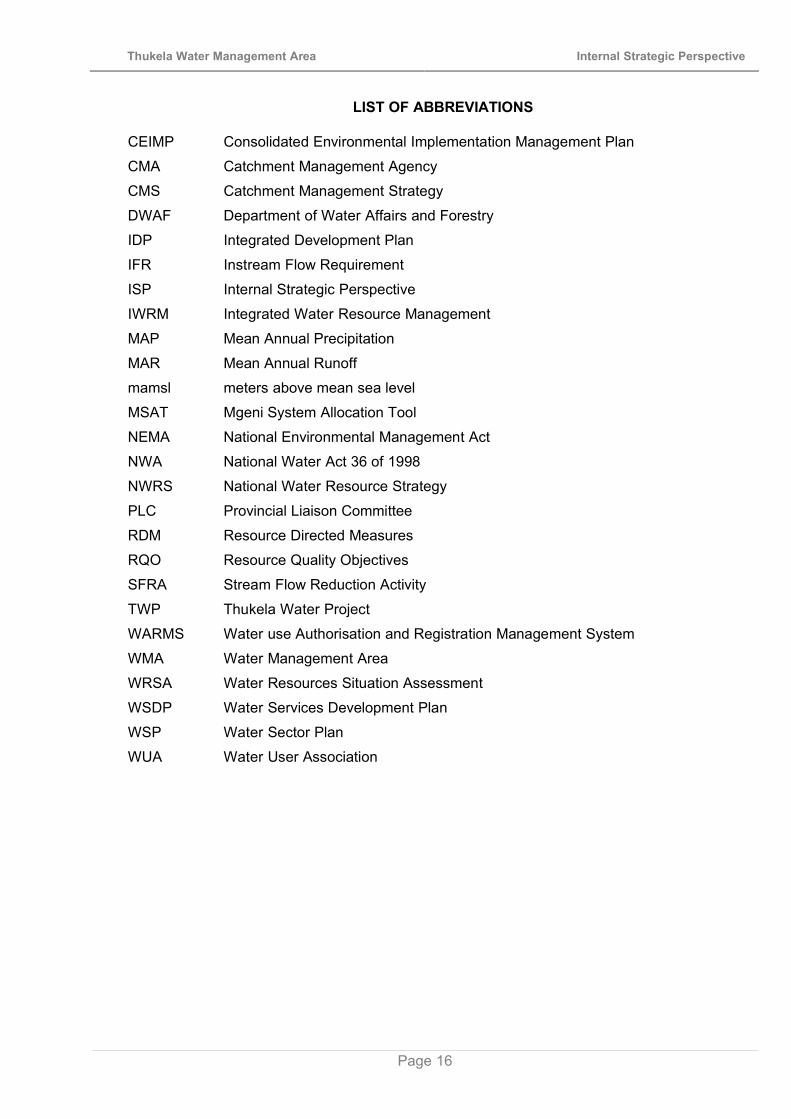
LIST OF ABBREVIATIONS
CEIMP Consolidated Environmental Implementation Management Plan
CMA Catchment Management Agency
CMS Catchment Management Strategy
DWAF Department of Water Affairs and Forestry
IDP Integrated Development Plan
IFR Instream Flow Requirement
ISP Internal Strategic Perspective
IWRM Integrated Water Resource Management
MAP Mean Annual Precipitation
MAR Mean Annual Runoff
mamsl meters above mean sea level
MSAT Mgeni System Allocation Tool
NEMA National Environmental Management Act
NWA National Water Act 36 of 1998
NWRS National Water Resource Strategy
PLC Provincial Liaison Committee
RDM Resource Directed Measures
RQO Resource Quality Objectives
SFRA Stream Flow Reduction Activity
TWP Thukela Water Project
WARMS Water use Authorisation and Registration Management System
WMA Water Management Area
WRSA Water Resources Situation Assessment
WSDP Water Services Development Plan
WSP Water Sector Plan
WUA Water User Association
Page 16

Thukela Water Management Area Internal Strategic Perspective
PART A
1. INTRODUCTION
1.1 LOCATION OF THE THUKELA WMA
The Thukela WMA fully corresponds to the catchment area of the Thukela River, and liespredominantly in the KwaZulu-Natal province. It is a funnel shaped catchment, with severaltributaries draining from the Drakensberg escarpment towards the Indian Ocean. The locationof the Thukela WMA is indicated in Figure 1.1 and a more detailed locality map is provided inFigure 2.1.
Figure 1.1: Location of the Thukela WMA
1.2 WATER LEGISLATION MANAGEMENT
Water is one of the most fundamental and indispensable of all natural resources. It isfundamental to life and the quality of life, to the environment, food production, hygiene, industry,and power generation. The availability of affordable water can be a limiting factor for economicgrowth and social development, especially in South Africa where water is a relatively scarceresource that is distributed unevenly, both geographically and through time, as well as socio-politically.
Prosperity for South Africa depends upon sound management and utilisation of our manynatural and other resources, with water playing a pivotal role. South Africa needs to manage itswater resources optimally in order to further the aims and aspirations of its people. Currentgovernment objectives for managing water resources in South Africa are set out in the NationalWater Resource Strategy (NWRS) as follows:
· To achieve equitable access to water, that is, equity of access to water services, to the useof water resources, and to the benefits from the use of water resources.
· Page 1
Thukela Water Management Area Internal Strategic Perspective
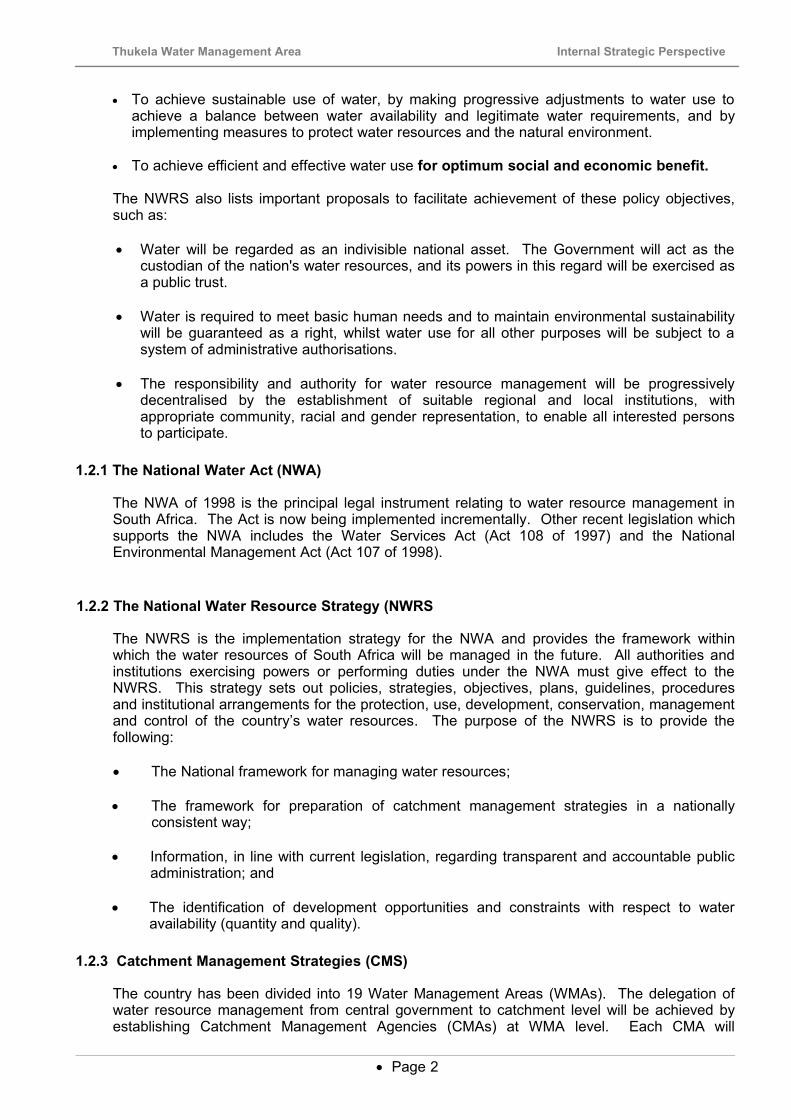
· To achieve sustainable use of water, by making progressive adjustments to water use toachieve a balance between water availability and legitimate water requirements, and byimplementing measures to protect water resources and the natural environment.
· To achieve efficient and effective water use for optimum social and economic benefit.
The NWRS also lists important proposals to facilitate achievement of these policy objectives,such as:
· Water will be regarded as an indivisible national asset. The Government will act as thecustodian of the nation's water resources, and its powers in this regard will be exercised asa public trust.
· Water is required to meet basic human needs and to maintain environmental sustainabilitywill be guaranteed as a right, whilst water use for all other purposes will be subject to asystem of administrative authorisations.
· The responsibility and authority for water resource management will be progressivelydecentralised by the establishment of suitable regional and local institutions, withappropriate community, racial and gender representation, to enable all interested personsto participate.
1.2.1 The National Water Act (NWA)
The NWA of 1998 is the principal legal instrument relating to water resource management inSouth Africa. The Act is now being implemented incrementally. Other recent legislation whichsupports the NWA includes the Water Services Act (Act 108 of 1997) and the NationalEnvironmental Management Act (Act 107 of 1998).
1.2.2 The National Water Resource Strategy (NWRS
The NWRS is the implementation strategy for the NWA and provides the framework withinwhich the water resources of South Africa will be managed in the future. All authorities andinstitutions exercising powers or performing duties under the NWA must give effect to theNWRS. This strategy sets out policies, strategies, objectives, plans, guidelines, proceduresand institutional arrangements for the protection, use, development, conservation, managementand control of the country’s water resources. The purpose of the NWRS is to provide thefollowing:
· The National framework for managing water resources;
· The framework for preparation of catchment management strategies in a nationallyconsistent way;
· Information, in line with current legislation, regarding transparent and accountable publicadministration; and
· The identification of development opportunities and constraints with respect to wateravailability (quantity and quality).
1.2.3 Catchment Management Strategies (CMS)
The country has been divided into 19 Water Management Areas (WMAs). The delegation ofwater resource management from central government to catchment level will be achieved byestablishing Catchment Management Agencies (CMAs) at WMA level. Each CMA will
· Page 2

Thukela Water Management Area Internal Strategic Perspective
progressively develop a Catchment Management Strategy (CMS) for the protection, use,development, conservation, management and control of water resources within its WMA.
The Department's eventual aim is to hand over certain water resource management functionsto CMAs. Until such time as the CMAs are established and are fully operational, the RegionalOffices (ROs) of DWAF will continue managing the water resources in their areas ofjurisdiction.
1.3 INTERNAL STRATEGIC PERSPECTIVES (ISPS)
1.3.1 The Objectives of the ISP Process
The objective of the ISP will be to provide a framework for DWAF’s management of the waterresources in each Water Management Area, until such time as the relevant Regional Office canhand over the management functions to the established CMA. This will ensure consistencywhen answering requests for new water licences, and informing existing water users (includingauthorities) on how the Department will manage the water resource within the area of concern.Stakeholders must be made aware of the bigger picture as well as the management detailassociated with each specific water resource management unit.
1.3.2 Approach Adopted in Developing the ISP
The ISP for the Thukela WMA was developed in five stages as follows:
Determining the current status of water resource management and relevant waterresource management issues and concerns in the Thukela WMA. This was achievedthrough interviews with individual members of DWAF's KwaZulu-Natal Regional Office andby collating information from the NWRS, WMA reports, Water Resource SituationAssessment (WRSA) reports and other catchment study reports. The following topicswere discussed with Regional Office staff and their issues and concerns documented:
- Current water situation- Resource protection- Water Uses- Water reconciliation- Water infrastructure- Monitoring and information- Water management institutions- Co-operative governance- Planning responsibilities.
A starter document of the identified issues and concerns was produced as a discussiondocument for the first workshop arranged for the development of this ISP.
2. The first workshop was held with attendees from the Regional Office, the IntegratedWater Resource Planning (IWRP) Chief Directorate of the Department as well as theconsulting team. The workshop focussed on the list of general issues in the WMA as wellas area-specific issues. The issues were clarified and refined during the workshop.Strategies were discussed and developed to address the issues.
3. The third stage involved the preparation of the second draft document to be used forrefining strategies to address the various issues and concerns, during a second workshop.
The fourth stage was the second workshop. During this workshop the overallmanagement of the water resources in the catchment was discussed along with themanagement strategies and the relevant issues and concerns. The priorities and
· Page 3

Thukela Water Management Area Internal Strategic Perspective
responsibilities for carrying out the strategies were identified. First workshop attendeeswere again involved, as were representatives of several DWAF Head Office directorates.
5. The fifth stage was the finalisation of the ISP document.
As can be deduced from the above this Thukela ISP was prepared internally within theDepartment, and captures the Department’s perspectives. Once approved by DWAFManagement, it is intended that the Regional Office will make the ISP available to Water UserAssociations (WUAs), Water Service Providers (WSPs), Water Service Authorities (WSAs) andother forums for discussion and comment. These comments will be considered and workedinto later versions of the ISP. By adopting this procedure this ISP becomes a workingdocument, which will be progressively updated and revised by DWAF. Public participationforms part of the CMS process, for which the ISP serves as a foundation (see Section 1.6).
The ISP does not formulate all the details pertaining to every strategy but provides a suggestedframework for each strategy around which the details will be developed by the responsibleauthority. Where relevant and readily available, certain details have been included in thestrategies. The responsible authority for the further development of each strategy is indicated.This is predominantly the Regional Office, which remains responsible for involving the relevantDWAF directorates.
1.3.3 Updating of the ISP Report
The ISP will be regularly reviewed by keeping abreast of changes in national legislation andpolicy changes or refinements by keeping a list of all relevant legislation and supportingdocuments relevant to the ISP by:
· Ensuring consistency between the ISP strategies and national strategies through a regularreview-and-update procedure;
· Annually reviewing and ensuring consistency and agreement regarding trans-boundary ISPmanagement issues by liaising with the responsible managers of other areas and updatingrelevant ISP strategies if necessary;
· Annually reviewing the priorities of required management actions and aligning budgetsaccordingly;
· Monitoring the implementation of the ISP (review actions, progress, implementation andstumbling blocks);
· Incorporating feedback from stakeholders;· Rigorously applying ISP version control.
Updating and Version Control The actual frequency of ISP revision will be determined by the number and extent of revisionsto management approaches as reflected in strategy amendments. All updates to this report,particularly with respect to amendment to the Strategies, need to be passed on to and vetted bythe Catchment Manager for the Thukela WMA. Comments to be sent to:
The Water Resources ManagerDepartment of Water Affairs and ForestryKwaZulu-Natal Regional OfficeP O Box 1018DURBAN4000
1.3.4 The Authority of Information Contained in the ISP
The NWRS is a statutory document, subject to a high level of public scrutiny and input, andsigned off by the Minister. The information contained in the NWRS is the best information and
· Page 4

Thukela Water Management Area Internal Strategic Perspective
knowledge available at the time. The information in Chapter 2 and Appendix D of the draftNWRS Strategy on water requirements, availability and reconciliation was updated withcomments received from the public participation process in the second half of 2002. To enablethe finalisation of the draft NWRS, these figures were “closed” for changes in February 2003.
Underlying the figures in Chapter 2 and Appendix D is a set of 19 reports on the “Overview ofWater Resources Availability and Utilisation”, one for each WMA. These reports contain moredetailed information on each WMA than was summarised for the NWRS and are referred to, inshort, as “WMA Reports”. The WMA reports were also finalised with the February 2003information.
Still deeper in the background lies another set of reports (one per WMA), the so-called WaterResource Situation Assessment Reports. These reports contain a wealth of information oneach WMA, but the figures on requirements, availability and reconciliation have beensuperceded by the WMA report and the NWRS.
The ISPs for all WMAs used the information contained in the NWRS and WMA reports as thepoint of departure. However, an inevitable result of the ISP process has been that betterinformation has emerged in some cases. The reason is that the level of study is more detailedand intense for the ISP. This included very close scrutiny of the numbers used in the NWRS,and in some cases a reworking of base data and some re-modelling. Where the ISPs containyield balance data which differs from the NWRS, these discrepancies are carefully explained.Where other differences from the NWRS are necessary these are also detailed in the ISP, withaccompanying explanations.
It is required that the Department work with the best possible data so that the best possibledecisions can be taken. Where the ISPs have improved upon the NWRS then this is the datathat should be used. The new data contained in the ISP will also be open to public scrutiny asthe ISP reports will be published on the Internet and in hardcopy, and will be presented anddiscussed at WMA forums. Comments received will be considered and worked into subsequentversions of the ISP on a regular (yearly) basis. The NWRS will be updated to reflect the latestunderstanding in each new edition.
1.4 INTEGRATED WATER RESOURCE MANAGEMENT (IWRM)
It is imperative that the natural, social, economic, political and other environments and theirvarious components are adequately considered when conducting water resources planning andmanagement. Water as a strategic component also interacts with other components in allenvironments. For example, human activities such as the use of land, the disposal of waste,and air pollution can have major impacts on the quantity and quality of water which is availablefor human use and for proper life support to natural biota.
Taking an even broader view, water must also be managed in full understanding of itsimportance for social and economic development. It is important to ensure that there isconformity between the water-related plans and programmes of the CMAs, and the plans andprogrammes of all other role players in their management areas. The CMAs must thereforeestablish co-operative relationships with a wide range of stakeholders, including other watermanagement institutions, water services institutions, provincial and local governmentauthorities, communities, water users ranging from large industries to individual irrigators, andother interested persons.
This integrated planning and management approach is intended, through co-operativegovernance and public participation, to enable water managers to meet the needs of all peoplefor water, employment, and economic growth in a manner that also allows protection and,where necessary, rehabilitation of aquatic ecosystems. Above all, Integrated Water ResourceManagement (IWRM) will enable water managers to use precious water resources to assist inpoverty eradication and removal of inequity.
· Page 5

Thukela Water Management Area Internal Strategic Perspective
One of the big opportunities to formally integrate a large number of actions in water resourcemanagement presents itself during the so-called compulsory licensing process. Compulsorylicensing is identified in the NWRS as a very important action for implementing the NWA.However, it is not a simple action of issuing licences but a complex process of closely relatedand interdependent activities that will in itself formalise IWRM to a great extent. The elementscontained in the process of IWRM is diagrammatically depicted in Figure 1.2.
Figure 1.2: Diagram showing DWAF’s Integrated Water Resource Management approach
Before an allocation schedule can be determined and the legal steps followed to finalisecompulsory licensing (through the issuing of licences to all users), many other aspects must beaddressed:
· Existing use and the lawfulness of that use must be verified, all users (existing and new)must apply for licences, a good understanding of future use scenarios must be developedand water required for equity purposes and rural development must be clearly understood.
· Water availability must be understood as thoroughly as possible with "best available"existing information used to model all possible reconciliation options.
· Reserve scenarios must be developed for all significant resources in the catchment, forinstance, the river flow requirements for all possible classes that may be considered.
· The development of strategies for implementing the licensing (abstraction controls, forexample), the Reserve and Resource Quality Objectives (i.e. incrementally over time) mustgo hand in hand with the rest of the processes to ensure that practical, workable solutionsare found.
· The processes will then enter a very intensive, interactive phase of developing realisticreconciliation options. This will entail, for example, the selection of a specific management
· Page 6

Thukela Water Management Area Internal Strategic Perspective
class to be scrutinised for its impact on the number of licences that could be issued foruse, with its concomitant impacts on the social and economic structure of the catchment.
· The active participation of stakeholders in this process will then hopefully crystallise clearrecommendations on an allocation schedule, management classes for the various reachesof the rivers and the resultant ecological Reserve and Resource Quality Objectives, as wellas strategies for the implementation thereof.
Although the Department will play a very strong role in guiding this process, it is extremelyimportant to have the CMA actively involved. Preferably, at least the Board of the CMA must bein place to drive the public participation for the process.
1.5 CARING FOR THE ENVIRONMENT
DWAF is responsible for water resource development and management in terms of the NWA,and within the broader framework of other environmental legislation. The Department alsostrongly reflects the will to make sound decisions which ensure the development of society andthe economy whilst maintaining, and where possible enhancing, ecological integrity. Theconcept of management of the environment has evolved from the exclusivity of protection ofplants and animals to balancing the complex interaction of society, the economy, and ecology.“Environmental management is the integration of social, economic and ecological factors intoplanning, implementation and decision-making so as to ensure that development servespresent and future generations” (NEMA).
The key legislative Acts to which DWAF is required to refer are the National EnvironmentalManagement Act (NEMA, Act 107 of 1998) and the Environment Conservation Act (ECA, Act73 of 1989). DWAF has prepared a Consolidated Environmental Implementation andManagement Plan (CEIMP) as a requirement of NEMA. This describes the Department’sfunctions, policies, plans and programmes, and states how these comply with environmentallegislation. Through the CEIMP the Department has committed itself to developing andimplementing an integrated Environmental Management Framework (EMF) to ensure that itsapproach is aligned with the principles prescribed in NEMA and the ECA. The EMF will informthe Department at a strategic decision-making level, bring about environmental legalcompliance, and help in achieving environmental sustainability through the promotion of soundenvironmental management practices. Integrated Environmental Management is a co-operative governance effort with DWAF as a full partner in the process.
This ISP has the responsibility of raising and maintaining the environmental consciousness ofthe Department’s water resource planners and managers. The control over water has a verybroad range of influences and impacts for which strategies and planning need to account.Impacts come from many different angles.
Some of these angles of impact which are considered through this ISP are noted below:
· The direct impact of physical structures (environmental constraints to construction e.g. ofweirs or dams).
· The implications of allocating and licensing water for use. Forestry and irrigation areexamples of users where development based on water can mean the transformation ofextensive areas of otherwise ‘natural’ environments.
· The allocation of water for equity. Here we can include approaches towards the applicationof Schedule 1 use, general authorisations, the revitalisation of irrigation schemes, etc.
· Failure to support equity, or appropriate development – noting the consequential impacts ofpoverty.
· Page 7

Thukela Water Management Area Internal Strategic Perspective
· Sanitation systems and the impacts on groundwater quality.
· The implementation of the Reserve.
· The ability to monitor and manage compliance, thus protecting the resource and with it theenvironment.
All decisions regarding water are critical to the environment. Decisions must be made on abalance of social, economic and ecological costs and benefits, considering both the immediateand the long-term, and always with an eye out for the unintended consequence. It is theintention of the ISP to provide the basis for integrated decision-making. The principles ofenvironmental management underpin every strategy developed in this document.
There are a number of strategic areas with a particularly strong biophysical/ecologicalemphasis. These include:
· the Reserve (groundwater, rivers, wetlands and estuaries)
· water quality - surface and groundwater
· the approach towards the clearing of invasive alien plants
· the management of wetlands
· land degradation, erosion and sedimentation (land care)
· land use and especially how this is impacted by land reform and the re-allocation of water.
The roles of co-operative governance and the need for awareness raising and capacity buildingare key strategic elements of many strategies.
In reality all strategies and all aspects of management have a strong interaction with thebiophysical environment. This ISP endeavours to capture all of these concerns in discussionand through a strategic approach which emphasises the will of the Department to manage theenvironment to the best benefit of the country and its people.
The approach set out above applies to all Water Management Areas and associated ISPs, andis not repeated within the Strategy Tables (Part B of this ISP). It reflects the way theDepartment views Integrated Water Resource Management and the importance of thebiophysical aspects of decision-making. There may nevertheless be specific ecological andbiophysical aspects of management which require specific attention and which may not becaptured in the above-mentioned or other strategies. The ISP therefore still includes anEnvironmental Strategy which serves to make pertinent those issues of the environment whichmight not otherwise be covered.
1.6 THE SOCIAL ENVIRONMENT
The utilisation of water resources is aimed at the benefit of society, and at society through theeconomy. As noted in Section 1.5 this should not be at undue cost to ecological integrity.
Impacts on society are a core element of this ISP, and decisions are often complicated by therisk of unintended consequence. As a typical example the over-zealous implementation of theecological Reserve may benefit the river, to the intended benefit of society, but the cost of lackof use of that water to employment and to livelihoods may lead to other strains on naturalresources that undo the benefits.
· Page 8

Thukela Water Management Area Internal Strategic Perspective
The implementation of the NWA requires that society be kept at the forefront of all decision-making. This principle is now deep-seated within the Department and is integral to allstrategies. Water resource allocation and use has critical social impacts, as does water qualitymanagement. But pivotal to the social component is the question of equity. What can be doneand what is being done to redress past inequities? Within this, strategies have been developedto consider the provision of water to Resource Poor Farmers, the use of water under Schedule1, Licensing and General Authorisations, etc. Whilst water supply and sanitation are not part ofthe brief of the ISP, the provision of water to meet these needs most certainly is. The urbanpoor, and the poor in rural villages, are as important in the consideration of the distribution anduse of water resources as are the rural subsistence poor, and this should not be forgotten in theurgencies of land reform and the enthusiasm to establish a substantial class of farmers fromamongst the previously disadvantaged.
This ISP aims to see water benefiting society. This can be through access to water in livelihoodstrategies, through small-farmer development programmes, through water supply andsanitation and especially the provision of good quality drinking water, and through themaintenance and growth of income-producing, job-creating, and tax-paying agricultural,commercial and industrial strategies.
Consultation and public participation are cornerstones of the social component of any strategicdocument. These requirements are repeatedly stressed throughout the National Water Act.This ISP has been prepared as DWAF’s position statement with respect to the management ofwater resources and, although strategies and plans have been captured without consultationwith the stakeholders, it remains an open and transparent document where the understandingof the Department, its visions and its principles are made clear for all to see and to interact with.This is amplified in the Implementation (Strategy 8) of this ISP.
1.7 WATER QUALITY MANAGEMENT
Much of the emphasis in water resource management has revolved around ensuring that usershave sufficient quantities of water. However, as more water gets used and re-used, asquantities get scarce and feedback loops get even tighter, it is quality that begins to take on adominant role.
Water availability is only as good as the quality of that water. Both quantity and quality need tobe considered at the correct level of detail, and this can mean that at times they should beconsidered with similar emphasis and with similar expenditure of resources. Too often we havefailed to integrate the issues of quantity and quality – both with regard to surface water andgroundwater. The concept of Available Assimilative Capacity, the ability of the water resourceto absorb a level of pollution and remain ‘serviceable’, is as important in water resourcemanagement as is the concept of System Yield.
Quantity and quality can no longer be managed in isolation of each other. Not that this isolationhas ever been total. The importance of releasing better quality water from the Spioenkop Damfor flushing out the Thukela River Mouth and the addition of freshening releases from the VaalBarrage to bring water back to an acceptable quality has, inter alia, long been standardpractice. The consequences of irrigation, the leaching of fertilisers, and more importantly theleaching of salts from deeper soil horizons can render both the lands themselves and thereceiving rivers unsuitable for use. Diffuse agricultural ‘effluent’ may be less visible than directdischarges of sewage or industrial effluent, but are no less pernicious.
Direct discharges to rivers are licensed and managed on the basis of assimilative capacities ofthose rivers, and on Receiving Water Quality. Where these limits are exceeded, often throughthe cumulative impact of diffuse discharges, water becomes unavailable to some, or even all,users downstream. DWAF will licence users to take water, and again to discharge it inrecognition that there is generally a cost to the resource in terms of a reduction in quality and areduction in its further assimilative capacity. It is for this reason, and in order to bring aboutadditional management and a strong incentive, that the Waste Discharge Charge System is
· Page 9

Thukela Water Management Area Internal Strategic Perspective
being developed. Dischargers will be obliged to pay, depending on the quantity and quality oftheir discharge.
Surface water quality is affected by many things including sediment and erosion, the diffusedischarges from irrigated farmland (both fertilisers and salinity through leaching), domestic andurban runoff, industrial waste, and sewage discharges. Of these, industrial waste and sewagedischarges are the easiest to licence and control, but this does not mean that this is problem-free. The Department has found that the situation with regard to sewage discharges often farexceeds the standards and conditions demanded by licences. There is a problem ofcompliance with regard to Local Authorities and private operators responsible for wastemanagement systems. Diffuse discharges only compound the problem by reducing theassimilative capacity until the water becomes unfit for use, very expensive to purify, and adanger to human health.
Groundwater quality requires equal attention, and more so as we recognise the importance ofgroundwater in supplementing our meagre resources, and providing water to remotecommunities. Although our groundwater resources are for the most part to be found at arelatively deep level (50-100 m is quite typical) this water can easily be polluted by surfaceactivity. The leaching of fertilisers is one such problem but of greater concern is the influx ofnitrates, primarily a consequence of human habitation and sanitation. Pit latrines are on theone hand so necessary, and have the huge advantage of not requiring volumes of water, butdisposal is ‘on-site’, and often responsible for the longer-term pollution of the underlyingaquifers which feed and water the communities above.
Water quality is a very important aspect of strategy within this ISP – considered primarily withinthe Water Quality Strategy and also under Groundwater. Industrial wastewater discharge,diffuse agricultural discharges, wastewater treatment works, the location and management ofsolid waste disposal sites, the siting of new developments, informal settlements and theimpacts of sanitation systems, are all elements considered with great concern in this and otherISPs. Despite this attention it may be that water quality has still not taken its rightful place inthe integrated management of the water resource. But the Department is moving towardsIWRM and the integration of quantity and quality issues. Managers have now been givencrosscutting responsibilities that will ensure a far more integrated approach in future.
Actions recommended within the Department include:
· The need to actively workshop the integration process. Resource Management, Planningand Allocations of Groundwater and Surface Water quantity and quality.
· The review and incorporation of knowledge from recent Water Research Commissionstudies on both radioactivity and nitrates (groundwater quality issues).
· A review of all water quality literature reflecting situational knowledge and understandingwithin this WMA (and each and every WMA).
Ensuring that Water Quality monitoring is fully integrated into WMA water resources monitoring.
1.8 GROUNDWATER
The ISP process in all of the Water Management Areas of South Africa has highlighted the roleand importance of groundwater as part of the total water resource. Although groundwater hasalways been important in some areas this overall vision is a significant advance on our previousunderstanding of the potential for groundwater use. With the surface water resources in manyWMAs now fully utilised, almost the only opportunity left for further development lies in theexploitation of groundwater. More particularly it is recognised that many of the more remotetowns and villages, far from surface supplies, can in fact supply or supplement existing sourcesthrough groundwater, and that this must become a priority option. So, too, many smallcommunities and subsistence farmers can avail themselves of groundwater when it wouldotherwise be impossible or impractical to lay on piped supplies. This can also reduce thepressure on existing users and perhaps even circumvent the need for compulsory licensing.
· Page 10

Thukela Water Management Area Internal Strategic Perspective
The Department will be developing its capacity to explore and encourage the use ofgroundwater.
Of obvious concern is the likelihood of an interaction between groundwater and surface water.If the interaction is strong then additional use of groundwater may simply be reducing thesurface water resource already allocated to someone else. In some instances (such as in thecase of dolomitic aquifers) this interaction can indeed be very strong, whilst across many areasof the country it is so weak as to be negligible. In these circumstances groundwater comprisesa huge pool of available water which is only of benefit if it is utilised. Care must always betaken with the issuing of licenses to ensure that both the Groundwater Reserve and otherdownstream users do not end up being the losers.
The realisation in this and other ISPs is that groundwater offers a huge resource of water whichcan be tapped, and that this can be a very significant supplement to the national waterresource.
1.9 PUBLIC RECREATION – THE USE OF DAMS AND RIVERS
The use of water for recreational purposes is one of the 11 water uses regulated in terms of theNWA (Section 21 j). The Department is developing a national policy towards ‘Recreation onDams and Rivers’ and this should, in the first instance, be adhered to. Recreational use cantake many forms and only occasionally has any direct impact on the water resource. Mostobvious are activities such as power-boating, sailing and swimming which can have quality /pollution impacts. These activities can bring very significant economic benefits to the WMAsconcerned, and where water releases can be accommodated, particularly through alignmentwith the needs of the ecological Reserve or other downstream users, then so much the better.
It is noted in this ISP that water resources offer a very significant recreational outlet and thatrecreation is an important public and social asset necessary for national health and productivity.A central philosophy is that recreational opportunity should not be unreasonably andunnecessarily denied to users, and that the implementation of policy should ensure thatdisadvantaged and poor people should also be able to avail themselves of opportunities.
The Department has already transferred responsibility for the management of many publicwaters to Local Authorities and will continue with this process. Responsibility will thereforedevolve upon these Authorities, but within the broad principles as laid down by the Department.
1.10 CO-OPERATIVE GOVERNANCE – THE PLACE OF THE ISP
The ISP is DWAF’s approach to the management of water resources within the WMA. Thiswill, in the longer term, be replaced by a fully consultative Catchment Management Agency.What is important in the medium term is that the ISP has a good fit with the Provincial Growthand Development Plan, with regional and other Environmental Management Plans, with plansand expectations of the Departments of Agriculture, Land Affairs, the Environment and others.It must also be aligned with the Integrated Development Plans and Water ServicesDevelopment Plans now required for each District Municipality. Water is very often aconstraining feature in development and co-operative governance planning and implementationis essential in matching what is wanted with what is possible.
· Page 11

Thukela Water Management Area Internal Strategic Perspective
2. OVERVIEW OF THE THUKELA WMA
2.1 SOURCES OF INFORMATION
In this chapter summarised information from the National Water Resource Strategy (NWRS)(DWAF, 2003b) and the “Overview of Water Resources Availability and Utilisation” reports forthe Thukela WMA (DWAF, 2003a) is included to provide the reader with the requiredbackground of the water situation in the Thukela WMA. When more detailed backgroundinformation is required the reader is referred to the NWRS document and secondly to the“Overview of Water Resources Availability and Utilisation” reports for each WMA. Thesereports should in general provide sufficient detail for most readers. Even more detail can beobtained from the “Water Resources Situation Assessment Study” as prepared for each WaterManagement Area (DWAF, 2002b).
In addition to the above references, the reader is also referred to a list of policy documentation,legislation, regional planning, departmental guidelines and previous water resources relatedstudies for detailed information. A list of these information sources is provided in Annexure A.
2.2 LOCALITY AND PHYSICAL CHARACTERISTICS
2.2.1 Geographic subdivision
The Thukela River originates in the Drakensberg Mountain Range along the border betweenLesotho and the KwaZulu-Natal Province of South Africa. The river meanders through centralKwaZulu-Natal and discharges into the Indian Ocean (see Figure 2.1). The Little Thukela, Klip,Bloukrans, Bushmans, Sundays, Mooi and Buffalo rivers are the major tributaries of theThukela, which together make up the ‘V’ Hydrological Drainage with its 88 quaternarycatchments. The total area of the Thukela River catchment is approximately 30 000 km2 inextent.
2.2.2 Topography
The Thukela River and some of its main tributaries rise in the west of the catchment in the highlying Drakensberg Mountain Range. The headwaters of the main stem Thukela River originatesat an elevation of some 3 000 m.a.s.l. The river then winds its way through gently rolling hillsbefore entering steep sided gorges below Colenso. This rugged topography continues down tothe river mouth only broken occasionally by flatter, more densely populated floodplains (e.g.Tugela Estates and Tugela Ferry). The Little Thukela, Bushmans, Sundays and Mooi Riversmeander down through the mountains through relatively undulating terrain before joining theThukela River. The source of the Buffalo River is also reasonably high lying but flows throughmore rugged topography and gorges in the lower half of its trajectory.
2.2.3 Geology and Soils
A broad map of the geology of the Thukela River Catchment is shown in Figure 2.2 whileFigure 2.3 provides a generalised soil map of the catchment. The upper and middle ThukelaRiver flows eastwards through a succession of sedimentary strata of the Karoo Supergroup,ranging from the younger rocks of the Triassic System (situated just below the Drakensburgvolcanics) to the base of the Karoo succession in the Tugela Ferry area. The geomorphologyof the Thukela River is strongly associated with the underlying geology and the erosionresistance of the various formations on a regional scale is reflected by these characteristics.Parts of the catchment are quite densely populated. The arid and often erosive landscape,coupled with overgrazing and extreme pressure on natural resources has led to the loss ofvegetative cover, erosion, and sedimentation. Land reform projects are sometimes resulting intoo many people being settled on the land, with consequent unsustainable use. This should be
· Page 12
Thukela Water Management Area Internal Strategic Perspective
taken up with both the Department of Agriculture (DA) and the Department of Land Affairs(DLA) (see Strategy 2.2 in Part B of this document).
The average annual sediment load at the Thukela Mouth has been estimated at 5.5 million tons(Midgley et al, 1994). Marine biologists also maintain that the marine environment in the vicinityof the mouth (known as the Thukela Marine Banks) is maintained by sediment deposited on thecontinental shelf.
2.2.4 Climate
The Thukela River catchment experiences a wide variety of weather conditions ranging fromgenerally wet and cold in the Drakensberg Mountains, to dry and hot in the Thukela Valley fromColenso down towards the coast, and hot and humid and reasonably well watered at the coast.The region receives most of its rainfall in summer between September and April. Snow fallsare common in winter along the Drakensberg Mountain peaks, which melt fairly quickly. Theaverage rainfall ranges from about 1 500 mm per annum in the mountains to about 650 mm perannum in the central parts of the catchment. There is a slight increase in rainfall towards thecoast as is shown on the isohyetal map in Figure 2.4.
Annual runoff varies from 600 mm in the Drakensberg to as little as 50 mm in the dry bushveldareas with an estimated natural Mean Annual Runoff (MAR) of 3799 million m3/a at the rivermouth. Rainfall is however erratic and years of prolonged drought in the central and lowercatchment alternate with very wet periods.
The generalised Mean Annual (gross Symon’s Pan) Evaporation (MAE) varies from about 1300mm in the higher lying western areas to around 1500 mm in the lower lying central parts of thecatchment.
2.2.5 Vegetation
As would be expected, natural vegetation types of the Thukela River Catchment follow a similarpattern to its geology. Montane grasslands covers the higher lying areas giving way toSouthern Tall Grassveld interspersed with invading Acacia sieberiana savanna and tilledagriculture in the lower parts of the Upper Thukela Sub-catchment between Bergville andColenso.
Moving downstream past Colenso, vegetation slowly changes to Valley Bushveld. Coastalgrasslands and sugar cane farming characterise the lower part of the catchment. The MooiRiver system is mainly modified by pastural farming practices with areas of indigenous sub-tropical forests along the steeper parts of this sub-catchment. Cattle farming bushvelddominates the Buffalo River Sub-catchment with the exception of montane grasslands in theupper part of this sub-catchment.
Active intervention of the National Working for Water Programme and local residentorganisations have been very successful in controlling invasive alien vegetation in parts of thiscatchment. The Upper Thukela River Catchment has been cleared of much of the Black andSilver Wattle infestations. Aquatic weeds have not been noted as a problem in the ThukelaRiver Catchment.
2.2.6 Indigenous Fauna
The upper Drakensberg area along the border with Lesotho is a conservation area and much ofthe fauna is protected. The environment in the upper parts of the catchment still has naturallyoccurring small game and their predators, reptiles and a wealth of bird species. Commercialgame and stock farming has proliferated in the central catchment where there is a trendtowards the former. There are also large tracts of fairly densely settled communities which relyon subsistence agriculture. The resultant human pressure on the environment has had a
· Page 13

Thukela Water Management Area Internal Strategic Perspective
negative impact on the animal and bird populations. The aquatic riverine environment has beensignificantly modified in certain areas by development pressure on the river system. A numberof indigenous fish species still remain along with exotic fish species (including trout and bass)dominating the various dams along these watercourses.
2.2.7 Environmentally Sensitive Areas
The Ecological Reserve has recently been determined for the Thukela River Catchment.Implementation of the Reserve and conservation of the aquatic riparian habitats of this riversystem will need due consideration in future.
The following aspects and issues may need specific attention:
· More knowledge regarding the status of all the natural habitats in the Thukela RiverCatchment is required.
· Soils in the Drakensberg Mountain Range is relatively shallow. Pressure from humanactivities outside of the protected areas, particularly in the subsistence agriculture areas, isresulting in soil erosion with the consequent loss of habitat and siltation of dams in theupper catchment. The lower Drakensberg areas and specifically the Mweni Valley are themost effected.
· Severe overgrazing and soil erosion problems are being experienced in the DriefonteinBlock and Matiwaneskop areas to the north west and north of Ladysmith. Similar problemsare being experienced on the land reform projects around Weenen and Estcourt.
· The wetlands and sponges in the upper and middle Drakensberg are at present not undermajor threat of destruction due to their remoteness and the fact that this is a protectedarea. These resources need to be preserved as far as possible due to their critical role insupplying baseflows in all the rivers.
These issues have been referenced in Strategies 2.1 and 2.2 in Part B of this document.
2.3 DEMOGRAPHY, LAND USE AND DEVELOPMENT
2.3.1 Population and Domestic Water Supply
Current population estimates as recorded in the Thukela WMA Report (DWAF, 2003) indicatethat there was a total population of about 1 537 000 people in 1995. The population distributionis shown on the map provided in Figure 2.5. The largest concentrations of this populationoccur around Newcastle in the north of the catchment, Ladysmith (including Roosboom,Driefontein, Matiwaneskop, Elandslaagte and Ekuvukeni/Tholeni) and the upper Thukela area(Okahlamba Tribal areas), Estcourt, Tugela Ferry, and along the lower Thukela River. TheNewcastle area accounts for over 280 000 people alone.
The most sparsely populated areas are located in the south-west and in the north-east of theWMA, the Mooi River catchment and Utrecht. Population densities are lower in the interior ofthe WMA and increase in a west and south-east direction.
The dominant population group is the Black race (92%), followed by the White (4%) andIndian/Asian (3%) race groups. On average, the number of females is higher than that of themales (54%: 46%). The dominant age group in the WMA is the 0 - 15 years group (43%),followed by 16 – 30 years group (28%), then the 31 – 60 years group (23%) and greater than60 years group (6%).
Population growth in the rural areas is likely to be influenced by the impacts of HIV/AIDS andmigration to urban areas. It is likely that there will be little change in the demography in the
· Page 14

Thukela Water Management Area Internal Strategic Perspective
foreseeable future and there may even be a decline in the rural population. Population growthin the urban areas is likely to be driven by the above-mentioned migration as well as economicopportunities and potential. Small to moderate growth in the urban population is anticipated asjob-seekers are attracted by opportunities associated with the potential growth in industrialactivity.
Estimates of the unemployment rate have been quoted at around 60% in this catchment withhigh levels of poverty and high incidences of HIV/AIDS infections being reported. Poverty-stricken areas within the Thukela WMA are mainly in the central and lower areas of the WMA,where only a small percentage of the population are employed and of this percentage thebigger portion do not earn income but are paid in kind. Although employment in the upstreamcatchments of the WMA is moderately high, the level of individual income is very low. Livingstandards are reasonably good when compared with other parts of South Africa due totraditional houses that people build and their ability to harvest natural resources for food andthe production of commercial products (e.g. selling reed sleeping mats and the African Potato inthe bigger metropolitan areas). It should be noted that development planning in the various spheres of local government isfairly advanced, particularly with both Integrated Development Plans (IDP) and Water ServicesDevelopment Plans (WSDP). Government policies regarding free basic water have been verysuccessfully implemented in the Umzinyathi and uThukela District Municipal areas.
The following may also need to be considered by DWAF :
· Planning data, particularly population statistics and projections, needs to be correlated withDistrict and Local Municipalities to arrive at uniform planning data.
· A lack of adequate (and appropriate) sanitation still remains a problem.
2.3.2 Land use
From a water resources point of view, irrigation is a significant land use. According to theThukela WMA Report (DWAF, 2003), the estimated irrigated area is some 276 km2. Theirrigation requirements according to various references are listed in Table 2.1. A directcomparison between these requirements is not appropriate since the values reflectdevelopment levels in different years and the assurance of supply related to these requirementsmay not be the same. It should be noted that there is more variation at a tertiary catchmentlevel. It is therefore concluded that the irrigation areas need to be reviewed.
Table 2.1: Comparison of irrigation water requirements from different sources.
Source of data Irrigation requirement (million m3/a)
Assurance ofsupply
TWP Feasibility Study 323 Average requirementDWAF Registration Database(WARMS)
209 Average requirement
Water Resources SituationAssessment
229 1:50 years
NWRS 230 1:50 yearsVAPS 231 1:50 years
· Page 15

Thukela Water Management Area Internal Strategic Perspective
It is thought that the registered water use underestimates the actual water use in thecatchment. The implication of this is that much of the irrigation water use in the Thukela WMAis now illegal. A case in point is the Sundays River Key Area where the estimated irrigationrequirement is 34 million m3/a (DWAF, 2004a) while the registered water use is only 3,7 millionm3/a. Strategy 1.2 in Part B of this report deals with this problem.
Another important land-use that has an impact on the water resources of the Thukela Rivercatchment is commercial timber. The afforestation data acquired from different sources islisted in Table 2.2, which reveals a significant difference in the areas of commercial timber.
Table 2.2: Estimates of the extent of commercial forestry in the Thukela WMA.
Source of data Extent of afforestation (km2)Water Resources Situation AssessmentReport (DWAF, 2002)
226.3
Vaal Augmentation Planning Study (DWAF,1996)
340.0
Thukela WMA Report (DWAF, 2003) 226.8DWAF registration database (2003) 947.8Timber Handy Reference Manual (DWAF,1997)
226.3
The WRSA report (DWAF, 2002), the WMA report (DWAF, 2003) and the Handy ReferenceManual (DWAF, 1997) are all based on the CSIR Landsat imagery of 1995 and, notsurprisingly, all quote the same area. The large difference between the registered forestry andall other sources is a cause for concern and this will need to be verified at some point. This isdealt with in Strategy 1.2 in Part B of this report.
Mining activities in the Thukela WMA do not use significant amounts of water, but do impact onthe water quality, especially in the Buffalo River and Sundays River catchments. The coalmines scattered all over the northern parts of the Thukela River catchment have either beenclosed for a number of years or are in the process of closing down. Many of the older mineswere never rehabilitated adequately. Consequently, these mines produce acid mine decantthat enters the Thukela River system. The worst affected areas are around Newcastle (Buffaloand Ngagane rivers).
Industry as a land-use is not significant in the Thukela WMA. Small to medium-sized industriesare situated in the peripheral industrial zones in and around Newcastle, Ladysmith andEstcourt. No major future growth in industry is expected unless active Government interventionis brought to bear on the region.
2.3.3 Existing water related infrastructure
There are a number of large dams in the Thukela WMA, some of which make up the Thukela-Vaal Transfer Scheme. The largest of these is Woodstock Dam, from which water is releasedto the Driel Barrage near Bergville. Water is then pumped into a canal that conveys this waterto the Kilburn Dam, from which it is pumped over the escarpment from the Kilburn Dam into theDriekloof Dam (at the upper end of the Sterkfontein Dam).
Spioenkop Dam supplies the downstream requirements of Ladysmith and irrigated agriculture.In future the dam could be used to supplement flows in the lower Thukela to ensure that thewater requirements of the Fairbreeze Mine, the Sappi mill at Mandini and the ecology are met.
Other significant infrastructure is Zaaihoek Dam on the Slang River (a tributary of the BuffaloRiver) with its related pump station and pipeline. This scheme, situated in the northern part of
· Page 16

Thukela Water Management Area Internal Strategic Perspective
the WMA, was constructed primarily to transfer water to the Eastern Vaal sub-system. Somewater is also released to local users.
Ntshingwayo Dam (formerly Chelmsford Dam) in the Buffalo River in the northern part of theWMA supplies water to Newcastle, while Wagendrift Dam in the Bushmans River near Escourtsupplies water to irrigators and the town of Escourt.
A list of all dams in the WMA is attached as Annexure B.
2.4 REGIONAL ECONOMY
This section was sourced from the Thukela WMA report (DWAF, 2003).
Less than 2% of the Gross Domestic Product (GDP) of South Africa originated from theThukela WMA in 1997. Compared to other WMAs, the Thukela WMA has one of the smallesteconomies in the country. The largest economic sectors (in 1997) in the WMA, in terms ofGGP, were:
· Manufacturing: 27,9%
· Government: 14,3%
· Trade: 11,2%
· Transport: 9,8%
Geographically, over 30% of the GGP is derived from the Newcastle area, followed byLadysmith, Escourt and Dundee in descending order, with about 30% produced over theremainder of the WMA.
The main manufacturing centres in the Thukela WMA are Newcastle, Escourt and Ladysmith,which also corresponds to the geographic distribution of contributions to the GGP. Theimportance of the manufacturing sector is to a large extent attributable to the influence of theIscor iron and steel plant at Newcastle. The manufacturing sector in the water managementarea has also undergone structural change from heavy to light industries, such as for themanufacturing of textiles, clothing, footwear and leather products.
Activities in the government sector in the WMA include items such as local government andrelated services, law and order, education, public health care and conservation services.
The trade and tourism sector is also an important contributor to the regional economy. Tradeactivities are well diversified with close linkages to the other economic sectors. Tourism in theWMA mainly relates to eco-tourism because of the natural beauty and historical sites.
The importance of the transportation sector can be contributed to export and primary productsand other manufacturing commodities as well as to the main transportation routes through thearea.
Many people in the WMA are dependent on agriculture for their livelihood. Agriculture is mostproductive in the Dundee and Escourt districts. Subsistence farming is practised on communalland, which cover much of the WMA (see Figure 2.6). Of the work force of 254 000 people in1994, 50% were active in the formal economy, 35% were unemployed (compared to thenational average of 29%), with the remaining 15% in the informal economy. Of those formallyemployed, 31% were in the government sector, 20% in agriculture (and forestry) and 16% inmanufacturing.
· Page 17
Thukela Water Management Area Internal Strategic Perspective
Attributable to a favourable climate and good transportation infrastructure, the economy of theThukela WMA has relatively good potential with respect to the agriculture and forestry,transport and manufacturing sectors. The comparative advantage of the agricultural sector canbe attributed to the diversity of products in the WMA as well as the potential for further forestrydevelopments. The manufacturing sector’s comparative advantage is mainly as a result of thenumerous large manufacturing activities together with small inter-linked concerns currentlyoperational in the WMA, and which provide opportunity for the broader resurgence ofmanufacturing in the region. There is a lack of strong economic drivers, however, such as newmining developments or the immediate proximity of export facilities.
Although a fairly strong sector in the regional economy, trade and tourism in the WMA do nothave a comparative advantage in the national context.
2.5 NATIONAL AND REGIONAL WATER PLANS AND OTHER LEGISLATION
The NWA, the NWRS and the CMS will form the guiding principles in preparing further waterpolicy and plans in managing the water resources of the catchment. This legislation and thestrategy documents are inextricably linked to national policies (e.g. poverty eradication andsocio-economic development), other legislation (e.g. environmental laws and regulations), aswell as regional integrated development planning. The NWRS has been published for publiccomment and will be ratified in due course. The CMS will be developed once the CMA is fullyfunctional.
Water Service Development Plans (WSDP) have recently been prepared by all the local anddistrict authorities. It has been noticed that water resource planning has not been sufficientlyincluded into these WSDPs and it is intended that this ISP inform these planning processes infuture.
A proposal for the development of the Thukela CMA has been developed and has beensubmitted to the Minister for consideration. In the interim, this ISP will serve as DWAF'sstrategy to manage the water resources in the Thukela River catchment. This ISP is alsointended to provide a portion of DWAFs input to the development of the CMS.
Co-operative governance (co-ordinated planning and co-operation with other national,provincial, district and local authorities) and other legal requirements need to be co-ordinated.Innovative communication strategies need to be developed to encourage this synergy, which isintended to streamline public service inputs into the provision of an enabling environment thatcan encourage equitable and sustainable social and economic development. The Directorateof Social and Environmental Services in DWAF have recently gazetted a ConsolidatedEnvironmental Implementation and Management Plan (CEIMP) which spells out how theDepartment will incorporate all relevant environmental and other legislation into its waterresources management and other responsibilities. This CEIMP forms the backbone of theEnvironmental Strategy presented in this ISP.
2.6 INSTITUTIONS
There are five types of water-related institutions, which play a role in the Thukela WMA. Theseare:
· District Municipalities;· Local Municipalities;· Irrigation Boards (and Water User Associations);· Water Boards, and· DWAF's Regional Office (in lieu of the CMA).
District Municipalities (see Figure 2.7) are defined as Water Services Authorities (WSA) interms of the Water Services Act (Act 108 of 1997), and are responsible for preparing Integrated
· Page 18

Thukela Water Management Area Internal Strategic Perspective
Development Plans (IDP). It is important to bear in mind though, that a Local Municipality (seebelow) can also become a Water Services Authority. An IDP is a principal strategic planninginstrument, which guides and informs all planning, budgeting, management and decision-making in a municipality. The Water Services Act states that a Water Services DevelopmentPlan (see Local Municipalities below) must be part of the process of developing an IDP, andthis is an important link between District Municipalities and the water sector. Water ServicesAuthorities are also responsible for sanitation services and therefore play an important role inmaintaining the water quality of the catchment at an acceptable level.
Local Municipalities (see Figure 2.8) are responsible for the preparation of a Water ServicesDevelopment Plan (WSDP). The essential difference between an IDP and a WSDP is that aWSDP deals with water services while an IDP deals with all services. A WSDP must contain awater balance component which provides a point of reference for what is possible and what isnot possible in terms of integrated development planning which impacts upon water resources.As the name indicates, this plan deals with water services, but in preparing a WSDP LocalMunicipalities must take cognisance of water related planning initiatives such as:
· Catchment Management Strategies· Business plans of water boards· Business plans of other water services providers.
This ISP forms an important step towards preparing a CMS and it is therefore essential that allIDPs and WSDPs in the Thukela WMA are in harmony with this ISP, especially with regard tosources of raw water, to ensure co-ordinated planning.
Irrigation Boards were established under the old Water Act to administer the bulk distribution ofwater to irrigators within a defined area. Under the National Water Act, Irrigation Boards mustbe transformed to form Water User Associations, which will fulfil a similar function to anirrigation board but need not necessarily be limited only to irrigation practices.
Water Boards are classified in terms of the Water Services Act as Water Services Providersand in this respect fulfil a similar role to Local Municipalities. The difference is that a WaterBoard deals only with water matters, usually bulk water distribution, and not any other services.There are no water boards in the Thukela WMA.
Although not an institution per se, the so-called Provincial Liaison Committee (PLC) also plays arole in water matters as does its sub-committee, the Water Resources Planning sub-committee.The purpose of the PLC is to foster communication and co-operation with ProvincialGovernment, Water Boards and important stakeholders such as the Forestry IndustryAssociation and Sugar Association. This committee currently serves the whole of KwaZulu-Natal and is not limited to only the Thukela WMA. This committee meets about twice a year.The Water Resources Planning sub-committee co-ordinates water related planning activities inthe Province while the Co-ordinating Committee for Agricultural Water (CCAW) (formerly theIrrigation Action Committee) deals with matters related to irrigation, and the Department ofLocal Government’s Water and Sanitation sub-committee deals with water services matters.
The Department of Water Affairs and Forestry is the custodian of the water resources of SouthAfrica. Under the National Water Act, DWAF's Regional Office will fulfil the role of theCatchment Management Agency until such time as the CMA is in place and fully functional.
2.7 International
The eastern boundary of the Thukela WMA borders on the Kingdom of Lesotho. Thewatershed of the Thukela Catchment also runs along this border. As such, the water resourcesof the Thukela Catchment are fully contained within the WMA and Lesotho has no interest inthese resources.
· Page 19
Thukela Water Management Area Internal Strategic Perspective
3. GROUNDWATER
3.1 INTRODUCTION
The geohydrogeological conditions prevailing in this WMA are well understood as a result ofthe DWAF 1995 KwaZulu-Natal Groundwater Resources Mapping and CharacterisationProject, the reports of which in respect of Units 1, 6 (very minor coverage), 8, 9 and 11, withrelated maps, cover the area of the Thukela WMA. Since the publication of these reports, thesituation in respect of the groundwater conditions in the WMA have not changed to anysignificant extent.
Physiographically the WMA comprises a number of low-standing valley sub-basins of themajor tributary rivers, the orientation of which changes from southwest-northeast to the southof the main Thukela River in the centre of the main basin (Mooi, Bushmans) to northwest-southeast to its north (Klip, Sundays and Buffalo). These sub-basins are separated byintervening high-standing influve ridges, the margins of the main basin likewise being boundedby elevated interfluve ridges. Whereas topography in the interior portions of the sub-basinbottoms is relatively flat, eastwards and seawards the topography becomes increasingly steepand strongly dissected.
3.2 GEOLOGY
Geologically the WMA comprises two structurally different portions. These comprise theunfaulted major interior portion of the WMA wherein the bedding of the sedimentary Karoorocks is either sub-horizontal or it has a very gentle inland dip to the west, and a minoreastern coastal and coastal hinterland portion wherein the structure comprises numeroussouth easterly or seaward tilted fault blocks. The latter area is characterised by numerousmajor faults of Gondwana breakup, late Jurassic age, the presence of which gives rise tocomplex geological conditions here. The major west-east Tugela Fault extends into the majorwestern portion of the basin.
In the low standing east central portion of the basin, and extending east to within about 20 kmof the coast - ‘Basement’ rocks are exposed, these comprising granite-gneiss, schists andamphibolites. Except along the northern margin of this portion of the basin and where muchthe same but much older rock-types are exposed, these comprising the southern limit of themuch older Kaapvaal craton, these rocks comprise part of the considerably younger Nama-Natal Structural and Metamorphic Province. All the ‘Basement’ rocks are generally stronglyfoliated and jointed.
These ‘Basement’ rocks are unconformably overlain in the east by sandstones of the NatalGroup which are in turn overlain unconformably by the basal tillite of the Dwyka Formation ofthe Karoo Supergroup and the sandstones and shales of the Ecca Group which are muchintruded by subaccordant sheets of Karoo dolerite. Along the short coastal portion of theWMA, unconsolidated dune deposits of variously in situ-weathered sediments overlie thebedrock formations (Berea-type red sand). The lower courses of the rivers in this region areunderlain by considerable (up to 60 m) thicknesses of alluvial and estuarine sediments, thoseof the former type generally being sandy, and those of the latter clayey.
By contrast the major and extensive interior portion of the WMA comprises gently westwards-dipping shales, mudstones and sandstones of the Ecca and Beaufort Groups (KarooSupergroup). In the eastern portion of the basin the Dwyka tillite rests unconformably on‘Basement’ rocks, without the intervention of the Natal Group sandstone. In the Ladysmith-Dundee-Newcastle portion of the basin, coal occurs and has been long-term mined, thisoccurring in the Vryheid Formation of the Ecca Group. The Karoo sediments in this portion ofthe WMA are much intruded by subaccordant sheets, and to a lesser extent by near-verticaldykes of Karoo dolerite. The major high Drakensberg escarpment that occurs along thesouthern portion of the western boundary of the WMA comprises flat-lying extrusive basalt.
· Page 20
Thukela Water Management Area Internal Strategic Perspective
On account of its relative resistence to erosion, the Karoo dolerite sheets, especially thethicker ones, generally give rise to very prominent high-standing topographic features in theinterior basin portion of the WMA. Also of extensive occurrence in the interior basin portion ofthe WMA is the highly erodible unconsolidated Late Pleistocene sandy clay colluvial surficialdeposit of the Masotcheni Formation that can be up to 15 to 20 m thick in places, it restingunconformably on the bedrock. It is characterised by the extensive occurrence of erosiondongas of various sizes.
Virtually all the WMA comprises ‘hard rock’ secondary porosity aquifers of the ‘weathered andfractured’ and ‘fractured’ aquifer classes. Faults, joints and intrusive Karoo dolerite contactsin the regional ‘hard rocks’, are zones usually of increased groundwater presence. In thecoastal zone, sandy alluvium, that is a primary porosity groundwater aquifer of the‘intergranular’ class and up to about 30 to 50 m in thickness, is generally present. Bycontrast, the depth of sandy alluvium in the river beds in the interior portion of the WMAseldom exceeds about 5 m. The poorest groundwater aquifer in the region is without doubtthe Dwyka tillite. In the interior the best aquifer is sandstones of the Vryheid Formation, in thecoastal zone sandstones of the Natal Group being the best aquifer. Overall the highestyielding aquifers are faults and joints in the coastal region, and in the interior intrusive Karoodolerite contact zones, both sheets and dykes, in the Karoo Supergroup sedimentary rockswhich are of very extensive occurrence here.
Except in one instance where water for the village of Nqutu is abstracted from the primaryporosity intergranular sand aquifer in the river bed of the Buffalo River at Vant’s Drift bymeans of a system of lateral screen caisson wells, which actually draw down surface waterflowing on the river bed, all groundwater abstraction in the WMA is by means of ‘hard rock’boreholes located in the secondary porosity ‘hard rock’ aquifers. Natural springs andseepages, although their flows are markedly seasonally affected, are extensively exploited asdomestic water supply sources in the rural residential and agricultural portions of the WMA.With the provision of piped domestic water supply to a considerable proportion of such areasin recent years, dependence on this types of water resource for domestic use is now decliningmarkedly in the WMA.
Groundwater yields from ‘hard-rock’ boreholes in the WMA are generally low and in the range0,1 to 0,6 l/s, although significantly higher yields (3 /s) can be obtained in hydrogeologicallyfavourable situations, such as intrusive Karoo dolerite contact zones. There is little differencein yield between the various geological formations present. Median depth to the water table inthe WMA is 20 m.
Groundwater quality in the WMA is generally good, with the best quality groundwater found inthe higher rainfall portions and the poorest quality found in the lower rainfall areas. The totalDissolved Solid (TDS) content of the groundwater is generally in the range 90 to 200 mg/l, butit can rise to very considerably more than 500 mg/l in the lower rainfall portions of the WMA.Groundwater pollution in the WMA is generally not of significant proportions and, wherepresent, it is very localised. Significant pollution of the groundwater can be present (althoughalso localised) in the northwest portion of the WMA (Ladysmith-Dundee-Newcastle) whereunderground coal mining and the dumping of mine discard material has taken place over thelast 100 years or more.
Groundwater recharge over the WMA varies from 1 to 5 per cent of the MAP, with anaverage of about 3 per cent of the MAP. Overall, average annual recharge over the WMA issome 25000 m³/km², varying from about 40 000 m³/km² in the higher rainfall portions of thearea, to about 15 000 m³/km² in the portions of the area of lower rainfall.
The WARMS data indicates that present groundwater usage in the Thukela WMA is about2,75 million m³/a. This converts to a usage of only 100 m³/km²/a over the WMA as a whole,which is only some 0,4 per cent of the mean annual recharge over the area. Usage is lowestin the areas of low-density population and highest in its more densely populated rural areas. Itis evident that present groundwater usage in the WMA is in the low to very low range in terms
· Page 21

Thukela Water Management Area Internal Strategic Perspective
of the sustainability of the available resource. Groundwater usage in the WMA can thus besafely increased very considerably without detrimental impact on the resource.
The interaction between groundwater abstraction and surface water flow is thought to be verylow in the Thukela WMA due to the generally low porosity of the rock in the WMA. Increasedgroundwater use should therefore not impact significantly on the surface water resource.
3.3 CONCLUSION
From the above it is evident that current exploitation of the groundwater resource available inthe WMA is at a very low level in terms of its potential. In terms of the prevailinghydrogeological conditions in the WMA, this potential can be most usefully and effectivelyexploited in the relatively sparsely inhabited portions of the area for the provision of domesticwater supply. In general, the nature of the ‘hard-rock’ aquifers present is appropriate for thistype of water supply. Very considerable exploitation of the available resource for this purposeis possible with no long-term depletion of the resource being likely to occur as a result thereof.Such usage can best be provided by the relevant Local Authorities. The involvement of localcommunities in any such rural domestic water supply projects is imperative.
· Page 22

Thukela Water Management Area Internal Strategic Perspective
4. WATER RESOURCES MANAGEMENT PERSPECTIVES OF THE THUKELA WMA
4.1 INTRODUCTION
The broad water resources and water quality perspectives of the Thukela WMA are provided inthis chapter, from which the key issues have been identified and broad strategies developed.The details of the various strategies are attached in the strategy tables provided in Part B ofthis report.
This chapter outlines the details of the water resources, water requirements and water quality ofthe catchment as obtained through the ISP process. Much of the data relating to the wateravailability and water requirements have been obtained from the Thukela ReserveDetermination Study (DWAF, 2004b).
The Water Resources Yield Model (WRYM) was used to simulate the Thukela River System fora number of Ecological Reserve Scenarios for the Thukela Reserve Determination Study(DWAF, 2004a). The original WRYM that was set up for the Thukela Water Project (TWP),Feasibility Study (DWAF, 2002a) was used and modified during this assignment. A wateraccounts exercise was undertaken to determine the impacts of selected Ecological Reservescenarios on the local economy of the Thukela catchment. The main objective was todetermine the current and projected impact on water allocations that could be expected with theimplementation of the ecological Reserve under different scenarios. The analyses wereundertaken for the seven catchment areas (or Key Areas) listed below using the finalrecommended Reserve scenario:
· Upper Thukela (tertiary catchments V11, V12, V14 and quaternaries, V60G, H and J);
· Little Thukela (tertiary catchment V13);
· Bushmans (tertiary catchment V70);
· Sundays (quaternary catchments V60A, B, C, D, E and F);
· Mooi (tertiary catchment V20);
· Buffalo (tertiary catchments V31, V32 and quaternaries, V33A and B);
· Lower Thukela (tertiary catchments V40, V50 and quaternaries, V33C, D and V60K);
The locations of the various Key Areas are shown Figure 3.1. This figure also shows the foursub-areas as defined and used for the balance calculations in the NWRS. The water resource evaluations undertaken in each of the above-mentioned Key Areas for theThukela Reserve Determination Study (DWAF, 2004b) have been summarised in the followingsections of this report and form the basis of this ISP. Due to the much higher level of detailafforded to the Thukela Reserve Determination Study than the NWRS, the situation portrayedin this ISP offers important (and significant) improvements on the NWRS. The main differencesbetween the situation portrayed in this ISP and the NWRS are discussed in detail in Section4.13.
4.2 WATER RESOURCE EVALUATION METHODOLOGY
This section briefly describes the methodology that was applied to derive the water balancefigures presented in the remainder of this chapter.
· Page 23

Thukela Water Management Area Internal Strategic Perspective
4.2.1 Source of information
The results on which the water balance calculations are based were derived from the WRYMsystem analysis which was set up for the Thukela Reserve Determination Study (DWAF,2004b). This is the latest available system but required a re-evaluation for the purposes of thisISP. The reason for this is that the analysis carried out for the Thukela Reserve DeterminationStudy was focused on determining the economic impacts of the Reserve and not ondetermining the currently available allocable resource.
4.2.2 Ecological Reserve Scenario
The final recommended Reserve (Scenario 9/10), as determined in the Thukela ReserveDetermination Study (DWAF, 2004b), was used as the basis for determining the available waterresources in the Thukela WMA. However, it has been assumed in this ISP that the Reserve willnot be implemented immediately in the stressed catchments of the Little Thukela and SundaysKey Areas. The implication of this is that additional releases are required from the Spioenkopand Wagendrift dams to meet the Reserve on the main stem of the Thukela River, and hencereducing the currently available surplus in these dams.
4.2.3 Simulation record
The systems analysis was undertaken using the historical record period only.
4.2.4 User requirements
The final analyses undertaken in the Reserve Determination Study (DWAF, 2004b) todetermine the impact of implementing the Reserve was based on the projected waterrequirements as at 2005. These user requirements were accepted for use in the ISP waterbalance procedure. It was assumed that urban/industrial sectors receive their water at a 1:50year assurance while irrigators receive their water at an 80% assurance.
4.3 RECONCILIATION METHODOLOGY
The reconciliation of the water requirements and the available yield in the system was carriedout by firstly determining excess yield at the most downstream point of each of the seven KeyAreas. This was done with the Water Resources Yield Model set up for the Thukela ReserveDetermination Study (DWAF, 2004b). The excess yield was determined by allowing supportfrom the major dams in the system but farm dams were only allowed to support the waterrequirements that are directly imposed on them. Excess yield from farm dams, if any, istherefore not reflected in the water balances of this ISP. The assurance of the excess yield wasassumed to be at a recurrence interval of 1:50 years (i.e. the same as that for theurban/industrial sector).
While the excess yield or balance of each Key Area was determined using the rigoroustechniques described above, a simple reconciliation of water requirements and the waterresource is useful for reporting purposes. This was done by expressing water requirements atan equivalent 1:50 year assurance. Urban and industrial water requirements were assumed tobe at a 1:50 year assurance while irrigation requirements were reduced to a 80% assurance bymultiplying by a factor of 0.85. The water resource as given in the various tables in this reportwere then calculated by adding the surplus yield to the water requirements at equivalentassurance. The important point that the reader must bear in mind is that while the waterrequirements and the water resource (expressed at a 1:50 year assurance) are approximations,the water balance has been determined using rigorous techniques.
· Page 24

Thukela Water Management Area Internal Strategic Perspective
4.3.1 Water resource
The surface water resource could, in most cases, be inferred from the water balance. However,in those catchments where there is a deficit, the available yield is zero and it is not possible toinfer the resource from the balance. In these cases (Little Thukela, Sundays and the Mooi KeyAreas), the surface water resources were determined by means of an incremental yield analysisusing Version 2 of the Rapid Simulation Model (Mallory, 2003).
4.3.2 Analysis of the transfers
In the water resources analyses, the Thukela-Vaal and Mooi-Mgeni transfers were assumed tobe operated at their maximum capacities while water is available at their respective abstractionpoints, but taking into account the downstream ecological Reserve requirements. The transfervolume from Zaaihoek Dam was determined from the capacity of the pumping station andassuming continuous pumping. The Middeldrift and Fairbreeze transfers (located in the LowerThukela Key Area) were assumed to be supported by releases from Spioenkop and Wagendriftdams.
4.3.4 Impact of the Ecological Reserve
The impact of the ecological Reserve (as presented in the resource availability table of eachKey Area) was calculated to be the difference in the availability between two scenarios, onewith and the other without the ecological Reserve being implemented.
4.4 OVERALL PERSPECTIVE
Sections 4.5 to 4.11 give a description of the water requirements, water resource and thereconciliation of the two for each Key Area in the Thukela WMA. However, in order tounderstand the arguments put forward, it is necessary to understand the overall water resourceperspective of the whole WMA and the proposed water resource management strategy for thewhole WMA. This overall perspective is therefore provided here as an introduction andelaborated on after the detailed discussion of each Key Area.
As part of the Thukela Reserve Determination Study (DWAF, 2004b), a comprehensive waterresource evaluation assessment was undertaken in order to understand and quantify theeconomic impact of the ecological Reserve on the economy of the WMA. This evaluationindicated substantial surpluses in the Thukela WMA even after meeting the Reserverequirements, and the intention was to use these same results for this ISP. However, aftercareful review and consideration of the Reserve Study results, it became clear thatassumptions made for the Reserve Study, while valid for Reserve determination, are not validfor the allocation of water in the Thukela WMA today or in the short term. The reasons for thisare as follows:· The Thukela Reserve water resource analysis assumed that the Reserve will ultimately be
met, and in order to achieve this, curtailments were applied within the model to usersthroughout the catchment. This curtailment results in surplus water becoming available in thelower reaches of the Thukela River.
· The Thukela Reserve water resource analysis assumed that the Spioenkop, Ntshingwayoand Wagendrift dams will all contribute to the users and the Reserve in the Lower Thukela.This conjunctive use of these three dams results in large theoretical surpluses in the LowerThukela.
· The methodology used in the Thukela Reserve analysis, whereby the excess yield isdetermined at the bottom of each key area, represents the best-case scenario. If the yield isrequired further upstream in the catchment then the excess yield is less. The reason for thisis that releases are only made from the large dams to meet the users' shortfalls after theyhave made use of run-of-river yields. The further downstream a user is situated, the more
· Page 25

Thukela Water Management Area Internal Strategic Perspective
run-of-river yield becomes available, with the result that less water needs to be releasedfrom the dams and hence more surplus is available.
This ISP, while not disputing the validity or correctness of the Reserve Determination Study,has taken a more conservative approach based on the current situation. This, together with thefollowing assumptions, results in a different view of the water resource availability in the WMA:· Any surplus in the Buffalo Key Area will be retained for use in this area and will not be used
to support users in the Lower Thukela.· The ecological Reserve will not be implemented immediately in the Little Thukela or Sundays
River Key areas because this would require compulsory licensing. In the interim, the Reservein the main stem of the River will need to be met from the Spioenkop and Wagendrift dams.Given that the Little Thukela and Sundays Key Areas cannot contribute fully to the Reserve,this reduces the yield available from these two dams.
· The surplus yield available in the other Key Areas, where applicable, has been expressed intwo forms; the maximum surplus if abstracted at the outlet of the Key Area, and theminimum if abstracted from the relevant dam (Spioenkop, Wagendrift and NtshingwayoDam).
Given the assumptions made for this ISP, the surplus yield which can be allocated now from theThukela WMA is less than the surplus indicated in the Reserve Determination study.
4.5 UPPER THUKELA KEY AREA
4.5.1 Introduction
The Upper Thukela lies in the upper reaches of the Thukela River, upstream of the confluencewith the Bushmans River, and includes the towns of Bergville, Ladysmith, Colenso andWeenen. The Thukela and Klip Rivers are the main rivers in this catchment. This area is thesource of water for the Thukela-Vaal Transfer Scheme, which, inter alia, transfers water to theVaal River System. The transfer capacity of this scheme represents a large portion (about30%) of the water resources available in the Upper Vaal WMA, which is the economic heart ofSouth Africa.
Over the last few years, the transfer has operated below capacity due to the implementation ofthe Lesotho Highlands Water Project and the preferred utilisation of this gravity feed resourceas opposed to the pumping of water through the Thukela-Vaal Transfer Scheme. It is expectedthat the transfer volume will increase over time to match the growth in the water requirements inthe Vaal River system and to supplement the water resources during periods of drought. Duringdroughts, when water is released from the Sterkfontein Dam to the Vaal Dam, the scheme willalso be operated at maximum capacity.
The Thukela-Vaal Transfer Scheme consists of the following infrastructure :
· Woodstock Dam, located on the upper reaches of the Thukela River, is the main source ofwater for the scheme. The net storage capacity of the dam is 373 million m3;
· Driel Barrage, situated on the Thukela River 7 km downstream of the Woodstock Dam.Water is released from Woodstock Dam to Driel Barrage, from where it is pumped to atransfer canal that feeds the Jagersrust Balancing Dam. The net storage capacity of DrielBarrage is 8.7 million m3;
· a transfer canal, which allows transferred water to gravitate to the Jagersrust BalancingDam before it is pumped to Kilburn and over the catchment divide to Sterkfontein Dam.The canal has a maximum capacity of some 20 m3/s;
· diversion weirs in the Upper Thukela River which divert run-of-river flows upstream ofWoodstock Dam into the above-mentioned transfer canal. The estimated capacity of these
· Page 26
Thukela Water Management Area Internal Strategic Perspective
diversions is some 4 m3/s, which is additional to the total canal capacity of 20 m3/smentioned above;
· Jagersrust Balancing Dam, provides balancing storage at the end of the transfer canalfrom where water is pumped to Kilburn Dam;
· Kilburn Dam, the lower reservoir in the Eskom pump storage scheme, with an activestorage capacity of 27 million m3. Kilburn Dam provides both the storage for the transferredwater and is a sump for the water discharged after electricity generation;
· Sterkfontein Dam, located in the headwaters of the Wilge River, a main tributary of theVaal River, provides storage for water transferred over the escarpment. This dam, with acapacity of 2 617 million m3, is the 4th largest dam in South Africa. Water is released fromSterkfontein Dam to Vaal Dam when required;
· Driekloof Dam is the upper reservoir of the Eskom pump storage scheme and is situatedin the upper reaches of the Sterkfontein Dam catchment. Water can only be transferredfrom Driekloof Dam to Sterkfontein Dam when Driekloof Dam is spilling;
· Spioenkop Dam was constructed to regulate flow downstream of the Driel Barrage tomitigate the effect of the transfer scheme. This dam has a capacity of 280 million m3. Thedam also supplies water to Ladysmith and supports water requirements for the farmersbetween the dam and the confluence of the Little Thukela River. Releases are alsooccasionally called for to dilute the effluent discharged by Sappi into the lower Thukela nearthe river mouth. It should be noted, however, that SAPPI does not have a formal allocationfrom the dam. The Tugela-Mhlathuze Water Transfer Scheme at Middeldrift can also besupported from Spioenkop Dam if necessary.
The proposed Jana Dam, which forms part of the Thukela Water Project, will also be located inthis area on the Thukela River should this project proceed. It is important that the optimal long-term benefits be derived from the development of the Thukela River, and that both the nationaland local interests be considered.
4.5.2 Water availability
The MAR of the Upper Thukela Key Area is 1 256 million m3/a.
The gross available surface water resource in the Upper Thukela Key Area based on currentdevelopment levels is estimated to be between 553 and 570 million m3/a deperning on where inthe Key Area the water is supplied to (see Table 4.1) The available water is derived mainlyfrom the Woodstock/Driel system and Spioenkop Dam. Groundwater, irrigation and urbanreturn flows contribute about 5% to the total. A substantial proportion of the undeveloped waterresource potential of the Thukela WMA lies in this area, with the proposed Jana Dam, acomponent of the Thukela Water Project (DWAF, 2002a) with the purpose of transferring waterto the Vaal River System. The construction of Jana Dam could increase the gross availablewater resource by some 380 million m3/a according to a yield analysis that was undertaken aspart of the Thukela Reserve Determination Study (DWAF, 2004b).
It should be noted that the reduction in streamflow as a result of invasive alien plants (seeTable 4.1) was not taken into account in the Thukela Rserve Determination Study. Accordingto the Thukela WMA Report (DWAF, 2003), the extent of alien plant infestation in the UpperThukela sub-area is some 180 km2, which is more than six times that of afforestation. Whilethis seems unlikely, the impact of invasive alien plants on the available yield (as estimated forthe NWRS) has been used in this ISP. The reason for this is to rather present a slightlyconservative picture than to over-estimate the available water resource. The implication is thatif the extent and/or impact of invasive alien plants is not as severe as indicated in the Thukela
· Page 27
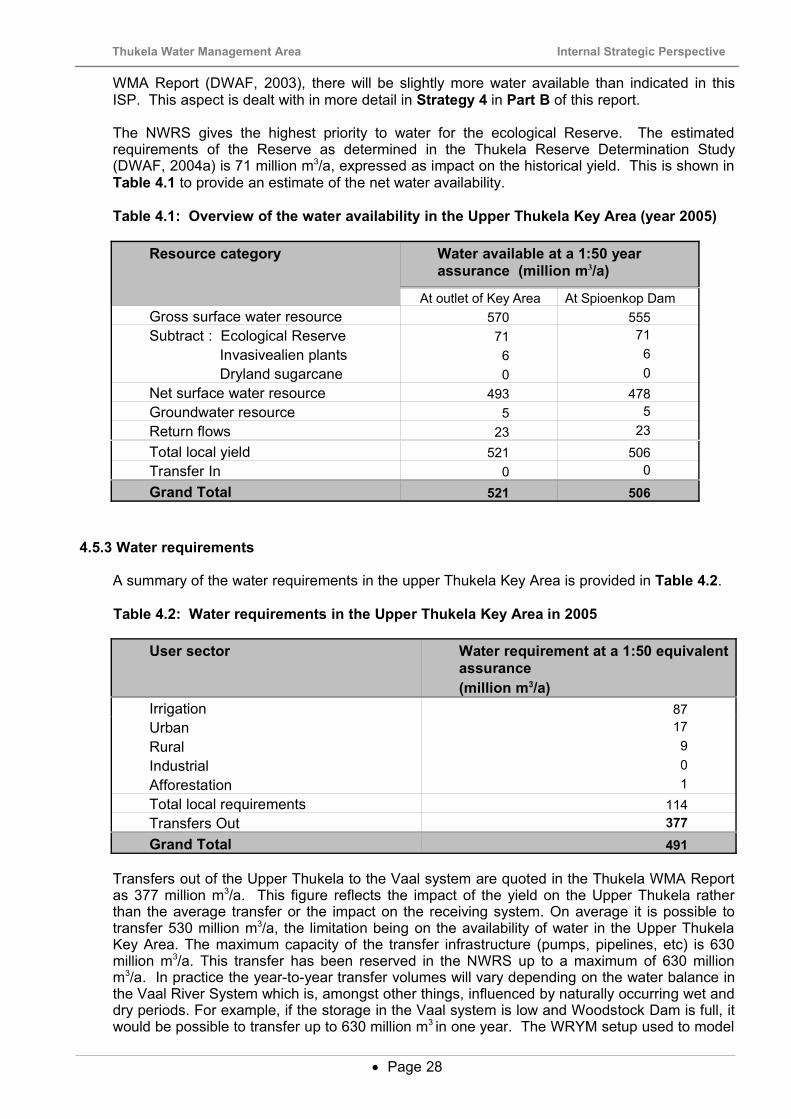
Thukela Water Management Area Internal Strategic Perspective
WMA Report (DWAF, 2003), there will be slightly more water available than indicated in thisISP. This aspect is dealt with in more detail in Strategy 4 in Part B of this report.
The NWRS gives the highest priority to water for the ecological Reserve. The estimatedrequirements of the Reserve as determined in the Thukela Reserve Determination Study(DWAF, 2004a) is 71 million m3/a, expressed as impact on the historical yield. This is shown inTable 4.1 to provide an estimate of the net water availability.
Table 4.1: Overview of the water availability in the Upper Thukela Key Area (year 2005)
Resource category Water available at a 1:50 yearassurance (million m3/a)
At outlet of Key Area At Spioenkop DamGross surface water resource 570 555Subtract : Ecological Reserve 71 71 Invasivealien plants 6 6 Dryland sugarcane 0 0Net surface water resource 493 478Groundwater resource 5 5Return flows 23 23Total local yield 521 506Transfer In 0 0
Grand Total 521 506
4.5.3 Water requirements
A summary of the water requirements in the upper Thukela Key Area is provided in Table 4.2.
Table 4.2: Water requirements in the Upper Thukela Key Area in 2005
User sector Water requirement at a 1:50 equivalentassurance(million m3/a)
Irrigation 87Urban 17Rural 9Industrial 0Afforestation 1Total local requirements 114Transfers Out 377Grand Total 491
Transfers out of the Upper Thukela to the Vaal system are quoted in the Thukela WMA Reportas 377 million m3/a. This figure reflects the impact of the yield on the Upper Thukela ratherthan the average transfer or the impact on the receiving system. On average it is possible totransfer 530 million m3/a, the limitation being on the availability of water in the Upper ThukelaKey Area. The maximum capacity of the transfer infrastructure (pumps, pipelines, etc) is 630million m3/a. This transfer has been reserved in the NWRS up to a maximum of 630 millionm3/a. In practice the year-to-year transfer volumes will vary depending on the water balance inthe Vaal River System which is, amongst other things, influenced by naturally occurring wet anddry periods. For example, if the storage in the Vaal system is low and Woodstock Dam is full, itwould be possible to transfer up to 630 million m3 in one year. The WRYM setup used to model
· Page 28

Thukela Water Management Area Internal Strategic Perspective
the upper Thukela River assumed the Vaal system always required water and therefore theimpact on yield is for some future situation when the Vaal system relies more heavily on theThukela transfer than at present. In future, if the Jana and/or Mielietuin dams are constructed,the transfer capacity will increase substantially.
Irrigation is by far the largest user sector accounting for 78% of the requirements of the KeyArea. Despite the relatively high rainfall, irrigation is still required to ensure crop security. Atthis stage no major new commercial irrigation expansions are envisaged in the Upper ThukelaKey Area. As noted in Section 2.3.2, there is conflicting information on the level of irrigationdevelopment in the whole WMA, and this is especially the case in this Key Area. This issue hasbeen taken up in Strategy 1.2 in Part B.
4.5.4 Water balance
A reconciliation of the requirements and available resource based on the information providedin Sections 4.5.2 and 4.5.3 is shown in Table 4.3. The water balance indicates that the UpperThukela Key Area has a surplus of between 15 and 30 million m3/a, depending on where thewater is sourced. This surplus is only available downstream of the Driel Barrage.
Table 4.3: Water balance in the Upper Thukela Key Area in 2005 (million m3/a)
At outlet of KeyArea
At Spioenkop Dam
Available water Local yield 521 506Transfers in 0 0Total 521 506
Water requirements Local requirements 114 114Transfers out 377 377Total 491 491
Balance 30 15
4.5.5 Reconciliation perspective
There will be an increasing dependency of the Vaal River System on the Thukela-Vaal TransferScheme, thereby necessitating the need to reserve the current transfer volumes (see Strategy3.1 in Part B). New allocations that are dependent on the same water resource as the transfer(ie Woodstock Dam and Driel Barrage) should therefore only be allocated to supply BasicHuman Needs. The NWRS reserves a maximum of 630 million m3/a for transfer to the VaalRiver System and makes provision for the development of new large water resourcesinfrastructure in the Thukela WMA.
Any new allocations (except for Basic Human Needs) which are considered upstream of theDriel Barrage must be implemented in such a way so as not to have a negative impact on theThukela-Vaal Transfer Scheme or existing lawful water use in the Key Area. This can only beachieved through the construction of farm dams coupled with stringently applied operating rulesto release part of the yield to the Driel Barrage. Such farm dams will require the approval of theMinister of Water Affairs and Forestry because the water in this area (upstream of DrielBarrage) is reserved for transfer to the Vaal. In general, new allocations and the construction offarm dams should be discouraged upstream of Driel Barrage. There is, however, between 15and 30 million m3/a available for allocation downstream of Driel Barrage, depending on where inthe Key Area it is abstracted. If abstracted entirely at the outlet of the Key Area (ie at theproposed Jana Dam site), there is 30 million m3/a available while if abstracted directly from theSpioenkop Dam (or upstream of the dam, but downstream of the Driel Barrage), there isapproximately 15 million m3/a available.
· Page 29

Thukela Water Management Area Internal Strategic Perspective
The Upper Thukela Key Area is well-suited to commercial irrigated agriculture. New allocationsfor irrigation can be considered provided these are downstream of Driel Barrage. Water forirrigation can be sourced from Spioenkop Dam, run-of-river, or new farm dams may beconstructed (downstream of Driel Barrage). Within these constraints, emerging farmers shouldreceive priority when allocating water in this Key Area. New farm dams upstream of SpioenkopDam will reduce the available surplus in Spioenkop Dam and the financial implications of thiswill need to be taken into consideration when issuing licenses for new dams in this region.
The towns or settlements in the Upper Thukela Key Area (and in the rest of the Thukela WMAfor that matter) do not have serious water availability problems. Where problems do exist theyare usually associated with poor infrastructure and water resource development. It is alsobelieved that groundwater is not being optimally utilised due to the perceived abundance ofsurface water resources. Better conjunctive use and planning for future water requirementsmust receive more attention. There is insignificant water being used by the communal sectorand water use allocations to this sector should focus on poverty eradication and inequityredress.
4.5.6 Water quality
The following water quality issues have been noted :· The effluent from the industrial area and untreated sewerage from the Ezakheni complex
outside of Ladysmith has resulted in very poor quality water flowing down the Klip River intothe Thukela River.
· Severe overgrazing and soil erosion problems are being experienced in the DriefonteinBlock and Matiwaneskop areas to the north-west and north of Ladysmith.
· Soils in the Drakensberg Mountain Range are relatively shallow and highly dispersive.Pressure from human activities is resulting in soil erosion with the consequent loss ofhabitat and siltation of dams in the upper catchment. This has long-term consequences forthe Thukela-Vaal Transfer Scheme. These lower Drakensberg areas and specifically theMweni Valley are the most effected. Intervention and mitigation measures are required todeal with this.
4.5.7 Summary, key issues and strategies
The Upper Thukela catchment is well endowed with water resources which are mostly derivedfrom the large Woodstock Dam and the Driel Barrage. These dams together with canalsystems and pump stations transfer much of the available resource out of the WMA to the VaalRiver System while the Spioenkop Dam provides for local requirements. Due to the fact thatlocal requirements are less than the available yield from Spioenkop Dam, there is surplus yieldavailable from this source of between 15 and 30 million m3/a.
While the Upper Thukela Key Area is geared primarily for transfers to the Vaal River System,the transfer scheme is currently being under-utilised. The planning for this sub-area, however,must be based on the maximum possible transfer, which is reserved in the NWRS up to 630million m3/a, which, expressed as impact on the yield of the Thukela system is 377 million m3/a.
Implementation of the ecological Reserve will reduce the amount that can be transferred to theVaal River System using the current infrastructure. However, the construction of the proposedJana Dam could add as much as 380 million m3/a to the transferable yield of this sub-area.
In summary, the key issues in the Upper Thukela Catchment are :· The resources of the Thukela River are predominantly used to support requirements for
water in other parts of the country, with large transfers of water to all three neighbouringWMAs. The need for increased and additional transfers in future have been identified andinvestigated in detail although no decision on this has as yet been made.
· Page 30
Thukela Water Management Area Internal Strategic Perspective
· Implementation of the Reserve will have an impact on the water reconciliation and theavailability of water for transfer out of the WMA. This impact is now well understood giventhe completion of the Thukela Reserve Determination Study (DWAF, 2004b).
· Potential for further development of surface water resources exists. However, it is importantthat the optimal long-term benefits be derived from the development of these resources,and that both the national and local interests be considered.
The key strategy identified in the NWRS relating to this sub-area is :· Additional water for Ladysmith may be obtained from the proposed Thukela Water Project,
or from Spioenkop Dam. Jana Dam, which will be the main structure of the Thukela WaterProject, is planned for construction on the Thukela River just below the confluence with theLittle Thukela River.
In addition to the above, this ISP suggests the following strategies :
• New water use licences may be issued in this Key Area. Upstream of Driel Barrage theseshould be limited to licences for domestic or high-value use but must be accompanied by thecreation of additional yield provided by storage, while downstream of the Barrage additionallicences for irrigation may be issued up to 30 million m3/a.
• Additional afforestation may be permitted downstream of the Driel Barrage.
• Groundwater should be considered as the first option for rural domestic use. Conjunctiveuse of ground and surface water should receive more attention.
• Catchment management plans are required to maintain and/or rehabilitate the land cover inthe foothills of the Drakensberg mountains.
4.6 LITTLE THUKELA KEY AREA
4.6.1 Introduction
Other than commercial agriculture, much of which requires irrigation, there is little developmentin the Little Thukela River Catchment. The upper areas of the catchment are located in a naturereserve with the implication that no development in this area is likely. Areas adjacent to thenature reserve have however developed rapidly into popular tourist resorts in recent years withthe concomitant pressures of human habitation.
4.6.2 Water availability
The MAR of the Little Thukela Key Area is 307 million m3/a. The gross available surface waterresource in the Little Thukela is estimated to be 15 million m3/a, as is summarised in Table 4.4.
The available water is derived mainly from run-of-river and numerous small farm dams. TheBell Park Dam, with a capacity of 7,5 million m3 is situated in the upper reaches of this key areaand has an estimated yield of 6,2 million m3/a (DWAF, 1999). However, this dam appears to beused mostly for recreational purposes and its potential yield is not fully utilised.
· Page 31

Thukela Water Management Area Internal Strategic Perspective
Table 4.4: Overview of the water availability in the Little Thukela Key Area
Resource category Water available at a 1:50 yearassurance (million m3/a)
Gross surface water resource 15Subtract : Ecological Reserve 7 Invasive alien plants 2 Dryland sugarcane 0Net surface water resource 6Groundwater resource 1Return flows 1Total local yield 8Transfer In 0
Grand Total 8
4.6.3 Water requirements
There are no transfers out of the Little Thukela catchment and irrigation is by far the dominantwater use. The irrigation water requirements listed in Table 4.5 may appear unlikely given thelimited water resource in the Key Area but this estimate was verified against the registeredwater use which is given as 44,1 million m3/a. In order to understand the water use better in thecatchment, the registered water use has been broken down into quaternary catchment andsource of supply (see Table 4.5).
Table 4.5: Registered water use and source of supply in the Little Thukela Key Area
Quaternary catchment Source of supplyDams Run-of-river
V13A 0 0V13B 2.2 8.0V13C 1.8 8.2V13D 7.8 3.8V13E 4.1 8.2Total 15.9 28.2
A summary of the present day water requirements in the Little Thukela catchment is provided inTable 4.6. The urban requirements are those of the town of Winterton.
Table 4.6: Water requirements in the Little Thukela Key Area in 2005
User sector Water requirement at a 1:50equivalent assurance (million m3/a)
Irrigation 36Urban 1Rural 1Industrial 0Afforestation 0Total local requirements 38Transfers Out 0
Grand Total 38
· Page 32

Thukela Water Management Area Internal Strategic Perspective
4.6.4 Water balance
A reconciliation of the water requirements and water resource is given in Table 4.7. The waterbalance, based on the WRYM analysis, indicates that the Little Thukela Key Area has a deficitof some 30 million m3/a.
Table 4.7: Water balance in the Little Thukela Key Area in 2005 (million m3/a).
Available water Local yield 8Transfers in 0Total 8
Water requirements Local requirements 38Transfers out 0Total 38
Balance -30
The above simplistic approach of reconciling water requirements with the available resourcedoes not portray the reality of the situation, and a more detailed analysis of this Key Area usingthe Rapid Simulation Model (Mallory, 2003) was carried out. The results of this analysis aregiven in Table 4.8 and this confirms that the assurances of supply are low, especially in thelower reaches of the Key Area. However, the assurance of supply is not so low as to make thecurrent irrigation practices uneconomical but they are unsustainable in terms of the ecologicalReserve.
Table 4.8: Assurance of supply to irrigators in the Little Thukela Key Area
Quaternary catchment Assurance of supplyFarm Dams Run-of-river
V13B 100% 64%V13C 100% 81%V13D 60% 69%V13E 67% 73%
4.6.5 Reconciliation perspective
The water supply to irrigators in the Little Thukela Key Area is low in most cases and questionshave been raised as to whether the large area of irrigation really exists in this Key Area.However, the registered water use seems to confirm the large irrigation requirement althoughthis will need to be verified. It is surmised that due to the relatively high rainfall in this Key Area(ranging from 700 mm/a to over 1 000 mm/a), the crops that are irrigated are still viable atrelatively low assurances of irrigation i.e. irrigation is only supplementary.
Irrigation seems to have expanded to the limit of what is financially viable and irrigators areusing all available water in this Key Area. This holds serious implications for the ecologicalReserve which will be difficult to implement without compulsory licencing. As an interimmeasure, no further water allocations from run-of-river should be considered in the LittleThukela catchment. Further licences for storage of water could be accepted to improve theassurance of water supply, subject to proper analysis of impact.
· Page 33
Thukela Water Management Area Internal Strategic Perspective
4.6.6 Water quality
The naturally good water quality in the Little Thukela Key Area is threatened by largeconcentrations of tourism activities (e.g. Champagne Valley), agro-chemicals and fertilisers asa diffuse source of pollution. These problems need to be better understood before they can beadequately addressed.
4.6.7 Summary, key issues and strategies
In summary, the key issues in the Little Thukela Catchment Key Area are:
· Irrigation in the Key Area has expanded to the point where it is utilising all the availablewater in the Key Area and irrigators experience frequent water shortages. Theimplementation of the ecological Reserve will therefore be problematic and it isrecommended that this be done in a phased manner. Compulsory licencing may berequired in order to fully implement the Reserve.
· There is no surplus water available for additional water-use licences.
· Significant diffuse source pollution occurs and the long-term impacts are not known.
The following key strategies have been formulated to address the above issues:
· No additional water-use licences to be issued for irrigation. The construction of farm damswill be permitted, however, should farmers wish to improve their security of supply. Newfarm dams will have to be shown to increase the system yield and contribute to theecological Reserve.
· Allocations for other water use cannot be considered unless significant storage is created.
· Additional afforestation should be prohibited (unless additional storage to compensate forthe loss of yield can be provided).
· The impacts of the diffuse pollution need to be investigated.
4.7 BUSHMANS RIVER KEY AREA
4.7.1 Introduction
The Bushmans River rises in the Drakensberg Mountain range and flows in a north-easterlydirection past the town of Estcourt to join the Thukela River near the town of Weenen. TheWagendrift Dam, with a full supply capacity of 56 million m3, was constructed in 1963 on theBushmans River to supply approximately 3000 ha of irrigation between the dam and theThukela River. This irrigation scheme is managed by the Weenen Water User Association. Upto 2 m3/s is released from the dam for environmental and irrigation requirements if the dam isnot spilling.
Estcourt obtains water for domestic and local industrial purposes directly from the WagendriftDam and discharges treated effluent back into the river downstream of the dam. There aresignificant tribal / communal areas between Estcourt and Weenen.
The site of the proposed Mielietuin Dam, which will be part of the Thukela Water Project ifconstructed, is located in the lower reaches of the Bushmans River, downstream of theWagendrift Dam.
· Page 34

Thukela Water Management Area Internal Strategic Perspective
4.7.2 Water availability
The MAR of the Bushmans River Key Area is 358 million m3/a.
The gross available water resource of the Bushmans River Key Area, based on currentdevelopment levels, is estimated to be 115 million m3/a, as is summarised in Table 4.9. Theavailable water resource is derived mainly from the Wagendrift Dam, which is currently under-utilised. After accounting for the ecological Reserve and allowing for return flows andgroundwater resources, there is an estimated 80 million m3/a which can be used consumptivelyin the Bushmans River Key Area or in the Lower Thukela Key Area.Table 4.9: Overview of the water availability in the Bushmans River Key Area
Resource category Water available at a 1:50 yearassurance (million m3/a)
Gross surface water resource 115Subtract : Ecological Reserve 36 Invasive alien plants 5 Dryland sugarcane 0Net surface water resource 74Groundwater resource 2Return flows 4Total local yield 80Transfer In 0
Grand Total 80
4.7.3 Water requirements
A summary of the water requirements in the Bushmans River Key Area is provided in Table4.10. Irrigation, situated mostly downstream of the Wagendrift Dam, is by far the dominantwater use. The only other significant use is the domestic and industrial use of the town ofEscourt. There are no transfers out of the Bushmans River Key Area.
Table 4.10: Water requirements in the Bushmans River Key Area in 2005
User sector Water requirements at a 1:50equivalent assurance
(million m3/a)Irrigation 31Urban 4Rural 3Industrial 1Afforestation 1Total local requirements 40Transfers Out 0Grand Total 40
4.7.4 Water balance
A reconciliation of the water requirements and available resource is given in Table 4.11 andindicates that there is currently a large surplus in the Bushmans River Key Area.
· Page 35

Thukela Water Management Area Internal Strategic Perspective
Table 4.11: Water balance in the Bushmans River Key Area in 2005 (million m3/a)
Available water Local yield 80Transfers in 0Total 80
Water requirements Local requirements 40Transfers out 0Total 40
Balance 40
4.7.5 Reconciliation perspective
Under current operating conditions there is a surplus of about 40 million m3/a available in theWagendrift Dam. The surplrus could be allocated to emerging farmers, but this decision willneed to be carefully analysed in the light of the new allocations to the Fairbreeze mine and theecological Reserve of the lower Thukela, which will require support from either the Wagendriftor the Spioenkop Dam, or both. Construction of farm dams in the upper reaches of thecatchment could also be allowed although operating rules for these dams will need to beestablished in order that they do not reduce the yield of the Wagendrift Dam.
4.7.6 Water quality
In the Bushmans River below Estcourt, water quality problems are experienced due to theleaching of fertilisers and agro-chemicals from the soil and the discharge of industrial wastefrom the various factories in the town. This pollution impacts on the Weenen Nature Reserveand irrigators in the Weenen area.
4.7.7 Summary, key issues and strategies
In summary, the key issues in the Bushmans River Key Area are :
· There is currently surplus water available in this Key Area but the allocation of this needs tobe carefully considered in the light of the requirements of the Lower Thukela Key Area (theReserve and the new allocation to the Fairbreeze mine and irrigators).
· Potential for further development of surface water resources exists (i.e. Mielietuin Dam),however, it is important that both national and local interests be considered, since theMielietuin Dam has been identified as a possible source for further water transfer to theVaal River System.
· Significant diffuse source pollution occurs and the long-term impacts are not known.
To address the above identified issues, the following strategies are proposed:
· Future water use applications for irrigation can still be considered but must be accompaniedwith the creation of storage.
· Any growth in water requirement for Escourt will be supplied from the Wagendrift Dam. Infuture, water may also be obtained from the proposed Mielietuin Dam.
· Additional afforestation is possible in this Key Area from a water resources point of view.
· Groundwater should be considered as the first option for rural domestic use. Conjunctiveuse of ground and surface water in the more formal areas should receive more attention.
· Page 36
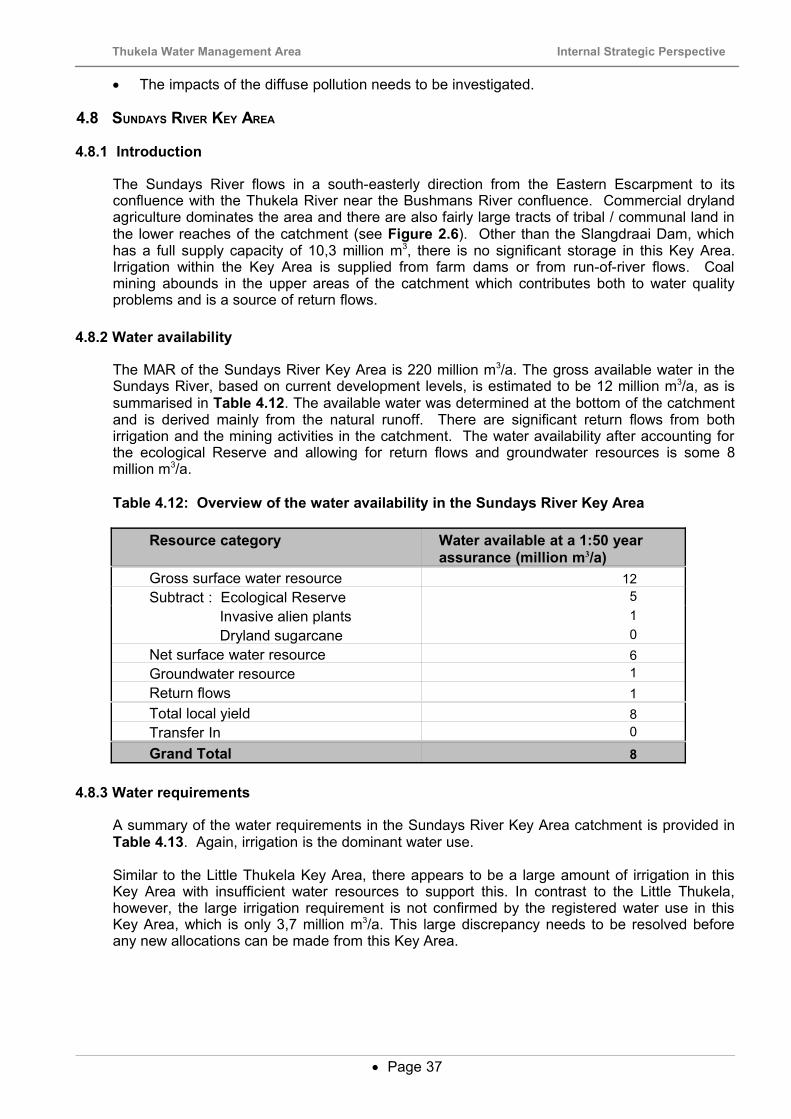
Thukela Water Management Area Internal Strategic Perspective
· The impacts of the diffuse pollution needs to be investigated.
4.8 SUNDAYS RIVER KEY AREA
4.8.1 Introduction
The Sundays River flows in a south-easterly direction from the Eastern Escarpment to itsconfluence with the Thukela River near the Bushmans River confluence. Commercial drylandagriculture dominates the area and there are also fairly large tracts of tribal / communal land inthe lower reaches of the catchment (see Figure 2.6). Other than the Slangdraai Dam, whichhas a full supply capacity of 10,3 million m3, there is no significant storage in this Key Area.Irrigation within the Key Area is supplied from farm dams or from run-of-river flows. Coalmining abounds in the upper areas of the catchment which contributes both to water qualityproblems and is a source of return flows.
4.8.2 Water availability
The MAR of the Sundays River Key Area is 220 million m3/a. The gross available water in theSundays River, based on current development levels, is estimated to be 12 million m3/a, as issummarised in Table 4.12. The available water was determined at the bottom of the catchmentand is derived mainly from the natural runoff. There are significant return flows from bothirrigation and the mining activities in the catchment. The water availability after accounting forthe ecological Reserve and allowing for return flows and groundwater resources is some 8million m3/a.
Table 4.12: Overview of the water availability in the Sundays River Key Area
Resource category Water available at a 1:50 yearassurance (million m3/a)
Gross surface water resource 12Subtract : Ecological Reserve 5 Invasive alien plants 1 Dryland sugarcane 0Net surface water resource 6Groundwater resource 1Return flows 1Total local yield 8Transfer In 0
Grand Total 8
4.8.3 Water requirements
A summary of the water requirements in the Sundays River Key Area catchment is provided inTable 4.13. Again, irrigation is the dominant water use.
Similar to the Little Thukela Key Area, there appears to be a large amount of irrigation in thisKey Area with insufficient water resources to support this. In contrast to the Little Thukela,however, the large irrigation requirement is not confirmed by the registered water use in thisKey Area, which is only 3,7 million m3/a. This large discrepancy needs to be resolved beforeany new allocations can be made from this Key Area.
· Page 37
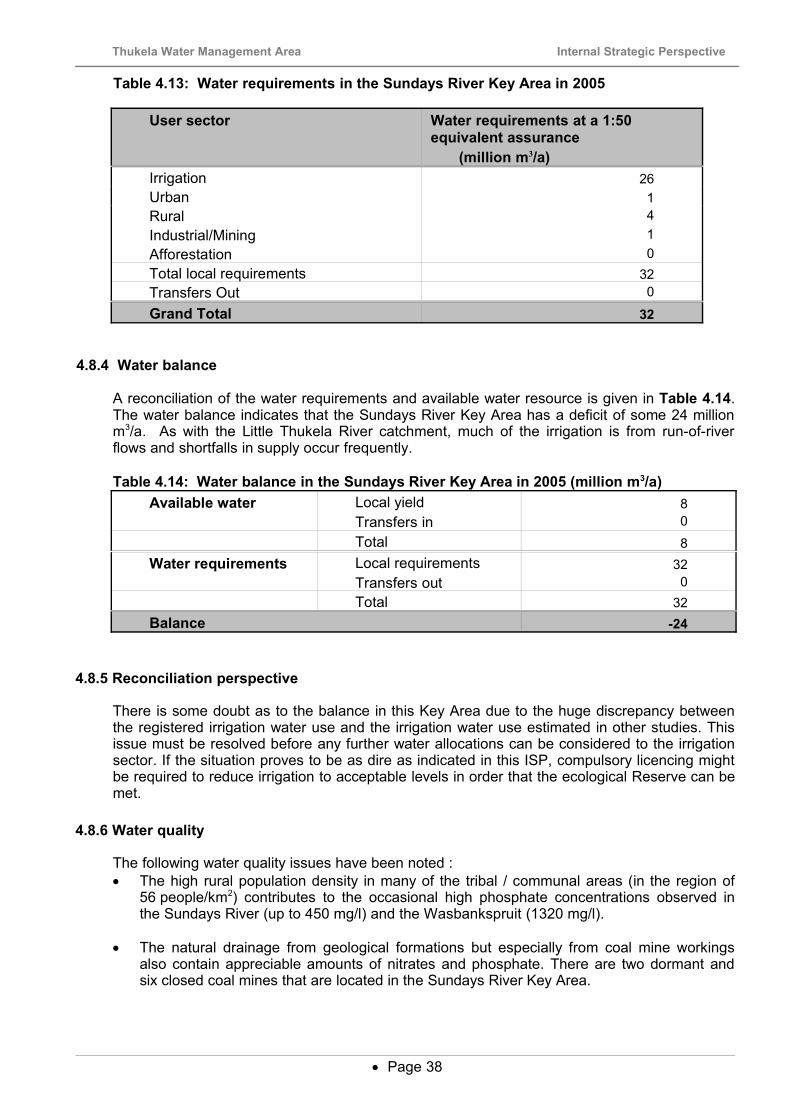
Thukela Water Management Area Internal Strategic Perspective
Table 4.13: Water requirements in the Sundays River Key Area in 2005
User sector Water requirements at a 1:50equivalent assurance
(million m3/a)Irrigation 26Urban 1Rural 4Industrial/Mining 1Afforestation 0Total local requirements 32Transfers Out 0
Grand Total 32
4.8.4 Water balance
A reconciliation of the water requirements and available water resource is given in Table 4.14.The water balance indicates that the Sundays River Key Area has a deficit of some 24 millionm3/a. As with the Little Thukela River catchment, much of the irrigation is from run-of-riverflows and shortfalls in supply occur frequently.
Table 4.14: Water balance in the Sundays River Key Area in 2005 (million m3/a)Available water Local yield 8
Transfers in 0Total 8
Water requirements Local requirements 32Transfers out 0Total 32
Balance -24
4.8.5 Reconciliation perspective
There is some doubt as to the balance in this Key Area due to the huge discrepancy betweenthe registered irrigation water use and the irrigation water use estimated in other studies. Thisissue must be resolved before any further water allocations can be considered to the irrigationsector. If the situation proves to be as dire as indicated in this ISP, compulsory licencing mightbe required to reduce irrigation to acceptable levels in order that the ecological Reserve can bemet.
4.8.6 Water quality
The following water quality issues have been noted :· The high rural population density in many of the tribal / communal areas (in the region of
56 people/km2) contributes to the occasional high phosphate concentrations observed inthe Sundays River (up to 450 mg/l) and the Wasbankspruit (1320 mg/l).
· The natural drainage from geological formations but especially from coal mine workingsalso contain appreciable amounts of nitrates and phosphate. There are two dormant andsix closed coal mines that are located in the Sundays River Key Area.
· Page 38

Thukela Water Management Area Internal Strategic Perspective
· There is evidence of salt deposition in the Upper Sundays River at gauging point V6H004with sulphate concentrations reaching 214 mg/l (compared with 18 mg/l further upstream atV6H006).
4.8.7 Summary, key issues and strategies
In summary, the key issues in the Sundays River Key Area are :
· Irrigation appears to have over-developed in this catchment and there is no surplus wateravailable for other development. However, there is uncertainty relating to the actual amountof irrigation in the Key Area and this must be investigated as a matter of priority.
· Significant pollution occurs as a result of the mining activities and the relatively dense ruralsettlements.
In light of the above, the ISP suggests the following strategies :
· DWAF should take a precautionary approach and not make any new allocations to theirrigation sector from this Key Area until it can be clearly shown that the registered irrigationwater use accurately reflects the actual lawful use in the area. Water for poverty eradicationis available elsewhere in the WMA and this catchment should not be targeted for suchinitiatives, at least until such time as the irrigation water use has been accuratelydetermined.
· The construction of farm dams should be allowed, subject to strict operating rules, ifirrigation farmers wish to improve their assurance of supply.
· Allocations for water uses other than irrigation cannot be considered unless sufficientstorage is created to supply these additional allocations.
· Additional afforestation should be prohibited unless additional storage to compensate forthe loss of yield can be provided.
· Groundwater should be considered as the first option for rural domestic use. Conjunctiveuse of ground and surface water should receive more attention.
· A management plan is required to address the mine pollution problems, particularly with theclosure and rehabilitation of the mines.
· A sanitation and solid waste management plan is required to address the human pollutionproblems.
· The Reserve cannot be implemented in this Key Area under the current stressedconditions. Verification of water use and, probably, compulsory licencing will be required asa prerequisite for the implementation of the Reserve.
4.9 BUFFALO RIVER KEY AREA
4.9.1 Introduction
The Buffalo River is the main northern tributary of the Thukela River and flows in a south-easterly direction from the Eastern Escarpment (Newcastle area) to its confluence with theThukela River near Nkandla. The area includes the towns of Dundee, Newcastle, Danhauser,Utrecht and Madadeni. The main storage dams in the Buffalo catchment are:
· Ntshingwayo Dam (previously known as Chelmsford Dam) which was completed in 1961and raised in 1982. It has a capacity of 199 million m3. The dam was built to supply water
· Page 39

Thukela Water Management Area Internal Strategic Perspective
to the town of Newcastle, Eskom’s thermal power station and irrigation farmersdownstream. Releases are sometimes made to dilute factory spillages that end up in theriver system.
· Zaaihoek Dam, which was built in 1988 with an original capacity of 193 million m3. ZaaihoekDam is on the Slang River, a tributary of the Buffalo River, and is used to transfer water tothe Vaal system and the Majuba Power Station. Zaaihoek Dam can also supplies demandsdownstream of the dam by releasing water into the Slang River.
4.9.2 Water availability
The MAR of the Buffalo Key Area is 884 million m3/a. The gross available surface water in theBuffalo River based on current development levels is estimated at between 173 million m3/a and205 million m3/a depending on where in the catchment the water is utilised (see Table 4.15).Most of this yield is derived from the Zaaihoek and Ntshingwayo dams with the balance derivedfrom farm dams and run-of-river. It was assumed in this analysis that surplus yield in theZaaihoek Dam is not available to support requirements in the Thukela WMA.
There are significant return flows from irrigation, the urban and commercial centres as well asthe mining and industrial activities in the catchment. In fact, the volume of return flows aresimilar in magnitude to that of the requirements of the ecological Reserve. There are notransfers into the sub-area.
The Thukela WMA Report (DWAF, 2003a) indicates that afforestation and invasive alien plantsreduce the natural runoff by approximately 11 million m3/a, while having no impact on theavailable yield. This seems to be an erroneous conclusion which needs to be reviewed. For thepurpose of this study an impact of invasive alien plants of 4 million m3/a has been accepted.
Table 4.15: Overview of the water availability in the Buffalo River Key Area
Resource category Water available at a 1:50 year assurance (million m3/a)
At outlet of Key Area At Ntshingwayo DamGross surface water resource 205 173Subtract : Ecological Reserve 33 33 Invasive alien plants 4 4 Dryland sugarcane 0 0Net surface water resource 168 136Groundwater resource 6 6Return flows 32 32Total local yield 206 174Transfer In 0 0Grand Total 206 174
4.9.3 Water requirements
A summary of the water requirements in the Buffalo River Key Area is provided in Table 4.16.Again, irrigation is the dominant water use. The irrigation estimate used in this ISP (derivedfrom the Thukela Reserve Determination Study) has been verified against the registered wateruse in the Buffalo Key Area. The urban, rural and mining/industrial requirements are alsosignificant and this is due to the development in and around Newcastle. The WRSA report(DWAF, 2002b) from which the WMA Report sourced its data, indicates the impact of forestryon the water resource to be only 1 million m3/a.
· Page 40

Thukela Water Management Area Internal Strategic Perspective
Transfers out refer to the transfers from Zaaihoek Dam to the Majuba Power Station and theVaal system.
Table 4.16: Water requirements in the Buffalo River Key Area in 2005
User sector Water requirement at a 1:50 equivalentassurance (million m3/a)
Irrigation 50Urban 24Rural 9Industrial 12Afforestation 1Total local requirements 96Transfers Out 55
Grand Total 151
4.9.4 Water balance
A reconciliation of the water requirements and available water resource is given in Table 4.17.
The water balance indicates that the Buffalo River Key Area has a surplus of between 23 and55 million m3/a, depending on where in the catchment it is utilised. It is noted that shortfalls inthe supply of irrigation water have been reported occasionally, but this is probably due to over-exploitation of local resources and the lack of storage. Irrigators along the Buffalo River maywell experience water shortages because they do not have an allocation from the NtshingwayoDam and during drought periods there is insufficient run-of-river to support these irrigators.
Table 4.17: Water balance in the Buffalo Key Area in 2005 (million m3/a)
At outlet ofKey Area
At NtshingwayoDam
Available water Local yield 206 174Transfers in 0 0Total 206 174
Water requirements Local requirements 96 96Transfers out 55 55Total 151 151
Balance 55 23
4.9.5 Reconciliation perspective
There is surplus water available in the Buffalo River Key Area that can be allocated. Prioritymust be given to redressing of inequities and poverty eradication. Allocations must however bedealt with cautiously and the location of the surplus identified before making allocations. Newallocations should not be made upstream of the Zaaihoek or Ntshingwayo dams unlessaccompanied by the provision of additional yield through the construction of farm dams. Thereis potential for further growth and development in the Newcastle area and allowance shouldtherefore be made to provide for these additional urban and industrial requirements from thecurrently available surplus before making new allocations in this Key Area to the irrigationsector.
· Page 41

Thukela Water Management Area Internal Strategic Perspective
4.9.6 Water quality
The upper Buffalo River is the most severely impacted on (from a water quality perspective) ofall the Thukela River’s tributaries. Acid mine drainage from numerous old coal mines andindustrial pollution from the Newcastle area and the Ngagane River area, requires specialintervention. Initiatives by the Regional Office have been underway for a number of years toboth understand the extent of the problem and to start rehabilitating this environment. Waterquality in the Buffalo River all the way down to its confluence with the Thukela has beendescribed by the Regional Office as being very poor.
4.9.7 Summary, key issues and strategies
In summary, the key issues in the Buffalo River Key Area are :
· The Buffalo River Key Area has substantial available water, some of which is derived fromthe Ntshingwayo Dam. The water requirements are dominated by irrigation, but there arealso large urban and industrial requirements.
· There are substantial transfers out of the Buffalo River to the Vaal system, for which 55million m3/a has been reserved in the NWRS.
· A key issue in this area is the water quality, which is very poor in places. Localised waterquality problems occur associated with coal mining and pollution resulting from the closureof mines and this is of particular concern.
The strategic perspectives put forward in the NWRS are :
· The small surplus at Ntshingwayo Dam may be used for additional supplies to Newcastleas an interim measure. The implementation of the Reserve together with growth atNewcastle, are likely to result in additional storage being required in the future.
· No additional afforestation in and transfers from the sub-area should be allowed atlocations which may have a limiting impact on the options for additional water supply toNewcastle.
In addition to the above, this ISP suggests the following broad strategies :
· Future water use applications for irrigation above Ntshingwayo and Zaaihoek dams that arenot accompanied by the provision of additional yield through the construction of new damsshould not be approved. There is potential for additional irrigation water downstream of theNtshingwayo Dam, supported by releases from this dam.
· A management plan is required to address the mine pollution problems, particularly with theclosure and rehabilitation of the mines.
· Water is available in the Ntshingwayo Dam to meet the future requirements of theNewcastle and Dundee areas from the surplus still existing in the system and some of thesurplus yield of the Ntshingwayo Dam should be reserved for this purpose. The remaindercan be allocated to emerging farmers but the allocable amount will need to be carefullydetermined depending on where in the catchment it is required.
· Given the surplus in this area, it is possible to redress the inequity of water allocationsthrough the development of emerging farmer irrigation schemes and other povertyeradication initiatives. This irrigation should be sourced from the main stem of the BuffaloRiver downstream of the Newcastle area and supported by releases from the NtshingwayoDam when required. The appropriate authorities need to be made aware of this opportunityto address poverty eradication.
· Page 42
Thukela Water Management Area Internal Strategic Perspective
· Additional afforestation is a possibility in this Key Area, but not upstream of Ntshingwayo orZaaihoek Dams.
· Groundwater should be considered as the first option for rural domestic use. Conjunctiveuse of ground and surface water should receive more attention.
· There is potential to develop the water resource through the construction of new dams inthe Key Area.
4.10 MOOI RIVER KEY AREA
4.10.1 Introduction
The Mooi River rises in the Drakensberg Mountains and flows parallel to the Bushmans River ina north-easterly direction to join the Thukela River near Muden. The only town of anysignificance in the catchment is Mooi River. The predominant land use in the catchment iscommercial agriculture and there is large-scale irrigation of pastures and summer cash crops.Craigieburn Dam was constructed on the Mnyamvubu River in 1963 and has a capacity of 23.5million m3. The dam supplements water supplies to approximately 2000 ha of predominantlycitrus farming irrigation downstream of the dam and along the Mooi River at Muden.
A water transfer scheme also exists on the Mooi River at Mearns, which can transfer up to 3.2m3/s to the Mgeni River System. The Mooi River has long been recognised as the mostfeasible resource from which to augment the Mgeni System. The first phase of the two-phaseMooi-Mgeni Transfer Scheme has already been implemented, this being :
· A large weir at Mearns with a capacity of 4,9 million m3; and
· A pumped transfer from the weir to the upper reaches of the Mgeni catchment.
The proposed second phase of the scheme, possibly to be implemented soon, will entail :
· Construction of a large dam at Spring Grove; and
· Upgrading the transfer capacity from the Mooi to the Mgeni River.
4.10.2 Water availability
The MAR of the Mooi River Key Area is 385 million m3/a.
The gross available surface water in the Mooi River Key Area, based on current developmentlevels, is estimated at 73 million m3/a, as is summarised in Table 4.18. There are significantreturn flows from irrigation, but the total local yield after allowing for the ecological Reserve isestimated to be in the order of 64 million m3/a. There are no transfers into the catchment.
· Page 43
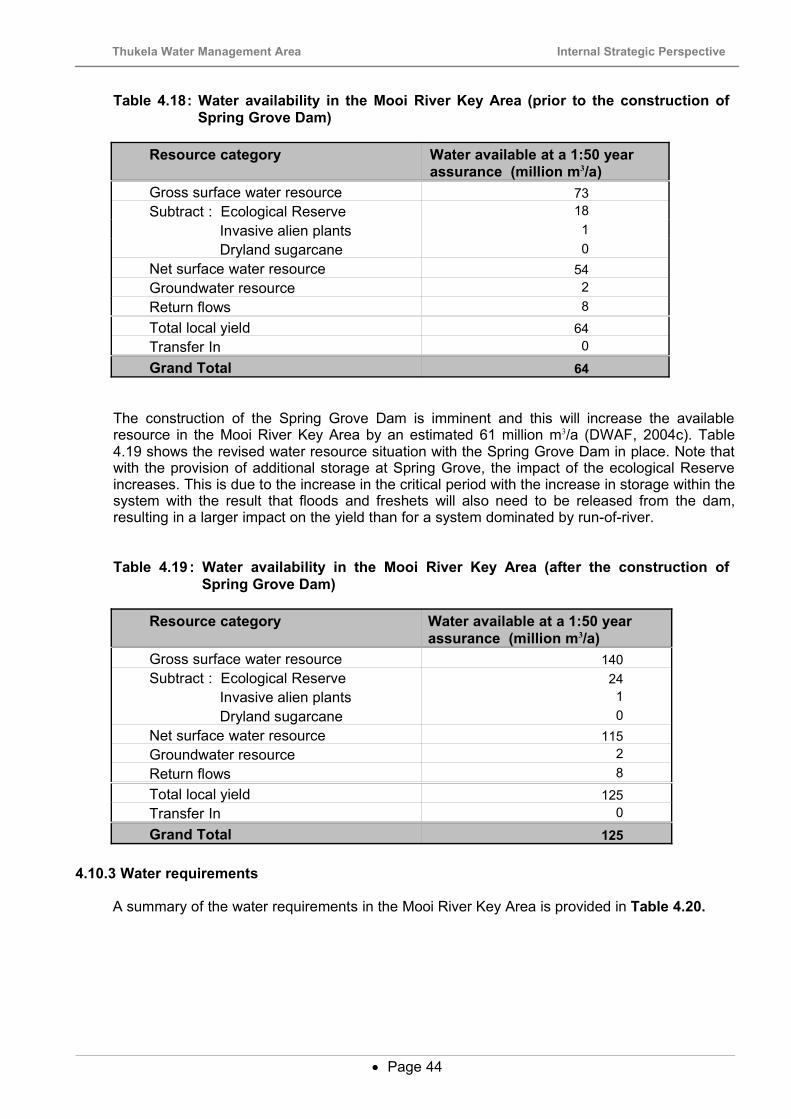
Thukela Water Management Area Internal Strategic Perspective
Table 4.18: Water availability in the Mooi River Key Area (prior to the construction of Spring Grove Dam)
Resource category Water available at a 1:50 yearassurance (million m3/a)
Gross surface water resource 73Subtract : Ecological Reserve 18 Invasive alien plants 1 Dryland sugarcane 0Net surface water resource 54Groundwater resource 2Return flows 8Total local yield 64Transfer In 0
Grand Total 64
The construction of the Spring Grove Dam is imminent and this will increase the availableresource in the Mooi River Key Area by an estimated 61 million m3/a (DWAF, 2004c). Table4.19 shows the revised water resource situation with the Spring Grove Dam in place. Note thatwith the provision of additional storage at Spring Grove, the impact of the ecological Reserveincreases. This is due to the increase in the critical period with the increase in storage within thesystem with the result that floods and freshets will also need to be released from the dam,resulting in a larger impact on the yield than for a system dominated by run-of-river.
Table 4.19 : Water availability in the Mooi River Key Area (after the construction of Spring Grove Dam)
Resource category Water available at a 1:50 yearassurance (million m3/a)
Gross surface water resource 140Subtract : Ecological Reserve 24 Invasive alien plants 1 Dryland sugarcane 0Net surface water resource 115Groundwater resource 2Return flows 8Total local yield 125Transfer In 0
Grand Total 125
4.10.3 Water requirements
A summary of the water requirements in the Mooi River Key Area is provided in Table 4.20.
· Page 44

Thukela Water Management Area Internal Strategic Perspective
Table 4.20: Water requirements in the Mooi River Key Area in 2005
User sector Water requirement at a 1:50equivalent assurance (million m3/a)
Irrigation 49Urban 1Rural 1Industrial 0Afforestation 1Total local requirements 52Transfers Out 22Grand Total 74
The Spring Grove Dam will be constructed to augment the water resource of the Mgeni System,and, once completed, the available yield of the Spring Grove Dam will be transferred to theMgeni System when required. Table 4.21 shows the future situation with the additional transfermade possible by the Spring Grove Dam.
Table 4.21: Water requirements in the Mooi River Key Area after completion of the Spring Grove Dam
User sector Water requirement at a 1:50equivalent assurance (million m3/a)
Irrigation 49Urban 1Rural 1Industrial 0Afforestation 1Total local requirements 52Transfers Out 83Grand Total 135
4.10.4 Water Balance
A reconciliation of the water requirements and available resource for the year 2005 is given inTable 4.22 while Table 4.23 gives the reconciliation after the completion of the Spring GroveDam. The water balance indicates that the Mooi River Key Area has a significant deficit,estimated to be some 10 million m3/a. However, it must be borne in mind that this deficit relatesto the whole Key Area once the ecological Reserve has been implemented. A more detailedanalysis of the Mooi River Key Area carried out as part of the ISP using the Rapid SimulationModel (Mallory, 2003), indicates that users in the upper reaches of the Key Area currently enjoyhigh assurances of supply from the numerous farm dams while the successful implementationof the Reserve will require curtailment of this irrigation.
· Page 45

Thukela Water Management Area Internal Strategic Perspective
Table 4.22: Water balance in the Mooi River Key Area in 2005 (million m3/a)
Available water Local yield 64Transfers in 0Total 64
Water requirements Local requirements 52Transfers out 22Total 74
Balance (10)
Table 4.23: Water balance in the Mooi River Key Area after completion of the Spring Grove Dam (million m3/a)
Available water Local yield 125Transfers in 0Total 125
Water requirements Local requirements 52Transfers out 83Total 135
Balance (10)
There are also surplus summer flows in the Mooi Key Area which could be allocated providedsufficient controls can be put in place to ensure that abstractions only take place once theecological requirements have been met.
4.10.5 Reconciliation perspective
Under current operating conditions the water resources of the Mooi River are approximately inbalance, the deficit indicated in Table 4.22 arising largely as a result of provision for theReserve.
The construction of the Spring Grove Dam should not alter the balance in the Mooi River KeyArea because the additional yield made available by the Spring Grove Dam is allocated to theMgeni System.
4.10.6 Water quality
Agro-chemicals from intensive farming activities threaten the quality of the water resource in theMooi River.
4.10.7 Summary, key issues and strategies
The only key issue identified in the Thukela WMA Report (DWAF, 2002b) is that a quantity of136 million m3/a should be reserved for transfer to the Mgeni System. Although additionalinfrastructure would be required to make this water available (i.e. the construction of SpringGrove Dam), this value is definitely on the high side. The latest analyses of the Mooi-Mgenitransfer indicates that the amount to be reserved, expressed in terms of 1:50 year yield, isabout 80 million m3/a.
Other strategies derived from this ISP are:
· Page 46
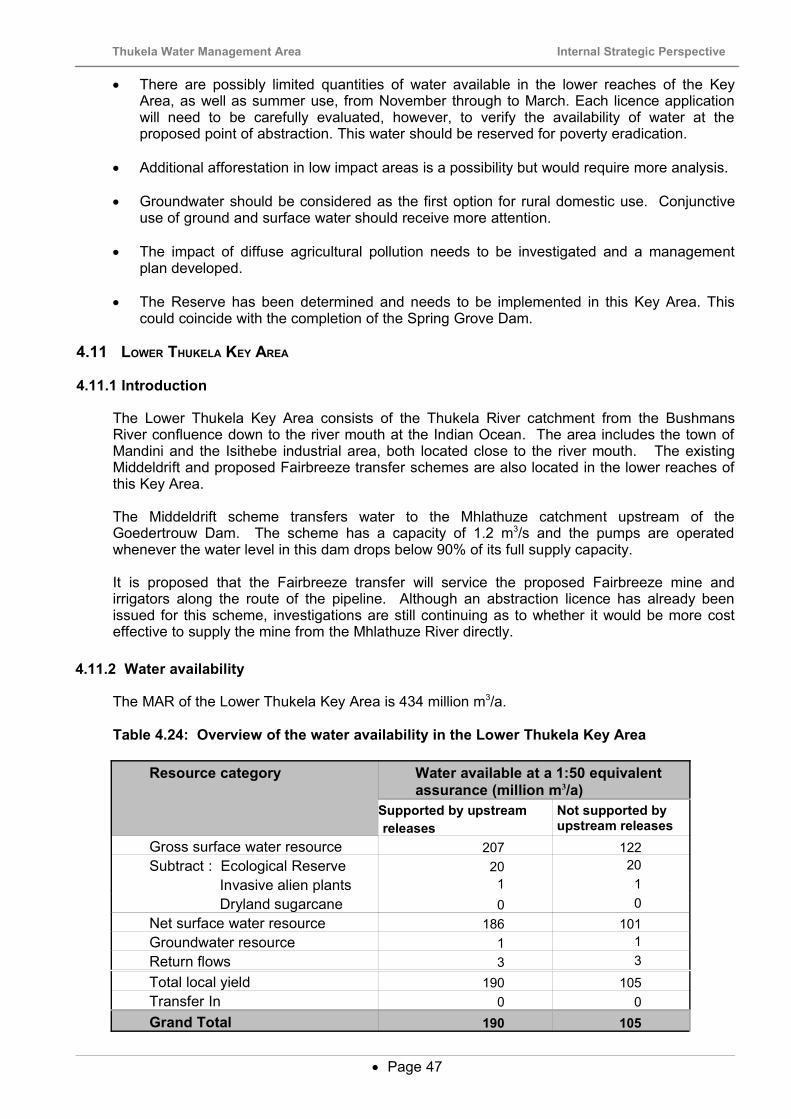
Thukela Water Management Area Internal Strategic Perspective
· There are possibly limited quantities of water available in the lower reaches of the KeyArea, as well as summer use, from November through to March. Each licence applicationwill need to be carefully evaluated, however, to verify the availability of water at theproposed point of abstraction. This water should be reserved for poverty eradication.
· Additional afforestation in low impact areas is a possibility but would require more analysis.
· Groundwater should be considered as the first option for rural domestic use. Conjunctiveuse of ground and surface water should receive more attention.
· The impact of diffuse agricultural pollution needs to be investigated and a managementplan developed.
· The Reserve has been determined and needs to be implemented in this Key Area. Thiscould coincide with the completion of the Spring Grove Dam.
4.11 LOWER THUKELA KEY AREA
4.11.1 Introduction
The Lower Thukela Key Area consists of the Thukela River catchment from the BushmansRiver confluence down to the river mouth at the Indian Ocean. The area includes the town ofMandini and the Isithebe industrial area, both located close to the river mouth. The existingMiddeldrift and proposed Fairbreeze transfer schemes are also located in the lower reaches ofthis Key Area.
The Middeldrift scheme transfers water to the Mhlathuze catchment upstream of theGoedertrouw Dam. The scheme has a capacity of 1.2 m3/s and the pumps are operatedwhenever the water level in this dam drops below 90% of its full supply capacity.
It is proposed that the Fairbreeze transfer will service the proposed Fairbreeze mine andirrigators along the route of the pipeline. Although an abstraction licence has already beenissued for this scheme, investigations are still continuing as to whether it would be more costeffective to supply the mine from the Mhlathuze River directly.
4.11.2 Water availability
The MAR of the Lower Thukela Key Area is 434 million m3/a.
Table 4.24: Overview of the water availability in the Lower Thukela Key Area
Resource category Water available at a 1:50 equivalentassurance (million m3/a)
Supported by upstreamreleases
Not supported byupstream releases
Gross surface water resource 207 122Subtract : Ecological Reserve 20 20 Invasive alien plants 1 1 Dryland sugarcane 0 0Net surface water resource 186 101Groundwater resource 1 1Return flows 3 3Total local yield 190 105Transfer In 0 0Grand Total 190 105
· Page 47

Thukela Water Management Area Internal Strategic Perspective
The gross available surface water resource in the Lower Thukela Key Area based on currentdevelopment levels is estimated to be 122 million m3/a, as is summarised in Table 4.24.Although there are significant return flows from the Sappi mill in Mandini, this occurs in the rivermouth and has not been taken into account in the water balance. From time to time the qualityof the Sappi effluent has been so poor that releases from the Spioenkop Dam have beennecessary as a management intervention. This has not been factored into the water resourcesevaluation carried out for this ISP due to a lack of information on the requirements. This mayrequire more detailed investigation at some point in the future.
4.11.3 Water requirements
A summary of the water requirements in the Lower Thukela Key Area is provided in Table 4.25.The largest use of water from the Lower Thukela Key Area is the transfer to the MhlathuzeCatchment. The impact of this transfer on the available resource of the Lower Thukela KeyArea is estimated at 38 million m3/a. There is also a small transfer out of this Key Area of about2 million m3/a to meet industrial demands in the Amatikulu River catchment, which forms part ofthe Usutu to Mhlathuze WMA. The industrial requirements of the Sappi mill at Mandini are alsosignificant with this being the largest single industrial water use in the Thukela WMA. Nosignificant growth is anticipated in the area.
The water requirements of the Fairbreeze mine are included in Table 4.25 even though thismine is not yet operational. The reason for this is that water has already been allocated with 32million m3/a allocated for the mine and a further 15 million m3/a (at a lower assurance) allocatedfor proposed new irrigation along the pipeline route. This new irrigation requirement is includedin Table 4.25 under 'Transfers Out'.
Table 4.25: Water requirements in the Lower Thukela Key Area in 2005
User sector Water requirement at a 1:50equivalent assurance(million m3/ a)
Irrigation 22Urban 2Rural 10Industrial 24Afforestation 0Total local requirements 58Transfers Out 87
Grand Total 145
4.11.4 Water Balance
A reconciliation of the water requirements and resource availability is given in Table 4.26. Thewater balance indicates that the Lower Thukela Key Area is experiencing a deficit, but it mustbe borne in mind that this allows for the Ecological Reserve and new allocations to theFairbreeze transfer which has not yet been taken up.
· Page 48
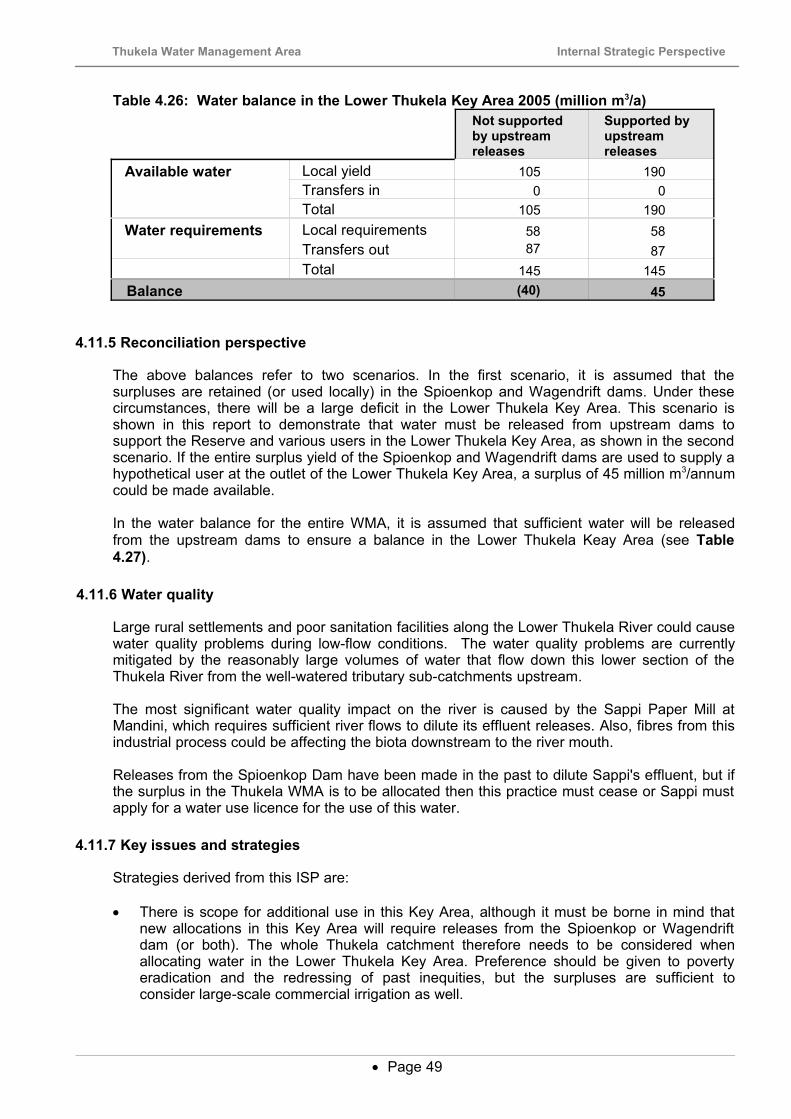
Thukela Water Management Area Internal Strategic Perspective
Table 4.26: Water balance in the Lower Thukela Key Area 2005 (million m3/a)Not supportedby upstreamreleases
Supported byupstreamreleases
Available water Local yield 105 190Transfers in 0 0Total 105 190
Water requirements Local requirements 58 58Transfers out 87 87Total 145 145
Balance (40) 45
4.11.5 Reconciliation perspective
The above balances refer to two scenarios. In the first scenario, it is assumed that thesurpluses are retained (or used locally) in the Spioenkop and Wagendrift dams. Under thesecircumstances, there will be a large deficit in the Lower Thukela Key Area. This scenario isshown in this report to demonstrate that water must be released from upstream dams tosupport the Reserve and various users in the Lower Thukela Key Area, as shown in the secondscenario. If the entire surplus yield of the Spioenkop and Wagendrift dams are used to supply ahypothetical user at the outlet of the Lower Thukela Key Area, a surplus of 45 million m3/annumcould be made available.
In the water balance for the entire WMA, it is assumed that sufficient water will be releasedfrom the upstream dams to ensure a balance in the Lower Thukela Keay Area (see Table4.27).
4.11.6 Water quality
Large rural settlements and poor sanitation facilities along the Lower Thukela River could causewater quality problems during low-flow conditions. The water quality problems are currentlymitigated by the reasonably large volumes of water that flow down this lower section of theThukela River from the well-watered tributary sub-catchments upstream.
The most significant water quality impact on the river is caused by the Sappi Paper Mill atMandini, which requires sufficient river flows to dilute its effluent releases. Also, fibres from thisindustrial process could be affecting the biota downstream to the river mouth.
Releases from the Spioenkop Dam have been made in the past to dilute Sappi's effluent, but ifthe surplus in the Thukela WMA is to be allocated then this practice must cease or Sappi mustapply for a water use licence for the use of this water.
4.11.7 Key issues and strategies
Strategies derived from this ISP are:
· There is scope for additional use in this Key Area, although it must be borne in mind thatnew allocations in this Key Area will require releases from the Spioenkop or Wagendriftdam (or both). The whole Thukela catchment therefore needs to be considered whenallocating water in the Lower Thukela Key Area. Preference should be given to povertyeradication and the redressing of past inequities, but the surpluses are sufficient toconsider large-scale commercial irrigation as well.
· Page 49
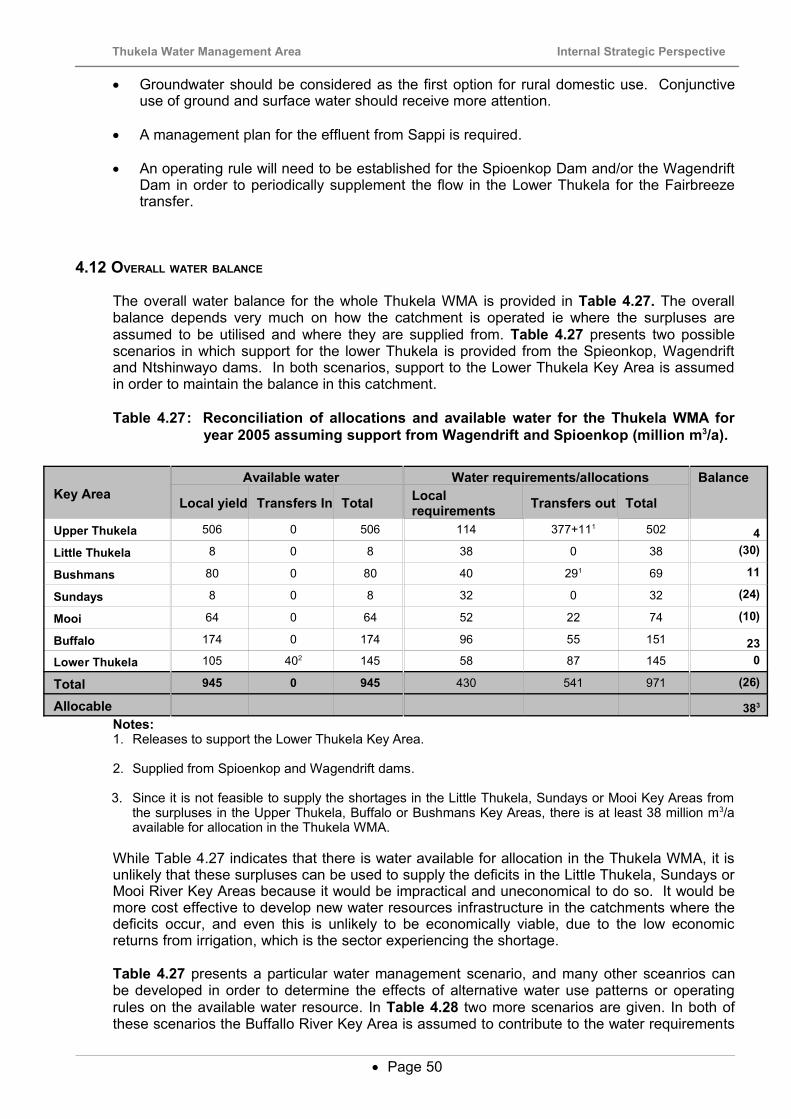
Thukela Water Management Area Internal Strategic Perspective
· Groundwater should be considered as the first option for rural domestic use. Conjunctiveuse of ground and surface water should receive more attention.
· A management plan for the effluent from Sappi is required.
· An operating rule will need to be established for the Spioenkop Dam and/or the WagendriftDam in order to periodically supplement the flow in the Lower Thukela for the Fairbreezetransfer.
4.12 OVERALL WATER BALANCE
The overall water balance for the whole Thukela WMA is provided in Table 4.27. The overallbalance depends very much on how the catchment is operated ie where the surpluses areassumed to be utilised and where they are supplied from. Table 4.27 presents two possiblescenarios in which support for the lower Thukela is provided from the Spieonkop, Wagendriftand Ntshinwayo dams. In both scenarios, support to the Lower Thukela Key Area is assumedin order to maintain the balance in this catchment.
Table 4.27: Reconciliation of allocations and available water for the Thukela WMA for year 2005 assuming support from Wagendrift and Spioenkop (million m3/a).
Key AreaAvailable water Water requirements/allocations
Local yield Transfers In Total Localrequirements Transfers out Total
Balance
Upper Thukela 506 0 506 114 377+111 502 4Little Thukela 8 0 8 38 0 38 (30)
Bushmans 80 0 80 40 291 69 11
Sundays 8 0 8 32 0 32 (24)
Mooi 64 0 64 52 22 74 (10)
Buffalo 174 0 174 96 55 151 23Lower Thukela 105 402 145 58 87 145 0
Total 945 0 945 430 541 971 (26)
Allocable 383
Notes:1. Releases to support the Lower Thukela Key Area.
2. Supplied from Spioenkop and Wagendrift dams.
3. Since it is not feasible to supply the shortages in the Little Thukela, Sundays or Mooi Key Areas fromthe surpluses in the Upper Thukela, Buffalo or Bushmans Key Areas, there is at least 38 million m3/aavailable for allocation in the Thukela WMA.
While Table 4.27 indicates that there is water available for allocation in the Thukela WMA, it isunlikely that these surpluses can be used to supply the deficits in the Little Thukela, Sundays orMooi River Key Areas because it would be impractical and uneconomical to do so. It would bemore cost effective to develop new water resources infrastructure in the catchments where thedeficits occur, and even this is unlikely to be economically viable, due to the low economicreturns from irrigation, which is the sector experiencing the shortage.
Table 4.27 presents a particular water management scenario, and many other sceanrios canbe developed in order to determine the effects of alternative water use patterns or operatingrules on the available water resource. In Table 4.28 two more scenarios are given. In both ofthese scenarios the Buffallo River Key Area is assumed to contribute to the water requirements
· Page 50

Thukela Water Management Area Internal Strategic Perspective
of the Lower Thukela Key Area. In Scearion 1 the surplus water is assumed to be utiliseddirectly from the large dams (Spieonkop, Wagendrift and Ntshingwayo), which is very simlar tothe scenario given in Table 4.27. In Scenario 2, the surplus water is assumed to be utilised atthe outlet of the various Key Areas, which results in more utilsable water than Sceanrio 1.
Table 4.28: Reconciliation of allocations and available water for the Thukela WMA foryear 2005 assuming support from Wagendrift, Spioenkop and Ntshingwayo dams(million m3/a).
Key AreaScenario 1 Scenario 2
Surplus indams
Release toLower Thukela
Available indams
Surplus incatchment
Release toLower Thukela
Available incatchment
UpperThukela 15 8 7 30 10 20
Bushmans 40 20 20 40 13 27Buffalo 23 12 11 55 17 38Total 78 40 38 125 40 85
4.13 COMPARISON WITH THE FIRST EDITION NWRS
4.13.1 Introduction
In this section, the water balances presented for the various Key Areas are summarised into theSub-area division used in the first edition of the NWRS so that comparison with this first editioncan be made easily and differences explained.
4.13.2 Water requirements
A summary of the water requirements as documented in this ISP is provided in Table 4.29while Table 4.30 contains the water requirements of the NWRS.
Table 4.29: Water requirements/allocations of the Thukela WMA in the year 2005 (million m3/a). Key Areas as defined in this ISP report.
Key Area/
Sub-area
Irrigation Urban Rural Mining andbulk industrial
PowerGeneration
Afforestation Total localrequirements
Transfersout
Grand Total
Upper Thukela 87 17 9 0 0 1 114 377 491
Little Thukela 36 1 1 0 0 0 38 0 38
UPPERTHUKELA
123 18 10 0 0 1 152 377 529
Bushmans 31 4 3 1 0 1 40 0 40
Sundays 26 1 4 1 0 0 32 0 32
Mooi 49 1 1 0 0 1 52 22 74
MOOI/SUNDAYS 106 6 8 2 0 2 124 22 146
Buffalo 50 24 9 12 0 1 96 55 151
BUFFALO 50 24 9 12 0 1 96 55 151
Lower Thukela 22 2 10 24 0 0 58 87 145
LOWERTHUKELA
22 2 10 24 0 0 58 87 145
TOTAL 301 50 37 37 0 4 430 541 971
Note: The shaded rows refer to sub-areas as defined in the NWRS
· Page 51

Thukela Water Management Area Internal Strategic Perspective
Table 4.30: Water requirements/allocations of the Thukela WMA in the year 2000 as given in the First Edition NWRS (million m3/a).
Sub-area Irrigation Urban Rural Mining andbulkindustrial
PowerGeneration
Afforestation Total localrequirements
Transfersout
GrandTotal
UPPER THUKELA 71 11 6 0 0 0 88 377 465MOOI/SUNDAYS 76 13 9 4 0 0 102 34 136BUFFALO 38 27 11 14 1 0 91 55 146LOWER THUKELA 19 1 5 28 0 0 53 40 93TOTAL 204 52 31 46 0 0 334 506 840
The two significant differences between the water requirements given in this ISP and theNWRS are the irrigation requirements and the transfers out of the WMA. These differences aremotivated as follows:
The irrigation requirements in the Thukela WMA, obtained from various sources, aresummarised in Table 4.31. A direct comparison between these data is not appropriate sincethe values reflect development levels in different years and the reliability requirements may notbe the same. The irrigation requirements used in this ISP were based on the TWP feasibilitystudy and are hence similar. It is clear that the TWP (and hence the ISP) irrigationrequirements are significantly higher than those derived from other studies. However, it shouldbe recognised that the TWP erred on the conservative side (high local requirements) in order tomake adequate provision for in-basin use and development.
Table 4.31: Comparison of irrigation water requirements from different sources
Sub-area Requirement(million m3/a) Assurance
ISP 353 Average requirementISP 301 1:50TWP Feasibility Study 323 Average requirementDWAF Registration Database (WARMS) 253 Average requirementWSAM Version 2 229 1:50First Edition NWRS 230 1:50VAPS 231 1:50
The transfers out of the WMA given in this report differ from those of the NWRS for thefollowing reasons:
· The Fairbreeze transfers are included in this report. Even though these transfers have notyet (and might never be) implemented, the licences for the transfers have been issued andhence need to be taken into account.
· The transfer to the Mgeni catchment from the Mooi Key Area is given in the NWRS as 34million m3/a. A detailed analysis of this transfer carried out as part of this ISP has determinedthe impact of this transfer on the availability of the yield in the Mooi Key Area as only 22million m3/a, taking the ecological Reserve into account, which does limit these transferssomewhat.
· Page 52

Thukela Water Management Area Internal Strategic Perspective
4.13.3 Water resource
A summary of the water resource as documented in this ISP is provided in Tables 4.32 whileTable 4.33 contains the water resource of the NWRS. Note that the water resource given inTable 4.32 is based on the conservative scenario given in Table 4.27.
Table 4.32: Water resources of the Thukela WMA in the year 2005 (million m3/a) per Key Area (ISP) and per sub-area (NWRS) as determined as part of this ISP report
Key Area/
Sub-area
Natural resource
Surface water Groundwater
Usable returnflow
Total localyield
Transfer in Grand total
Upper Thukela 478 5 23 506 0 506Little Thukela 6 1 1 8 0 8
UPPER THUKELA 484 6 24 514 0 514Bushmans 74 2 4 80 0 80
Sundays 6 1 1 8 0 8Mooi 54 2 8 64 0 64
MOOI/SUNDAYS 134 5 13 152 0 152Buffalo 136 6 32 174 0 174
BUFFALO 136 6 32 174 0 174Lower Thukela 101 1 3 105 0 105
LOWER THUKELA 101 1 3 105 0 105
TOTAL 855 18 72 945 0 945Note: The shaded rows refer to sub-areas as defined in the NWRS
The water resource of the Thukela WMA, as determined for this ISP using the WRYM setup forthe Thukela is substantially higher than given in the NWRS. The main reason for this is that thereduction in yield due to the ecological Reserve, as used in the NWRS (which was based ondesktop estimates), is much higher than that recently determined through the Thukela ReserveDetermination Study (DWAF, 2004b). The latter Reserve has been approved by DWAF andhence is now the accepted Reserve for the WMA.
Table 4.33: Water resources of the Thukela WMA in the year 2000 (million m3/a) per sub- area (NWRS) as given in the NWRS
Sub-area Natural resource
Surface water Groundwater
Usable returnflow
Total localyield
Transfer in Grand total
UPPER THUKELA 376 5 13 394 0 394MOOI/SUNDAYS 110 3 15 128 0 128BUFFALO 107 6 22 136 0 136LOWER THUKELA 73 1 3 79 0 79TOTAL 666 15 56 737 0 737
4.13.4 Reconciliation of requirements and availability
A reconciliation of the water requirements and available resource as documented in this ISP isprovided in Tables 4.34 while Table 4.35 contains the reconciliation as given in the First EditionNWRS.
· Page 53
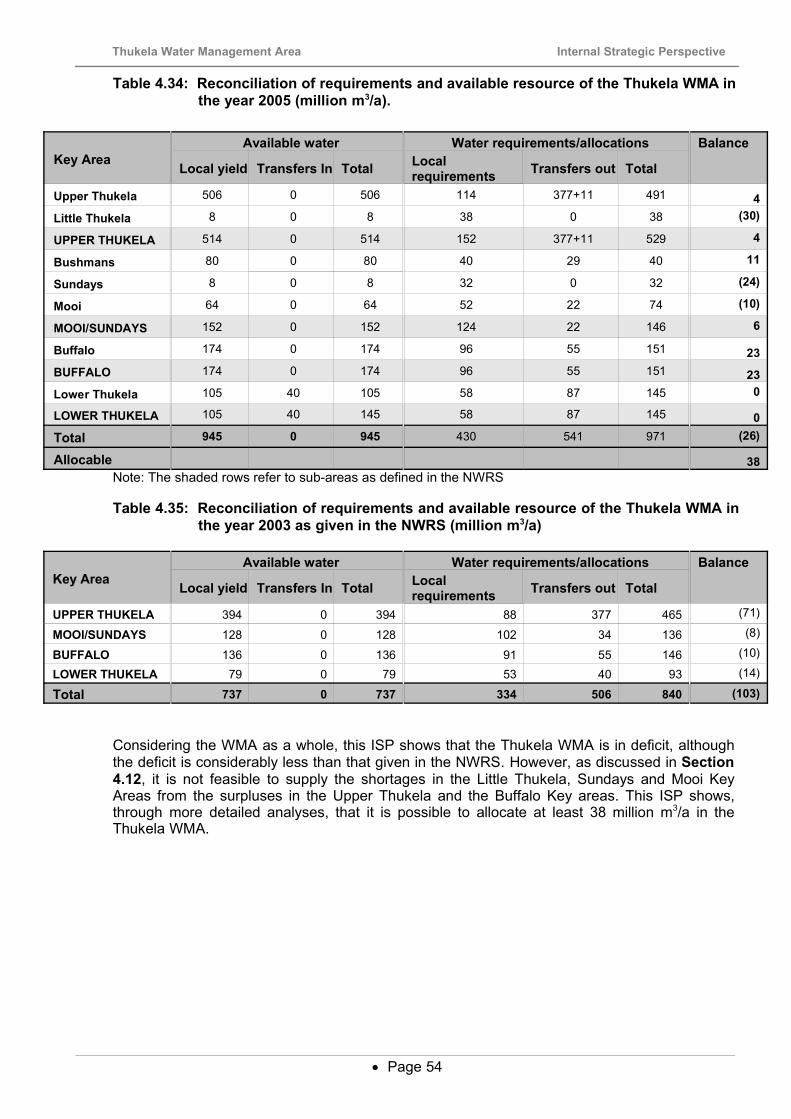
Thukela Water Management Area Internal Strategic Perspective
Table 4.34: Reconciliation of requirements and available resource of the Thukela WMA in the year 2005 (million m3/a).
Key AreaAvailable water Water requirements/allocations
Local yield Transfers In Total Localrequirements Transfers out Total
Balance
Upper Thukela 506 0 506 114 377+11 491 4Little Thukela 8 0 8 38 0 38 (30)
UPPER THUKELA 514 0 514 152 377+11 529 4
Bushmans 80 0 80 40 29 40 11
Sundays 8 0 8 32 0 32 (24)
Mooi 64 0 64 52 22 74 (10)
MOOI/SUNDAYS 152 0 152 124 22 146 6
Buffalo 174 0 174 96 55 151 23BUFFALO 174 0 174 96 55 151 23Lower Thukela 105 40 105 58 87 145 0
LOWER THUKELA 105 40 145 58 87 145 0Total 945 0 945 430 541 971 (26)
Allocable 38Note: The shaded rows refer to sub-areas as defined in the NWRS
Table 4.35: Reconciliation of requirements and available resource of the Thukela WMA in the year 2003 as given in the NWRS (million m3/a)
Key AreaAvailable water Water requirements/allocations
Local yield Transfers In Total Localrequirements Transfers out Total
Balance
UPPER THUKELA 394 0 394 88 377 465 (71)
MOOI/SUNDAYS 128 0 128 102 34 136 (8)
BUFFALO 136 0 136 91 55 146 (10)
LOWER THUKELA 79 0 79 53 40 93 (14)
Total 737 0 737 334 506 840 (103)
Considering the WMA as a whole, this ISP shows that the Thukela WMA is in deficit, althoughthe deficit is considerably less than that given in the NWRS. However, as discussed in Section4.12, it is not feasible to supply the shortages in the Little Thukela, Sundays and Mooi KeyAreas from the surpluses in the Upper Thukela and the Buffalo Key areas. This ISP shows,through more detailed analyses, that it is possible to allocate at least 38 million m3/a in theThukela WMA.
· Page 54

Thukela Water Management Area Internal Strategic Perspective
BIBLIOGRAPHY
Department of Water Affairs and Forestry (1994). Vaal Augmentation Planning Study:Tugela-Vaal Transfer Scheme: Reconnaissance Phase. Report No. V000/00/0894.
Department of Water Affairs and Forestry (1995). Vaal Augmentation Planning Study:Tugela-Vaal Transfer Scheme: Pre-Feasibility Phase. Report No. V000/00/0895.
Department of Water Affairs and Forestry (1995). Characterisation and Mapping of theGroundwater Resources, KwaZulu-Natal Province. Reports and Maps, Mapping Units1,6,8,9 and 11.
Department of Water Affairs and Forestry (1996). Vaal Augmentation Planning Study:Tugela-Vaal Transfer Scheme: Interim Study. Report No. V000/00/1296.
Department of Water Affairs and Forestry (1997). The Impacts of Timber Plantations onrunoff in South Africa: A Handy Reference Manual. Compiled by the CSIR.
Department of Water Affairs and Forestry (1999). Yields of Major Dams in the ThukelaBasin: Internal DWAF Memorandum; File 14/V100
Department of Water Affairs and Forestry (2001). Mooi-Mgeni Transfer Scheme Phase 2.Supporting Report No 6: Water Resource Analysis.
Department of Water Affairs and Forestry (2002a); Thukela Water Project Feasibility Study:Main Report. Report No. V000/00/9600.
Department of Water Affairs and Forestry (2002b). Thukela WMA – Water ResourcesSituation Assessment. Report No: P WMA 7/000/00/0301.
Department of Water Affairs and Forestry (2003a); Thukela Water Management Area:Overview of Water Resources and Utilisation. Report No. P WMA 5/000/00/0203.
Department of Water Affairs and Forestry (2003b); National Water Resource Strategy, FirstEdition.
Department of Water Affairs and Forestry (2004a); Thukela Water Project Decision SupportPhase. Water Resources and Hydrology Report. Report No. PB V000-00-127/02.
Department of Water Affairs and Forestry (2004b). Thukela Water Project Decision SupportPhase. An Overview of the Current Operating Rules. Report No. PB V000-00-128/02.
Department of Water Affairs and Forestry, South Africa (2004c). Internal StrategicPerspective: Mvoti to Mzimkulu Water Management Area : Prepared by Tlou & Matji (Pty)Ltd, WRP (Pty) Ltd, and DMM cc on behalf of the Directorate: National Water ResourcePlanning (East). DWAF Report No. P WMA 11/000/00/0304.
KwaZulu-Natal Provincial Cabinet (2002). Provincial Growth and Development Strategy forKwaZulu-Natal
Le Maitre, DC, Versfeld, DB, and Chapman, RA (November 1998). The impact of InvadingAlien Plants on Surface Water Resources in South Africa: A Preliminary Assessment.
Mallory, SJL (2003). Water resources modelling for the National Water Act. Eleventh SouthAfrican National Hydrology Symposium, 2003.
· Page 55

Thukela Water Management Area Internal Strategic Perspective
Midgley, DC, Pitman, WV and Middleton, BJ (1994). Surface Water Resources of SouthAfrica 1990. Volume VI. Drainage Regions U,V,W,X - Eastern Escarpment– Appendices andBook of Maps. WRC Report Number 298/6.1/94.
· Page 56

THUKELA WATER MANAGEMENT AREA INTERNAL STRATEGIC PERSPECTIVE
PART B: STRATEGY TABLES
Table of contents
1 WATER BALANCE AND WATER RESOURCES RECONCILIATION.................................................................. 2
1.1 SURFACE WATER AVAILABILITY............................................................................................................................................. 21.2 WATER REQUIREMENTS AND USE...........................................................................................................................................41.3 WATER BALANCE RECONCILIATION........................................................................................................................................ 61.4 GROUNDWATER AVAILABILITY AND USE..................................................................................................................................9
2 WATER RESOURCES PROTECTION.........................................................................................................................11
2.1 RESERVE AND RESOURCE QUALITY OBJECTIVES...................................................................................................................... 112.2 WATER QUALITY MANAGEMENT.......................................................................................................................................... 13
3 WATER CONSERVATION AND DEMAND MANAGEMENT.................................................................................17
3.1 WATER CONSERVATION AND DEMAND MANAGEMENT.............................................................................................................. 17
4 WATERWORKS DEVELOPMENT & MANAGEMENT...........................................................................................19
4.1 INFRASTRUCTURE DEVELOPMENT AND SYSTEM OPERATION....................................................................................................... 19
5 MONITORING & INFORMATION MANAGEMENT............................................................................................... 22
5.1 MONITORING NETWORKS....................................................................................................................................................22
6 INSTITUTIONAL DEVELOPMENT & SUPPORT.....................................................................................................26
6.1 INSTITUTIONAL SUPPORT.....................................................................................................................................................26
7 INTEGRATION AND CO-OPERATIVE GOVERNANCE.........................................................................................28
7.1 INTEGRATION AND CO-OPERATIVE GOVERNANCE.....................................................................................................................28
8 IMPLEMENTATION.......................................................................................................................................................31
8.1 IMPLEMENTATION..............................................................................................................................................................31
PartB.sxw Page 1 July 2004

THUKELA WATER MANAGEMENT AREA INTERNAL STRATEGIC PERSPECTIVE
1 WATER BALANCE AND WATER RESOURCES RECONCILIATION
1.1 SURFACE WATER AVAILABILITY
Managementobjective
Ensure reliable estimates of the water resources (surface and groundwater) are availableto effectively conduct Integrated Water Resources Management. The factors impactingon the water resources need to be clearly defined and understood.
Situationassessment/motivation
The surface water resources of the Thukela WMA have been the subject ofinvestigation of several studies in the past. This interest in the water resourceavailability is due to the fact that the Thukela WMA, in addition to its own in-basindemands, is also an important source of water for transfers to the Upper Vaal, theUsutu to Mhlathuze and the Mvoti to Mzimkulu WMAs.
The latest studies that involved updating the hydrological database and waterresource analysis are as listed below:
Vaal Augmentation Planning Study: Thukela – Vaal Transfer Scheme,concluded in 1995 and superceded by the subsequent studies listed below.(DWAF, 1995)
Mooi, Mkomazi Hydrology Update, completed in the year 1997 (DWAF, 1999).
Thukela Water Project Feasibility Study, concluded in the year 2000 (DWAF,2000).
Thukela Water Project – Decision Support Phase.
These reports are summarised in Annexure B.
The hydrological data produced by the Thukela Water Project Feasibility Study areconsidered to be at a sufficient level of confidence to make reliable estimates of thewater resource availability at a large system resolution. It is however recognised thatincreased resolution hydrology and water resources models would be required infuture, particularly to assist in the management of allocations for licensing.
Information on the water resource availability, for the purpose of compiling a waterbalance for the Thukela WMA, originates from system analyses that were carried outas part of the Thukela Reserve Determination Study. The purpose of the analyseswas to quantify the yield capability for the two scenarios, with and without theecological Reserve. (See the Reserve and Resource Quality Objectives Strategy2.1 for more details on the Reserve). The analysis methodology that was applied toobtain the water balances is presented in detail in Section 4.2 of Part A of thedocument.
The water resource availability was determined for seven Key Areas (see Figure 3.1)as presented in a series of tables that are given in Section 4 of Part A of this report.The Key Area availability data was further aggregated into four larger areas, whichcorrespond approximately to the “Sub-area” definition that was used in the NWRS.These Sub-areas are also shown in Figure 3.1, and the comparisons between theISP data and the data from the NWRS supporting reports (DWAF, 2003) is presentedin Section 4.13.
Groundwater availability is covered separately as part of Strategy 1.4.
PartB.sxw Page 2 July 2004

THUKELA WATER MANAGEMENT AREA INTERNAL STRATEGIC PERSPECTIVE
Strategy A mechanism of documenting existing information and making it available to futurestudies so that resources are channelled at improving rather than recreatinginformation are needed in the Thukela WMA. This is especially important since majorwater resources developments are planned in the medium term in the WMA.
The resolution of the water resources assessment model that is available for theThukela WMA should be refined (where required) to be able to assess water-balance conditions in sub-catchments. Such a model will typically be required forassessing water reconciliation options, water-use licence applications and, in the longterm, for compulsory licensing.
Severe drought events can have significant impacts on the availability of water in theWMA and it is therefore required to consider revising or extending the hydrologicaltime series database when droughts occur in future. Other factors such as majorchanges in the land use would also warrant the updating of the hydrology. Thegeneral strategy is to monitor prevailing conditions over time and, when there is aperceived reason to update the hydrology, to first undertake a reconnaissance impactassessment and then decide whether or not a full-scale study to update the hydrologyis required.
It would also be advisable to update the hydrology and models prior to theimplementation of Compulsory Licensing, particularly if the hydrology records can beextended by ten years or more.
The Regional DWAF office, as the de facto CMA, should always be an integral part ofall water availability assessment initiatives in the WMA and should communicate theresults and procedures of assessments to the relevant local stakeholders and otherplanning forums to ensure consistency in methodology and to facilitate the sharing ofupdated data and information.
Management actions Responsibility andpriority
Develop or assist in the development of spatially fine resolution hydrologydata and water resources models of the Thukela WMA to enable appropriateassessments of water resources at detailed catchment level, in particularwhere the water resources are stressed in catchments like the Little Thukelaand Sundays rivers, or where there are large demands on the waterresource, for example the Buffalo Key Area. The refinement of the modelshould be undertaken incrementally, focusing first on catchments whereproblems are experienced by the users or where water-use licenseapplications necessitate that such analysis be undertaken.
D: NWRP & R OfficePriority: High
Assess the prevailing conditions on a continuous basis to detect significantchanges (e.g. severe drought or land-use changes) in order to commissionreconnaissance assessment to determine the need to update the hydrology.Once there is evidence to show that the availability is affected, appropriatehydrological studies should be commissioned.
D: NWRP
Priority: Medium
PartB.sxw Page 3 July 2004

THUKELA WATER MANAGEMENT AREA INTERNAL STRATEGIC PERSPECTIVE
1.2 WATER REQUIREMENTS AND USE
Managementobjective
Ensure that reliable information on the water requirements in the Thukela WMA areavailable and are continuously updated as new information becomes available or if thereare changes in the current water use patterns. This includes ensuring that waterrequirement scenarios are maintained and updated for planning and management of thewater resource of the WMA.
Situationassessment/motivation
With reference to the water requirement (see Section 4 of Part A of this report), it isevident that of the total estimated water requirement of 521 million m3/annum withinthe water management area, 58% is for irrigation, 10% for urban purposes and 7%for mining and bulk industrial use as well as rural use. Although a significant quantityof water is intercepted by afforestation, the location of the afforestation areas relativeto the existing major dams in the WMA is such that it has little impact on the yieldfrom the existing dams.
In addition to the local water requirements, discussed above, there are large inter-basin transfers out of the WMA. The amount of water transferred out of the WMAvaries from year to year depending on the requirements of the Vaal, Mhlathuze andMgeni systems to which water is transferred. The maximum quantity that can betransferred, as an average over the historical flow sequence is:
Thukela-Vaal transfer: 530 million m3/annum
Thukela-Mhlathuze transfer: 40 million m3/annum
Thukela-Mooi transfer: 45 million m3/annum
Zaaihoek transfer: 55 million m3/annum
The estimated impact of these transfers on the available yield in the Thukela WMA is541 million m3/annum.
There remains some uncertainty with respect to the water requirements from theirrigation sector. As an example, the registration database (version as on November2003) indicates that the total volume of water used for irrigation is 253 million m3/a,which is much less than indicated in the Thukela Reserve Determination Study(Hydrological Support) (see Table 2.1 in Part A). The registration and verification ofthe water use data, as captured in the registration database, has however not beencompleted and it was decided to accept the estimates from the Thukela WaterProject Feasibility Study (DWAF, 2002a) for the irrigation sector. This decision isfurther supported by the knowledge that the aforementioned study was undertaken ata relatively high level of detail.
The water use and water requirement projections for the main urban centres andsome of the rural users have been reviewed and updated where required, as part ofthe Thukela Reserve Determination Study (DWAF, 2002d). This source of data wasconsidered to be of an acceptable level of confidence and was therefore used in theISP.
The reader is also referred to Section 4 (Part A) of this report for detailed informationon the water requirements in each of the seven Key Areas.
The benefit of comparing the actual water use with projections (undertaken as part ofthe Thukela Reserve Determination Study, (DWAF 2004a) was illustrated in the largediscrepancies that were observed for certain consumption centres. That task made itpossible to identify those problems and that realistic water requirement scenarioscould be compiled. There is currently, however, not a process or a database systemin place to undertake similar comparisons on a continual basis.
PartB.sxw Page 4 July 2004
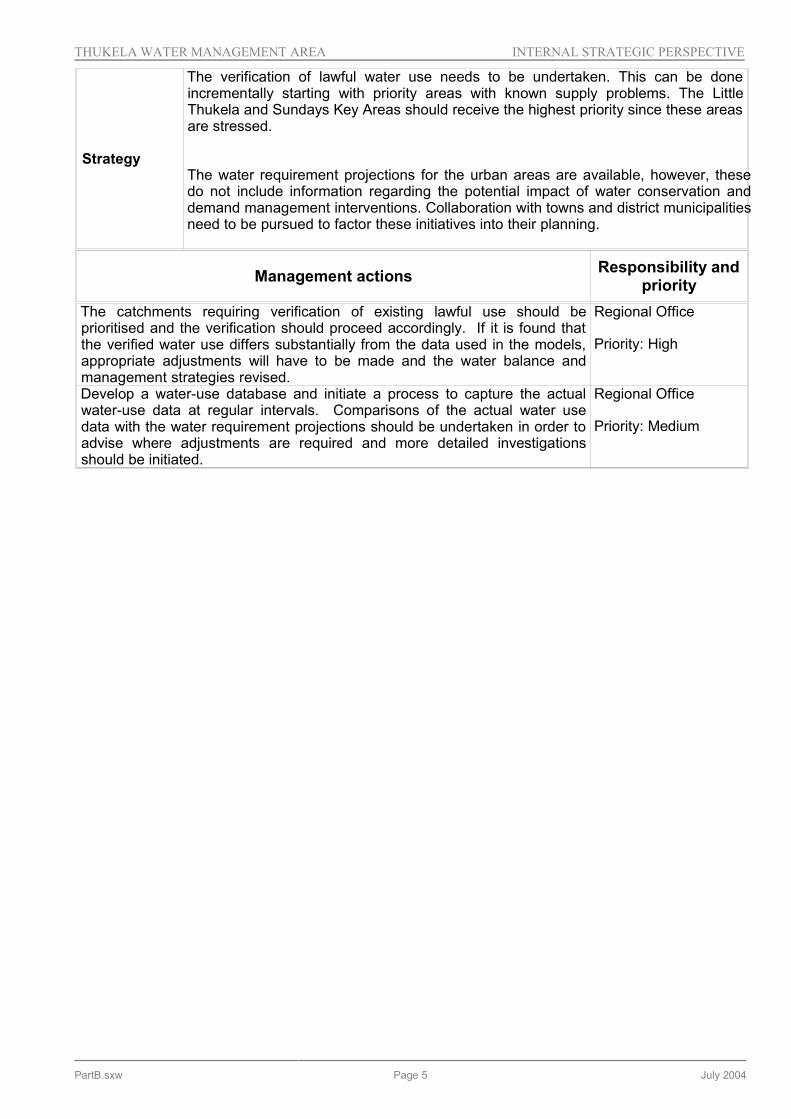
THUKELA WATER MANAGEMENT AREA INTERNAL STRATEGIC PERSPECTIVE
Strategy
The verification of lawful water use needs to be undertaken. This can be doneincrementally starting with priority areas with known supply problems. The LittleThukela and Sundays Key Areas should receive the highest priority since these areasare stressed.
The water requirement projections for the urban areas are available, however, thesedo not include information regarding the potential impact of water conservation anddemand management interventions. Collaboration with towns and district municipalitiesneed to be pursued to factor these initiatives into their planning.
Management actions Responsibility andpriority
The catchments requiring verification of existing lawful use should beprioritised and the verification should proceed accordingly. If it is found thatthe verified water use differs substantially from the data used in the models,appropriate adjustments will have to be made and the water balance andmanagement strategies revised.
Regional Office
Priority: High
Develop a water-use database and initiate a process to capture the actualwater-use data at regular intervals. Comparisons of the actual water usedata with the water requirement projections should be undertaken in order toadvise where adjustments are required and more detailed investigationsshould be initiated.
Regional Office
Priority: Medium
PartB.sxw Page 5 July 2004

THUKELA WATER MANAGEMENT AREA INTERNAL STRATEGIC PERSPECTIVE
1.3 WATER BALANCE RECONCILIATION
Managementobjective
To attain an equitable and sustainable balance between water requirements and availablewater resources by progressively implementing integrated water resource managementmeasures.
Situationassessment/motivation
The Thukela WMA has surplus water available in the Upper Thukela, Buffalo and/orthe Lower Thukela Key Areas (the latter as a result of possible support fromupstream Key Areas). This surplus water varies from 38 to 100 million m3/adepending on where in the WMA the water is required and the source from which it isto be supplied. If supplied directly from the Spioenkop and Ntshingwayo dams thenthe surplus yield is only about 38 million m3/a while if Spioenkop and Ntshingwayodams are used to support allocations at the mouth of the Thukela and the lowerreaches of the Buffalo River respectively, then the surplus yield could be as high as100 million m3/a. Either the Wagendrift or Spioenkop dam are required to support thelarge allocations and ecological requirements of the Lower Thukela.
The Upper Thukela, Sunday and Mooi Key Areas are in deficit due to over-allocationor over-development of irrigation. Reported water shortages in the upper BuffaloRiver could be due to the incorrect operation of the Skurwepoort diversion, whichdiverts water to the Ngagane water treatment plant. A minimum flow of 1 m3/s mustbe allowed to flow over this weir but it appears as if this minimum flow is not alwaysmaintained.
It is not considered feasible to use the surpluses in the Upper Thukela and BuffaloKey Areas to eliminate the shortages in the Little Thukela, Sundays or Mooi RiverKey Areas. Local resources should rather be developed or compulsory licencingapplied in areas where there are large deficits.
Factors that could have a significant influence on the water balance:
● With reference to the large differences in the water requirement for the irrigationsector from various data sources, as discussed in the Water Requirements and UseStrategy 1.2, the surpluses could be significantly higher if the actual irrigation waterrequirements are lower than estimated for the balance calculations.
● After water transfers to the Vaal catchment, irrigation is the largest water user in theupper Thukela and the rest of the WMA and could benefit from WC&DM. TheWC&DM strategy is discussed separately in Strategy 4.
Three dams have been proposed for development in the WMA, primarily forincreased transfers of water into the Vaal and Mgeni catchments. These are JanaDam on the Thukela River and Mielietuin Dam on the Bushmans River for thetransfers to the Vaal, and Spring Grove Dam on the Mooi River for transfers to theMgeni System. The three dams have the potential of increasing the yield of the WMAby 598 million m3/annum. These dams will however not relieve the water-stressedsituation in the Little Thukela or the Sundays River catchment.
PartB.sxw Page 6 July 2004
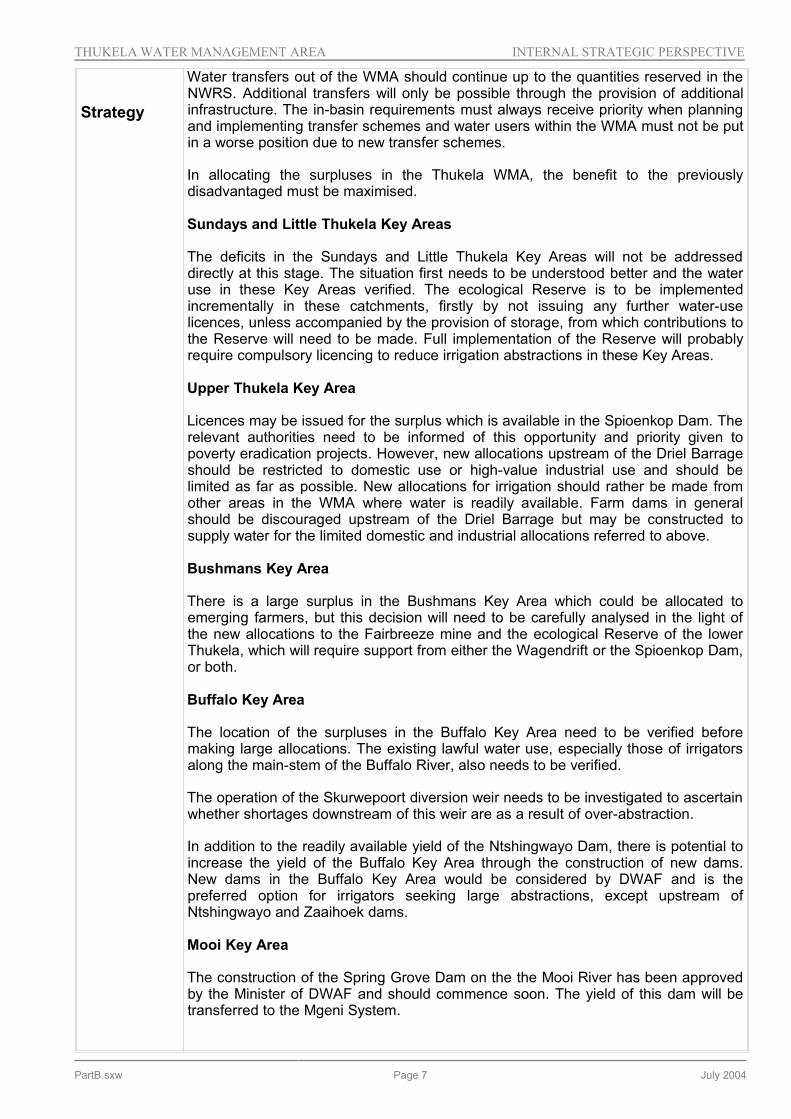
THUKELA WATER MANAGEMENT AREA INTERNAL STRATEGIC PERSPECTIVE
Strategy
Water transfers out of the WMA should continue up to the quantities reserved in theNWRS. Additional transfers will only be possible through the provision of additionalinfrastructure. The in-basin requirements must always receive priority when planningand implementing transfer schemes and water users within the WMA must not be putin a worse position due to new transfer schemes.
In allocating the surpluses in the Thukela WMA, the benefit to the previouslydisadvantaged must be maximised.
Sundays and Little Thukela Key Areas
The deficits in the Sundays and Little Thukela Key Areas will not be addresseddirectly at this stage. The situation first needs to be understood better and the wateruse in these Key Areas verified. The ecological Reserve is to be implementedincrementally in these catchments, firstly by not issuing any further water-uselicences, unless accompanied by the provision of storage, from which contributions tothe Reserve will need to be made. Full implementation of the Reserve will probablyrequire compulsory licencing to reduce irrigation abstractions in these Key Areas.
Upper Thukela Key Area
Licences may be issued for the surplus which is available in the Spioenkop Dam. Therelevant authorities need to be informed of this opportunity and priority given topoverty eradication projects. However, new allocations upstream of the Driel Barrageshould be restricted to domestic use or high-value industrial use and should belimited as far as possible. New allocations for irrigation should rather be made fromother areas in the WMA where water is readily available. Farm dams in generalshould be discouraged upstream of the Driel Barrage but may be constructed tosupply water for the limited domestic and industrial allocations referred to above.
Bushmans Key Area
There is a large surplus in the Bushmans Key Area which could be allocated toemerging farmers, but this decision will need to be carefully analysed in the light ofthe new allocations to the Fairbreeze mine and the ecological Reserve of the lowerThukela, which will require support from either the Wagendrift or the Spioenkop Dam,or both.
Buffalo Key Area
The location of the surpluses in the Buffalo Key Area need to be verified beforemaking large allocations. The existing lawful water use, especially those of irrigatorsalong the main-stem of the Buffalo River, also needs to be verified.
The operation of the Skurwepoort diversion weir needs to be investigated to ascertainwhether shortages downstream of this weir are as a result of over-abstraction.
In addition to the readily available yield of the Ntshingwayo Dam, there is potential toincrease the yield of the Buffalo Key Area through the construction of new dams.New dams in the Buffalo Key Area would be considered by DWAF and is thepreferred option for irrigators seeking large abstractions, except upstream ofNtshingwayo and Zaaihoek dams.
Mooi Key Area
The construction of the Spring Grove Dam on the the Mooi River has been approvedby the Minister of DWAF and should commence soon. The yield of this dam will betransferred to the Mgeni System.
PartB.sxw Page 7 July 2004
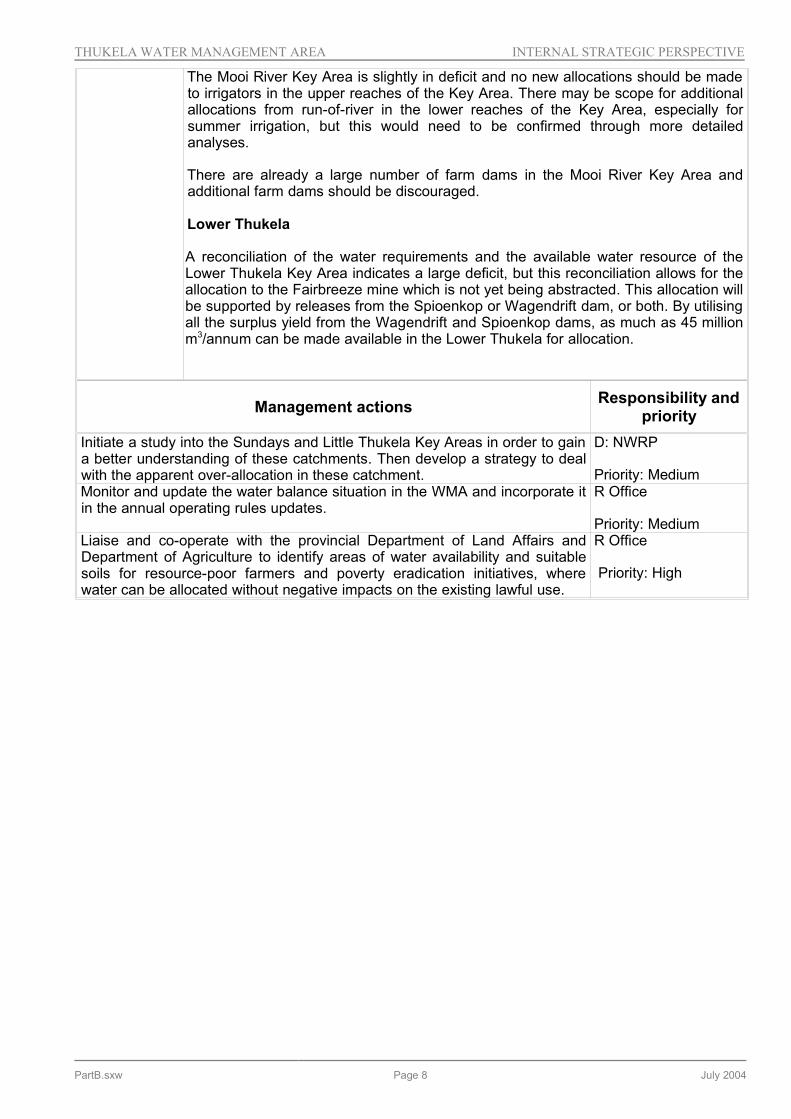
THUKELA WATER MANAGEMENT AREA INTERNAL STRATEGIC PERSPECTIVE
The Mooi River Key Area is slightly in deficit and no new allocations should be madeto irrigators in the upper reaches of the Key Area. There may be scope for additionalallocations from run-of-river in the lower reaches of the Key Area, especially forsummer irrigation, but this would need to be confirmed through more detailedanalyses.
There are already a large number of farm dams in the Mooi River Key Area andadditional farm dams should be discouraged.
Lower Thukela
A reconciliation of the water requirements and the available water resource of theLower Thukela Key Area indicates a large deficit, but this reconciliation allows for theallocation to the Fairbreeze mine which is not yet being abstracted. This allocation willbe supported by releases from the Spioenkop or Wagendrift dam, or both. By utilisingall the surplus yield from the Wagendrift and Spioenkop dams, as much as 45 millionm3/annum can be made available in the Lower Thukela for allocation.
Management actions Responsibility andpriority
Initiate a study into the Sundays and Little Thukela Key Areas in order to gaina better understanding of these catchments. Then develop a strategy to dealwith the apparent over-allocation in these catchment.
D: NWRP
Priority: MediumMonitor and update the water balance situation in the WMA and incorporate itin the annual operating rules updates.
R Office
Priority: MediumLiaise and co-operate with the provincial Department of Land Affairs andDepartment of Agriculture to identify areas of water availability and suitablesoils for resource-poor farmers and poverty eradication initiatives, wherewater can be allocated without negative impacts on the existing lawful use.
R Office
Priority: High
PartB.sxw Page 8 July 2004

THUKELA WATER MANAGEMENT AREA INTERNAL STRATEGIC PERSPECTIVE
1.4 GROUNDWATER AVAILABILITY AND USE
Managementobjective
Determine the potential for groundwater development in providing water to the ruralpoor and to ensure that groundwater use is given the same prominence as surfacewater so as to remove the perception that it is a poor alternative to surface waterresources. This will require a significant improvement in the knowledge ofgroundwater potential and its spatial distribution in the WMA.
Situationassessment
There are no major primary aquifers in the Thukela River WMA and groundwater isheld in secondary aquifers.
The last detailed assessment of the groundwater for the WMA was carried out byDWAF in 1994 under the auspices of the Characterisation and Mapping ofGroundwater in KwaZulu-Natal Study. This study included a comprehensive censusof the then existing boreholes. There has been significant groundwater developmentduring the interim period, particularly related to rural water supply schemes. Inaddition, the latest WSDP’s and the WSA initiatives have resulted in substantiallymore groundwater information becoming available. This all points towards the needfor the DWAF (1994) mapping study to be updated. The information on the geology,aquifers and lithology documented in this study is still valid. The study estimates thata total volume of 41 million m3/a could be made available through groundwaterdevelopment, however, the spatial distribution of this potential is not evenlydistributed throughout the WMA.
The quality of the groundwater in general is good and suitable for domestic usewithout treatment apart from disinfection. However, localised groundwater pollutionproblems have been reported in the vicinities of abandoned coal mines in the Buffaloand Sundays river catchments.
More than 90% of remote rural dwellers are reliant on groundwater in the form ofsprings and boreholes. Most groundwater schemes provide a rudimentary ruraldomestic service particularly to those communities in the Lower Buffalo and LowerThukela catchments. Information on these schemes and the communities theyservice is poor or totally lacking. Furthermore, the distances from households to theboreholes, wells or springs tend to be large necessitating carrying of water incontainers and resulting in very low levels of consumption.
The uThukela District Municipality, with support from DWAF, is implementing theThukela Emergency Water Supply Scheme which has been ongoing for almost 2years. This involves the drilling of boreholes and equipping them with either handpumps or electric motors where yields are higher. Reticulation is also being suppliedin certain areas where high-yielding boreholes can support the requirements.
Groundwater supplies to some schemes in the peri-urban areas like Blauwbosch(near Osizweni) are being replaced with surface water supplies. The reasons for thisare that the groundwater resources are proving to be inadequate and the waterquality is poor. This option may be practical in and around towns that wereinfluenced by the apartheid era land tenure planning principles, but conjunctive usecould be a more appropriate solution.
The widely dispersed settlements and steep terrain in most of the rural areas withinthe WMA has resulted in groundwater being the most cost-effective developmentoption for water supply to the rural sector. However, the failure of many existingboreholes and groundwater schemes has resulted in the perception that groundwateris an unreliable source. These failures are often a result of the following :
Lack of monitoring;
Insufficient maintenance;
PartB.sxw Page 9 July 2004

THUKELA WATER MANAGEMENT AREA INTERNAL STRATEGIC PERSPECTIVE
Strategy
Incorrectly sited boreholes;
General lack of understanding of groundwater and its management;
Limited number of groundwater specialists in the country; and
Boreholes cannot be visually inspected.
Tools for detailed assessments are complicated; Given the generally widespreadavailability of groundwater, albeit in small quantities, this resource should beconsidered as a priority to supply small or dispersed users such as rural communitiesor resource-poor farmers. Surface water resources should be considered only ifgroundwater is proved to be inadequate or non-feasible. Careful consideration alsoneeds to be given to the conjunctive use of both ground and surface water resourcesfor slightly larger users such as small villages and towns.
The significant potential of groundwater resources in the WMA presents anopportunity to utilise it as a resource in areas where surface water resources arealready under stress. After careful investigation, and recognising the interactionbetween surface and groundwater, it may be possible for groundwater to bedeveloped for purposes such as irrigation in the Little Thukela catchment (forexample), if the impacts are not negative.
Political perceptions of groundwater being a poor alternative resource to surfacewater have developed over time and are characterised by inappropriate managementof groundwater schemes. It is of fundamental importance that these perceptions arereversed and that the value of groundwater be communicated to political roleplayers. Furthermore, technical staff with the District Municipalities, as the mandatedWSAs, need to be made aware of the potential of groundwater and its value. Thisshould be accompanied by the general promotion of groundwater use in this WMAand others in KwaZulu-Natal endowed with abundant surface water resources.
The DWAF (1994) groundwater characterisation and mapping study needs to beupdated. This initiative should focus on the acquisition of appropriate data regardinggroundwater development over the past 10 years. Specific focus should be onregistered groundwater use, groundwater utilisation plans in WSDPs and povertyeradication projects. A system of maintaining such a study as current is essentialwith developers and authorities being engaged to pass on additional groundwaterinformation and data as it becomes available.
Management actions Responsibility andpriority
The DWAF (1994) groundwater characterisation and mapping study to beupdated to reflect the additional groundwater data and information that hasbecome available over the last 10 years. Areas of high groundwater potentialand rural settlements should be identified to highlight areas wheregroundwater use may be sustainable.
D: HI
Priority: High
Actively encourage and promote the use of groundwater in rural water supplyschemes in all forums and to all institutions.
RO
Priority: HighEngage with groundwater specialists, WSAs and WSPs to obtaingroundwater data and information on a continuous basis as schemes aredeveloped and water supplies provided.
RO
Priority: MediumEnsure that all DWAF funded and/or implemented schemes have consideredgroundwater as a resource and that, if not recommended, then should beproven to be unsustainable.
RO
Priority: High
PartB.sxw Page 10 July 2004

THUKELA WATER MANAGEMENT AREA INTERNAL STRATEGIC PERSPECTIVE
2 WATER RESOURCES PROTECTION
2.1 RESERVE AND RESOURCE QUALITY OBJECTIVES
Managementobjective
The aim of this strategy is to determine the
• Quality of water; and
• Quantity and assurance of supply of water
which are needed to protect basic human needs and the structure and function ofecosystems so as to secure ecologically sustainable development and to ensureeconomic utilisation of the allocable resource.
Situationassessment
The Thukela River catchments were identified during the Vaal Augmentation PlanningStudy (DWAF, 1995) as a strategic water resource for augmentation of the water supplyto the Vaal River Supply Area sometime in the future. A study was initiated in 1998 todetermine the transferable yield from the Thukela through the Drakensberg PumpedStorage Scheme. The transferable yield was determined using the estimate of theecological requirement done in 1996. The level of confidence for this ecological flowrequirement was considered to be low to medium. Because of the magnitude of thepotential development and the requirements of the NWA of 1998 a comprehensiveReserve determination was considered necessary. Furthermore there have been anumber of licence applications received in the Thukela River catchment, some, such asfor the Fairbreeze mine, for large quantities of water.
The initial Recommended Reserve for the upper catchment of the Thukela Riverwould impact on the transferable yield of the existing Thukela Vaal Transfer Schemeby approximately 250 million m3/a. A comprehensive Reserve study was initiated in2001 and has recently been completed. Based on this comprehensive Reserve, thereduction in transferable yield of the existing transfer scheme will be only 35 millionm3/a. The reduction in available yield in the whole WMA is estimated at 190 millionm3/a.
The main issues regarding the Reserve and Resource Quality Objectives for theThukela River are as follows:
The Reserve determinations of the Little Thukela, the Mooi and to a limited extentthe Sundays River catchments indicate a significant reduction in assurance of supplyto existing users, especially irrigators, in these catchments. Without additionalregulation in these catchments, implementation of the Reserve will have a significanteconomic impact.
If the Reserve is not implemented in the above-mentioned catchments, thecontributions of these tributaries to the ecological water requirements in the mainstem will be reduced and the main stem will have to contribute more than its fairshare to the Reserve.
Strategy The ecological Reserve is to be implemented incrementally, starting with thosecatchments which are not stressed. This will initially entail developing operating rulesfor the major dams in the catchment, namely, Spioenkop, Wagendrift, andNtshingwayo dams. Once the water resources situation in the Sundays and LittleThukela Key Areas area better understood, steps towards implementing the Reservein these catchments can be taken. This might necessitate Compulsory Licensing tocorrect the apparent over-allocation in these Key Areas.
PartB.sxw Page 11 July 2004

THUKELA WATER MANAGEMENT AREA INTERNAL STRATEGIC PERSPECTIVE
Management actions Responsibility andpriority
Develop operating rules for the major dams in the WMA to meet theecological Reserve.
Design and implement a monitoring programme to ensure compliance withthe ecological Reserve.
Regional Office
Priority: High
PartB.sxw Page 12 July 2004
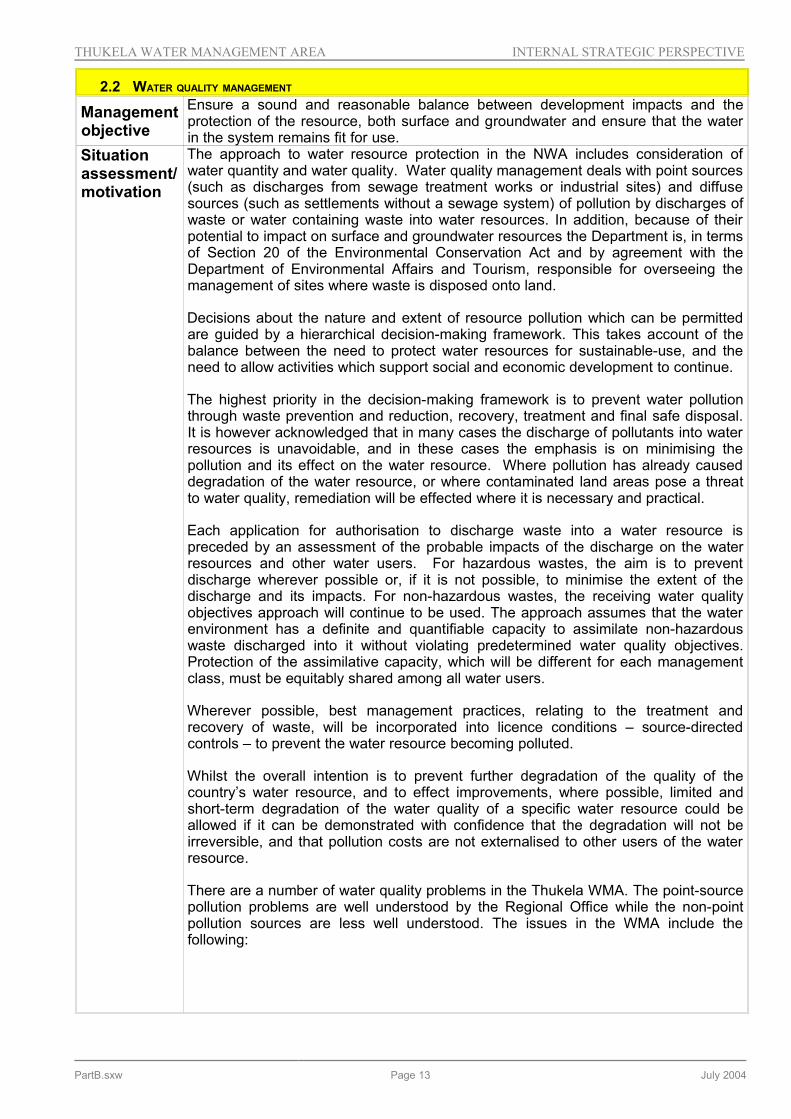
THUKELA WATER MANAGEMENT AREA INTERNAL STRATEGIC PERSPECTIVE
2.2 WATER QUALITY MANAGEMENT
Managementobjective
Ensure a sound and reasonable balance between development impacts and theprotection of the resource, both surface and groundwater and ensure that the waterin the system remains fit for use.
Situationassessment/motivation
The approach to water resource protection in the NWA includes consideration ofwater quantity and water quality. Water quality management deals with point sources(such as discharges from sewage treatment works or industrial sites) and diffusesources (such as settlements without a sewage system) of pollution by discharges ofwaste or water containing waste into water resources. In addition, because of theirpotential to impact on surface and groundwater resources the Department is, in termsof Section 20 of the Environmental Conservation Act and by agreement with theDepartment of Environmental Affairs and Tourism, responsible for overseeing themanagement of sites where waste is disposed onto land.
Decisions about the nature and extent of resource pollution which can be permittedare guided by a hierarchical decision-making framework. This takes account of thebalance between the need to protect water resources for sustainable-use, and theneed to allow activities which support social and economic development to continue.
The highest priority in the decision-making framework is to prevent water pollutionthrough waste prevention and reduction, recovery, treatment and final safe disposal.It is however acknowledged that in many cases the discharge of pollutants into waterresources is unavoidable, and in these cases the emphasis is on minimising thepollution and its effect on the water resource. Where pollution has already causeddegradation of the water resource, or where contaminated land areas pose a threatto water quality, remediation will be effected where it is necessary and practical.
Each application for authorisation to discharge waste into a water resource ispreceded by an assessment of the probable impacts of the discharge on the waterresources and other water users. For hazardous wastes, the aim is to preventdischarge wherever possible or, if it is not possible, to minimise the extent of thedischarge and its impacts. For non-hazardous wastes, the receiving water qualityobjectives approach will continue to be used. The approach assumes that the waterenvironment has a definite and quantifiable capacity to assimilate non-hazardouswaste discharged into it without violating predetermined water quality objectives.Protection of the assimilative capacity, which will be different for each managementclass, must be equitably shared among all water users.
Wherever possible, best management practices, relating to the treatment andrecovery of waste, will be incorporated into licence conditions – source-directedcontrols – to prevent the water resource becoming polluted.
Whilst the overall intention is to prevent further degradation of the quality of thecountry’s water resource, and to effect improvements, where possible, limited andshort-term degradation of the water quality of a specific water resource could beallowed if it can be demonstrated with confidence that the degradation will not beirreversible, and that pollution costs are not externalised to other users of the waterresource.
There are a number of water quality problems in the Thukela WMA. The point-sourcepollution problems are well understood by the Regional Office while the non-pointpollution sources are less well understood. The issues in the WMA include thefollowing:
PartB.sxw Page 13 July 2004

THUKELA WATER MANAGEMENT AREA INTERNAL STRATEGIC PERSPECTIVE
Poor veld management and overgrazing, especially in the upper Thukela;
Groundwater pollution in the Colenso and Ladysmith area;
Sporadic non-compliance of effluent discharge do occur in Estcourt, Newcastleand Mandini;
Domestic discharge into Wakkerstroom vlei;
The discharge of effluent from the Sappi paper mill at Mandini has previouslynecessitated releases from Spioenkop Dam to dilute this effluent;
Releases from Ntshingwayo Dam have also been made to dilute industrial spills inthe Newcastle area;
High COD and suspended solids in the Lower Thukela;
The mining and industrial activities in the upper Buffalo catchment have resultedin degradation of the water resource from a quality perspective. However, minesin the Buffalo catchment are aiming for zero effluent discharge to remedy thesituation;
Closed mine decants in the Sundays and Buffalo catchments;
The Regional Office is running the mine rehabilitation programme, which hasbeen successful. Resources are the limiting constraints in terms of expediting theprogramme to ensure that all closed mines are rehabilitated;
Dense settlements with poor sanitation especially in the upper Buffalo catchmentresulting in high e. Coli counts;
Significant irrigation return flows in the upper Buffalo catchment;
New developments for the leisure industry in the Little Thukela catchment, and
Diffuse impacts in the Mooi River.
The Regional Office is under-resourced and therefore tend to be effective only inpollution control as opposed to water quality management.
The point pollution sources are well understood and well handled although the localauthorities do not always comply. However, they know what is expected of them andthe standards that must be achieved. The shortage of financial resources required tooperate, upgrade and maintain infrastructure is the major cause of non-compliance.
Strategy
A sound and reasonable balance between development impacts and the protection ofthe resource, both surface and groundwater, needs to be maintained.
Co-operation between DWAF’s Head Office, their Regional Office, provincial organsof state, the Thukela Water Partnership and local authorities regarding water qualitymonitoring and management needs to be improved.
PartB.sxw Page 14 July 2004
THUKELA WATER MANAGEMENT AREA INTERNAL STRATEGIC PERSPECTIVE
Strategycontinued
Co-operative Governance is required between the Regional Office and LocalAuthorities and Local Authorities must accept responsibility for the quality of effluentarising from state-owned infrastructure in their jurisdiction. A financial assistanceprogramme for local authorities is required for the operation, maintenance andupgrade of waste-water works.Diffuse pollution sources, from agricultural land anddense settlements, require assessment to quantify their impacts especially in theupper Thukela, Buffalo and Mooi River areas.
The closed mine rehabilitation programme should continue and required resourcesmade available to ensure that potential water quality problems are contained.
The Regional Office is doing well in managing point source pollution in the WMA andtheir efforts should be maintained and improved. However, the shortage of humanresources in the Regional Office may discredit these efforts if this shortage is noturgently addressed.
The water quality situation in the WMA should be continuously monitored andnecessary measures implemented to reduce negative impacts. Causes of problemsshould be understood for the effective design of solutions. The solutions may includepoverty eradication measures, land-care activities to reduce sedimentation andimproved sanitation.
Management actions Responsibility andpriority
The water quality situation in the WMA should be continuously monitored andnecessary measures implemented to reduce negative impacts. Causes ofproblems should be understood for the effective design of solutions. Thesolutions may include poverty eradication measures, land-care activities toreduce sedimentation and improved sanitation.
Diffuse pollution sources, from agricultural land and dense settlements,require assessment to quantify their impacts especially in the upper Thukela,Buffalo and Mooi River areas.
The closed mine rehabilitation programme should continue and requiredresources made available to ensure that potential water quality problems arecontained.
The Regional Office is doing well in managing point source pollution in theWMA and their efforts should be maintained and improved. However, theshortage of human resources in the Regional Office may discredit theseefforts if this shortage is not urgently addressed.
Co-operation between DWAF’s Head Office, their Regional Office, provincialorgans of state, the Thukela Water Partnership and local authoritiesregarding water quality monitoring and management needs to be improved.
Co-operative Governance is required between the Regional Office and LocalAuthorities and Local Authorities must accept responsibility for the quality ofeffluent arising from state-owned infrastructure in their jurisdiction. A financialassistance programme for local authorities is required for the operation,maintenance and upgrade of waste-water works.
Set up formal liaison meetings with provincial organs of state and the ThukelaWater Partnership to agree on the roles and responsibilities for water qualitymonitoring and intervention.
D: WDD & RO
Priorty: High
PartB.sxw Page 15 July 2004

THUKELA WATER MANAGEMENT AREA INTERNAL STRATEGIC PERSPECTIVE
Review water quality monitoring in the WMA and ensure that it is sufficient tomanage impacts of diffuse agricultural activities and dense settlements, andincorporate the findings into the Monitoring Strategy.
Progressively work towards customising the general authorisationsframework for catchment specific water quality related authorisations.
Develop an integrated water quality management plan for the catchment.
Sappi (Mandini) should be encouraged to develop a long-term wastemanagement strategy and plan. They should be monitored accordingly andheld accountable for variations.
The diffuse pollution sources, processes and impacts due to intensiveagriculture and land degradation in the Mooi River, Little Thukela and UpperThukela should be understood and monitored.
Appropriate role players should be identified and encouraged to develop acatchment management plan for the Drakensberg foothills to manage landdegradation.
Role players in the Sundays River catchment should be engaged to develop asanitation and solid waste management plan to deal with the human pollutionproblems in the more densely populated rural areas.
Role players in the Sundays and Buffalo River catchments should beengaged to develop a management plan to deal with the mine pollutionproblems, particularly at closure and during rehabilitation.
PartB.sxw Page 16 July 2004

THUKELA WATER MANAGEMENT AREA INTERNAL STRATEGIC PERSPECTIVE
3 WATER CONSERVATION AND DEMAND MANAGEMENT
3.1 WATER CONSERVATION AND DEMAND MANAGEMENT
Managementobjective
Ensure effective and efficient utilisation of the resource by the various water usesectors. This will help delay the need for compulsory licensing in the WMA anddevelopment of storage infrastructure.
Situationassessment/motivation
The principles of Water Conservation and Demand Management (WC&DM) areenshrined in the National Water Act. DWAF has developed a national waterconservation strategy and sectoral strategies.
In the Thukela WMA, irrigation is by far the largest water user. Based on the findingsof a WC&DM study undertaken in the Mhlatuze catchment, large potential watersavings can be achieved in the irrigation sector. Although the capital costs required toachieve this are significant, the cost per cubic metre of water saved would be thelowest. Installation of efficient irrigation systems and improved scheduling would savewater. The areas of high rainfall in the upper Thukela and those close to the coastwould benefit the most from improved scheduling. An investigation in the ThukelaWMA may be required to confirm or determine the potential savings from theirrigation sector.
The Thukela WMA is infested with invasive alien plants in the upper Thukela,Bushmans, Mooi, upper Buffalo and Sundays River catchments. The removal of thealien plants should be one of the WC&DM options.
The WMA does not have large towns and cities and is not heavily industrialised.However, the towns of Ladysmith, Newcastle, mines and Mandini /Isithebe industriescould achieve savings if they implement WC&DM measures.
The stressed catchments such as the Little Thukela and Sundays River can benefitfrom the implementation of WCDM. However, WC&DM can only be successful ifwater users co-operate. Benefits of WCDM initiatives should be communicated andsold to the users through local institutions serving the users.
StrategicApproach
The stressed catchments in the Thukela WMA should apply WC&DM to alleviate thisstress. DWAF should encourage WC&DM in stressed catchments as a priority. Thefocus should mainly be on irrigation in those parts of the Thukela WMA where deficitsare reported.
Engage and monitor water users to ensure that they utilise the existing availablewater resources in a more effective and efficient manner.
Improve on current knowledge of the extent and impact of invasive alien plants.
Effluent reuse is a possible WC&DM measure in the Thukela WMA. The reuse ofeffluent should be supported if the initiative comes from the water users, but it is notnecessary to actively pursue this option. This strategy will probably change once thecatchments experience more water stress.
Strategies of what to do with saved water and how to reward users who practiceWC&DM should be developed on an area by area basis, taking into cognisance thewater balance of the area.
The largest use of water derived within the WMA is transfers out of the WMA. Futurewater requirements should not be taken out of the WMA if WC&DM is notimplemented in the receiving catchments. Steps should be taken to limit transmissionlosses of transfers.
PartB.sxw Page 17 July 2004

THUKELA WATER MANAGEMENT AREA INTERNAL STRATEGIC PERSPECTIVE
Management actions Responsibility andpriority
The effect of WC&DM on projected water requirements and return flows mustbe undertaken with specific focus on the domestic, industrial and miningsectors.
A database and/or computer model will be required to monitor and updatedemand projections and to assess the success of WCDM initiatives.
Existing water uses should be monitored to ensure that wastage is minimised.
New licences should only be issued on receipt of an acceptable planindicating a reasonable level of water use efficiency.
Given the various interests in the Thukela Water resources, the roles andresponsibilities of implementing and regulating WCDM need to beestablished.
Ensure that the transfers from the Thukela are not increased before WC&DMhas been implemented in the areas using water from the WMA.
Undertake the necessary planning required to assess the impact of invasivealien invasive plants (and their removal) in the Upper Thukela, Bushmans,Mooi, upper Buffalo and Sundays River (Little Thukela and Upper Thukela toreceive priority).
D: WU
Priority: Medium
D: NWRP
RO
D:WU
PartB.sxw Page 18 July 2004
THUKELA WATER MANAGEMENT AREA INTERNAL STRATEGIC PERSPECTIVE
4 WATERWORKS DEVELOPMENT & MANAGEMENT
4.1 INFRASTRUCTURE DEVELOPMENT AND SYSTEM OPERATION
Managementobjective
Ensure provision of adequate infrastructure to support sustainable growth anddevelopment within the WMA and the requirement for transfer out of the WMA and tooptimise system operating rules to ensure that an equitable balance in the quantity andquality of water supplied is achieved and inefficiencies are minimised.
Situationassessment/motivation
The infrastructure in the WMA is described below per sub-area. The reader is alsoreferred to the Thukela River operating rules report produced for the ThukelaReserve Determination Study (DWAF, 2002d).
The Thukela-Vaal transfer scheme consists of Woodstock Dam, Driel Barrage,Jagersrust Balancing Dam and Kilburn Dam.
Woodstock Dam is located 7 km upstream of the Driel Barrage. It is used toregulate storage for the Driel Barrage from where water is transferred to the VaalRiver catchment via Eskom’s Drakensberg Pumped Storage Scheme. WoodstockDam has two sluice gates, each with a maximum release capacity of 200 m3/s. Thenet storage capacity of the dam is 373 million m3.
In order to transfer water to the Vaal River Catchment, water is pumped from theDriel Barrage to the start of a trapezoidal canal, from where it gravitates to theJagersrust Balancing Dam before it is pumped to Kilburn Dam and from there overthe escarpment to Sterkfontein Dam. The trapezoidal canal has an approximatemaximum capacity of 20 m3/s. The entire canal has recently been refurbished andis in a very good condition. The net storage capacity of Driel Barrage is 8.7 millionm3. Currently only 6 m3/s is being transferred from Driel Barrage to JagersrustBalancing Dam. This reduced transfer is due to the implementation of the LesothoHighlands Project and the reduced demand projections in the Vaal RiverCatchment. However, the full transfer capacity can be utilised at any time if theneed arises.
Kilburn Dam is the lower reservoir in the Eskom pumped storage scheme. It hasan active storage capacity of 27 million m3.
Spioenkop Dam, built in 1973, is currently under-utilised and has a capacity of 280million m3. The dam was built to regulate flow downstream of the Driel Barrage.The dam also supplies water to Ladysmith and supports water requirements fordownstream farmers mainly between the dam and Winterton. Occasionallyreleases are made from Spioenkop Dam to dilute poor quality effluent release bySAPPI (at Mandini) into the lower Thukela River. However, SAPPI do not have anallocation from the Spioenkop Dam. There are also direct abstractions from thedam for irrigation. A licence for further transfers out of the lower Thukela (inaddition to the transfer to the Mhlathuze WMA) has been issued and this willrequire intermittent support from Spioenkop Dam.
The proposed Jana Dam, which is part of the Thukela Water Project, is on theThukela River. Water will be pumped from Jana Dam to Kilburn Dam for transfer tothe Vaal catchment via Eskom’s existing pumped-storage scheme. It is importantthat the optimal long-term benefits be derived from the development of the ThukelaRiver, and that both the national and local interests be appropriately addressed.
PartB.sxw Page 19 July 2004
THUKELA WATER MANAGEMENT AREA INTERNAL STRATEGIC PERSPECTIVE
Strategy
The Wagendrift Dam on the Bushmans River was built in 1963 to supply irrigation ofapproximately 3 000 ha situated between the dam and the Thukela River. The damhas a full supply capacity of 56 million m3. The dam releases 2 m3/s for environmentaland irrigation requirements if the dam is not spilling. The Weenen Water UserAssociation oversees the irrigation schemes in the area and as a result makesrequests for more water at times.
Craigieburn Dam was completed in 1963 and has a capacity of 23.5 million m3. Thedam is on the Mnyamvubu River, a tributary of the Mooi River, 30 km west ofGreytown. The dam regulates water supplies for the irrigation of approximately 2000ha, dominated by citrus farming along the Mooi River. The dam releases 0.3 m3/s fordownstream irrigation requirements. Additional water is released for farmers on theMooi River on request. The dam can release a maximum of 4 m3/s.
Ntshingwayo Dam (previously known as Chelmsford) was completed in 1961 andraised in 1982. It has a capacity of 199 million m3. The dam was built to provide anassured supply of water to the town of Newcastle, Eskom’s thermal power station andirrigation farmers downstream. Releases are sometimes made to dilute factoryspillages that end up in the river system.
Zaaihoek Dam was built in 1988 with a capacity of 193 million m3. The dam issituated on the Slang River, a tributary of the Buffalo River, and is used to transferwater to the eastern Vaal system in general and specifically to the Majuba PowerStation. Zaaihoek Dam also supplies limited demands downstream of the dam byreleasing water into the Slang River.
Development of water resource infrastructure for in-basin requirements is likely tocomprise the construction of farm dams especially in stressed catchments, asdiscussed in the allocation strategy.
The WRYM has been configured for the Thukela system to provide support forinfrastructure planning and the Reserve determination. The model could also beused for ongoing operational purposes.
The efficiencies of the transfers made to outside the WMA and releases made fromin-basin dams for downstream use are not well understood.
The site of the proposed Mielietuin Dam, which is part of the Thukela Water Project,is situated on the Bushmans River near Estcourt. The proposal is to pump water intothe existing Drakensberg Transfer Scheme infrastructure in the upper Thukela fortransfer into the Vaal catchment.
A water transfer scheme exists on the Mooi River at Mearns which can transfer up to3.2 m3/s to the Mgeni River System. Recently a large weir was constructed at Mearnsto provide balancing storage. A new dam, referred to as the Spring Grove Dam, isproposed on the Mooi River upstream of the Mearns weir. This dam, together withincreased transfer capacity, will increase the transfer of water into the Mgeni River byup to 4.5 m3/s. Latest estimates indicate that the Spring Grove Dam is required by2007. Construction of this dam is therefore imminent.
Optimise system operating rules to ensure that an equitable balance in the quantityand quality of water supplied is achieved, inefficiencies are minimised, droughtoperating rules are determined and that agreed assurances of supply are adhered to.The developed system should also be used to determine impacts and yield ofproposed farm dams which will assist with licence applications.
PartB.sxw Page 20 July 2004

THUKELA WATER MANAGEMENT AREA INTERNAL STRATEGIC PERSPECTIVE
Transfers out of the WMA are managed by DWAF Head Office. There is a need toensure that future plans for transferring water to the Vaal catchment are wellcommunicated to the KZN provincial government in particular and the rest of thestakeholders to avoid unnecessary negative perceptions. There will also be a need tounderstand the system and transfer efficiencies when communicating the proposedplans.
The development of major water resources infrastructure in the Thukela hasbeen reserved for transfers into the Vaal catchment. The proposed majorwater resources infrastructure will and should accommodate the projectedneeds of the KZN stakeholders, including the Reserve. The need and timingof the development should consider these needs of the WMA.
Management actions Responsibility andpriority
The efficiencies of the releases for downstream use and transfers outof the WMA need to be assessed and measures put in place tominimise losses and improve efficiencies.
D: NWRP
Priority: HighUndertake systems analyses periodically to update the infrastructuredevelopment programme.
D: OA
Priority: MediumProvide regular updates of the proposed development plans to theKZN provincial government and Thukela WMA stakeholders
Regional Office
Priority: Medium
PartB.sxw Page 21 July 2004
THUKELA WATER MANAGEMENT AREA INTERNAL STRATEGIC PERSPECTIVE
5 MONITORING & INFORMATION MANAGEMENT
5.1 MONITORING NETWORKS
Managementobjective
To design and implement an effective monitoring network (quality and quantity) andinformation management systems to ensure effective and efficient management ofthe water resources. South Africa no longer has water to spare and many catchments are now stressed,with more water allocated to users than is reliably available. There is intense andgrowing competition for water. The true cost of supply and value of water as aresource is now being recognized, and users are starting to pay more realistic, ratherthan nominal charges. There are considerable inequities in the way water has beenallocated in the past both in terms of people and the environment, requiring thatsome reallocation will have to take place.
In order to licence, allocate and manage this increasingly scarce and increasinglyvaluable resource requires reliable data on volumes available and volumes used.This demands accurate monitoring of rainfall, streamflow and water use. The raingauging and streamflow monitoring networks in most catchments are inadequate forthe accurate estimation of resource availability and use. This strategy is required toensure that systems are put in place at National, Water Management Area, andcatchment level to allow for the effective and efficient management of the resource.
Monitoring is an activity usually undertaken by the institution most requiring theinformation. With different institutions requiring a lot of varied information, a lot ofinefficiency and duplication of effort results. This also results in a wide range of datagathered, different standards, and often inaccessibility to other interested parties.Information needs to be correctly processed, brought to a widely acceptablestandard, and stored within databases which provide security to the owner but whichcan also be shared both in terms of input and access.
The importance of accurate information for management has been stressed in theNational Water Resource Strategy. It is apparent from the NWRS that both Nationaland Departmental monitoring systems are spatially inadequate and often operatelargely in isolation of each other. Whilst the Department is actively working tostructure its systems into a single ‘Monitoring, Assessment and Information System’(MAIS) it is clear that this strategy will need to address networks and funding, staffcapacity, and co-operative relationships with other organizations. This strategy willalso need to ensure that all activities are compatible with the national informationsystem.
Monitoring the water resource
Monitoring, for the purposes of this strategy, applies to all aspects of the waterresource, particularly:
Hydrology - rainfall, climate, and streamflow
Geohydrology – groundwater
Inflows and outflows (transfers)
Abstraction (water users and dam uses, dam levels, operational releases, lossesetc)
PartB.sxw Page 22 July 2004

THUKELA WATER MANAGEMENT AREA INTERNAL STRATEGIC PERSPECTIVE
Situationassessment/motivation
• Sedimentation.
Supporting information includes:
Small farm dams (numbers, capacity, use) – this will also require monitoring
Water Quality (surface water, groundwater)
Waste water outflows
River Health (function and impact of the ecological Reserve)
Land use change (agricultural cropping, forestry, alien invasives) – data availablefrom other sources, but this needs monitoring
Return flows.
The situation in the WMA is captured in the following points, which also highlights thegaps.
There is no groundwater monitoring in the WMA. Groundwater monitoring is veryexpensive and resources are limited. There is a great potential for groundwater usein the Thukela WMA for rural water supply and accurate information is required.Groundwater could also be used in the stressed catchments of the Little Thukela andSundays River to alleviate stress.
Streamflow monitoring is undertaken on the major rivers of the WMA. However, theaccuracy and reliability of the gauges is often not adequate.
Water levels in all of DWAF‘s dams are monitored as are the releases from thedams.
There is no biomonitoring or river health monitoring programme in the WMA.
Rainfall gauging is undertaken throughout the WMA and is considered to be mostlyadequate. The ease of acquisition of rainfall data is reasonable from all monitoringinstitutions.
Local Municipalities monitor the quality and quantity of effluent discharges from theirsewage treatment plants, with DWAF responsible for compliance monitoring.
1. The pollution potential of abandoned mines, which are not yet on the rehabilitationprogramme are not monitored.
There is a lack of understanding of the impacts of diffuse pollution sources from theagricultural sector in the WMA. Problems often occur downstream of these areasand the exact source cannot be pinpointed. This is the case in the upper Mooi River.
Monitoring of the estuary and wetlands is insufficient.
There are a large number of farm dams in the WMA, especially in the Mooi Rivercatchment. The capacities of many of the farm dams, especially the smaller ones,have never been determined.
PartB.sxw Page 23 July 2004

THUKELA WATER MANAGEMENT AREA INTERNAL STRATEGIC PERSPECTIVE
Strategy
The Department of Water Affairs and Forestry needs a strategy to:
- Improve monitoring networks so that the resource can be accurately quantifiedfor allocations and management accounting purposes
- Improve on efficiencies in the gathering of information, particularly throughinstitutional co-operation in data capture and management
- Set and maintain standards for the capture, processing and management ofinformation
- Ensure that data is accessible to stakeholders without compromising datasecurity.
Key elements of the strategy:
- To motivate nationally regarding the importance of monitoring and the essentialneed for better networks at national, WMA, and catchment level. The strategy isto ensure that those institutions responsible for the allocation of funding fullyunderstand that to allocate, manage and sell the water resource means that localmanagers need to know what and how much they have to allocate, manage andsell.
- Co-ordination and co-operation across agencies at a regional level.
- Organisational co-operation and efficiency. As an organisation the Departmentcan only operate at optimum efficiency through close co-operation and sharing ofrelevant data capture and information management with its partners.
- Assessment of information requirements (surface water, groundwater etc) at thescale of decisions (WMA and at catchment scale).
- Meetings and negotiations with co-operating partners. Assess what informationhas been gathered, how it is processed and stored. Develop a plan for thesharing of mutually useful information.
- Together with co-operating partners develop a set of principles which outline thebasis for monitoring and information capture. Typically these could cover:accuracy, completeness, time scales and time frames, information sharing.
- Prepare a set of standards for data capture and the processing of information.
- Design a monitoring system to meet needs. This design should offer phasedimplementation, based on priorities. Priorities should be broken down to criticalmonitoring points within specific fields of concern, so that the most urgent areascan be attended to first. Apply the cost: benefit principle.
- Motivate and seek funding to meet requirements.
- Develop and train staff.
- At regional level the implementation of this monitoring strategy will be tasked toa small team drawn from across the traditional hydrological disciplines in theregion.
PartB.sxw Page 24 July 2004
THUKELA WATER MANAGEMENT AREA INTERNAL STRATEGIC PERSPECTIVE
Management actions Responsibility andpriority
Initiate assessment to establish the detailed status quo of water resourcemonitoring in the WMA, design and implement a monitoring system to meetthe needs of the WMA and national requirements.
Regional Office
Priority: HighDevelop a collaborative and co-operative relationship between DWAF andother organizations, as well as individuals that have monitoring networks, anddevelop a consolidated monitoring and information management strategy.
D: NWRP, RegionalOffice
Priority: MediumSecure funding and prioritize implementation. D: NWRP
Priority: High
PartB.sxw Page 25 July 2004

THUKELA WATER MANAGEMENT AREA INTERNAL STRATEGIC PERSPECTIVE
6 INSTITUTIONAL DEVELOPMENT & SUPPORT
6.1 INSTITUTIONAL SUPPORT
Managementobjective
2. To form a CMA for the Thukela WMA in line with the requirements of the NWA andNWRS, and to provide a dynamic institution to effectively and efficiently deal withIntegrated Water Resource Management issues in the WMA.
Situationassessment/motivation
CMAs are statutory bodies with jurisdiction in a defined WMA whose functions andresponsibilities include:
3. - development of a CMS, which may not be in conflict with the NWRS whilegiving effect to its provisions and requirements
- management of water resources, and co-ordination of water related activities ofwater users and other water management institutions within WMAs.
4. The institutional environment is complex. Not only is there a large range of institutionsinvolved but there also continues to be very significant changes in the institutionallandscape. Nowhere is this more evident than at local government level. A majordemarcation process has just been completed which has resulted in significantchanges in boundaries and in the establishment of a number of completely newinstitutions. This will create significant challenges but also opportunities. Althoughmany of the institutions are not without their problems, the number and range couldalso be a positive factor. In this regard, the existing Water User Associations(Irrigation Boards) and Catchment Management Fora can also play a role.
The presence of suitable institutions is extremely important as it relates directly to thecapacity within the area to address catchment management in a meaningful way. Theproposed CMA will inevitably need this capacity to ensure that it can execute thechallenges and activities that it will be facing. In addition, the nature of the CMAmodel relies implicitly on a co-operative and collaborative approach so the capacity ofthe various potential partner institutions is of considerable interest. The institutions inthe WMA lack capacity in water resources management aspects, and others arerelatively too new to deal with integrated water resource management issues. It isalso of note that there does appear to be a broad consensus around the philosophyof catchment management, even though there is some concern with respect to theprecise role and functions of the new institution.
The final draft of the proposal for the Thukela Catchment Management Agency(CMA) has been submitted to DWAF and is under review. The salientrecommendations in the proposal are :
An annual operating budget of some R 30 million will be required (current Randterms);
The main income sources would be the DWAF under-development subsidy (R 18million), transfers out (R 5.5 million), the DWAF trading account (R 3.5 million), theirrigation sector (R 0.3 million increasing to R 2.2 million), urban and industrial sector(R1 million increasing to R 2 million) and seed funding from DWAF (R 5 millionreducing to zero);
A staff compliment that is expected to grow from about 40 to over 100 (it is likely thata core staff complement will be retained and much work will be outsourced); and
PartB.sxw Page 26 July 2004

THUKELA WATER MANAGEMENT AREA INTERNAL STRATEGIC PERSPECTIVE
Strategy
The programme for implementation is that approval is expected later in 2003, initialestablishment will be completed by 2005 and the CMA will be fully resourced by2013.The water resources management issues and strategies for the Thukela WMAwill change and evolve over time. The support to the WMA stakeholders will best beserved by a CMA. The reconciliation of water requirements, sources for projectedwater requirements for towns and villages, resource-poor farmers and other issues,which may not be critical at the moment, will be dealt with by or through therepresentative CMA.
Institutional support measures need to be considered for the CMA. The RegionalOffice, which is the current de facto CMA needs to prepare for gradual hand-over ofresponsibility to the CMA.
Provision of current and projected water requirements to major urban and industrialareas within the Thukela WMA is not a constraint due to available resources andcurrent infrastructure. The CMA will have to strive to maintain this balance.
The Regional Office has to facilitate the formation of Water User Associations andensure that they operate within the requirements of the National Water Act. Of criticalimportance is that the WUAs are representative of their users.
Management actions Responsibility andpriority
Proceed with the formation of the Thukela WMA R Office
Priority: HighDevelop gradual delegation of authorities to the CMA R Office
Priority: HighPromote appropriate racial, gender and community representation onadvisory committees, Forums, Water User Association and governing Boardof the CMA
R Office
Priority: High
PartB.sxw Page 27 July 2004

THUKELA WATER MANAGEMENT AREA INTERNAL STRATEGIC PERSPECTIVE
7 INTEGRATION AND CO-OPERATIVE GOVERNANCE
7.1 INTEGRATION AND CO-OPERATIVE GOVERNANCE
Managementobjective
Contribute to poverty eradication and redressing of water allocation inequities in theThukela WMA. Poverty eradication and inequity redress have been identified by theSouth African government as a priority and it has urged all organs of state to addressthese in a co-ordinated manner.
Situationassessment/motivation
This strategy deals mainly with the creation of the environment for implementation ofpoverty and inequity redress initiatives. Actions and area-specific measures forpoverty alleviation are dealt with under the allocation strategy.
The Thukela WMA is one of the most impoverished in South Africa, with all Districts’average income being below the national average. “In terms of a composite povertyindex, the Msinga District is the most impoverished in the whole country” (CMAproposal document for the Thukela WMA). There are also significant disparitieswithin the WMA in terms of income, education and access to services, as is commonin many parts of South Africa. Most of the population is located in rural areas. Themost impoverished areas are generally situated in rural parts of the WMA but certainperi-urban areas also have significant problems. The National Water Act dictates thataddressing past inequities must be a primary consideration of the CMAs. In addition,it is relevant to note that the areas in question are often the most vulnerable withrespect to water quality problems, the most susceptible to flooding, the least wellendowed with safe sanitation (resulting in severe faecal pollution) and the mostsusceptible to poor agricultural practices. All of these facts emphasize the importanceof these communities being represented on appropriate structures and also being thefocus of significant upliftment and capacity building efforts.
Local and regional authorities are very active in trying to stimulate the local economy.Significant advances have been made in supplying infrastructure in recent years,which indicates that increased water requirements for basic human needs will nothave a significant impact on the resource.
Agro-processing has received attention but initiatives remain elusive. Small, Mediumand Micro Enterprise development has also been promoted with very little success.The basic problem seems to hinge around the skills and knowledge base required toget things moving.
With this in view, integrated development plans in the Thukela catchment focusmainly on the eradication of poverty, HIV/AIDS and skills development.
Water use authorisations and licences issued to date in the Thukela WMA for in-basin requirements have not been to the previously disadvantaged individuals andcommunities. The policy for water allocation in the WMA is hence to allocate orreserve available water to redress inequities as a priority, following the Reserverequirements.
PartB.sxw Page 28 First Draft report – April 2004

THUKELA WATER MANAGEMENT AREA INTERNAL STRATEGIC PERSPECTIVE
The Department is co-operating with other departments to ensure that themanagement of water resources can contribute to the Integrated Rural DevelopmentProgramme and the Urban Renewal Strategy, with particular emphasis oninterventions to eradicate poverty. One such co-operation has been the drafting ofthe National guidelines for integrated management of agricultural water use by theDepartment of Agriculture. The thrust of the guidelines is captured in the followingquote by the Minister of Agriculture and Land Affairs, Ms Thoko Didiza:
“Through protracted and deliberate investment in the mainstreaming of themarginalised agricultural water users, we believe that the "Fruits of our Water" will bestrong, well-nourished children, confident and profitable farmers, and significantgrowth in our rural economies. This growth will be supported through reliable andaffordable agricultural service provision by SMMEs and strong links with national andinternational markets.”
The guidelines purport a two-fold, stepped objective for the revitalisation of theagricultural water-use sector:
- improved food security through own production (‘food first’), and;
- mainstreaming historically disadvantaged farmers in the local, national andinternational economy through active support for business and marketdevelopment.
DWAF is further exploring its role in building capacity for productive water usethrough the DFID funded water and Forestry Support Programme.
Strategy
The key strategy relating to co-operative governance is to develop streamlinedmechanisms for co-ordination of effort. These mechanisms must contribute to theshift towards local government (District Councils) as the point of delivery. Co-ordination is to be focused on the following:
1. Financial support mechanisms at interdepartmental, departmental, community,project and production levels;
2. Institutions and representation at all levels, encompassing both governmentaland civil society stakeholders; and staffing, capacity building and training.
A fresh view of the socio-economic factors affecting the water use by the rural poor isneeded. The Department has initiated a cultural assessment to look at this issue in thecountry and the findings could be tested in the Thukela WMA due to its water availabilityand potential to stimulate the economic development in the WMA rural communities. Theidentification of communal land alone without assessing socio-economic drivers will nothelp stimulate productive water use. However, it should direct the stakeholders to areas ofpotential beneficiaries.
The information on the availability of water in the WMA should be proactively provided toother government Departments and agencies involved in servicing the needs of the WMA.This could be achieved through the use of the Co-ordinating Committees for AgriculturalWater Use (CCAW), WUAs, provincial water liaison committee, IDPs and WSDPprocesses.
Funding requirements for poverty initiatives and inequity redress should beintegrated. A wide range of support initiatives exist within the various linedepartments which enable funding to be released for various purposes that arebroadly developmental and targeted at resource-poor agriculture. These include:
PartB.sxw Page 29 First Draft report – April 2004

THUKELA WATER MANAGEMENT AREA INTERNAL STRATEGIC PERSPECTIVE
• Infrastructure and agricultural input support of R200 to R3 000 per householdadministered through the Special Programme for Food Security, administered bythe Department of Agriculture;
• A sliding-scale farm establishment subsidy offering between R20 000 andR100 000 as the beneficiary’s own contribution increases, as a start-up grant forfarmers provided with land under the land restitution for agricultural development(LRAD) programme, or farmers wishing to directly purchase land. This programmeis administered by DLA;
• Capital subsidies for bulk water supply development by Water User Associationsof up to R10 000 per hectare to a maximum of R50 000 per farmer, administeredby DWAF;
• Individual irrigation equipment subsidies under the Irrigation Improvement Schemeof up to R7 500, administered by the PDAs;
• Support for the development of Community Production Centers (CPCs) under theCommunity Based Public Works Programme, administered by PWD; and
Support (both training and finance) for small, medium and micro enterprisedevelopment from the Department of Trade and Industry.
The Department should consider advertising, through appropriate means, whereareas with excess water are situated and call for resource poor farmers, previouslydisadvantaged individuals, institutions involved in poverty eradication initiatives toapply for water allocations.
Management actions Responsibility andpriority
Co-operate with other departments involved in poverty alleviation and inequityredress, and proactively provide them with water availability information fordifferent areas to influence development in the appropriate areas.
R Office
Priority: HighDevelop capacity building programmes for individuals, communities andWUAs for productive use of water.
D: WU
Priority: HighProactively advertise areas and quantities of water available suitable forpoverty and inequity redress initiatives.
R Office
Priority: High
PartB.sxw Page 30 First Draft report – April 2004

THUKELA WATER MANAGEMENT AREA INTERNAL STRATEGIC PERSPECTIVE
8 IMPLEMENTATION
8.1 IMPLEMENTATION
Managementobjective
To ensure that the approaches put forward by the Department through this ISP areadopted and implemented in the Thukela WMA. This will require willpower, fundingand capacity.
SituationAssessment
The ISP is an internal document developed by the Department of Water Affairs andForestry. The ISP sets out the approaches which the Department is taking towardswater management in the Thukela WMA – and lists suggested actions towardsachieving good management of the water resources.
The wider public has had no direct input into the writing of this ISP – yet it isrecognised that the approaches suggested have a significant impact on the peopleof the Thukela WMA. Whilst the approach to date in developing this ISP may seemnon-participatory, it must be remembered that this is not a Catchment ManagementStrategy – but DWAF setting out how it sees the situation, and the steps which itviews as most appropriate in dealing with that situation. Interactions with the publichave been an important influence in developing the approaches adopted.
This ISP is not a closed document but is to be made available to the wider public forcomment and input. This makes the ISP an inherently transparent document –opening out the thinking and planning of the Department. Although DWAF makesno commitment to adopt every comment made, these will be taken seriously and theISP will be updated and improved as newer and better perspectives are formed.Once the CMA has been established it will be required to develop a CMS, and thiswill require full public participation. It is to be hoped that the ISP will be taken asuseful baseline information and, indeed, that the approaches adopted here are foundto be acceptable to, and adaptable by, the new dispensation.
Strategy
ISPs for each WMA are guided by the NWRS – and decisions affecting nationalresource distribution and use, as presented in the NWRS, are binding on each ISP.This ISP does, however, make a number of corrections and improvements whichserve as knowledge updates to the NWRS, particularly as regards catchment waterbalances and the availability of water for purposes of allocation. The ISP is signedoff by the Manager: NWRP and approved by the Department’s Water ResourcesFunctional Management Committee. It is also published on the Departmentalwebsite. It therefore has the status of an official document containing current bestavailable knowledge with regard to water resource use and availability.
The ISP should be updated as and when new information becomes available and willserve as the primary source document for decision-making, within the frameworkprovided by the NWRS.
The implementation of the ISP is an enormous task and will have to be tackled in astepwise fashion. Much of what is in this document describes the day-to-dayfunctions of the Department – but there are many new tasks, functions, and actionsset out in response to DWAF’s visions for the future.
PartB.sxw Page 31 First Draft report – April 2004

THUKELA WATER MANAGEMENT AREA INTERNAL STRATEGIC PERSPECTIVE
Strategy
It is recognised that it is quite impossible to immediately launch into, and achieve, allthat is required by this ISP. Funds and capacity are real constraints. The approachis to take the ISP and to use it as instruction, guidance, and motivation in thedevelopment of yet clearer management and action plans. These must be built intoDepartmental Business Plans, and budgeted for as part of Departmental operatingcosts. This will necessarily be in a phased manner as dictated by availableresources, but it is important that the ISP be used to leverage maximum funds,maximum capacity, and to bring optimum management to the WMA.
The position with regard to the ‘Authority of Information Contained in the ISP’ isfurther set out in Para. 1.3.4 of Chapter 1 of this ISP document.
Management actions Responsibility andpriority
Publish the ISP to be accessible for public input and comment (considerhard-copy and web-based options). Copies will be presented to keystakeholders on request. It is not the intention to have a major drive forpublic input, but merely to create opportunity for input.
Develop material which help to take the ISP to Provincial, District and LocalGovernment authorities. Also to support the Water Services DevelopmentPlan, organised agriculture, emerging farmers, and others. Material shouldbe useful in preparation of the Provincial Growth and Development Strategyand other regional and provincial planning activities.
There are many actions in the ISP which do require public involvement – andit is important that the thinking with regard to, for example, the use ofgroundwater, and the importance of WC&DM, is delivered forcefully to localauthorities, other direct water users such as agriculture, and the wider public.
Collate and consider all comment in revising and improving the ISP.
The ISP should be open to continuous improvement, with updating on aregular basis.
All Regional Office water resource management staff, Working for Water,local and district Municipalities, and other major stakeholders should haveaccess to, or copies of, the ISP.
Approaches set out in the ISP need to be accepted and adopted by bothnational and regional staff. Where there is resistance to ideas then thisneeds to be resolved in an open climate of debate and understanding.Modification of the ISP is not ruled out.
The practicalities of implementation demands must always be considered.
Most actions in this ISP have been assigned to the Region. It is criticallyimportant that the tasks outlined are prioritised, budgeted for, and built intoregional and national business plans and budgets.
Regional Office.
(The implementation isto be ongoing until theThukela CMA isestablished and theISP is superceded by aCMS)
Priority: Very High
PartB.sxw Page 32 First Draft report – April 2004

FIGURES
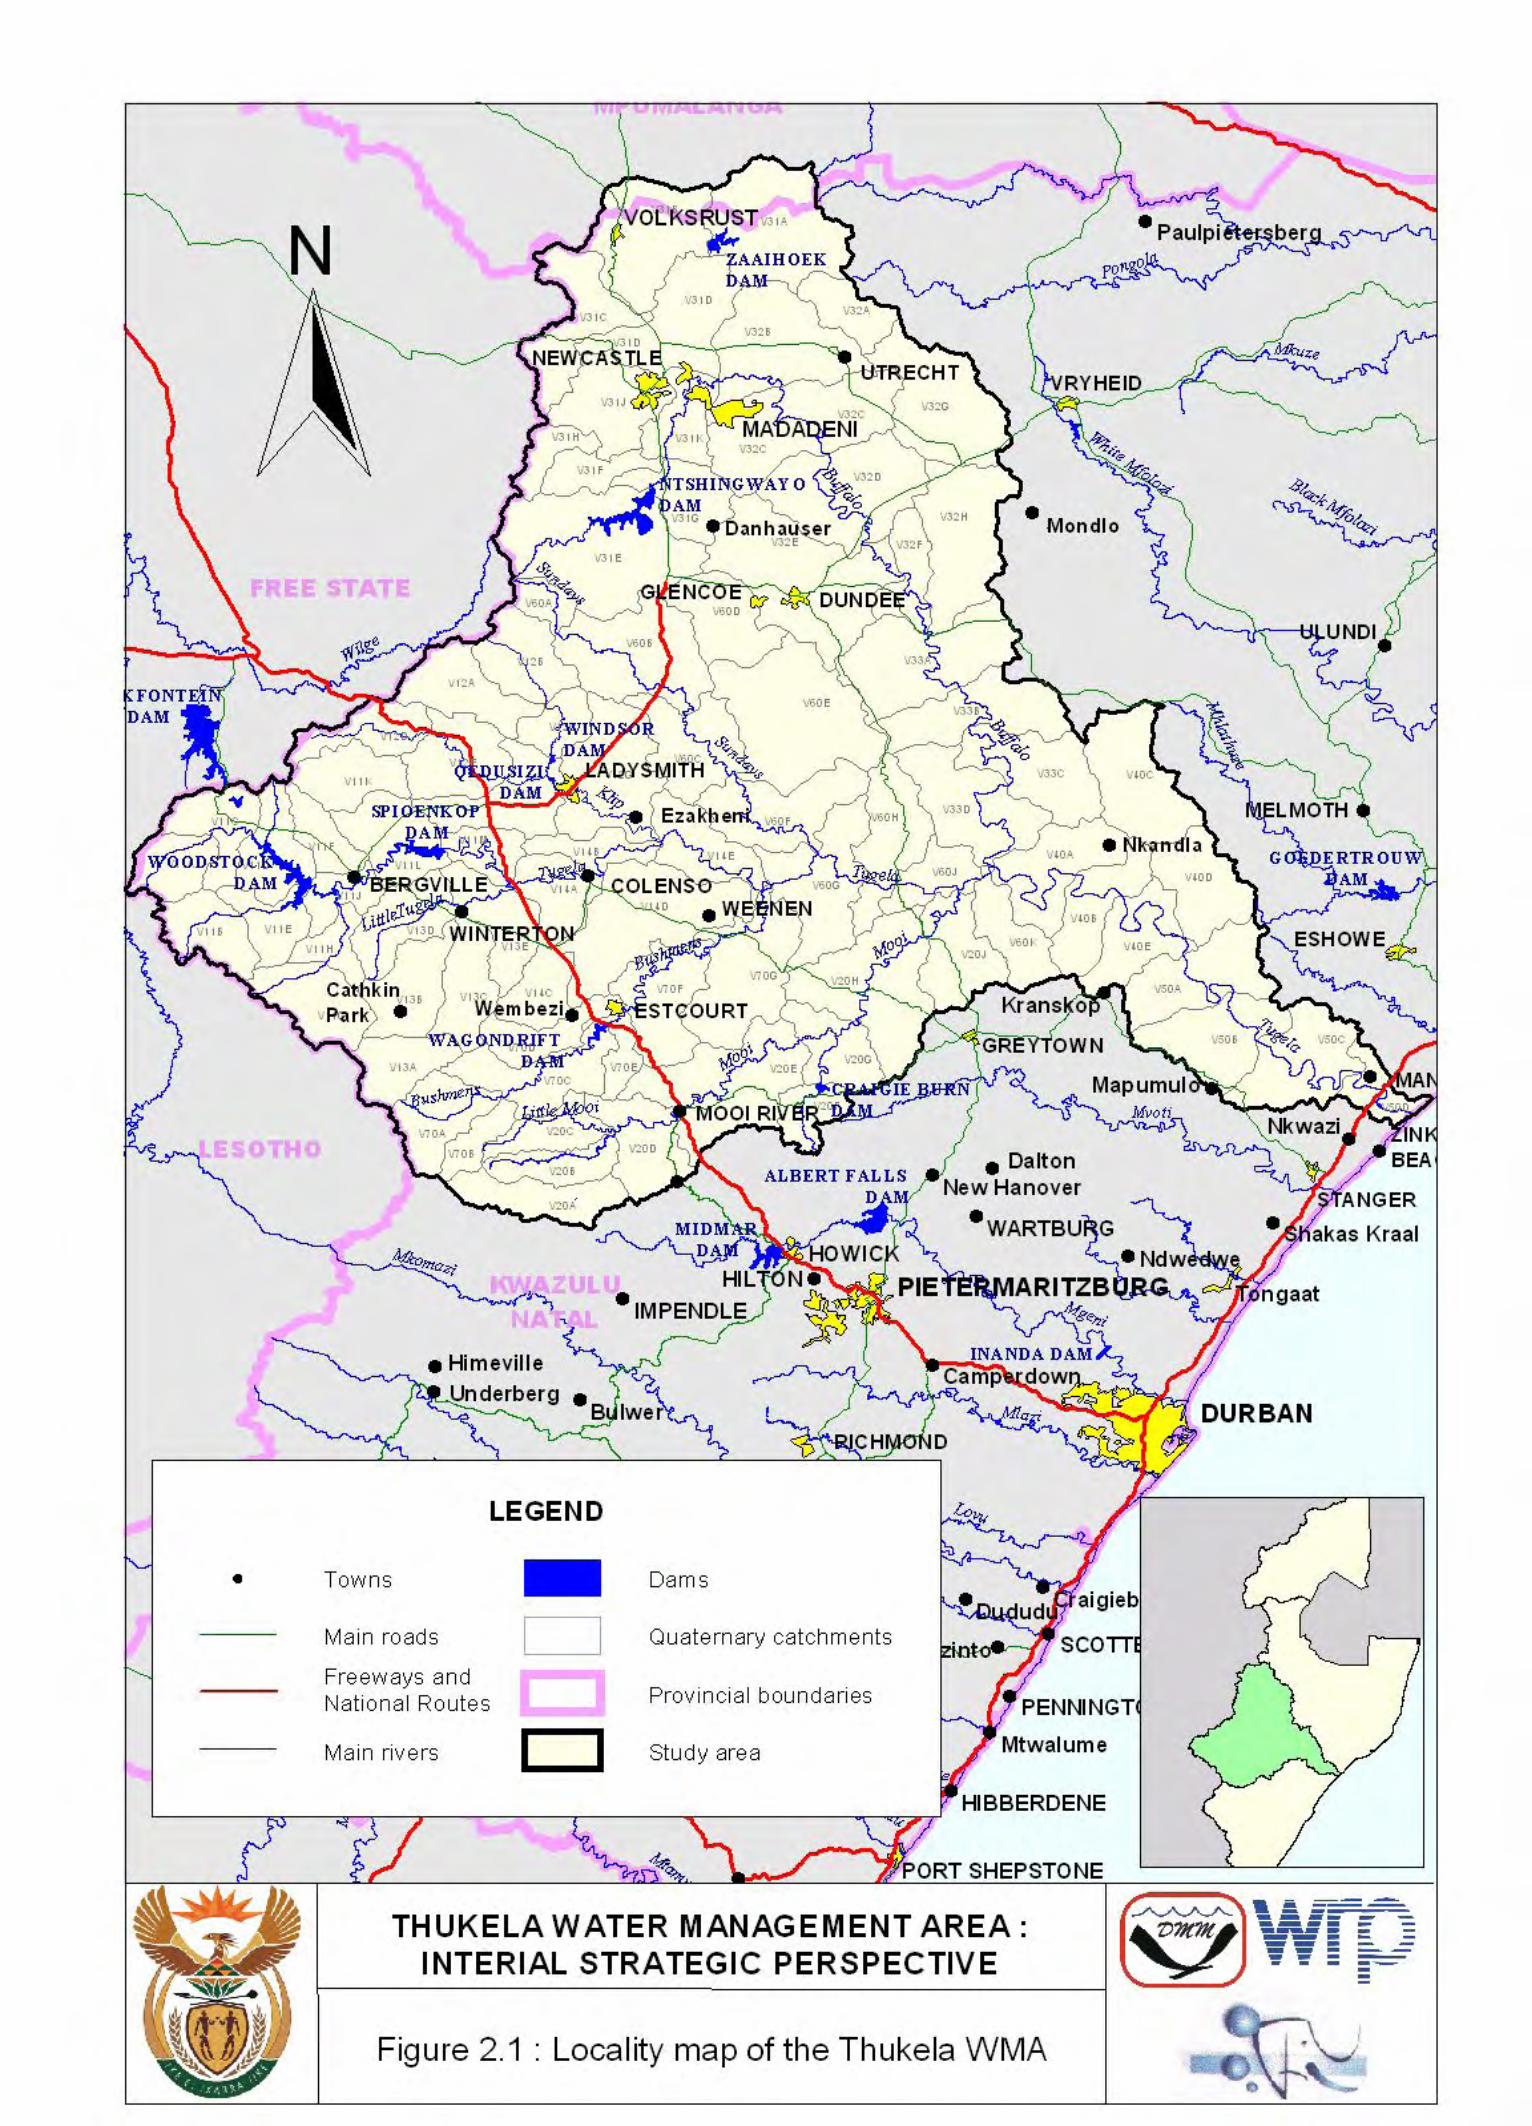


ANNEXURES ANNEXURE A: SUMMARY OF PREVIOUS WATER RESOURCE PLANNING
STUDIES ANNEXURE B: REGISTERED DAMS IN THE THUKELA WMA

THUKELA WATER MANAGEMENT AREA INTERNAL STRATEGIC PERSPECTIVE
ANNEXURE A : SUMMARY OF PREVIOUS WATER RESOURCE PLANNINGSTUDIES
1. LIST OF STUDIES............................................................................................................................. 12. OVERVIEW OF STUDIES UNDERTAKEN.................................................................................. 4
2.1 VAAL AUGMENTATION PLANNING STUDY : TUGELA-VAAL TRANSFER SCHEME - RECONNAISSANCE PHASE...... 42.1.1 Base conditions........................................................................................................................ 42.1.2 Water Requirements.................................................................................................................52.1.3 Water Resources...................................................................................................................... 52.1.4 Water Quality...........................................................................................................................52.1.5 Environmental Aspects.............................................................................................................82.1.6 Development Options at Reconnaissance Level...................................................................... 82.1.7 Economic Analysis at Reconnaissance Level.......................................................................... 8
2.2 VAAL AUGMENTATION PLANNING STUDY : TUGELA-VAAL TRANSFER SCHEME : PRE-FEASIBILITY PHASE........8 2.3 VAAL AUGMENTATION PLANNING STUDY : TUGELA-VAAL TRANSFER SCHEME : INTERIM PHASE..................92.4 THUKELA WATER PROJECT: FEASIBILITY PHASE.......................................................................................92.5 OTHER RELEVANT WATER RESOURCE RELATED PLANNING STUDIES...........................................................9
ANNEXURE A.SXW PAGE D- FIRST DRAFT – AUGUST 2003
1
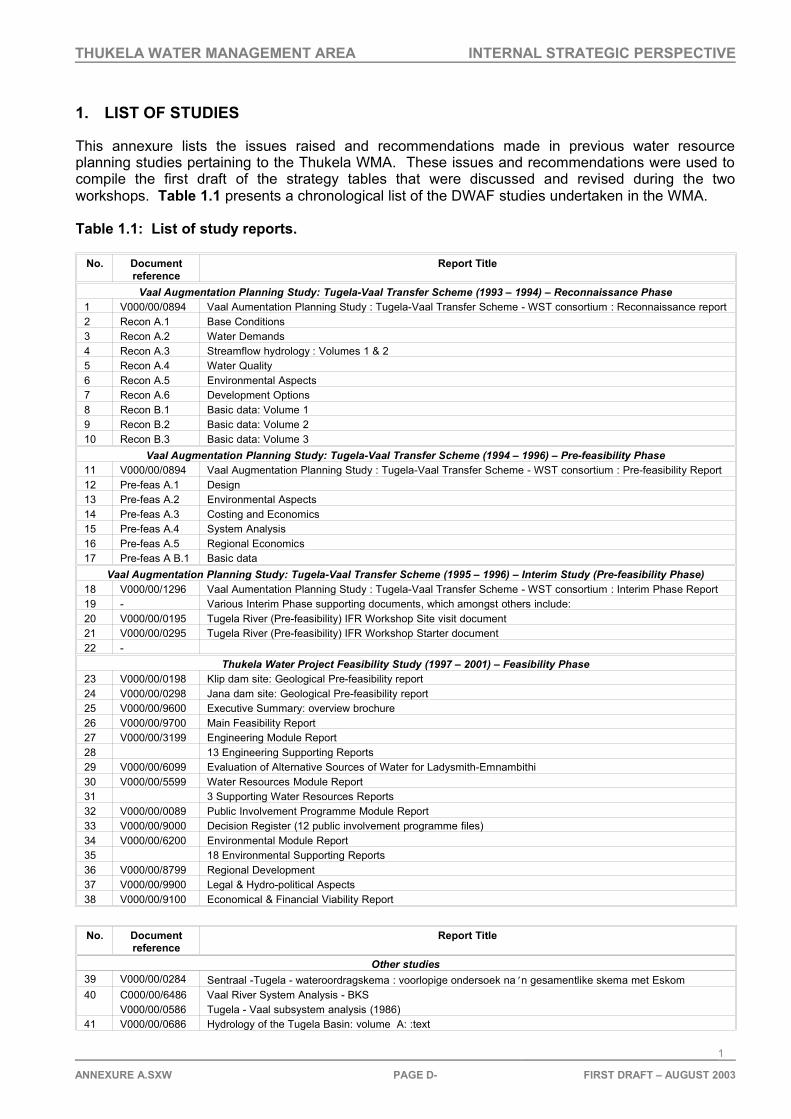
THUKELA WATER MANAGEMENT AREA INTERNAL STRATEGIC PERSPECTIVE
1. LIST OF STUDIES
This annexure lists the issues raised and recommendations made in previous water resourceplanning studies pertaining to the Thukela WMA. These issues and recommendations were used tocompile the first draft of the strategy tables that were discussed and revised during the twoworkshops. Table 1.1 presents a chronological list of the DWAF studies undertaken in the WMA.
Table 1.1: List of study reports.
No. Documentreference
Report Title
Vaal Augmentation Planning Study: Tugela-Vaal Transfer Scheme (1993 – 1994) – Reconnaissance Phase1 V000/00/0894 Vaal Aumentation Planning Study : Tugela-Vaal Transfer Scheme - WST consortium : Reconnaissance report2 Recon A.1 Base Conditions3 Recon A.2 Water Demands4 Recon A.3 Streamflow hydrology : Volumes 1 & 25 Recon A.4 Water Quality6 Recon A.5 Environmental Aspects7 Recon A.6 Development Options8 Recon B.1 Basic data: Volume 19 Recon B.2 Basic data: Volume 210 Recon B.3 Basic data: Volume 3
Vaal Augmentation Planning Study: Tugela-Vaal Transfer Scheme (1994 – 1996) – Pre-feasibility Phase11 V000/00/0894 Vaal Augmentation Planning Study : Tugela-Vaal Transfer Scheme - WST consortium : Pre-feasibility Report12 Pre-feas A.1 Design13 Pre-feas A.2 Environmental Aspects14 Pre-feas A.3 Costing and Economics15 Pre-feas A.4 System Analysis16 Pre-feas A.5 Regional Economics17 Pre-feas A B.1 Basic data
Vaal Augmentation Planning Study: Tugela-Vaal Transfer Scheme (1995 – 1996) – Interim Study (Pre-feasibility Phase)18 V000/00/1296 Vaal Aumentation Planning Study : Tugela-Vaal Transfer Scheme - WST consortium : Interim Phase Report19 - Various Interim Phase supporting documents, which amongst others include:20 V000/00/0195 Tugela River (Pre-feasibility) IFR Workshop Site visit document21 V000/00/0295 Tugela River (Pre-feasibility) IFR Workshop Starter document22 -
Thukela Water Project Feasibility Study (1997 – 2001) – Feasibility Phase23 V000/00/0198 Klip dam site: Geological Pre-feasibility report24 V000/00/0298 Jana dam site: Geological Pre-feasibility report25 V000/00/9600 Executive Summary: overview brochure26 V000/00/9700 Main Feasibility Report27 V000/00/3199 Engineering Module Report28 13 Engineering Supporting Reports29 V000/00/6099 Evaluation of Alternative Sources of Water for Ladysmith-Emnambithi30 V000/00/5599 Water Resources Module Report31 3 Supporting Water Resources Reports32 V000/00/0089 Public Involvement Programme Module Report33 V000/00/9000 Decision Register (12 public involvement programme files)34 V000/00/6200 Environmental Module Report35 18 Environmental Supporting Reports36 V000/00/8799 Regional Development37 V000/00/9900 Legal & Hydro-political Aspects38 V000/00/9100 Economical & Financial Viability Report
No. Documentreference
Report Title
Other studies39 V000/00/0284 Sentraal -Tugela - wateroordragskema : voorlopige ondersoek na n gesamentlike skema met Eskom40 C000/00/6486
V000/00/0586Vaal River System Analysis - BKSTugela - Vaal subsystem analysis (1986)
41 V000/00/0686 Hydrology of the Tugela Basin: volume A: :text
ANNEXURE A.SXW PAGE D- FIRST DRAFT – AUGUST 2003
1
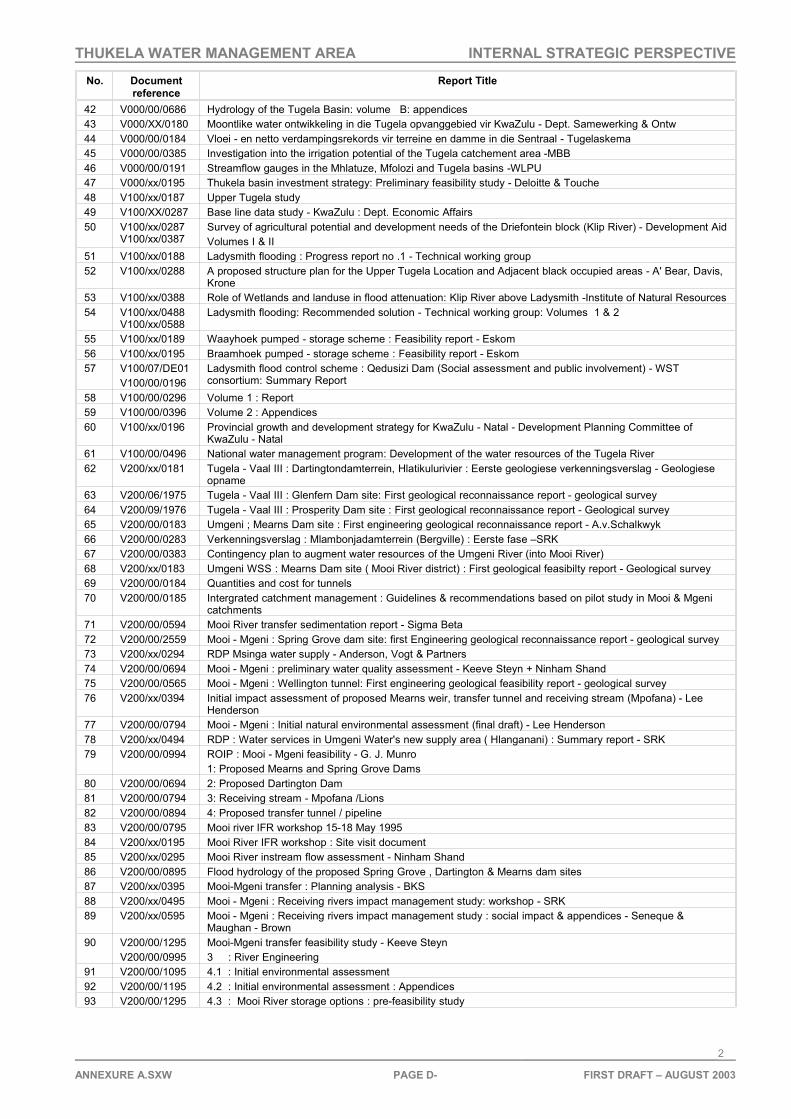
THUKELA WATER MANAGEMENT AREA INTERNAL STRATEGIC PERSPECTIVE
No. Documentreference
Report Title
42 V000/00/0686 Hydrology of the Tugela Basin: volume B: appendices43 V000/XX/0180 Moontlike water ontwikkeling in die Tugela opvanggebied vir KwaZulu - Dept. Samewerking & Ontw44 V000/00/0184 Vloei - en netto verdampingsrekords vir terreine en damme in die Sentraal - Tugelaskema45 V000/00/0385 Investigation into the irrigation potential of the Tugela catchement area -MBB46 V000/00/0191 Streamflow gauges in the Mhlatuze, Mfolozi and Tugela basins -WLPU47 V000/xx/0195 Thukela basin investment strategy: Preliminary feasibility study - Deloitte & Touche48 V100/xx/0187 Upper Tugela study49 V100/XX/0287 Base line data study - KwaZulu : Dept. Economic Affairs50 V100/xx/0287
V100/xx/0387Survey of agricultural potential and development needs of the Driefontein block (Klip River) - Development AidVolumes I & II
51 V100/xx/0188 Ladysmith flooding : Progress report no .1 - Technical working group52 V100/xx/0288 A proposed structure plan for the Upper Tugela Location and Adjacent black occupied areas - A' Bear, Davis,
Krone53 V100/xx/0388 Role of Wetlands and landuse in flood attenuation: Klip River above Ladysmith -Institute of Natural Resources54 V100/xx/0488
V100/xx/0588Ladysmith flooding: Recommended solution - Technical working group: Volumes 1 & 2
55 V100/xx/0189 Waayhoek pumped - storage scheme : Feasibility report - Eskom56 V100/xx/0195 Braamhoek pumped - storage scheme : Feasibility report - Eskom57 V100/07/DE01
V100/00/0196Ladysmith flood control scheme : Qedusizi Dam (Social assessment and public involvement) - WSTconsortium: Summary Report
58 V100/00/0296 Volume 1 : Report59 V100/00/0396 Volume 2 : Appendices60 V100/xx/0196 Provincial growth and development strategy for KwaZulu - Natal - Development Planning Committee of
KwaZulu - Natal61 V100/00/0496 National water management program: Development of the water resources of the Tugela River62 V200/xx/0181 Tugela - Vaal III : Dartingtondamterrein, Hlatikulurivier : Eerste geologiese verkenningsverslag - Geologiese
opname63 V200/06/1975 Tugela - Vaal III : Glenfern Dam site: First geological reconnaissance report - geological survey64 V200/09/1976 Tugela - Vaal III : Prosperity Dam site : First geological reconnaissance report - Geological survey65 V200/00/0183 Umgeni ; Mearns Dam site : First engineering geological reconnaissance report - A.v.Schalkwyk66 V200/00/0283 Verkenningsverslag : Mlambonjadamterrein (Bergville) : Eerste fase –SRK67 V200/00/0383 Contingency plan to augment water resources of the Umgeni River (into Mooi River)68 V200/xx/0183 Umgeni WSS : Mearns Dam site ( Mooi River district) : First geological feasibilty report - Geological survey69 V200/00/0184 Quantities and cost for tunnels70 V200/00/0185 Intergrated catchment management : Guidelines & recommendations based on pilot study in Mooi & Mgeni
catchments 71 V200/00/0594 Mooi River transfer sedimentation report - Sigma Beta72 V200/00/2559 Mooi - Mgeni : Spring Grove dam site: first Engineering geological reconnaissance report - geological survey73 V200/xx/0294 RDP Msinga water supply - Anderson, Vogt & Partners74 V200/00/0694 Mooi - Mgeni : preliminary water quality assessment - Keeve Steyn + Ninham Shand75 V200/00/0565 Mooi - Mgeni : Wellington tunnel: First engineering geological feasibility report - geological survey76 V200/xx/0394 Initial impact assessment of proposed Mearns weir, transfer tunnel and receiving stream (Mpofana) - Lee
Henderson77 V200/00/0794 Mooi - Mgeni : Initial natural environmental assessment (final draft) - Lee Henderson78 V200/xx/0494 RDP : Water services in Umgeni Water's new supply area ( Hlanganani) : Summary report - SRK79 V200/00/0994 ROIP : Mooi - Mgeni feasibility - G. J. Munro
1: Proposed Mearns and Spring Grove Dams80 V200/00/0694 2: Proposed Dartington Dam81 V200/00/0794 3: Receiving stream - Mpofana /Lions82 V200/00/0894 4: Proposed transfer tunnel / pipeline83 V200/00/0795 Mooi river IFR workshop 15-18 May 199584 V200/xx/0195 Mooi River IFR workshop : Site visit document85 V200/xx/0295 Mooi River instream flow assessment - Ninham Shand86 V200/00/0895 Flood hydrology of the proposed Spring Grove , Dartington & Mearns dam sites87 V200/xx/0395 Mooi-Mgeni transfer : Planning analysis - BKS88 V200/xx/0495 Mooi - Mgeni : Receiving rivers impact management study: workshop - SRK89 V200/xx/0595 Mooi - Mgeni : Receiving rivers impact management study : social impact & appendices - Seneque &
Maughan - Brown90 V200/00/1295
V200/00/0995Mooi-Mgeni transfer feasibility study - Keeve Steyn 3 : River Engineering
91 V200/00/1095 4.1 : Initial environmental assessment 92 V200/00/1195 4.2 : Initial environmental assessment : Appendices93 V200/00/1295 4.3 : Mooi River storage options : pre-feasibility study
ANNEXURE A.SXW PAGE D- FIRST DRAFT – AUGUST 2003
2
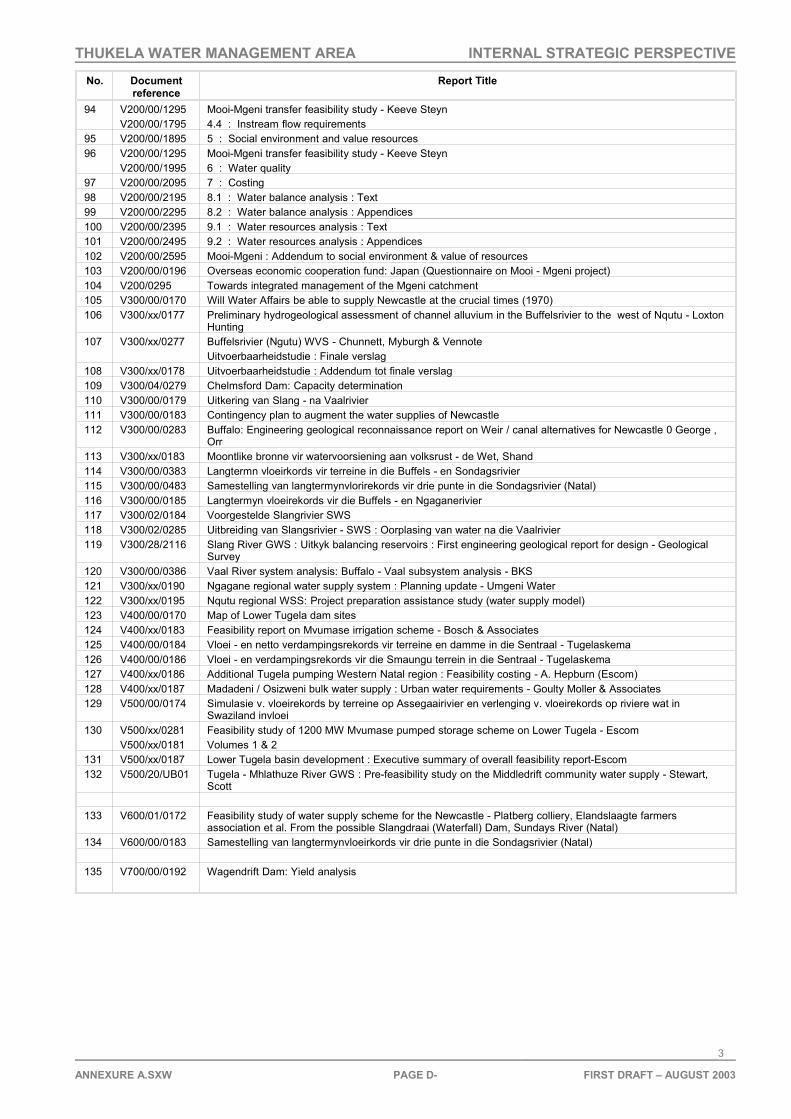
THUKELA WATER MANAGEMENT AREA INTERNAL STRATEGIC PERSPECTIVE
No. Documentreference
Report Title
94 V200/00/1295V200/00/1795
Mooi-Mgeni transfer feasibility study - Keeve Steyn4.4 : Instream flow requirements
95 V200/00/1895 5 : Social environment and value resources96 V200/00/1295
V200/00/1995Mooi-Mgeni transfer feasibility study - Keeve Steyn6 : Water quality
97 V200/00/2095 7 : Costing98 V200/00/2195 8.1 : Water balance analysis : Text99 V200/00/2295 8.2 : Water balance analysis : Appendices100 V200/00/2395 9.1 : Water resources analysis : Text101 V200/00/2495 9.2 : Water resources analysis : Appendices102 V200/00/2595 Mooi-Mgeni : Addendum to social environment & value of resources103 V200/00/0196 Overseas economic cooperation fund: Japan (Questionnaire on Mooi - Mgeni project)104 V200/0295 Towards integrated management of the Mgeni catchment105 V300/00/0170 Will Water Affairs be able to supply Newcastle at the crucial times (1970)106 V300/xx/0177 Preliminary hydrogeological assessment of channel alluvium in the Buffelsrivier to the west of Nqutu - Loxton
Hunting107 V300/xx/0277 Buffelsrivier (Ngutu) WVS - Chunnett, Myburgh & Vennote
Uitvoerbaarheidstudie : Finale verslag108 V300/xx/0178 Uitvoerbaarheidstudie : Addendum tot finale verslag109 V300/04/0279 Chelmsford Dam: Capacity determination110 V300/00/0179 Uitkering van Slang - na Vaalrivier111 V300/00/0183 Contingency plan to augment the water supplies of Newcastle112 V300/00/0283 Buffalo: Engineering geological reconnaissance report on Weir / canal alternatives for Newcastle 0 George ,
Orr113 V300/xx/0183 Moontlike bronne vir watervoorsiening aan volksrust - de Wet, Shand114 V300/00/0383 Langtermn vloeirkords vir terreine in die Buffels - en Sondagsrivier115 V300/00/0483 Samestelling van langtermynvlorirekords vir drie punte in die Sondagsrivier (Natal)116 V300/00/0185 Langtermyn vloeirekords vir die Buffels - en Ngaganerivier117 V300/02/0184 Voorgestelde Slangrivier SWS118 V300/02/0285 Uitbreiding van Slangsrivier - SWS : Oorplasing van water na die Vaalrivier119 V300/28/2116 Slang River GWS : Uitkyk balancing reservoirs : First engineering geological report for design - Geological
Survey120 V300/00/0386 Vaal River system analysis: Buffalo - Vaal subsystem analysis - BKS121 V300/xx/0190 Ngagane regional water supply system : Planning update - Umgeni Water122 V300/xx/0195 Nqutu regional WSS: Project preparation assistance study (water supply model)123 V400/00/0170 Map of Lower Tugela dam sites124 V400/xx/0183 Feasibility report on Mvumase irrigation scheme - Bosch & Associates125 V400/00/0184 Vloei - en netto verdampingsrekords vir terreine en damme in die Sentraal - Tugelaskema126 V400/00/0186 Vloei - en verdampingsrekords vir die Smaungu terrein in die Sentraal - Tugelaskema127 V400/xx/0186 Additional Tugela pumping Western Natal region : Feasibility costing - A. Hepburn (Escom)128 V400/xx/0187 Madadeni / Osizweni bulk water supply : Urban water requirements - Goulty Moller & Associates129 V500/00/0174 Simulasie v. vloeirekords by terreine op Assegaairivier en verlenging v. vloeirekords op riviere wat in
Swaziland invloei130 V500/xx/0281
V500/xx/0181Feasibility study of 1200 MW Mvumase pumped storage scheme on Lower Tugela - EscomVolumes 1 & 2
131 V500/xx/0187 Lower Tugela basin development : Executive summary of overall feasibility report-Escom132 V500/20/UB01 Tugela - Mhlathuze River GWS : Pre-feasibility study on the Middledrift community water supply - Stewart,
Scott
133 V600/01/0172 Feasibility study of water supply scheme for the Newcastle - Platberg colliery, Elandslaagte farmersassociation et al. From the possible Slangdraai (Waterfall) Dam, Sundays River (Natal)
134 V600/00/0183 Samestelling van langtermynvloeirkords vir drie punte in die Sondagsrivier (Natal)
135 V700/00/0192 Wagendrift Dam: Yield analysis
ANNEXURE A.SXW PAGE D- FIRST DRAFT – AUGUST 2003
3

THUKELA WATER MANAGEMENT AREA INTERNAL STRATEGIC PERSPECTIVE
2. OVERVIEW OF STUDIES UNDERTAKEN
2.1 VAAL AUGMENTATION PLANNING STUDY : TUGELA-VAAL TRANSFER SCHEME - RECONNAISSANCE PHASE
This study was initiated in response to the future need to augment water supplies to the Vaal RiverSystem. Further development of the water resources of the Thukela River Catchment was proposedas an option.
2.1.1 Base conditions
This review was directed at compiling information relating to water utilization/resources.Information was collated by examining reports pertaining to existing and planned developmentsinvolving utilization of water resources, namely water supply, transfer schemes, pumpedstorage, urbanization, nature reserves, mining, irrigation and afforestation in the Thukela Basin.Although this was mainly a desktop study, it included questionnaires to local authorities andvisits to major water users. This report presented the following information that has bearing onthe ISP:
Land Use : Drakensberg forms the higher lying, high rainfall areas. Mainly nature areas,holiday resorts and to a limited extent forestry are the main land uses being practiced in theDrakensberg mountains. Main industrial centres that place a demand on the water resourcesand that have an impact on water quality in the receiving streams were identified at Newcastle,Dundee, Estcourt, Ladysmith, and Mandini (SAPPI). Water usage was expected to doublebetween the years 1990 and 2010. (A smaller growth in demand has been experiencedbetween 1990 and 2002). A domestic population/water demand growth rate of 3% waspredicted for the same time period. Numerous mines (mainly coal mines) have closed down.Water quality related problems are described below.
Agriculture : Government Water Control Areas: 7700ha of irrigation (quotas 51x106 m3/a).Thukela / Spioenkop = 1543 ha; Bushmans / Wagendrift = 1593ha; Ngagane / Chelmsford =238 ha; Mnyavubu / Craigieburn = 2157 ha; Buffalo = 3049 ha. Other irrigators (Water Boardsand Private irrigation): Total 86 000ha (= 655x106 m3/a). (Not sure if this irrigation area isentirely being used today) This reconnaissance study noted that the whole catchment(especially in homeland areas) was totally overstocked with domestic animals and that thetelltale signs of soil erosion were evident.
Afforestation : In 1990, the upper parts of Thukela catchment (mainly the Biggersberg toNewcastle stretch) contain about 20 000 ha of forestry. The Thukela-Mhlatuze watershed alsoallows afforestation. DWAFs management aim was not to allow large scale afforestation and totry and limit the impact of this sector on the MAR to a streamflow reduction of 10% of the MAR.In view of potential expansion it was found that 82000ha of suitable forestry land exists in theThukela Basin and a further 65000ha of marginal could also be utilized.
Ecology : The Thukela River Mouth was cited as a concern in this report. The authors wereconcerned about the impact of the various planned abstraction weirs in the lower Thukela Riveron the migration of marine/riverine fauna. Maintenance of sufficient low flows to ensure that themouth remains open for most of the time was also mooted. Minimum discharges to dilute Sappieffluent was also noted as a major concern (request that a minimum flow of greater than 4m3/sbe maintained 95% of the time).
Large Dams : Ten dams in catchment with a combined firm yield of 950x 106 m3 /annum.Upper dams (Woodstock, Driel Barrage and Kilburn) reserved for transfer. Chelmsford(Ngagane Regional GWS and CA) problems with allocations to irrigators. Spioenkop (TugelaGWS and CA) - u/s abstractions allowed and compensation releases of 1 to 2m3/s allowed.
ANNEXURE A.SXW PAGE D- FIRST DRAFT – AUGUST 2003
4

THUKELA WATER MANAGEMENT AREA INTERNAL STRATEGIC PERSPECTIVE
Other Regional Schemes and Transfers : Ngagane, Biggersberg, Emnanbithu, Nqutumanaged by Uthukela Regional Council (more recently some have been handed over to theThukela Water Partnership).
Major transfers : Tugela Vaal Transfer Scheme – some concern by Thukela Basin residentsthat they don’t see the benefit of this transfer and that local development may be hindered infuture. (More recently, it may be possible for the proposed Thukela Catchment ManagementAgency to charge a water resource levy on water transferred to the Vaal River System.Furthermore, it has been mentioned that local water users take precedence over Vaal Riverusers when it comes to the allocation of water resources in the Thukela River Basin). Slang /Zaaihoek (Buffalo GWS): Majuba Power Station takes priority on the water in the ZaaihoekDam. (It has been noted that the large dead storage in the Zaaihoek Dam is not being utilized).It was noted that there could be a water transfer from the lower Thukela River to Richards Bayand environs in future. Also a further transfer to the Mgeni River System from the Mooi River.The possibility of the Waaihoek or Braamhoek Pumped Storage Scheme was also mentioned.
2.1.2 Water Requirements
The water requirements were discussed in detail in these reports (updated values are nowavailable and are reflected in this ISP). Indications are that the in-basin requirement projectionsmade in the earlier studies were very conservative. Lower demands are now beingexperienced and projected.
2.1.3 Water Resources
The Mean Annual Runoff at the Thukela River Mouth was estimated at 3865x 106 m3 /annum.(More recent studies [Pitman and McKenzie(1996)] showed a 0.4% decrease in the MARestimates).
2.1.4 Water Quality
A comprehensive assessment of the water quality issues in the whole Thukela River catchmentwas conducted during these feasibility studies. Dr Herold provided the following generalrecommendations regarding water quality management in the catchment: Suitablerelationships and other prediction tools need to be developed to estimate :
Future quality of effluent discharged to streams in the Thukela Catchment;
The present and future salt export from operating, abandoned unrehabilitated andabandoned rehabilitated coal mines;
The diffuse source export of problematic pollutants from industrial areas; and
Diffuse wash-off of pollutants from urban areas (especially informal/semi formalsettlements).
Short term monitoring programme recommended to meet requirements for estimating diffusesource pollution loads. Conjunctive use of dams (existing and new) to meet needs of water useand simultaneously solving existing downstream water quality problems should be considered.
The following specific issues were highlighted:
Upper Tugela R (V110 tertiary catchment) : Spioenkop Dam grossly under-utilised. Nosignificant water quality problems. The rapid development of the Action Homes settlementabove Spioenkop could cause eutrophication and excessive organic load problems in the damin future. Similarly the relatively high density of rural population in the area above theWoodstock Dam. (Recently Rand Water has conducted studies and rehabilitation projects inthis area to limit soil erosion and sedimentation of the Woodstock Dam). It was believed thatthis area was 75% overstocked with livestock (ie carrying capacity 2 ha per Livestock Unit(LSU) vs actual 3.5ha per LSU on the ground in the early 1990s).
ANNEXURE A.SXW PAGE D- FIRST DRAFT – AUGUST 2003
5

THUKELA WATER MANAGEMENT AREA INTERNAL STRATEGIC PERSPECTIVE
Little Tugela (V130) : Informal settlements in upper subcatchment and formal irrigationscheme in lower parts. Overstocking (ie double the livestock carrying capacity).
Klip River (V120) : Ladysmith-Ezakheni pollution sources - high coli and total coliforms , highphosphates. Rapid growth in informal settlements: Driefontein , Watermeet and Peace Town =high organic loads. Overgrazing as well (double carrying capacity).
Middle Tugela / Bloukrans River (V140) : Overgrazing: 80% over carrying capacity. TDS,Sulphate and Phosphate on Bloukrans somewhat elevated (possibly due to CornfieldsTembahlile settlements).
Bushmans River (V700 tertiary catchment) : 60% overstocked. High industrial component(60%) in Estcourts sewage effluent results in poor final effluent quality. Noted as a major issue– please see tables later in this report.
Sundays/Tugela River (V600) : Urban development - Glencoe - Sithembile, Ekuvukeni,Waaihoek and Uitkyk. Sithembile = frequent blockages of sewers with spillages intoUithoekspruit and hence into the Wasbankspruit. High rural population density (56 per km2)could contribute to the occasional high phospate concentrates observed in Sundays River (upto 450g/l) and the Wasbankspruit (1320g/l). Natural drainage from geological formationsand especially from coal mine workings also contain appreciable amounts of nitrates andphosphate. Two dormant and six closed coal mines are located in the Wasbankspruit andSundays River catchments. Evidence of salination of Upper Sundays River at gauging pointV6H004 with sulphate concentrations reaching 214mg/l (compared with 18mg/l furtherupstream at V6H006). Large informal settlements in vicinity of Tugela Ferry = organic pollution.Livestock - 140% overstocked = soil erosion very evident.
Mooi River (V200) : Mooi Textiles has own sewage treatment works. (Factory now closed).Livestock numbers exceed carrying capacity by 70%. Several Piggeries in catchments.
Upper Buffalo (V310) : Half of urban population in Thukela catchment centred in Newcastle,Volksrust, Dannhauser and Charlestown areas. Iscor, Karbochen; AECI, and Coal mines aremain industrial and mining activities. Operational coal mines (Durnacol [now closing], CBR andWitklip); 8 dormant and 6 closed coalmines in this area. Ncandu, Ngagane and Buffalo(immediately upstream of its confluence with Ngagane) are the rivers most severely impactedby urban, industrial or mining developments. High salinity from acid mine drainage. Mercurycontamination of groundwater (in vicinity of AECI factory adjacent to Ngagane River). Organicand faecal eutrophication - raw sewage spillage from western portion of Madadeni township.Sodium and Flouride pollution (near Ngagane Buffalo confluence, associated with Iscor). Tasteand problems associated with chlorinated phenols (observed in the Horn and Ngagane rivers atIscors raw water intakes). Catchment overstocked by 40% (ie 2 vs 5ha per LSU) = soil erosionand high turbidity.
Middle Buffalo River (V320) : The main water scheme is the Biggarsberg Regional WaterServices, which obtains raw water from McHardy Dam (on the Sterkstroom), Verdruk Dam amdMpati Dam and Tayside weir (on the Buffalo River). The main urban centers receiving waterfrom the scheme are Madadeni and Osizweni (located adjacent to the Buffalo Riverimmediately downstream of the Ngagane confluence), Utrecht to the Dorpspruit), Dundee /Sibongile, Hattingspruit and Washbankspruit (located in the Mzinyashane River catchment).The catchment has a large rural population of 171 000, with a relatively high population densityof 43 per km2. Consul Glass (located near Dundee in the Mzinyashane River catchment) is themost significant industrial development. Six operating coal mines (Welgedact Utrecht andUmgala sections, Bergaskool and Welgedact Lignite in the Dorpspruit catchment, andCarnarvon and Springlake in the Mzinyashane River catchment)(closed or not?); eighteendormant coal mines (one in the Dorpspruit catchment, twelve in the Mzinyashane Rivercatchment and five on other smaller tributaries entering the Buffalo River); and seventeenclosed coal mines (two in the Dorpspruit catchment, twelve in the Mzinyashane River catchmentand three on smaller tributaries of the Buffalo) are located in the Middle Buffalo catchment.
ANNEXURE A.SXW PAGE D- FIRST DRAFT – AUGUST 2003
6

THUKELA WATER MANAGEMENT AREA INTERNAL STRATEGIC PERSPECTIVE
The Middle Buffalo River is about 70% over stocked with livestock. Mzinyashane River systemis the most severely affected by acid mine drainage from coal mining activates. Theeutrophication of streams downstream of coal mining areas is thought to be attributable to therelatively high nitrate and phosphate concentrations present in the acid mine drainage. It hasbeen reported that organic pollution downstream of Dundee resulting in replacement of thenormal fauna by worm-midge (Tubifex-Chironomus). High COD levels (up to 362 mg/l) inDundee's treated sewage effluent samples recently (1993) collected by the DWAF's Dundeeoffice indicates that this situation could still persist. Nutrient rich effluent from the Madadeniand the Osizweni STWs together with runoff from these urban areas and the densely populatedinformal development that has sprung up between these two urban areas contributes to thereported severe eutrophication of the Buffalo River during low flow conditions between theNcandu confluence and de Jagersdrift (which is upstream of the road bridge on the R33Dundee - Vryheid road near the Buffalo - Eerstelingspruit confluence. High turbidity also occursin the Buffalo River. The Buffalo River at Vaalbank weir (hydrological station V3H015)immediately downstream of the Dorpspruit is severely salinized, with peak TDS concentrationsreaching 700mg/l. High sulphate concentrations point to acid mine drainage sources in theDorpspruit catchment and from upstream sources in the V310 catchment. However, equallyhigh sodium and chloride concentrations indicate significant contributions from other sources aswell. High sodium concentrations (up to 144mg/l together with episodes of high fluorideconcentrations (up to 4,4mg/l) point to Iscor as the likely source.
Lower Buffalo River (V330) : The Nqutu Regional Water Services abstracts raw water fromthe Buffalo River near hydrological station V3H001, just downstream of the Bloed Riverconfluence. The rural population density is high, at 79 per km2. The catchment appears to beabout 107% over stocked with livestock. General degradation of catchment vegetation, leadingto soil erosion and high river turbidity, and organic pollution are the most prominent impacts onsurface water quality.
Lower Tugela / Nsuzi River (V400) : Kranskop is the only significant urban development in theNsuzi catchment. The rural population density of 60 per km2 is relatively high. The livestocknumbers are about 85% higher than the sustainable carrying capacity of the catchment.Turbidity and organic pollution problems can be anticipated.
Lower Tugela River (V500) : The main urban centres are Sundumbili, Mandeni, Tugela Railand smaller villages supplied with water by the Tugela Development Services Board (at thatstage – now the district municipalities). Sappi Kraft's Mandeni Paper Mill and Isithebe IndustrialEstates are the main industrial developments. The rural population density is the highest in theTugela Basin (101 per km2). Livestock densities are the lowest in the Tugela basin and appearto be well within the carrying capacity of the catchment. Afforestation covers about 15% of thissub-catchment area. Sappi's plant effluent discharged to the Tugela River is characterized byhigh BOD, COD, OA, suspended solids, sodium levels, colour problems and high temperaturesof up to 46C. Problems have been experienced with the drop in dissolved oxygen (DO) in theTugela River downstream of Sappi's effluent discharge. During drought times water has to bereleased from Spioenkop Dam to provide additional dilution of the lower Tugela River tocounteract the drop in DO. Mandeni Sappi themselves have complained of severe turbidityproblems at their raw water intakes. Sappi has also indicated that during a flood event inOctober 1993, the suspended solids present in the Tugela River reached 3,5% to 4,0%,resulting in siltation of the sedimentation tanks and the total shutdown of the paper mill.Chloride peaks of he order of 100mg/l during the height of the last drought were also reportedto have caused problems for the plant. The Polmon database revealed high electricalconductivity (up to 1700 mS/m), sodium, and COD levels in the Mandeni River upstream ofSappi's second discharge point, presumably attributable to pollution sources at IsithebeEstates.
2.1.5 Environmental Aspects
The following environmental concerns were also raised in a specially dedicated report on theevaluation of various dam sites in the whole catchment and associated schemes :
ANNEXURE A.SXW PAGE D- FIRST DRAFT – AUGUST 2003
7

THUKELA WATER MANAGEMENT AREA INTERNAL STRATEGIC PERSPECTIVE
Existing Tugela-Vaal Transfer Scheme Canal from Driel Barrage - insufficient considerationof social impacts during construction – unhappiness with local inhabitants.
The possibility of tapping water from the TVTS systems. Policy at the time not to allow this(ie expensive water).
Water resources need to be well managed to encourage and support recreation,conservation and tourism (resorts).
Black fly infestations may occur in the Thukela if the river system is not managed properly.
Biological translocations of fish and other noonoos through the TVTS into the Vaal RiverSystem.
Wetlands need protection.
Land tenure planning and associated pressure on natural resources must be conductedwell in order to avoid soil erosion and silting of the rivers and dams of the Thukelacatchment.
2.1.6 Development Options at Reconnaissance Level
In planning the potential further development of the water resources of the Thukela River Basin,73 dam sites were identified and investigated. During the Reconnaissance study these numberof dam sites were reduced to 26 and eventually 17.
2.1.7 Economic Analysis at Reconnaissance Level
An economic analysis further reduced the 17 sites to 4 scheme layouts (with approx 3 damsites in each layout). These recommendations were then referred to a more intensive andfocussed Pre-feasibility Study.
2.2 VAAL AUGMENTATION PLANNING STUDY : TUGELA-VAAL TRANSFER SCHEME : PRE-FEASIBILITY PHASE
At the end of the Reconnaissance Phase it was found that water delivered via the so-calledsouthern tributary component of the TVTS to the Vaal River System would be cheaper thanwater from other VAPS alternatives (ie Lesotho Highlands Project further phases; the Orange-Caledon River scheme; and the Umzimvubu Transfer Scheme). Furthermore, the TVTS was theonly scheme that could be implemented in time to meet the 2006 Vaal River Systemaugmentation deadline that existed at that time.
The Pre-feasibility Phase study was then conducted and in turn identified the two most attractiveschemes which could be developed separately or in combination. The Southern TributaryTransfer Scheme (STTS) could deliver 12,8 m3/s for transfer via the existing DrakensbergPumped Storage Scheme. The Northern Tributaries Transfer Scheme (NTTS) could deliver 22,0m3/s via a transfer pumping station at Chatsworth (Braamhoek). The NTTS was found to be lesseconomical than the STTS option.
2.3 VAAL AUGMENTATION PLANNING STUDY : TUGELA-VAAL TRANSFER SCHEME : INTERIM PHASE
At the end of the Pre-feasibility Phase, a number of uncertainties about the layout of the STTSstill existed and it was decided to address these in a so-called Interim study to ensure that aproperly defined option could be taken through to the Feasibility Phase that was scheduled tofollow.
ANNEXURE A.SXW PAGE D- FIRST DRAFT – AUGUST 2003
8
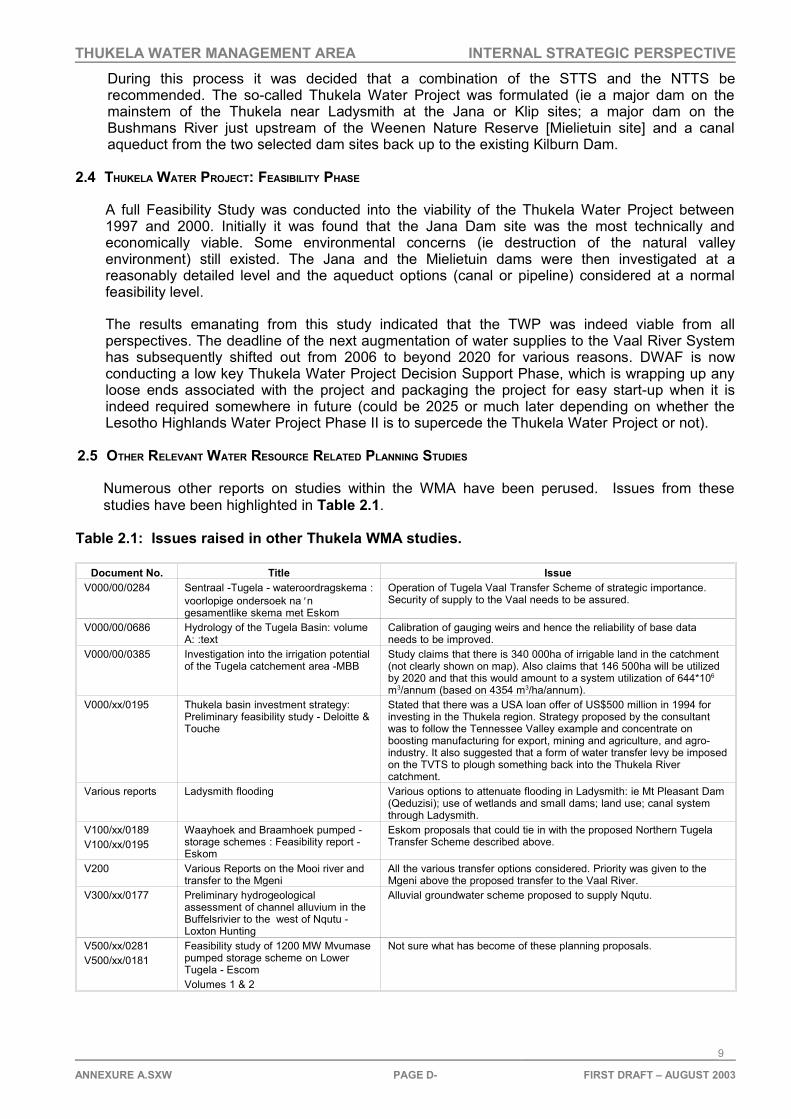
THUKELA WATER MANAGEMENT AREA INTERNAL STRATEGIC PERSPECTIVE
During this process it was decided that a combination of the STTS and the NTTS berecommended. The so-called Thukela Water Project was formulated (ie a major dam on themainstem of the Thukela near Ladysmith at the Jana or Klip sites; a major dam on theBushmans River just upstream of the Weenen Nature Reserve [Mielietuin site] and a canalaqueduct from the two selected dam sites back up to the existing Kilburn Dam.
2.4 THUKELA WATER PROJECT: FEASIBILITY PHASE
A full Feasibility Study was conducted into the viability of the Thukela Water Project between1997 and 2000. Initially it was found that the Jana Dam site was the most technically andeconomically viable. Some environmental concerns (ie destruction of the natural valleyenvironment) still existed. The Jana and the Mielietuin dams were then investigated at areasonably detailed level and the aqueduct options (canal or pipeline) considered at a normalfeasibility level.
The results emanating from this study indicated that the TWP was indeed viable from allperspectives. The deadline of the next augmentation of water supplies to the Vaal River Systemhas subsequently shifted out from 2006 to beyond 2020 for various reasons. DWAF is nowconducting a low key Thukela Water Project Decision Support Phase, which is wrapping up anyloose ends associated with the project and packaging the project for easy start-up when it isindeed required somewhere in future (could be 2025 or much later depending on whether theLesotho Highlands Water Project Phase II is to supercede the Thukela Water Project or not).
2.5 OTHER RELEVANT WATER RESOURCE RELATED PLANNING STUDIES
Numerous other reports on studies within the WMA have been perused. Issues from thesestudies have been highlighted in Table 2.1.
Table 2.1: Issues raised in other Thukela WMA studies.
Document No. Title IssueV000/00/0284 Sentraal -Tugela - wateroordragskema :
voorlopige ondersoek na ngesamentlike skema met Eskom
Operation of Tugela Vaal Transfer Scheme of strategic importance.Security of supply to the Vaal needs to be assured.
V000/00/0686 Hydrology of the Tugela Basin: volumeA: :text
Calibration of gauging weirs and hence the reliability of base dataneeds to be improved.
V000/00/0385 Investigation into the irrigation potentialof the Tugela catchement area -MBB
Study claims that there is 340 000ha of irrigable land in the catchment(not clearly shown on map). Also claims that 146 500ha will be utilizedby 2020 and that this would amount to a system utilization of 644*106
m3/annum (based on 4354 m3/ha/annum).V000/xx/0195 Thukela basin investment strategy:
Preliminary feasibility study - Deloitte &Touche
Stated that there was a USA loan offer of US$500 million in 1994 forinvesting in the Thukela region. Strategy proposed by the consultantwas to follow the Tennessee Valley example and concentrate onboosting manufacturing for export, mining and agriculture, and agro-industry. It also suggested that a form of water transfer levy be imposedon the TVTS to plough something back into the Thukela Rivercatchment.
Various reports Ladysmith flooding Various options to attenuate flooding in Ladysmith: ie Mt Pleasant Dam(Qeduzisi); use of wetlands and small dams; land use; canal systemthrough Ladysmith.
V100/xx/0189V100/xx/0195
Waayhoek and Braamhoek pumped -storage schemes : Feasibility report -Eskom
Eskom proposals that could tie in with the proposed Northern TugelaTransfer Scheme described above.
V200 Various Reports on the Mooi river andtransfer to the Mgeni
All the various transfer options considered. Priority was given to theMgeni above the proposed transfer to the Vaal River.
V300/xx/0177 Preliminary hydrogeologicalassessment of channel alluvium in theBuffelsrivier to the west of Nqutu -Loxton Hunting
Alluvial groundwater scheme proposed to supply Nqutu.
V500/xx/0281V500/xx/0181
Feasibility study of 1200 MW Mvumasepumped storage scheme on LowerTugela - EscomVolumes 1 & 2
Not sure what has become of these planning proposals.
ANNEXURE A.SXW PAGE D- FIRST DRAFT – AUGUST 2003
9

ANNEXURE B: REGISTERED DAMS IN THE THUKELA WMA
Quaternary catchment
Dam Name Purpose Capacity (million m3)
Full supply area (km2)
V11C KILBURN Hydro Power 35.56 1.95V11C KILBURN-OMGEWINGS NO.3- Leisure 0.318 0.06V11F SHAMROCK Irrigation 1.37 0.52
V11J DRIEL BARRAGEDomestic Water Use 8.694 2.99
V11J- WOODSTOCKDomestic Water Use 380.4 29.15
V11L ACTON VALLEY Irrigation 1.04 0.5V11L FAIRFIELD Irrigation 0.24 0.12V11L ROODEBULT Irrigation 0.22 0.05
V11L SPIOENKOPDomestic Water Use 279.63 15.38
V11L ZUURLAGER DAM NO 1 Irrigation 0.25 0.1V12A FOUR WINDS Irrigation 0.09 0.03V12E BRINLEY Irrigation 0.15 0.11V12E LOWER ARCADIA NO 3 Irrigation 0.054 0.02V12F ARCADIA BIG Irrigation 0.126 0.02V12F BROOKFIELD Irrigation 0.1 0.03V12F KRANTZKLOOF Irrigation 0.1 0.02V12F MARIAS HEUWEL NO. 1 Irrigation 0.064 0.03V12F MARIAS HEUWEL NO. 2 Irrigation 0.051 0.02
V12F WINDSORDomestic Water Use 0.77 0.83
V13B BELL PARK Irrigation 7.5 1.05V13B CLYDESDALE BIG Irrigation 0.242 0.09V13B CLYDESDALE TREE Irrigation 0.05 0.03V13B DRAKENSBERG SUN Leisure 0.38 0.08V13B ERASMUS Irrigation 0.2 0.02V13C DANKBAAR DAM NO 3 Irrigation 0.2 0.04V13C GLENSIDE DAM NO. 1 Irrigation 0.137 0.04V13C GROOTDRAAI Irrigation 0.6 0.16V13C NOODHULP Irrigation 0.135 0.05V13C NTSINGINSHANI Irrigation 0.4 0.1V13C PIVOT Irrigation 1.53 0.39V13C TEVREDE DAM NO 2 Irrigation 0.6 0.12V13C VAALBANK Irrigation 0.2 0.02V13D GLEN GRAY Irrigation 0.433 0.12V13D HONGERSPOORT N0.1- Irrigation 0.075 0.02V13D HONGERSPOORT NO.2- Irrigation 0.175 0.05V13D HONGERSPOORT NO.3- Irrigation 0.125 0.04V13D MEERSIG RIVER Irrigation 0.23 0.09V13D VALHALLA Irrigation 0.24 0.05V13D VENTERSSPRUIT Irrigation 0.07 0.06V13D VENTERSSPRUIT SILT TRAP Irrigation 0.08 0.05V13E GRUNAU DAM NO. 1 Irrigation 0.15 0.06V13E GRUNAU DAM NO. 2 Irrigation 0.15 0.06V13E MARA STRYDPOORT Irrigation 0.67 0.37V13E RUSTENBURG NO. 1- Irrigation 0.05 0.02V13E RUSTENBURG NO. 2- Irrigation 0.08 0.03

V13E RUSTENBURG NO. 3- Irrigation 0.09 0.03V13E RUSTENBURG NO. 4- Irrigation 0.15 0.04V13E RUSTENBURG NO. 7- Irrigation 0.18 0.05V13E RUSTENBURG NO. 8- Irrigation 0.05 0.02V13E THE GRANGE Irrigation 0.15 0.05V14A DOORNKOP TOP Irrigation 0.485 0.2V14C EMPANGWENE Irrigation 0.43 0.16V14D SUNNYSIDE Irrigation 0.25 0.03V20A BRAMLEIGH FARM Irrigation 0.223 0.05V20A DRAYTON Irrigation 0.13 0.05V20A Dummy dam Irrigation 2.1 2.14V20A EXCELSIOR Irrigation 0.063 0.03V20A INVERMOOI LAER Irrigation 0.175 0.08V20A INVERMOOI UPPER Irrigation 0.15 0.07V20A RIVERSIDE TOP Irrigation 0.09 0.04V20A SILVERDALE Irrigation 0.108 0.04V20A SOUTAR'S HILL Irrigation 0.086 0.03V20B AIRSTRIP Irrigation 0.2 0.08V20B BRAKVLEI Irrigation 0.345 0.09V20B BURN Irrigation 0.18 0.08V20B DEFENCE Irrigation 0.45 0.24V20B DEFENCE PUMP Irrigation 0.185 0.05V20B EAST MESHLYNN HOUSE Irrigation 0.075 0.06V20B EAST MESHLYNN TOPS Irrigation 0.062 0.03V20B EREMIA Irrigation 0.2 0.06V20B GRANCHESTER Irrigation 0.266 0.08V20B KANGATONG Irrigation 0.22 0.1V20B MESHLYNN BIG Irrigation 0.6 0.06V20B MESHLYNN KLOOF Irrigation 0.073 0.04V20B MOERAS VLEI Irrigation 0.15 0.07V20B PROSPERITY Irrigation 0.1 0.04V20B REDCLIFFE Irrigation 0.15 0.08V20B REY Irrigation 0.18 0.07V20B RONDAVEL Irrigation 0.13 0.09V20B SOLITUDE Irrigation 0.16 0.06V20B SOURVELDT Irrigation 0.56 0.19V20B SPRINGVALE Irrigation 0.15 0.08V20B STRAWBERRY Irrigation 0.09 0.03V20B SWYTHERNBY Irrigation 0.35 0.11V20B TEMBU Irrigation 0.06 0.03V20B TRENT LODGE Irrigation 0.06 0.02V20C FOREST LODGE Irrigation 1.15 0.43V20C HLATIKULU Irrigation 0.085 0.05V20C LITTLE FALLS Leisure 0.115 0.06V20C POTATOES Irrigation 0.05 0.03V20C STAGSTONES Irrigation 0.22 0.08V20C TIGERHOEK DAM NO. 1 Irrigation 0.07 0.02V20C ZONK LAKE Irrigation 0.45 0.3V20D AVON DAM NO. 1 Irrigation 0.15 0.05V20D BALLINA Irrigation 0.05 0.02V20D BROEDERSHOEK Irrigation 0.107 0.03V20D CARSHALTON Irrigation 0.136 0.06V20D CRIEFF Irrigation 0.182 0.07V20D CROMPTON Irrigation 0.068 0.04
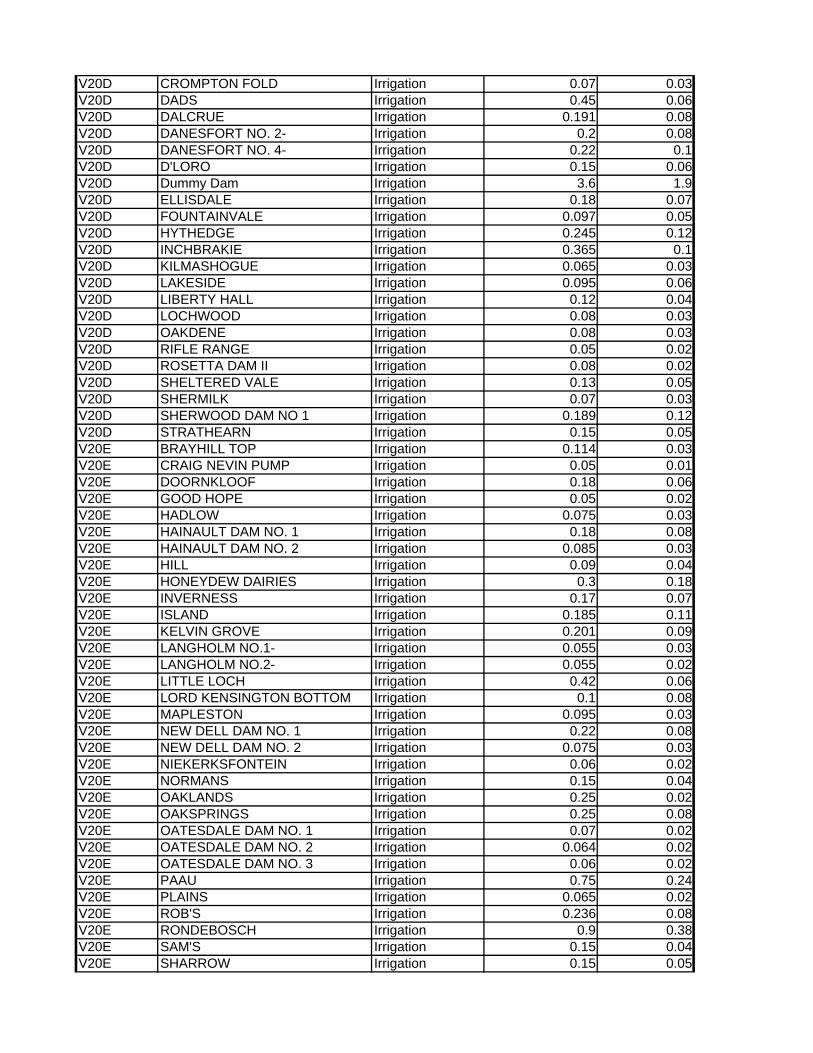
V20D CROMPTON FOLD Irrigation 0.07 0.03V20D DADS Irrigation 0.45 0.06V20D DALCRUE Irrigation 0.191 0.08V20D DANESFORT NO. 2- Irrigation 0.2 0.08V20D DANESFORT NO. 4- Irrigation 0.22 0.1V20D D'LORO Irrigation 0.15 0.06V20D Dummy Dam Irrigation 3.6 1.9V20D ELLISDALE Irrigation 0.18 0.07V20D FOUNTAINVALE Irrigation 0.097 0.05V20D HYTHEDGE Irrigation 0.245 0.12V20D INCHBRAKIE Irrigation 0.365 0.1V20D KILMASHOGUE Irrigation 0.065 0.03V20D LAKESIDE Irrigation 0.095 0.06V20D LIBERTY HALL Irrigation 0.12 0.04V20D LOCHWOOD Irrigation 0.08 0.03V20D OAKDENE Irrigation 0.08 0.03V20D RIFLE RANGE Irrigation 0.05 0.02V20D ROSETTA DAM II Irrigation 0.08 0.02V20D SHELTERED VALE Irrigation 0.13 0.05V20D SHERMILK Irrigation 0.07 0.03V20D SHERWOOD DAM NO 1 Irrigation 0.189 0.12V20D STRATHEARN Irrigation 0.15 0.05V20E BRAYHILL TOP Irrigation 0.114 0.03V20E CRAIG NEVIN PUMP Irrigation 0.05 0.01V20E DOORNKLOOF Irrigation 0.18 0.06V20E GOOD HOPE Irrigation 0.05 0.02V20E HADLOW Irrigation 0.075 0.03V20E HAINAULT DAM NO. 1 Irrigation 0.18 0.08V20E HAINAULT DAM NO. 2 Irrigation 0.085 0.03V20E HILL Irrigation 0.09 0.04V20E HONEYDEW DAIRIES Irrigation 0.3 0.18V20E INVERNESS Irrigation 0.17 0.07V20E ISLAND Irrigation 0.185 0.11V20E KELVIN GROVE Irrigation 0.201 0.09V20E LANGHOLM NO.1- Irrigation 0.055 0.03V20E LANGHOLM NO.2- Irrigation 0.055 0.02V20E LITTLE LOCH Irrigation 0.42 0.06V20E LORD KENSINGTON BOTTOM Irrigation 0.1 0.08V20E MAPLESTON Irrigation 0.095 0.03V20E NEW DELL DAM NO. 1 Irrigation 0.22 0.08V20E NEW DELL DAM NO. 2 Irrigation 0.075 0.03V20E NIEKERKSFONTEIN Irrigation 0.06 0.02V20E NORMANS Irrigation 0.15 0.04V20E OAKLANDS Irrigation 0.25 0.02V20E OAKSPRINGS Irrigation 0.25 0.08V20E OATESDALE DAM NO. 1 Irrigation 0.07 0.02V20E OATESDALE DAM NO. 2 Irrigation 0.064 0.02V20E OATESDALE DAM NO. 3 Irrigation 0.06 0.02V20E PAAU Irrigation 0.75 0.24V20E PLAINS Irrigation 0.065 0.02V20E ROB'S Irrigation 0.236 0.08V20E RONDEBOSCH Irrigation 0.9 0.38V20E SAM'S Irrigation 0.15 0.04V20E SHARROW Irrigation 0.15 0.05

V20E SINKWAZI Irrigation 0.07 0.03V20E SUMMER HILL STUD Irrigation 0.2 0.05V20E WARLEY COMMON Irrigation 0.34 0.18V20F CRAIGIE BURN Irrigation 23.43 2.07V20F DAIRY Irrigation 0.252 0.07V20F GREENWICH Irrigation 0.445 0.16V20F MOUNT ALIDA TOP Irrigation 0.13 0.04V20F ROY'S Irrigation 0.23 0.12V20H DOUBLE DIAMOND Irrigation 0.165 0.05V20H Dummy Dam Irrigation 4.94 2.4V20H WATERFALL Irrigation 0.167 0.06
V31A MARTINSDomestic Water Use 0.295 0.02
V31A ZAAIHOEKDomestic Water Use 192.986 12.43
V31B MAHAWANEDomestic Water Use 2.1 0.51
V31C DUMFIRMLINE Irrigation 0.656 0.2
V31E CHELMSFORDDomestic Water Use 198.438 34.43
V31EDURBAN NAVIGATION COLLIERIES DAM NO. 2
Domestic Water Use 0.091 0.09
V31EDURBAN NAVIGATION COLLIERIES DAM NO. 3
Domestic Water Use 0.363 0.25
V31EDURBAN NAVIGATION COLLIERIES DAM NO. 4
Domestic Water Use 0.399 0.2
V31EDURBAN NAVIGATION COLLIERIES DAM NO. 7
Domestic Water Use 0.213 0.09
V31EDURBAN NAVIGATION COLLIERY NO. 7 MINE SLURRY Outflow 0.163 0.07
V31EDURBAN NAVIGATION COLLIERY NO. 7 MINE SLURRY Outflow 0.258 0.12
V31E FAURE DAM 2 Irrigation 0.18 0.03V31E FAURE DAM NO 1 Irrigation 0.053 0.02V31E HAIG Irrigation 0.22 0.06V31E STERKFONTEIN Irrigation 0.197 0.09V31F KINGSTON-ROOI Irrigation 0.249 0.08V31G ALBERTSE DAM NO. 4 Irrigation 0.3 0.05V31G BOYSKRAAL DAM NO. 1 Irrigation 0.16 0.04
V31GDURBAN NAVIGATION COLLIERIES DAM NO. 1
Domestic Water Use 0.545 0.16
V31G HATTINGSPRUIT DAMDomestic Water Use 1.89 0.55
V31G LANGLEY DAM NO. 2 Irrigation 0.25 0.04V31G LANGLEYDALE DAM NO. 3 Irrigation 0.3 0.02
V31J BOSCHOEK WEIRDomestic Water Use 0.255 0.1
V31K AMCOR Leisure 0.48 0.28V32C SANDSPRUIT IRRIGATION Irrigation 0.123 0.08V32D BESPROEIINGS Irrigation 0.25 0.1V32D KWAGGASDRIFT NO. 1 Irrigation 1 0.25V32D KWAGGASDRIFT NO. 2 Irrigation 0.2 0.1V32E ASHDENE DAM NO. 1 Irrigation 0.225 0.07V32E ASHDENE DAM NO. 2 Irrigation 0.054 0.04

V32E DONALD McHARDYDomestic Water Use 2.5 0.71
V32E ELLIES GLEN Irrigation 0.08 0.02
V32E KLIPRANDDomestic Water Use 0.24 0.11
V32E LOWER MPATEDomestic Water Use 0.128 0.02
V32E PRESTONDomestic Water Use 0.268 0.13
V32E TOM WORTHINGTONDomestic Water Use 1.9 0.55
V32E UPPER MPATEDomestic Water Use 0.264 0.05
V32E VERDRUKDomestic Water Use 0.809 0.29
V32G A.F.C. MUHL MEMORIAL Irrigation 0.75 0.34V32G HEYWOOD Irrigation 0.236 0.11V32G WATER IRRIGATION Irrigation 0.1 0.03V40E DOUGVALE Irrigation 0.18 0.05V50B SILVERSTREAM Irrigation 0.08 0.01V50B SILVERSTREAM DAM NO. 2 Irrigation 0.13 0.03V50D CROWN HILL Irrigation 0.089 0.03V50D DUMBARTON Irrigation 0.075 0.03V60B MIELIETUINHOEK Irrigation 0.9 0.25V60B MON REPOS Irrigation 0.05 0.02
V60BQUAGGAS KIRK DAM NO 1 (KALLIE SE DAM) Irrigation 0.321 0.06
V60B QUAGGAS KIRK DAM NO. 2 Irrigation 0.09 0.02V60B UP GEORGE Irrigation 0.155 0.03V60B WAAGSTUK Irrigation 0.25 0.1V60B WATERFALL) Irrigation 10.3 2.4V60D DAVELSVLAKTE DAM NO. 1 Irrigation 0.135 0.03V60D STRUISVOGELPOORT Irrigation 0.023 0.01V60D VLEIPOORT Irrigation 0.508 0.31V60E VALHALLA DAM NO 1 Information 0.09 0.03V60E VALHALLA DAM NO 2 Irrigation 0.062 0.03V60E VERMAAKSKRAAL Irrigation 0.188 0.06V60K ALLENDALE LOWER Irrigation 0.21 0.07V70C MERCURY Irrigation 0.12 0.05V70C WAGENDRIFT Irrigation 58.36 5.08V70E BAYHILL OAK Irrigation 0.228 0.06V70F HILLANDALE Irrigation 0.063 0.02V70F MTSHEZANA Irrigation 0.51 0.15V70F OAKLANDS DAM NR. 2 Irrigation 0.15 0.04V70G MERTHLEY Irrigation 1.138 0.74V70G TWYFELFONTEIN NO. 1- Irrigation 0.122 0.02V70G TWYFELFONTEIN NO. 2- Irrigation 0.153 0.02