Embed Size (px)
Citation preview

The Commonwealth of Massachusetts
Return
of the
Municipal Light Department of
the Town of
to the
Department of Public Utilities
of Massachusetts
For the Year ended December 31,
2019
Name of officer to whom correspondence should Jonathan Fitchbe addressed regarding this report: Office address: 4 Crescent StreetOfficial title: Manager West Boylston, MA 01583Form AC-19
WEST BOYLSTON

324 Grove Street Worcester MA, 01605 • 54 East Main Street Webster MA, 01570
Tel: 508.757.5957 • Fax: 1.508.422.0883 • Email: [email protected] • Web: www.gsamycpa.com The Never Underestimate The Value®
The Board of Commissioners West Boylston Municipal Lighting Plant West Boylston, MA 01583 Management is responsible for the accompanying financial statements of West Boylston Municipal Lighting Plant, which comprise the balance sheet as of December 31, 2019, and the related statements of income and unappropriated retained earnings for the year then ended, included in the accompanying prescribed form in accordance with accounting principles generally accepted in the United States of America. We have performed a compilation engagement in accordance with Statements on Standards for Accounting and Review Services promulgated by the Accounting and Review Services Committee of the AICPA. We did not audit or review the financial statements included in the accompanying prescribed form nor were we required to perform any procedures to verify the accuracy or completeness of the information provided by management. Accordingly, we do not express an opinion, a conclusion, nor provide any form of assurance on the financial statements in the accompanying prescribed form. The financial statements included in the accompanying prescribed form are intended to comply with the requirements of the Massachusetts Department of Public Utilities, and are not intended to be a presentation in accordance with accounting principles generally accepted in the United States of America. This report is intended solely for the information and use of West Boylston Municipal Lighting Plant and the Massachusetts Department of Public Utilities, and is not intended to be and should not be used by anyone other than these specified parties. Goulet, Salvidio & Associates P.C.
Worcester, Massachusetts July 1, 2020

Page 2
TABLE OF CONTENTSPage
General Information 3Schedule of Estimates 4Customers in each City or Town 4Appropriations Since Beginning of Year 5Changes in the Property 5Bonds 6Town Notes 7Cost of Plant 8- 8BComparative Balance Sheet 10-11Income Statement 12Earned Surplus 12Cash Balances 14Materials and Supplies 14Depreciation Fund Account 14Utility Plant-Electric 15-17Production Fuel and Oil Stocks 18Miscellaneous Nonoperating Income 21Other Income Deductions 21Miscellaneous Credits to Surplus 21Miscellaneous Debits to Surplus 21Appropriations of Surplus 21Municipal Revenues 22Purchased Power 22Sales for Resale 22Electric Operating Revenues 37Sales of Electricity to Ultimate Consumers 38Electric Operation and Maintenance Expenses 39-42Taxes Charged During Year 49Other Utility Operating Income 50Income from Merchandising, Jobbing and Contract Work 51Sales for Resale 52-53Purchased Power (except Interchange) 54-55Interchange Power 56Electric Energy Account 57Monthly Peaks and Output 57Generating Station Statistics 58-59Steam Generating Stations 60-61Hydroelectric Generating Stations 62-63Combustion Engine and Other Generating Stations 64-65Generating Statistics (Small Stations) 66Transmission Line Statistics 67Substations 68Overhead Distribution Lines Operated 69Electric Distribution Services, Meters, and Line Transformers 69Conduit, Underground Cable and Submarine Cable 70Streetlamps 71Rate Schedule Information 79Signature Page 81
FOR GAS PLANTS ONLY: Page Page
Utility Plant - Gas 19-20 Gas Generating Plant 74Gas Operating Revenues 43 Boilers 75Sales of Gas to Ultimate Customers 44 Scrubbers, Condensers & Exhausters 75Gas Operation & Maintenance Expenses 45-47 Purifiers 76Purchased Gas 48 Holders 76Sales for Resale 48 Transmission and Distribution Mains 77Sales of Residuals 48 Gas Distribution Services, House Record of Sendout for the Year in MCF 72-73 Governors and Meters 78
PAGES INTENTIONALLY OMITTED : 9, 13, 23 TO 36, 80
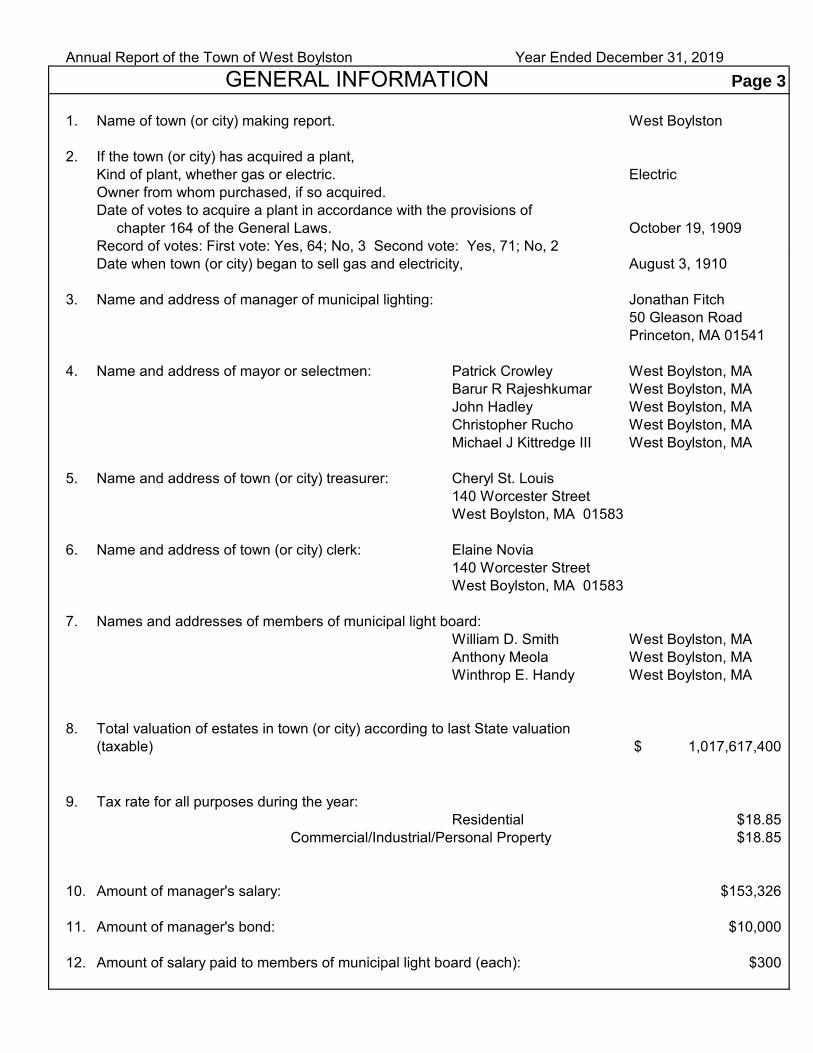
Annual Report of the Town of West BoylstonGENERAL INFORMATION Page 3
1. Name of town (or city) making report. West Boylston
2. If the town (or city) has acquired a plant,Kind of plant, whether gas or electric. ElectricOwner from whom purchased, if so acquired.Date of votes to acquire a plant in accordance with the provisions of chapter 164 of the General Laws. October 19, 1909Record of votes: First vote: Yes, 64; No, 3 Second vote: Yes, 71; No, 2 Date when town (or city) began to sell gas and electricity, August 3, 1910
3. Name and address of manager of municipal lighting: Jonathan Fitch 50 Gleason RoadPrinceton, MA 01541
4. Name and address of mayor or selectmen: Patrick Crowley West Boylston, MABarur R Rajeshkumar West Boylston, MAJohn Hadley West Boylston, MAChristopher Rucho West Boylston, MAMichael J Kittredge III West Boylston, MA
5. Name and address of town (or city) treasurer: Cheryl St. Louis140 Worcester StreetWest Boylston, MA 01583
6. Name and address of town (or city) clerk: Elaine Novia140 Worcester StreetWest Boylston, MA 01583
7. Names and addresses of members of municipal light board:William D. Smith West Boylston, MAAnthony Meola West Boylston, MAWinthrop E. Handy West Boylston, MA
8. Total valuation of estates in town (or city) according to last State valuation(taxable) 1,017,617,400$
9. Tax rate for all purposes during the year:Residential $18.85
Commercial/Industrial/Personal Property $18.85
10. Amount of manager's salary: $153,326
11. Amount of manager's bond: $10,000
12. Amount of salary paid to members of municipal light board (each): $300
Year Ended December 31, 2019

Annual Report of the Town of West Boylston Year Ended December 31, 2019 Page 4
FURNISH SCHEDULE OF ESTIMATES REQUIRED BY GENERAL LAWS, CHAPTER 164, SECTION 57FOR GAS AND ELECTRIC LIGHT PLANTS FOR THE FISCAL YEAR, ENDING DECEMBER 31, NEXT.
AmountINCOME FROM PRIVATE CONSUMERS:
1 From sales of gas2 From sales of electricity 8,400,0003 TOTAL 8,400,00045 EXPENSES
6 For operation, maintenance and repairs 6,500,0007 For interest on bonds, notes or scrip8 For depreciation fund ( 3 % 17,458,109 as per page 8B) 523,7439 For sinking fund requirements
10 For note payments 312,00711 For bond payments 135,00012 For loss in preceding year13 TOTAL 7,470,7501415 COST:
16 Of gas to be used for municipal buildings17 Of gas to be used for street lights18 Of electricity to be used for municipal buildings 215,00019 Of electricity to be used for street lights 85,00020 Total of above items to be included in the tax levy 300,0002122 New construction to be included in the tax levy23 Total amounts to be included in the tax levy 300,000
CUSTOMERS
Names of cities or towns in which the plant Names of cities or towns in which the plant suppliessupplies GAS, with the number of customers' ELECTRICITY, with the number of customers' meters in each. meters in each.
Number NumberCity or Town of Customers' City or Town of Customers'
Meters, Dec. 31 Meters, Dec. 31West Boylston 3,726
TOTAL 0 TOTAL 3,726
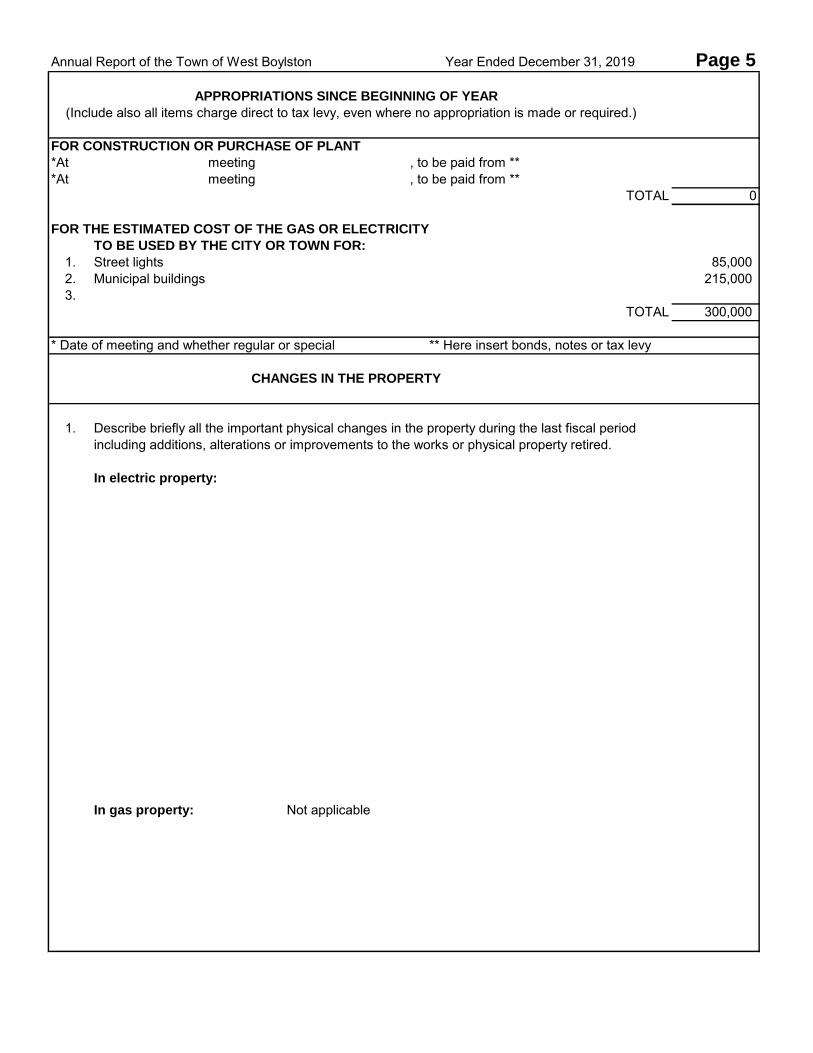
Annual Report of the Town of West Boylston Year Ended December 31, 2019 Page 5
APPROPRIATIONS SINCE BEGINNING OF YEAR
(Include also all items charge direct to tax levy, even where no appropriation is made or required.)
FOR CONSTRUCTION OR PURCHASE OF PLANT
*At meeting , to be paid from ***At meeting , to be paid from **
TOTAL 0
FOR THE ESTIMATED COST OF THE GAS OR ELECTRICITY
TO BE USED BY THE CITY OR TOWN FOR:
1. Street lights 85,0002. Municipal buildings 215,0003.
TOTAL 300,000
* Date of meeting and whether regular or special ** Here insert bonds, notes or tax levy
CHANGES IN THE PROPERTY
1. Describe briefly all the important physical changes in the property during the last fiscal periodincluding additions, alterations or improvements to the works or physical property retired.
In electric property:
In gas property: Not applicable
Page 6 Annual Report of the Town of West Boylston Year Ended December 31, 2019
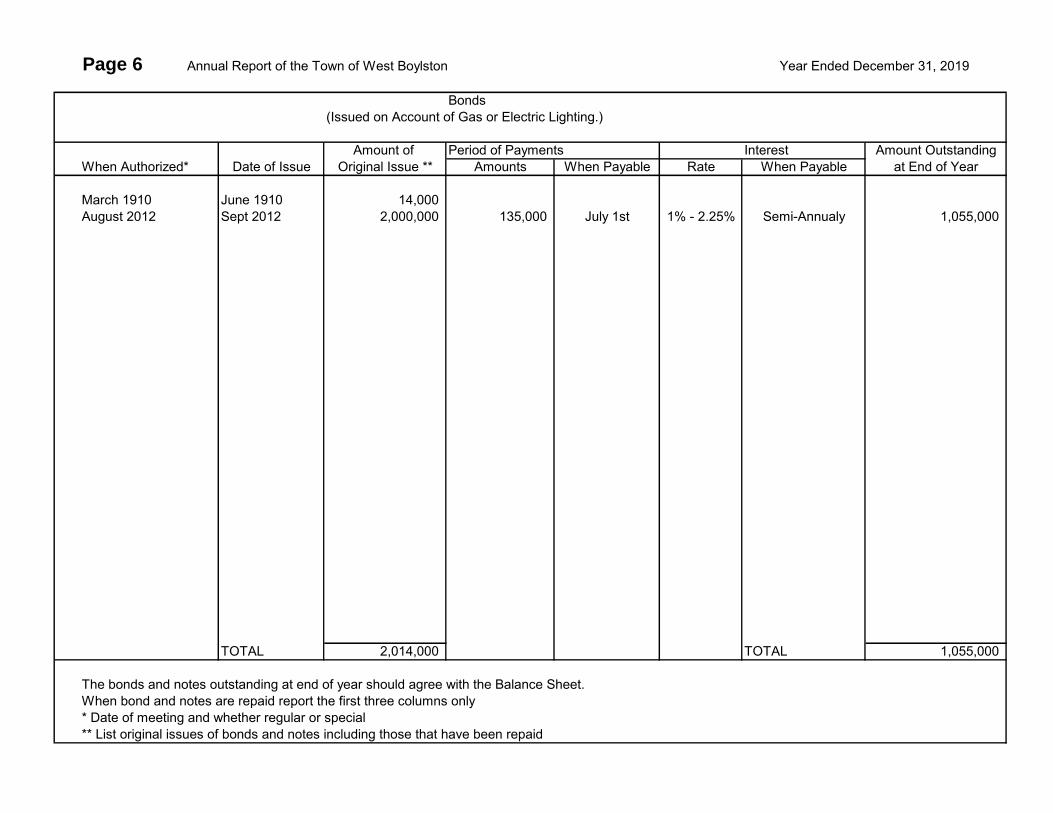
Bonds(Issued on Account of Gas or Electric Lighting.)
Amount of Period of Payments Interest Amount OutstandingWhen Authorized* Date of Issue Original Issue ** Amounts When Payable Rate When Payable at End of Year
March 1910 June 1910 14,000August 2012 Sept 2012 2,000,000 135,000 July 1st 1% - 2.25% Semi-Annualy 1,055,000
TOTAL 2,014,000 TOTAL 1,055,000
The bonds and notes outstanding at end of year should agree with the Balance Sheet.When bond and notes are repaid report the first three columns only* Date of meeting and whether regular or special** List original issues of bonds and notes including those that have been repaid

Page 7 Annual Report of the Town of West Boylston Year Ended December 31, 2019
Town Notes(Issued on Account of Gas or Electric Lighting.)
Amount of Period of Payments Interest Amount OutstandingWhen Authorized* Date of Issue Original Issue ** Amounts When Payable Rate When Payable at End of Year
June 2016 August 2016 4,649,198 N/A N/A 1.75% Monthly -$ June 2016 March 2017 4,680,105 26,001$ Monthly 3.15% Monthly 3,796,085
TOTAL 9,329,303 TOTAL 3,796,085$
The bonds and notes outstanding at end of year should agree with the Balance Sheet.When bond and notes are repaid report the first three columns only* Date of meeting and whether regular or special** List original issues of bonds and notes including those that have been repaid

Page 8 Annual Report of the Town of West Boylston Year Ended December 31, 2019TOTAL COST OF PLANT - ELECTRIC
1. Report below the cost of utility plant in service preceding year. Such items should be included in effect of such amounts.according to prescribed accounts column (c) or (d) as appropriate. 4. Reclassifications or transfers within utility plant2. Do not include as adjustments, corrections of 3 . Credit adjustments of plant accounts should be accounts should be shown in column (f).additions and retirements for the current or the enclosed in parentheses to indicate the negative
Balance Balance
Line Account Beginning of Year Additions Retirements Adjustments Transfers End of Year
No. (a) (b) (c) (d) (e) (f) (g)
1 1. INTANGIBLE PLANT234 0 0 0 0 0 05 2. PRODUCTION PLANT6 A. Steam Production7 310 Land and Land Rights8 311 Structures and Improvements9 312 Boiler Plant Equipment
10 313 Engines and Engine Driven Generators11 314 Turbogenerator Units12 315 Accessory Electric Equipment13 316 Miscellaneous Power Plant Equipment15 Total Steam Production Plant 0 0 0 0 0 016 B. Nuclear Production Plant17 320 Land and Land Rights18 321 Structures and Improvements19 322 Reactor Plant Equipment20 323 Turbogenerator Units21 324 Accessory Electric Equipment22 325 Miscellaneous Power Plant Equipment
Total Nuclear Production Plant 0 0 0 0 0 0

Page 8A Annual Report of the Town of West Boylston Year Ended December 31, 2019
TOTAL COST OF PLANT - ELECTRIC (Continued)
Balance Balance
Line Account Beginning of Year Additions Retirements Adjustments Transfers End of Year
No. (a) (b) (c) (d) (e) (f) (g)
1 C. Hydraulic Production Plant2 330 Land and Land Rights3 331 Structures and Improvements4 332 Reservoirs, Dams and Waterways5 333 Water Wheels, Turbines and Generators6 334 Accessory Electric Equipment7 335 Miscellaneous Power Plant Equipment8 336 Roads, Railroads and Bridges9 Total Hydraulic Production Plant 0 0 0 0 0 0
10 D. Other Production Plant11 340 Land and Land Rights12 341 Structures and Improvements13 342 Fuel Holders, Producers and Accessories14 343 Prime Movers15 344 Generators 4,375,965 0 0 4,375,96516 345 Accessory Electric Equipment17 346 Miscellaneous Power Plant Equipment18 Total Other Production Plant 4,375,965 0 0 0 0 4,375,96519 Total Production Plant 4,375,965 0 0 0 0 4,375,96520 3. Transmission Plant21 350 Land and Land Rights22 351 Clearing Land and Rights of Way23 352 Structures and Improvements24 353 Station Equipment25 354 Towers and Fixtures26 355 Poles and Fixtures27 356 Overhead Conductors and Devices28 357 Underground Conduit29 358 Underground Conductors and Devices30 359 Roads and Trails31 Total Transmission Plant 0 0 0 0 0 0

Page 8B Next Page is 10 Annual Report of the Town of West Boylston Year Ended December 31, 2019TOTAL COST OF PLANT (Concluded)
Line Balance Balance
No. Account Beginning of Year Additions Retirements Adjustments Transfers End of Year
(a) (b) (c) (d) (e) (f) (g)
1 4. DISTRIBUTION PLANT2 360 Land and Land Rights 2,993 0 0 2,9933 361 Structures and Improvements 17,566 0 0 17,5664 362 Station Equipment 3,245,182 544,420 0 3,789,6025 363 Storage Battery Equipment 0 0 0 06 364 Poles Towers and Fixtures 1,451,317 77,107 (19,028) 1,509,3967 365 Overhead Conductors and Devices 2,572,742 36,208 0 2,608,9508 366 Underground Conduit 209,884 4,574 0 214,4589 367 Underground Conductors and Devices 239,269 0 0 239,269
10 368 Line Transformers 848,566 36,905 (21,297) 864,17411 369 Services 443,117 4,518 0 447,63512 370 Meters 343,016 2,262 0 345,27813 371 Installations on Customer's Premises 24,914 0 0 24,91414 372 Leased Prop on Customer's Premises 69,631 6,632 0 76,26315 373 Streetlight and Signal Systems 214,947 1,136 0 216,08316 Total Distribution Plant 9,683,144 713,762 (40,325) 0 0 10,356,58117 5. GENERAL PLANT18 389 Land and Land Rights 663,435 0 0 663,43519 390 Structures and Improvements 844,628 0 0 844,62820 391 Office Furniture and Equipment 451,605 0 0 451,60521 392 Transportation Equipment 910,500 338,160 (120,375) 1,128,28522 393 Stores Equipment 7,456 0 0 7,45623 394 Tools, Shop and Garage Equipment 75,899 0 0 75,89924 395 Laboratory Equipment 46,370 0 0 46,37025 396 Power Operated Equipment 0 0 0 026 397 Communication Equipment 150,915 0 0 150,91527 398 Miscellaneous Equipment 8,398 0 0 8,39828 399 Other Tangible Property 15,000 0 0 15,00029 Total General Plant 3,174,206 338,160 (120,375) 0 0 3,391,99130 Total Electric Plant in Service 17,233,315 1,051,922 (160,700) 0 0 18,124,53731 Total Cost of Electric Plant.................... 18,124,53733 Less Cost of Land, Land Rights, Rights of Way................. 666,42834 Total Cost upon which Depreciation is based ........................ 17,458,109
The above figures should show the original cost of the existing property. In case any part of the property is sold or retired, the cost of such propertyshould be deducted from the cost of the plant. The net cost of the property, less the land value, should be taken as a basis for figuring depreciation.

Page 9 Annual Report of the Town of West Boylston Year Ended December 31, 2019
PAGE 9 IS A BLANK PAGE
Annual Report of the Town of West Boylston Year Ended December 31, 2019 Page 10
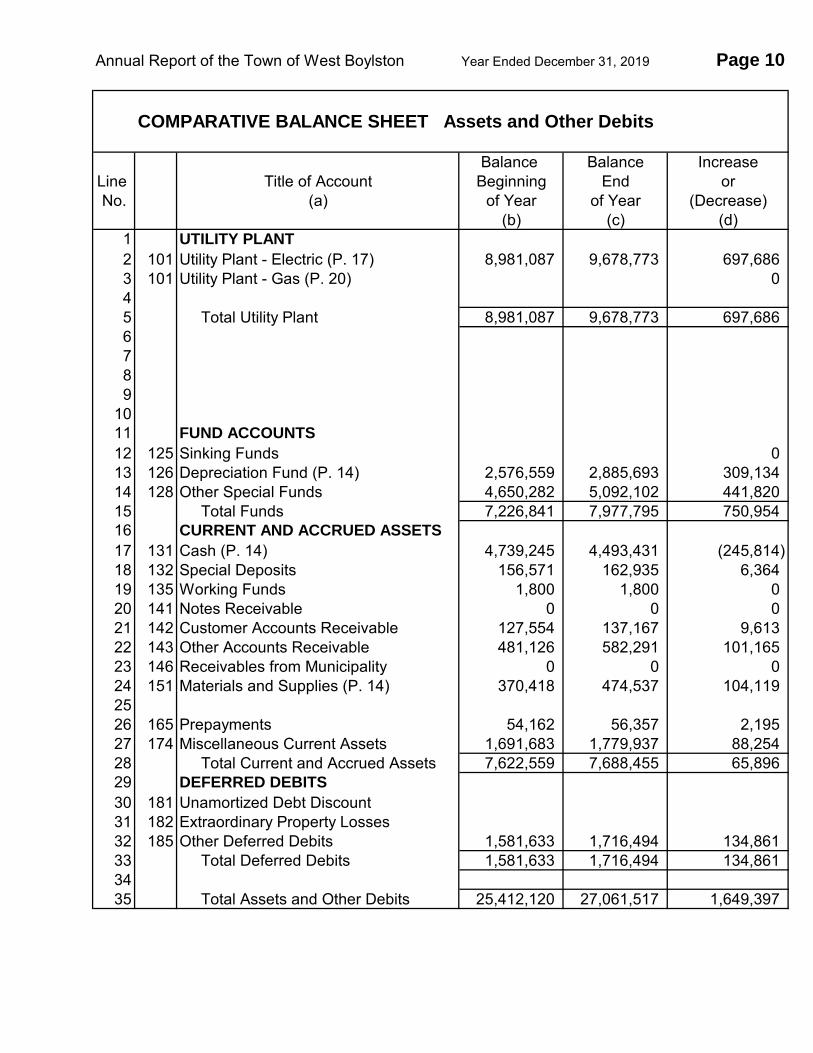
COMPARATIVE BALANCE SHEET Assets and Other Debits
Balance Balance IncreaseLine Title of Account Beginning End orNo. (a) of Year of Year (Decrease)
(b) (c) (d)1 UTILITY PLANT
2 101 Utility Plant - Electric (P. 17) 8,981,087 9,678,773 697,6863 101 Utility Plant - Gas (P. 20) 045 Total Utility Plant 8,981,087 9,678,773 697,6866789
1011 FUND ACCOUNTS
12 125 Sinking Funds 013 126 Depreciation Fund (P. 14) 2,576,559 2,885,693 309,13414 128 Other Special Funds 4,650,282 5,092,102 441,82015 Total Funds 7,226,841 7,977,795 750,95416 CURRENT AND ACCRUED ASSETS
17 131 Cash (P. 14) 4,739,245 4,493,431 (245,814)18 132 Special Deposits 156,571 162,935 6,36419 135 Working Funds 1,800 1,800 020 141 Notes Receivable 0 0 021 142 Customer Accounts Receivable 127,554 137,167 9,61322 143 Other Accounts Receivable 481,126 582,291 101,16523 146 Receivables from Municipality 0 0 024 151 Materials and Supplies (P. 14) 370,418 474,537 104,1192526 165 Prepayments 54,162 56,357 2,19527 174 Miscellaneous Current Assets 1,691,683 1,779,937 88,25428 Total Current and Accrued Assets 7,622,559 7,688,455 65,89629 DEFERRED DEBITS
30 181 Unamortized Debt Discount31 182 Extraordinary Property Losses 32 185 Other Deferred Debits 1,581,633 1,716,494 134,86133 Total Deferred Debits 1,581,633 1,716,494 134,8613435 Total Assets and Other Debits 25,412,120 27,061,517 1,649,397

Annual Report of the Town of West Boylston Year Ended December 31, 2019 Page 11
COMPARATIVE BALANCE SHEET Liabilities and Other Credits
Balance Balance IncreaseLine Title of Account Beginning End orNo. (a) of Year of Year (Decrease)
(b) (c) (d)1 APPROPRIATIONS
2 201 Appropriations for Construction 0 0 03 SURPLUS
4 205 Sinking Fund Reserves 05 206 Loans Repayment 14,000 14,000 06 207 Appropriations for Construction Repayments 21,935 21,935 07 208 Unappropriated Earned Surplus (P. 12) 11,191,925 12,799,544 1,607,6198 Total Surplus 11,227,860 12,835,479 1,607,6199 LONG TERM DEBT
10 221 Bonds (P. 6) 1,190,000 1,055,000 (135,000)11 231 Notes Payable (P. 7) 4,108,092 3,796,085 (312,007)12 Total Bonds and Notes 5,298,092 4,851,085 (447,007)13 CURRENT AND ACCRUED LIABILITIES
14 232 Accounts Payable 753,511 699,757 (53,754)15 234 Payables to Municipality 0 0 016 235 Customers' Deposits 156,571 162,935 6,36417 236 Taxes Accrued 0 0 018 237 Interest Accrued 0 0 019 242 Miscellaneous Current and Accrued Liabilities 33,843 48,086 14,24320 Total Current and Accrued Liabilities 943,925 910,778 (33,147)21 DEFERRED CREDITS
22 251 Unamortized Premium on Debt 16,149 14,251 (1,898)23 252 Customer Advances for Construction 0 22,197 22,19724 253 Other Deferred Credits 837,624 599,759 (237,865)25 Total Deferred Credits 853,773 636,207 (217,566)26 RESERVES
27 260 Reserves for Uncollectible Accounts 11,528 11,528 028 261 Property Insurance Reserve 0 0 029 262 Injuries and Damages Reserves 0 0 030 263 Pensions and Benefits Reserves 2,988,666 3,254,697 266,03131 265 Miscellaneous Operating Reserves 4,088,276 4,561,743 473,46732 Total Reserves 7,088,470 7,827,968 739,49833 CONTRIBUTIONS IN AID OF
CONSTRUCTION
34 271 Contributions in Aid of Construction 035 Total Liabilities and Other Credits 25,412,120 27,061,517 1,649,397
State below if any earning of the municipal lighting plant have been used for any purpose other
than discharging indebtedness of the plant, the purpose for which used, and the amount thereof.

Annual Report of the Town of West Boylston Year Ended December 31, 2019 Page 12
STATEMENT OF INCOME FOR THE YEARIncrease or
Line Account Current Year (Decrease) fromNo. (a) (b) Preceding Year
(c)1 OPERATING INCOME
2 400 Operating Revenues (P. 37 and 43) 7,726,393 (395,009)3 Operating Expenses:4 401 Operation Expense (p. 42 and 47) 5,634,776 125,7065 402 Maintenance Expense 666,243 242,4756 403 Depreciation Expense 497,007 7,6437 407 Amortization of Property Losses 0 089 408 Taxes (P. 49) 0
10 Total Operating Expenses 6,798,026 375,82411 Operating Income 928,367 (770,833)12 414 Other Utility Operating Income (P. 50) 0 01314 Total Operating Income 928,367 (770,833)15 OTHER INCOME
16 415 Income from Merchandising, Jobbing, and Contract Work (P. 51) 74,591 18,037
17 419 Interest Income 600,529 588,26518 421 Miscellaneous Nonoperating Income (P. 21) 157,666 157,66619 Total Other Income 832,786 763,96820 Total Income 1,761,153 (6,865)21 MISCELLANEOUS INCOME DEDUCTIONS
22 425 Miscellaneous Amortization 0 023 426 Other Income Deductions 0 024 Total Income Deductions 0 025 Income Before Interest Charges 1,761,153 (6,865)26 INTEREST CHARGES
27 427 Interest on Bonds and Notes 153,291 (12,340)28 428 Amortization of Debt Discount and Expense 0 029 429 Amortization of Premium on Debt - Credit (1,898) 030 431 Other Interest Expense 2,141 (3,521)31 432 Interest: Charged to Construction - Credit 0 032 Total Interest Charges 153,534 (15,861)33 NET INCOME 1,607,619 8,996
EARNED SURPLUS
Line Account Debits CreditsNo. (a) (b) (c)
34 208 Unappropriated Earned Surplus (at beginning of period) 11,191,925353637 433 Balance Transferred from Income 1,607,61938 434 Miscellaneous Credits to Surplus (P. 21) 039 435 Miscellaneous Debits to Surplus (P. 21) 040 436 Appropriations of Surplus (P. 21) 041 437 Surplus Applied to Depreciation 42 208 Unappropriated Earned Surplus (at end of period) 12,799,5444344 TOTALS 12,799,544 12,799,544
Next Page is 14
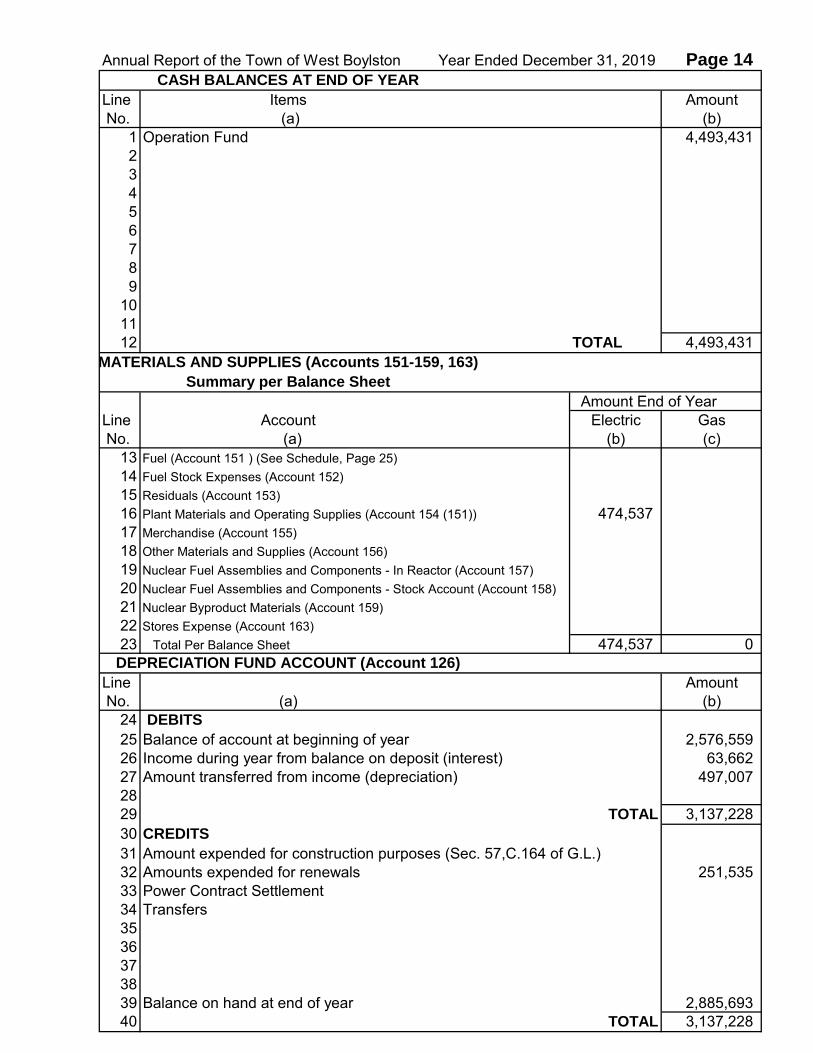
Annual Report of the Town of West Boylston Year Ended December 31, 2019 Page 14 CASH BALANCES AT END OF YEAR
Line Items Amount No. (a) (b)
1 Operation Fund 4,493,43123456789
101112 TOTAL 4,493,431
MATERIALS AND SUPPLIES (Accounts 151-159, 163)
Summary per Balance Sheet
Amount End of YearLine Account Electric Gas No. (a) (b) (c)
13 Fuel (Account 151 ) (See Schedule, Page 25)14 Fuel Stock Expenses (Account 152)15 Residuals (Account 153)16 Plant Materials and Operating Supplies (Account 154 (151)) 474,53717 Merchandise (Account 155)18 Other Materials and Supplies (Account 156)19 Nuclear Fuel Assemblies and Components - In Reactor (Account 157)20 Nuclear Fuel Assemblies and Components - Stock Account (Account 158)21 Nuclear Byproduct Materials (Account 159)22 Stores Expense (Account 163)23 Total Per Balance Sheet 474,537 0
DEPRECIATION FUND ACCOUNT (Account 126)
Line Amount No. (a) (b)
24 DEBITS
25 Balance of account at beginning of year 2,576,55926 Income during year from balance on deposit (interest) 63,66227 Amount transferred from income (depreciation) 497,00728 29 TOTAL 3,137,22830 CREDITS
31 Amount expended for construction purposes (Sec. 57,C.164 of G.L.) 32 Amounts expended for renewals 251,53533 Power Contract Settlement34 Transfers3536373839 Balance on hand at end of year 2,885,69340 TOTAL 3,137,228

Page 15 Annual Report of the Town of West Boylston Year Ended December 31, 2019UTILITY PLANT - ELECTRIC
1. Report below the cost of utility plant in service preceding year. Such items should be included in effect of such amounts.according to prescribed accounts column (c). 4. Reclassifications or transfers within utility plant
2. Do not include as adjustments, corrections of 3 . Credit adjustments of plant accounts should be accounts should be shown in column (f).additions and retirements for the current or the enclosed in parentheses to indicate the negative
Balance Adjustments BalanceLine Account Beginning of Year Additions Depreciation Other Credits Transfers End of YearNo. (a) (b) (c) (d) (e) (f) (g)
1 1. INTANGIBLE PLANT234 0 0 0 0 0 05 2. PRODUCTION PLANT6 A. Steam Production7 310 Land and Land Rights8 311 Structures and Improvements9 312 Boiler Plant Equipment
10 313 Engines and Engine Driven Generators11 314 Turbogenerator Units12 315 Accessory Electric Equipment13 316 Miscellaneous Power Plant Equipment15 Total Steam Production Plant 0 0 0 0 0 016 B. Nuclear Production Plant17 320 Land and Land Rights18 321 Structures and Improvements19 322 Reactor Plant Equipment20 323 Turbogenerator Units21 324 Accessory Electric Equipment22 325 Miscellaneous Power Plant Equipment23 Total Nuclear Production Plant 0 0 0 0 0 0

Page 16 Annual Report of the Town of West Boylston Year Ended December 31, 2019UTILITY PLANT - ELECTRIC (Continued)
Balance Adjustments BalanceLine Account Beginning of Year Additions Depreciation Other Credits Transfers End of YearNo. (a) (b) (c) (d) (e) (f) (g)
1 C. Hydraulic Production Plant2 330 Land and Land Rights3 331 Structures and Improvements4 332 Reservoirs, Dams and Waterways5 333 Water Wheels, Turbines and Generators6 334 Accessory Electric Equipment7 335 Miscellaneous Power Plant Equipment8 336 Roads, Railroads and Bridges9 Total Hydraulic Production Plant 0 0 0 0 0 0
10 D. Other Production Plant11 340 Land and Land Rights12 341 Structures and Improvements13 342 Fuel Holders, Producers and Accessories14 343 Prime Movers15 344 Generators 4,003,160 0 131,283 0 0 3,871,87716 345 Accessory Electric Equipment17 346 Miscellaneous Power Plant Equipment18 Total Other Production Plant 4,003,160 0 131,283 0 0 3,871,87719 Total Production Plant 4,003,160 0 131,283 0 0 3,871,87720 3. Transmission Plant21 350 Land and Land Rights22 351 Clearing Land and Rights of Way23 352 Structures and Improvements24 353 Station Equipment25 354 Towers and Fixtures26 355 Poles and Fixtures27 356 Overhead Conductors and Devices28 357 Underground Conduit29 358 Underground Conductors and Devices30 359 Roads and Trails31 Total Transmission Plant 0 0 0 0 0 0

Page 17 Annual Report of the Town of West Boylston Year Ended December 31, 2019UTILITY PLANT -- ELECTRIC (Continued)
Line Balance Other Adjustments BalanceNo. Account Beginning of Year Additions Depreciation Credits Transfers End of Year
(a) (b) (c) (d) (e) (f) (g)1 4. DISTRIBUTION PLANT2 360 Land and Land Rights 2,993 0 0 0 0 2,9933 361 Structures and Improvements 0 0 0 0 0 04 362 Station Equipment 2,058,001 544,420 110,748 0 0 2,491,6735 363 Storage Battery Equipment 0 0 0 0 0 06 364 Poles Towers and Fixtures 248,036 77,107 43,536 0 0 281,6077 365 Overhead Conductors and Devices 717,433 36,208 83,196 0 0 670,4458 366 Underground Conduit 282 4,574 288 0 0 4,5689 367 Underground Conductors and Devices 0 0 0 0 0 0
10 368 Line Transformers 143,883 36,905 25,452 0 0 155,33611 369 Services 28,655 4,518 13,296 0 0 19,87712 370 Meters 5,549 2,262 5,544 0 0 2,26713 371 Installations on Customer's Premises 0 0 0 0 0 014 372 Leased Prop on Customer's Premises 1,890 6,632 1,896 0 0 6,62615 373 Streetlight and Signal Systems 237,979 1,136 6,444 0 0 232,67116 Total Distribution Plant 3,444,701 713,762 290,400 0 0 3,868,06317 5. GENERAL PLANT18 389 Land and Land Rights 663,435 0 0 0 0 663,43519 390 Structures and Improvements 310,004 0 47,790 0 0 262,21420 391 Office Furniture and Equipment 1 0 0 0 0 121 392 Transportation Equipment 276,544 338,160 27,516 0 0 587,18822 393 Stores Equipment 18 0 18 0 0 023 394 Tools, Shop and Garage Equipment 0 0 0 0 0 024 395 Laboratory Equipment 0 0 0 0 0 025 396 Power Operated Equipment 0 0 0 0 0 026 397 Communication Equipment 0 0 0 0 0 027 398 Miscellaneous Equipment 0 0 0 0 0 028 399 Other Tangible Property 0 0 0 0 0 029 Total General Plant 1,250,002 338,160 75,324 0 0 1,512,83830 Total Electric Plant in Service 8,697,863 1,051,922 497,007 0 0 9,252,77831 104 Utility Plant Leased to Others 0 0 0 0 0 032 105 Property Held for Future Use 0 0 0 0 0 033 107 Construction Work in Progress 283,224 687,191 0 0 (544,420) 425,99534 Total Utility Plant Electric 8,981,087 1,739,113 497,007 0 (544,420) 9,678,773

Page 18 Next page is 21 Annual Report of the Town of West Boylston Year Ended December 31, 2019
PRODUCTION FUEL AND OIL STOCKS (Included in Account 151)(Except Nuclear Materials)
1. Report below the information called for concerning production fuel and oil stocks.2. Show quantities in tons of 2,000 lbs., gal., or Mcf., whichever unit of quantity is applicable.3. Each kind of coal or oil should be shown separately.4. Show gas and electric fuels separately by specific use.
Kinds of Fuel and OilTotal
Line Item Cost Quantity Cost Quantity CostNo. (a) (b) (c) (d) (e) (f)
1 On Hand Beginning of Year 02 Received During Year 03 TOTAL 04 Used During Year (Note A) 056789
1011 Sold or Transferred 012 TOTAL DISPOSED OF 013 BALANCE END OF YEAR 0
Kinds of Fuel and Oil - continued
Line Item Quantity Cost Quantity CostNo. (g) (h) (i) (j) (k)14 On Hand Beginning of Year15 Received During Year16 TOTAL17 Used During Year (Note A)18192021222324 Sold or Transferred25 TOTAL DISPOSED OF26 BALANCE END OF YEAR
Note A -- Indicate specific purpose for which used, e.g., Boiler Oil, Make Oil, Generator Fuel, etc.
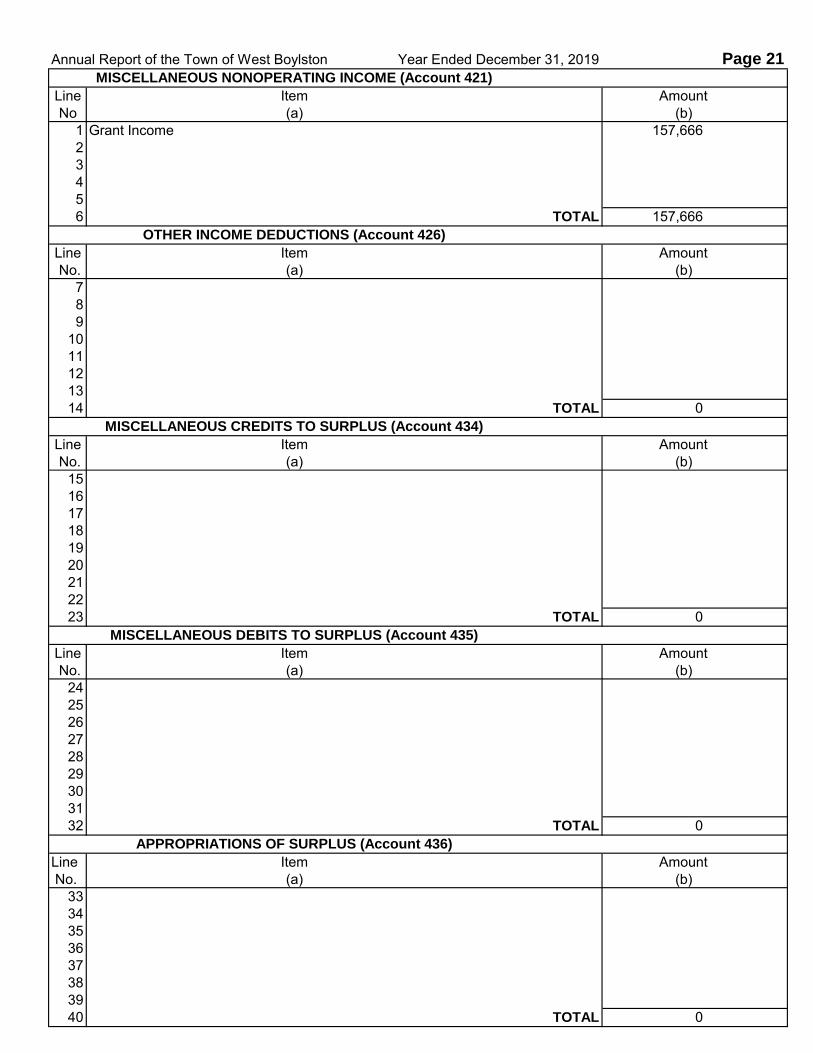
Annual Report of the Town of West Boylston Year Ended December 31, 2019 Page 21MISCELLANEOUS NONOPERATING INCOME (Account 421)
Line Item AmountNo (a) (b)
1 Grant Income 157,6662345
6 TOTAL 157,666OTHER INCOME DEDUCTIONS (Account 426)
Line Item Amount No. (a) (b)
789
1011121314 TOTAL 0
MISCELLANEOUS CREDITS TO SURPLUS (Account 434)
Line Item Amount No. (a) (b)
151617181920212223 TOTAL 0
MISCELLANEOUS DEBITS TO SURPLUS (Account 435)
Line Item Amount No. (a) (b)
242526272829303132 TOTAL 0
APPROPRIATIONS OF SURPLUS (Account 436)
Line Item Amount No. (a) (b)
3334353637383940 TOTAL 0

Annual Report of the Town of West Boylston Page 22
MUNICIPAL REVENUES (Account 482,444)
(K.W.H. Sold under the provision of Chapter 269, Acts of 1927)
Revenue Average RevenueLine Acct. Gas Schedule Cubic Feet Received Per MCF (cents)No. No. (a) (b) (c) (0.0000)
(d)1234 TOTALS
Revenue Average RevenueElectric Schedule K.W.H. Received Per KWH (cents)
(a) (b) (c) (0.0000)(d)
5 444-2 Municipal: (Other than Street Lighting) 2,643,762 393,509 0.14886 789
101112 TOTALS 2,643,762 393,509 0.148813 444-1 Street Lighting 300,970 46,170 0.153414 15 161718 TOTALS 300,970 46,170 0.153419 TOTALS 2,944,732 439,679 0.1493
PURCHASED POWER (Account 555)
Names of Utilities Cost per KWHLine from Which Electric Where and at What K.W.H Amount (cents) No. Energy is Purchased Voltage Received (0.0000)
(a) (b) (c) (d) (e)20 21 22 23 242526 272829 TOTALS 0 0 0.0000
SALES FOR RESALE (Account 447)
Names of Utilities Revenue per
Line to Which Electric Where and at What K.W.H Amount KWH (cents) No. Energy is sold Voltage Delivered (c) (d) (0.0000)
(a) (b) (e)30313233343536373839 TOTALS 0 0
Next page is 37
Year Ended December 31, 2019
Page 37 Annual Report of the Town of West Boylston Year Ended December 31, 2019
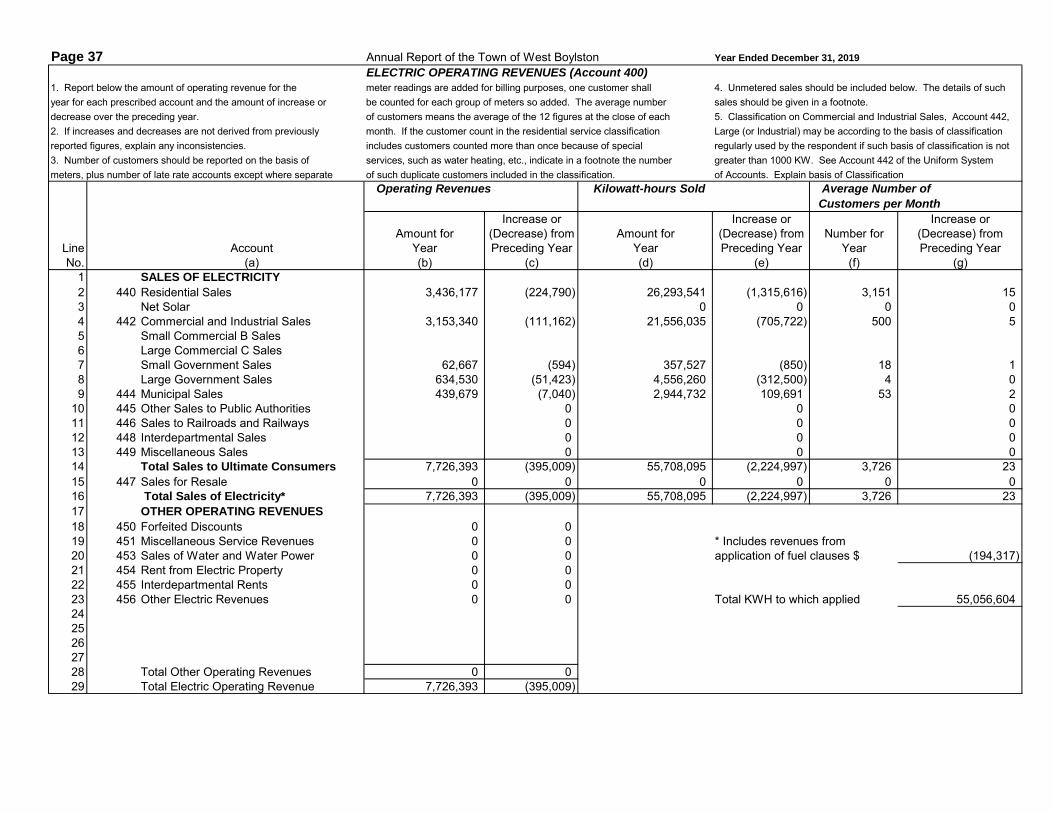
ELECTRIC OPERATING REVENUES (Account 400)
1. Report below the amount of operating revenue for the meter readings are added for billing purposes, one customer shall 4. Unmetered sales should be included below. The details of suchyear for each prescribed account and the amount of increase or be counted for each group of meters so added. The average number sales should be given in a footnote.decrease over the preceding year. of customers means the average of the 12 figures at the close of each 5. Classification on Commercial and Industrial Sales, Account 442,2. If increases and decreases are not derived from previously month. If the customer count in the residential service classification Large (or Industrial) may be according to the basis of classificationreported figures, explain any inconsistencies. includes customers counted more than once because of special regularly used by the respondent if such basis of classification is not 3. Number of customers should be reported on the basis of services, such as water heating, etc., indicate in a footnote the number greater than 1000 KW. See Account 442 of the Uniform Systemmeters, plus number of late rate accounts except where separate of such duplicate customers included in the classification. of Accounts. Explain basis of Classification
Operating Revenues Kilowatt-hours Sold Average Number of
Customers per Month
Increase or Increase or Increase orAmount for (Decrease) from Amount for (Decrease) from Number for (Decrease) from
Line Account Year Preceding Year Year Preceding Year Year Preceding YearNo. (a) (b) (c) (d) (e) (f) (g)
1 SALES OF ELECTRICITY
2 440 Residential Sales 3,436,177 (224,790) 26,293,541 (1,315,616) 3,151 153 Net Solar 0 0 0 04 442 Commercial and Industrial Sales 3,153,340 (111,162) 21,556,035 (705,722) 500 55 Small Commercial B Sales6 Large Commercial C Sales7 Small Government Sales 62,667 (594) 357,527 (850) 18 18 Large Government Sales 634,530 (51,423) 4,556,260 (312,500) 4 09 444 Municipal Sales 439,679 (7,040) 2,944,732 109,691 53 2
10 445 Other Sales to Public Authorities 0 0 011 446 Sales to Railroads and Railways 0 0 012 448 Interdepartmental Sales 0 0 013 449 Miscellaneous Sales 0 0 014 Total Sales to Ultimate Consumers 7,726,393 (395,009) 55,708,095 (2,224,997) 3,726 2315 447 Sales for Resale 0 0 0 0 0 016 Total Sales of Electricity* 7,726,393 (395,009) 55,708,095 (2,224,997) 3,726 2317 OTHER OPERATING REVENUES
18 450 Forfeited Discounts 0 0 19 451 Miscellaneous Service Revenues 0 0 * Includes revenues from20 453 Sales of Water and Water Power 0 0 application of fuel clauses $ (194,317)21 454 Rent from Electric Property 0 022 455 Interdepartmental Rents 0 023 456 Other Electric Revenues 0 0 Total KWH to which applied 55,056,6042425262728 Total Other Operating Revenues 0 029 Total Electric Operating Revenue 7,726,393 (395,009)

Annual Report of the Town of West Boylston Year Ended December 31, 2019 Page 38SALES OF ELECTRICITY TO ULTIMATE CONSUMERS
Report by account number the K.W.H. sold, the amount derived and the number of customers under each filed schedule
or contract. Municipal sales, contract sales and unbilled sales may be reported separately in total.
AverageRevenue Number of Customers
Line Account Schedule K.W.H. Revenue per KWH (per Bills rendered)No. No. (a) (b) (c) (cents) July 31 Dec 31
(0.0000) (e) (f)(d)
1 400.000 Residential, R & N1 26,293,541 3,436,177 0.1307 3,144 3,151
23 442.000 Commercial, SC 6,365,150 1,058,298 0.1663 435 4364 442.000 Commercial, LC 9,929,301 1,344,120 0.1354 41 415 442.000 Commercial, PL 315,080 76,745 0.2436 11 116 442.000 Total Commercial 16,609,531 2,479,163 0.1493 487 488
78 442.000 Industrial 4,946,504 674,177 0.1363 12 12
910 444.000 Municipal Street Light 300,970 46,170 0.1534 1 111 444.000 Municipal, M1, M2 & M3 2,643,762 393,509 0.1488 49 5212 444.000 Total Municipal 2,944,732 439,679 0.1493 50 53
1314 Small Govt, SG 357,527 62,667 0.1753 17 1815 Large Govt, LG 4,556,260 634,530 0.1393 4 416 Total Govt 4,913,787 697,197 0.1419 21 22
1718192021222324252627282930313233343536373839404142
TOTAL SALES TO ULTIMATE CONSUMERS (page 37 Line 11) 55,708,095 7,726,393 0.1387 3,714 3,726

Annual Report of the Town of West Boylston Page 39 ELECTRIC OPERATION AND MAINTENANCE EXPENSES
1. Enter in the space proved the operation and maintenance expenses for the year2. If the increases and decreases are not derived from previously reported figures, explain in footnote
Increase orAccount Amount for Year (Decrease) from
Line (a) (b) Preceding Year No. (c)
1 POWER PRODUCTION EXPENSES
2 STEAM POWER GENERATION
3 Operation:4 500 Operation supervision and engineering 05 501 Fuel 06 502 Steam Expenses 07 503 Steam from other sources 08 504 Steam transferred -- Cr. 09 505 Electric expenses 0
10 506 Miscellaneous steam power expenses 011 507 Rents 012 Total Operation 0 013 Maintenance:14 510 Maintenance supervision and engineering 015 511 Maintenance of Structures 016 512 Maintenance of boiler plant 017 513 Maintenance of electric plant 018 514 Maintenance of miscellaneous steam plant 019 Total Maintenance 0 020 Total power production expenses -steam power 0 021 NUCLEAR POWER GENERATION
22 Operation:23 517 Operation supervision and engineering 024 518 Fuel 025 519 Coolants and water 026 520 Steam Expenses 027 521 Steam from other sources 028 522 Steam transferred -- Cr. 029 523 Electric expenses 030 524 Miscellaneous nuclear power expenses 031 525 Rents 032 Total Operation 0 033 Maintenance:34 528 Maintenance supervision and engineering 035 529 Maintenance of Structures 036 530 Maintenance of reactor plant 037 531 Maintenance of electric plant 038 532 Maintenance of miscellaneous nuclear plant 039 Total Maintenance 0 040 Total power production expenses -nuclear power 0 041 HYDRAULIC POWER GENERATION
42 Operation:43 535 Operation supervision and engineering 044 536 Water for power 045 537 Hydraulic expenses 046 538 Electric expenses 047 539 Miscellaneous hydraulic power generation expenses 048 540 Rents 049 Total Operation 0 0
Year Ended December 31, 2019

Annual Report of the Town of West Boylston Year Ended December 31, 2019 Page 40 ELECTRIC OPERATION AND MAINTENANCE EXPENSES - Continued
Increase orLine Account Amount for Year (Decrease) from No. (a) (b) Preceding Year
(c)1 HYDRAULIC POWER GENERATION - Continued
2 Maintenance:3 541 Maintenance Supervision and engineering 04 542 Maintenance of structures 05 543 Maintenance or reservoirs, dams and waterways 06 544 Maintenance of electric plant 07 545 Maintenance of miscellaneous hydraulic plant 08 Total maintenance 0 09 Total power production expenses - hydraulic power 0 0
10 OTHER POWER GENERATION 011 Operation: 012 546 Operation supervision and engineering 013 547 Fuel 014 548 Generation Expenses 015 549 Miscellaneous other power generation expense 016 550 Rents 017 Total Operation 0 018 Maintenance:19 551 Maintenance supervision and engineering 020 552 Maintenance of Structures 021 553 Maintenance of generating and electric plant 022 554 Maintenance of miscellaneous other power generation plant 023 Total Maintenance 0 024 Total power production expenses - other power 0 025 OTHER POWER SUPPLY EXPENSES
26 555 Purchased power 3,040,181 101,11327 556 System control and load dispatching 28 557 Other expenses 73,708 (11,438)29 Total other power supply expenses 3,113,889 89,67530 Total power production expenses 3,113,889 89,67531 TRANSMISSION EXPENSES 32 Operation: 33 560 Operation supervision and engineering 034 561 Load dispatching 035 562 Station expenses 036 563 Overhead line expenses 037 564 Underground line expenses 038 565 Transmission of electricity by others 866,043 (213,191)39 566 Miscellaneous transmission expenses 040 567 Rents 041 Total Operation 866,043 (213,191)42 Maintenance:43 568 Maintenance supervision and engineering44 569 Maintenance of structures45 570 Maintenance of station equipment46 571 Maintenance of overhead lines47 572 Maintenance of underground lines48 573 Maintenance of miscellaneous transmission plant49 Total maintenance 0 050 Total transmission expenses 866,043 (213,191)

Annual Report of the Town of West Boylston Year Ended December 31, 2019 Page 41 ELECTRIC OPERATION AND MAINTENANCE EXPENSES - Continued
Increase orLine Account Amount for Year (Decrease) from No. (a) (b) Preceding Year
(c)1 DISTRIBUTION EXPENSES 2 Operation:3 580 Operation supervision and engineering 36,465 14,8804 581 Load dispatching (Operation Labor) 05 582 Station expenses 92,694 14,2476 583 Overhead line expenses 162,445 18,7597 584 Underground line expenses 30,917 20,9608 585 Street lighting and signal system expenses 12,840 7799 586 Meter expenses 55,433 (4,676)
10 587 Customer installations expenses 11,496 (3,053)11 588 Miscellaneous distribution expenses 0 012 589 Rents 0 013 Total operation 402,290 61,89614 Maintenance:15 590 Maintenance supervision and engineering 016 591 Maintenance of structures 28,262 (12,121)17 592 Maintenance of station equipment 47,340 28,94318 593 Maintenance of overhead lines 428,190 191,40019 594 Maintenance of underground lines 19,597 (14,795)20 595 Maintenance of line transformers 0 021 596 Maintenance of street lighting and signal systems (787) (928)22 597 Maintenance of meters 4,858 4,14023 598 Maintenance of miscellaneous distribution plant 138,783 45,83624 Total maintenance 666,243 242,47525 Total distribution expenses 1,068,533 304,37126 CUSTOMER ACCOUNTS EXPENSES
27 Operation: 28 901 Supervision 0 029 902 Meter reading expenses 11,168 (1,438)30 903 Customer records and collection expenses 210,603 23,54231 904 Uncollectible accounts 12,463 2,53732 905 Miscellaneous customer accounts expenses 0 033 Total customer accounts expenses 234,234 24,64134 SALES EXPENSES
35 Operation:36 911 Supervision 0 037 912 Demonstrating and selling expenses 0 038 913 Advertising expenses 0 039 916 Miscellaneous sales expenses 338 (451)40 Total sales expenses 338 (451)41 ADMINISTRATIVE AND GENERAL EXPENSES
42 Operation:43 920 Administrative and general salaries 174,729 27,97244 921 Office supplies and expenses 101,749 38,96145 922 Administrative expenses transferred - Cr 0 046 923 Outside services employed 125,491 1,72947 924 Property insurance 0 048 925 Injuries and damages 69,995 25,06849 926 Employee pensions and benefits 402,643 14,48550 928 Regulatory commission expenses 0 051 929 Store Expense 0 052 930 Miscellaneous general expenses 143,375 54,92153 931 Rents 0 054 Total operation 1,017,982 163,136

Annual Report of the Town of West Boylston Year Ended December 31, 2019 Page 42
ELECTRIC OPERATION AND MAINTENANCE EXPENSES - Continued
Amount Increase orLine Account for Year (Decrease) from No. (a) (b) Preceding Year
(c)1 ADMINISTRATIVE AND GENERAL EXPENSES - Cont.
2 Maintenance:3 932 Maintenance of general plant 0 04 Total administrative and general expenses 1,017,982 163,1365 Total Electric Operation and Maintenance Expenses 6,301,019 368,181
SUMMARY OF ELECTRIC OPERATION AND MAINTENANCE EXPENSES
Line Functional Classification Operation Maintenance Total No. (a) (b) (c) (d)
6 Power Production Expenses
7 Electric Generation: 8 Steam Power: 9 Nuclear Power
10 Hydraulic Power 11 Other Power 12 Other Power Supply Expenses 3,113,889 0 3,113,88913 Total power production expenses 3,113,889 3,113,88914 Transmission Expenses 866,043 866,04315 Distribution Expenses 402,290 666,243 1,068,53316 Customer Accounts Expenses 234,234 234,23417 Sales Expenses 338 33818 Administrative and General Expenses 1,017,982 0 1,017,98219 Total Electric Operation and20 Maintenance Expenses 5,634,776 666,243 6,301,019
21 Ratio of operating expenses to operating revenues 87.98%(carry out decimal two places, (e.g.. 0.00%) Compute by dividing Revenues (Acct 400) into the sum of Operationand Maintenance Expenses (Page 42, line 20 (d), Depreciation (Acct 403)and Amortization (Acct 407)
22 Total salaries and wages of electric department for year, including 925,929amounts charged to operating expenses, construction and other .accounts.
23 Total number of employees of electric department at end of year 10including administrative, operating, maintenance, construction andother employees (including part-time employees)
Next Page is 49

Page 49 Annual Report of the Town of West Boylston Year Ended December 31, 2019TAXES CHARGED DURING THE YEAR
1. This schedule is intended to give the account distribution of total 3. The aggregate of each kind of tax should be listed under the appropriate 5. For any tax which it was necessary to apportion
taxes charged to operations and other final accounts during the year. heading of "Federal", "State" and "Local" in such manner that the total tax more than one utility department account, state in a
2. Do not include gasoline and other sales taxes which have been for each State and for all subdivisions can be readily ascertained. footnote the basis of apportioning such tax.
charged to accounts to which the material on which the tax was levied 4. The accounts to which the taxes charged were distributed should be 6. Do not include in this schedule entries with respect
which the tax was levied was charged. If the actual or estimated amounts shown in columns (c) to (h). Show both the utility department and number to deferred income taxes, or taxes collected through
of such taxes are known, they should be shown as a footnote and of account charged. For taxes charged to utility plant show the number of payroll deductions or otherwise pending transmittal
designated whether estimated or actual amounts the appropriate balance sheet plant account or subaccount. of such taxes to the taxing authority.
Total TaxesCharged
Line Kind of Tax During Year Electric GasNo. (a) (omit cents) Acct 408,409 Acct 408,409
(b) (c) (d) (e) (f) (g) (h) (i)123456789
10111213141516171819202122232425
262728 TOTALS
Annual Report of the Town of West Boylston Year Ended December 31, 2019 Page 50OTHER UTILITY OPERATING INCOME (Account 414)
Report below the particulars called for in each columnAmount Gain or
Amount of Amount of of Operating (Loss) fromLine Property Investment Department Expenses Operation No. (a) (b) (c) (d) (e)
123456789
101112131415161718192021222324252627282930313233343536373839404142434445464748495051 TOTALS

Annual Report of the Town of West Boylston Page 51
Report by utility departments the revenue, costs, expenses, and net income from merchandising, jobbing,and contract work during the year.
Electric Gas Other UtilityLine Item Department Department Department Total No. (a) (b) (c) (d) (e)
1 Revenues:2 Merchandise sales, less discounts,3 allowances and returns4 Contract work 74,591 74,5915 Commissions6 Other (list according to major classes)789
10 Total Revenues 74,591 0 0 74,591111213 Costs and Expenses:14 Cost of sales (list according to major 15 classes of cost)16 Jobbing/Contract Costs17 Materials18 Outside Service Labor1920212223242526 Sales Expenses27 Customer accounts expenses28 Administrative and general expenses293031323334353637 38 39 40 41424344454647484950 TOTAL COSTS AND EXPENSES 0 0 0 051 Net Profit (or loss) 74,591 0 0 74,591
Year Ended December 31, 2019 INCOME FROM MERCHANDISE, JOBBING, AND CONTRACT WORK (Account 415)

52
Annual report of: TOWN OF WEST BOYLSTON Year Ended December 31, 2019
SALES FOR RESALE (Account 447)
1. Report sales during year to other electric utilities and and place and "x" in column (c) if sale involves export across
to cities or other public authorities for distribution to a state line.
ultimate consumers. 3. Report separately firm, dump, and other power sold to
2. Provide subheadings and classify sales as to (1) Associ- the same utility. Describe the nature of any sales classified
ated Utilities, (2) Nonassociated Utilities, (3) Municipalities, as Other Power, column (b).
(4) R.E.A. Cooperatives, and (5) Other Public Authorities. 4. If delivery is made at a substation indicate ownership
For each sale designate statistical classification in column (b), in column (e), thus: respondent owned or leased, RS;
thus: firm power, FP; dump or surplus power, DP; other, G, customer owned or leased, CS.
Export Kw or Kva of Demand
Across Avg mo. Annual
Statistical State Sub Contract Maximum Maximum
Line Sales to MMWEC: Classification Line Point of Delivery Station Demand Demand Demand
No. (a) (b) (c) (d) (e) (f) (g) (h)
1
2
3
4
5
6
7
8
9
10
11
12
13
14
15
16
17
18
19
20
21
22
23
24
25
26
27
28
29
30
31
32
33

53
Annual Report of: TOWN OF WEST BOYLSTON Year Ended December 31, 2019
SALES FOR RESALE (Account 447) - Continued
5. If a fixed number of kilowatts of maximum demand integrated).
is specified in the power contract as a basis of billings to 6. The number of kilowatt-hours sold should be the
the customer this number should be shown in column (f). quantities shown by the bills rendered to the purchasers.
The number of kilowatts of maximum demand to be shown 7. Explain any amounts entered in column (n) such as
in column (g) and (h) should be actual based on monthly fuel or other adjustments.
readings and should be furnished whether or not used in the 8. If a contract covers several points of delivery and
determination of demand charges. Show in column (i) type small amounts of electric energy are delivered at each point,
of demand reading (instantaneous, 15, 30, or 60 minutes such sales may be grouped.
Revenue (Omit Cents) Revenue
Type of Voltage per kwh
Demand at Which Kilowatt- Capacity Energy Other (CENTS)
Reading Delivered Hours Charges Charges Charges Total (0.0000) Line
(i) (j) (k) (l) (m) (n) (o) (p) No.
0 N/A 1
2
3
4
5
6
7
8
9
10
11
12
13
14
15
16
17
18
19
20
21
22
23
24
25
26
27
28
29
30
31
32
TOTALS: 0 0 33

54
Annual report of: TOWN OF WEST BOYLSTON
PURCHASED POWER (Account 555)
(EXCEPT INTERCHANGE POWER)
1. Report power purchased for resale during the year. Authorities. For each purchase designate statistical classi-
Exclude from this schedule and report on page 56 particulars fication in column (b), thus: firm power, FP; dump or
concerning interchange power transactions during the year. surplus power, DP; other, O, and place an "x" in column (c)
2. Provide subheadings and classify purchases as to if purchase involves import across a state line.
(1) Associated Utilities, (2) Nonassociated Utilities, (3) 3. Report separately firm, dump, and other power pur-
Associated Nonutilites, (4) Other Nonutilities, (5) Muni- chased from the same company. Describe the nature of any
cipalities, (6) R.E.A Cooperatives, and (7) Other Public purchases classified as Other Power, column (b).
Kw or Kva of Demand
Across Avg mo. Annual
Purchased Statistical State Sub Contract Maximum Maximum
Line From MMWEC: Classification Line Point of Receipt Station Demand Demand Demand
No. (a) (b) (c) (d) (e) (f) (g) (h)
1 New York Power Authority FP X WEST BOYLSTON 437
2 Stonybrook Peaking O WEST BOYLSTON 3,916
3 Stonybrook Intermediate O WEST BOYLSTON 4,400
4 Nuclear Mix 1 (Seabrook) O X WEST BOYLSTON 24
5 Nuclear Mix 1 (Millstone) O X WEST BOYLSTON 248
6 Nuclear Project 3 (Millstone) O X WEST BOYLSTON 660
7 Nuclear Project 4 (Seabrook) O X WEST BOYLSTON 1,449
8 Nuclear Project 5 (Seabrook) O X WEST BOYLSTON 91
9 Project 6 (Seabrook) O X WEST BOYLSTON 521
10 Transmission Charges:
11 Hydro Quebec O X WEST BOYLSTON
12 NEPCO O WEST BOYLSTON
13 Oakdale Hydro O WEST BOYLSTON 3,200
14 ISO OATT WEST BOYLSTON
15 System Power DP
16 Mass Municipal Solar Energy Coop. O WEST BOYLSTON
17 Berkshire Wind Cooperative PHI O WEST BOYLSTON
18 Eagle Creek O WEST BOYLSTON 300
19 Hancock Wind O WEST BOYLSTON RS 571
20 Berkshire Wind Cooperative PHII O WEST BOYLSTON
21 Net Metered Solar WEST BOYLSTON
22 Roof-Top Cummunity Solar WEST BOYLSTON
23 Princeton Wind WEST BOYLSTON
24 Community Solar WEST BOYLSTON
25 Member Services
26 Solar Energy Credits
27 MMWEC Surplus Funds
28 Rate Stabilization
29
30 **Includes transmission and administrative charges.
31
Year Ended December 31, 2019

55
Annual Report of: TOWN OF WEST BOYLSTON
PURCHASED POWER (Account 555)
(EXCEPT INTERCHANGE POWER)
4. If receipt of power is at a substation indicate ownership should be furnished whether or not used in the determination
in column (e), thus: respondent owned or leased, RS; seller of demand charges. Show in column (i) type of demand
owned or leased, SS. reading (instantaneous, 15, 30, or 60 minutes integrated).
5. If a fixed number of kilowatts of maximum demand 6. The number of kilowatt hours purchased should be the
is specified in the power contract as a basis of billing, this quantities shown by the power bills.
number should be shown in column (f). The number of 7. Explain any amount entered in column (n) such as fuel
kilowatts of maximum demand to be shown in columns (g) or other adjustments.
and (h) should be actual based on monthly readings and
Cost of Energy (Omit Cents)
Type of Voltage KWH
Demand at Which Kilowatt- Capacity Energy Other (CENTS)
Reading Delivered Hours Charges Charges Charges Total (0.0000) Line
(i) (j) (k) (l) (m) (n) ** (o) (p) No.
60 MINUTES 115 kv 3,313,550 21,867 16,478 37,743 76,088 0.0230 1
60 MINUTES 115 kv 35,041 73,373 6,516 4,183 84,072 2.3992 2
60 MINUTES 115 kv 574,116 161,952 16,284 5,124 183,360 0.3194 3
60 MINUTES 115 kv 241,199 6,132 1,272 14 7,418 0.0308 4
60 MINUTES 115 kv 2,067,934 64,721 12,990 1,958 79,669 0.0385 5
60 MINUTES 115 kv 5,448,734 172,239 34,228 5,159 211,626 0.0388 6
60 MINUTES 115 kv 13,742,046 351,828 72,452 824 425,104 0.0309 7
60 MINUTES 115 kv 861,692 22,423 4,543 52 27,018 0.0314 8
60 MINUTES 115 kv 4,942,655 147,315 26,059 296 173,670 0.0351 9
10
27,021 27,021 N/A 11
(23,092) (23,092) N/A 12
0 0 N/A 13
953,794 953,794 N/A 14
7,684,500 81,375 424,108 505,483 0.0658 15
60 MINUTES 115 kv 424,083 121,283 0 121,283 0.2860 16
60 MINUTES 115 kv 2,054,136 277,430 277,430 0.1351 17
60 MINUTES 115 kv 1,069,062 54,896 58 54,954 0.0514 18
60 MINUTES 115 kv 1,632,342 0 88,728 65 88,793 0.0544 19
60 MINUTES 115 kv 227,433 88,376 0 0 88,376 0.3886 20
60 MINUTES 13.8 kv 35,441 0 1,065 0 1,065 0.0300 21
60 MINUTES 13.8 kv 1,147,923 0 63,136 0 63,136 0.0550 22
60 MINUTES 115 kv 613,393 0 49,071 0 49,071 0.0800 23
60 MINUTES 13.8 kv 0 185,652 0 0 N/A
73,708 73,708 N/A
(984,436) (984,436) N/A 24
(71,028) (71,028) N/A 25
473,467 473,467 N/A 26
27
28
TOTALS: 46,115,280 1,590,314 1,057,478 504,910 2,967,050 29
Year Ended December 31, 2019

Page 56 Annual Report of the Town of West Boylston Year Ended December 31, 2019INTERCHANGE POWER (Included in Account 555)
1. Report below the kilowatt-hours received and shall be furnished in Part B, Details of Settlement for coordination, or other such arrangement, submit adelivered during the year and the net charge or credit Interchange Power. If settlement for any transaction copy of the annual summary of transactions and bill-under interchange power agreements. also includes credit or debit amounts other than for ings among the parties to the agreement. If the 2. Provide subheadings and classify interchanges increment generation expenses, show such other amount of settlement reported in this schedule for anyas to (1) Associated Utilities, (2) Nonassociated Utili- component amounts separately, in addition to debit transaction does not represent all of the charges andties, (3) Associated Nonutilities, (4) Other Non- or credit for increment generation expenses, and give credits covered by the agreement, furnish in a footnoteutilities, (5) Municipalities, (6) R.E.A. Cooperatives, a brief explanation of the factors and principles under a description of the other debits and credits and stateand (7) Other Public Authorities. For each inter- which such other component amounts were deter- the amounts and accounts in which such otherchange across a state line place an "x" in column (b). mined. If such settlement represents the net of debits amounts are included for the year. 3. Particulars of settlements for interchange power and credits under an interconnection, power pooling,
A. Summary of Interchange According to Companies and Points of InterchangeInter-
change Voltage at Kilowatt-hoursAcross WhichState Inter- Amount of
Line Name of Company Lines Point of Interchange changed Received Delivered Net Difference SettlementNo. (a) (b) (c) (d) (a) (f) (g) (h)
1 NEPEX 56,490,630 47,339,057 9,151,573 1,012,882 23456789
101112 TOTALS 56,490,630 47,339,057 9,151,573 1,012,882
B. Details of Settlement for Interchange Power
Line Name of Company Explanation AmountNo. (i) (j) (k)
13 NEPEX INTERCHANGE EXPENSE 900,684 14 NEPOOL EXPENSE 112,198 15161718192021 TOTAL 1,012,882

Annual Report of the Town of West Boylston Year Ended December 31, 2019 Page 57ELECTRIC ENERGY ACCOUNT
Report below the information called for concerning the disposition of electric energy generated, purchased and interchanged for the year.
Line. Item Kilowatt-hoursNo. (a) (b)
1 SOURCES OF ENERGY2 Generation3 Solar WB Landfill Community Solar 2,439,3134 Steam5 Hydro6 Other7 Total Generation 2,439,3138 Purchases 46,115,2809 ( In (gross) 56,490,630
10 Interchanges < Out (gross) 47,339,05711 ( Net (Kwh) 9,151,57312 ( Received 013 Transmission for/by others (wheeling) < Delivered 014 ( Net (Kwh) 015 TOTAL 57,706,166
16 DISPOSITION OF ENERGY17 Sales to ultimate consumers (including interdepartmental sales) 55,708,09518 Sales for resale 019 Energy furnished without charge 020 Energy used by the company (excluding station use):21 Electric department only 165,21522 Energy losses23 Transmission and conversion losses 0.00% 024 Distribution losses 3.18% 1,832,85625 Unaccounted for losses26 Total energy losses 1,832,85627 Energy losses as percent of total on line 15 3.18%28 TOTAL 57,706,166
MONTHLY PEAKS AND OUTPUT 1. Report hereunder the information called for pertaining to simultaneous peaks as to the nature of the emergency. established monthly (in kilowatts) and monthly output (in kilowatt-hours) for the 3. State type of monthly peak reading (instantaneous 15, 30, or 60 minutes integrated.) combined sources of electric energy of respondent. 4. Monthly output should be the sum of respondent's net generation and purchases plus or 2. Monthly peak col. (b) should be respondent's maximum kw load as minus net interchange and plus or minus net transmission or wheeling. Total for the yearmeasured by the sum of its coincidental net generation and purchase plus or should agree with line 15 above. minus net interchange, minus temporary deliveries (not interchange) of 5. If the respondent has two or more power systems not physically connected, theemergency power to another system. Monthly peak including such information called for below should be furnished for each system. emergency deliveries should be shown in a footnote with a brief explanation
Town of WEST BOYLSTON
Monthly Peak Monthly OutputDay of Day of Type of (kwh)
Line Month Kilowatts Week Month Hour Reading (See Instr. 4)No. (a) (b) (c) (d) (e) (f) (g)
29 January 10,624 Monday 21 6PM 60 min 5,486,76430 February 9,626 Friday 1 8AM 60 min 4,816,70731 March 9,062 Wednesday 6 7PM 60 min 4,928,42632 April 7,600 Tuesday 9 8PM 60 min 4,163,78133 May 7,160 Monday 20 8PM 60 min 4,141,72834 June 9,485 Thursday 27 7PM 60 min 4,564,32135 July 11,320 Tuesday 30 7PM 60 min 5,803,51636 August 10,806 Monday 19 4PM 60 min 5,268,07337 September 9,052 Monday 23 8PM 60 min 4,216,53338 October 7,459 Wednesday 2 3PM 60 min 4,189,18139 November 8,891 Wednesday 13 6PM 60 min 4,711,35640 December 10,030 Thursday 19 6PM 60 min 5,415,78041 TOTAL 57,706,166
Annual Report of the Town of West Boylston Year Ended December 31, 2019
GENERATING STATIONS Pages 58 through 66
GENERATING STATION STATISTICS (Large Stations)
(Except Nuclear) Pages 58-59 Line Item Plant Plant Plant Plant No. (a) (b) (c) (d) (e)
123456
STEAM GENERATING STATIONS Pages 60-61
Line Item Plant Plant Plant Plant No. (a) (b) (c) (d) (e)
123456
HYDROELECTRIC GENERATING STATIONS Pages 62-63
Line Item Plant Plant Plant Plant No. (a) (b) (c) (d) (e)
123456
COMBUSTION ENGINE AND OTHER GENERATING STATIONS Pages 64-65
Line Item Plant Plant Plant Plant No. (a) (b) (c) (d) (e)
123456
GENERATING STATION STATISTICS (Small Stations) Page 66 Line Item Plant Plant Plant Plant No. (a) (b) (c) (d) (e)
123456

Annual Report of the Town of West Boylston Year Ended December 31, 2019 Page 67
TRANSMISSION LINE STATISTICS
Report information concerning transmission line as indicated below.
Type of Length (Pole Miles) Number Size ofDesignation Operating Supportive On Structures of On Structures of of Conductors
Line From To Voltage Structure Line Designated Another Line Circuits and Material No. (a) (b) (c) (d) (e) (f) (g) (h)
123456789
1011121314151617181920212223242526272829303132333435363738394041424344454647 TOTALS 0 0
* where other than 60 cycle, 3 phase, so indicate.

Page 68 Annual Report of the Town of West Boylston Year Ended December 31, 2019
SUBSTATIONS1. Report below the information called for concerning substations of the 4. Indicate in column (b) the functional character of each substation, designating name of lessor, date and period of lease and annual rent. For any
respondent as of the end of the year. whether transmission or distribution and whether attended or unattended. substation or equipment operated other than by reason of sole
2. Substations which serve but one industrial or street railway customer 5. Show in columns (i), (j), and (k) special equipment such as rotary converters, ownership or lease, give name of co-owner or other party, explain
should not be listed hereunder. rectifiers, condensers, etc. and auxiliary equipment for increasing capacity. basis of sharing expenses of other accounting between the
3. Substations with capacities of less that 5000 kva, except those serving 6. Designate substations or major items of equipment leased from others, jointly parties, and state amounts and accounts affected in respondent's
customers with energy for resale, may be grouped according to functional owned with others, or operated otherwise than by reason of sole ownership by books of account. Specify in each case whether lessor, co-owner
character, but the number of such substations must be shown. the respondent. For any substation or equipment operated under lease, give or other party is an associated company.
Conversion Apparatus andCharacter Voltage Capacity of Number of Number of Special Equipment
Name and Location of Substation in kva Transformers Spare Type of Number TotalLine of Substation Substation Primary Secondary Tertiary (In Service) In Service Transformers Equipment of Units Capacity No. (a) (b) (c) (d) (e) (f) (g) (h) (i) (j) (k)
1 Denton-Lowell Substation Distribution Unattended 115KV 13.8KV 40MVA 1 123456789
1011121314151617181920212223242526 TOTALS 0 1 1

Annual Report of the Town of West Boylston Year Ended December 31, 2019 Pages 69
OVERHEAD DISTRIBUTION LINES OPERATED
Line Length (Pole Miles)No. Wood Poles Steel Towers Total
1 Miles -- Beginning of Year 92.94 92.942 Added During Year 0.40 0.403 Retired During Year (0.75) (0.75)4 Miles -- End of Year 92.59 0.00 92.595 *678 Distribution System Characteristics - AC, 3 Phase, 60 cycles and 13800/7970 operating voltages9 for Light and Power
101112131415
ELECTRIC DISTRIBUTION SERVICES, METERS AND LINE TRANSFORMERS
Line TransformersElectric Number of Total
Line Item Services Watt-hour Number CapacityNo. Meters (kva)
16 Number at beginning of year: 3,710 3,822 1,056 55,96117 Additions during year18 Purchased 996 19 4,750.019 Installed 1620 Associated with utility plant acquired21 Total Additions 16 996 19 4,750.022 Reductions during year:23 Retirements 910 3 1,32524 Associated with utility plant sold25 Total Reductions 0 910 3 1,32526 Number at end of year 3,726 3,908 1,072 59,386.027 In stock 191 68 9,483.028 Locked meters on customers' premises29 Inactive transformers on system30 In customers' use 3,714 1,001 49,33931 In company's use 3 3 56432 Number at end of year 3,908 1,072 59,386.0
*

Annual Report of the Town of West Boylston Year Ended December 31, 2019 Page 70
CONDUIT, UNDERGROUND CABLE AND SUBMARINE CABLE - (Distribution System)
Report below the information called for concerning conduit, underground cable, and submarine cable at end of year.Miles of Conduit Bank Underground Cable Submarine Cable
Line Designation of Underground System (All Sizes and Types) Miles * Operating Feet * OperatingVoltage Voltage
No. (a) (b) (c) (d) (e) (f)1 West Boylston 18.227 0.000 0.00 0 023456789
1011121314151617181920212223242526272829303132333449 TOTALS 18.227 0.00 0 0
*indicate number of conductors per cable

Annual Report of the Town of West Boylston Page 71
Type
HPS 1000 wattLine City or Town Total Municipal Other Municipal Other Municipal Other Municipal Other No. (a) (b) (c) (d) (e) (f) (g) (h) (i) (j)
1 West Boylston 1,088 946 0 115 0 26 0 1 02 3 456789
101112131415161718192021222324252627282930313233343536373839404142434445464748495051 TOTALS 1088 946 0 115 0 26 0 1 0
Next Page is 79
Year Ended December 31, 2019
STREET LAMPS CONNECTED TO SYSTEM
LED 53 & 44 wattHPS 70, 100, 250 &
400 wattLED 85, 110 & 160
watt

Annual Report of the Town of West Boylston Year Ended December 31, 2019 Page 79RATE SCHEDULE INFORMATION
1. Attach copies of all Filed Rates for General Consumers2. Show below the changes in rate schedules during year and the estimated increase or decrease in annual revenues predicted on the previous year's operations.
EstimatedEffective M.D.P.U. Rate Effect on
Date Number Schedule Annual RevenuesIncreases Decreases
No Rate Changes in 2019


INDEXPage
Appropriations of Surplus 21Appropriations Since Beginning of Year 5Bonds 6Cash Balances 14Changes in the Property 5Combustion Engine and Other Generating Stations 64-65Comparative Balance Sheet 10-11Conduit, Underground Cable and Submarine Cable 70Cost of Plant 8- 8BCustomers in each City or Town 4Depreciation Fund Account 14Earned Surplus 12Electric Distribution Services, Meters, and Line Transformers 69Electric Energy Account 57Electric Operating Revenues 37Electric Operation and Maintenance Expenses 39-42General Information 3Generating Station Statistics 58-59Generating Statistics (Small Stations) 66Hydroelectric Generating Stations 62-63Income from Merchandising, Jobbing and Contract Work 51Income Statement 12Interchange Power 56Materials and Supplies 14Miscellaneous Credits to Surplus 21Miscellaneous Debits to Surplus 21Miscellaneous Nonoperating Income 21Monthly Peaks and Output 57Municipal Revenues 22Other Income Deductions 21Other Utility Operating Income 50Overhead Distribution Lines Operated 69Production Fuel and Oil Stocks 18Purchased Power 22Purchased Power Detailed (except Interchange) 54-55Rate Schedule Information 79Sales for Resale 22Sales for Resale Detailed 52-53Sales of Electricity to Ultimate Consumers 38Schedule of Estimates 4Signature Page 81Steam Generating Stations 60-61Streetlamps 71Substations 68Taxes Charged During Year 49Town Notes 7Transmission Line Statistics 67Utility Plant-Electric 15-17
FOR GAS PLANTS ONLY: Page Page
Boilers 75 Purifieers 76Gas Distribution Services, House Record of Sendout for the Year in MCF 72-73 Governors and Meters 78 Sales for Resale 48Gas Generating Plant 74 Sales of Gas to Ultimate Customers 44Gas Operating Revenues 43 Sales of Residuals 48Gas Operation & Maintenance Expenses 45-47 Scrubbers, Condensers & Exhausters 75Holders 76 Transmission and Distribution Mains 77Purchased Gas 48 Utility Plant - Gas 19-20
PAGES INTENTIONALLY OMITTED : 9, 13, 23 TO 36, 80