Embed Size (px)
Citation preview
Rome, 2014
Denmark
GLOBAL FOREST RESOURCES ASSESSMENT 2015
COUNTRY REPORT

FAO, at the request of its member countries, regularly monitors the world´s forests and theirmanagement and uses through the Global Forest Resources Assessment (FRA). This country reportis prepared as a contribution to the FAO publication, the Global Forest Resources Assessment 2015(FRA 2015).The content and the structure are in accordance with the recommendations and guidelines given byFAO in the document Guide for country reporting for FRA 2015 (http://www.fao.org/3/a-au190e.pdf).These reports were submitted to FAO as official government documents.
The content and the views expressed in this report are the responsibility of the entity submitting thereport to FAO. FAO may not be held responsible for the use which may be made of the informationcontained in this report.
FRA 2015 – Country Report, Denmark
3
TABLE OF CONTENTSReport preparation and contact persons...............................................................................................................................41. What is the area of forest and other wooded land and how has it changed over time? ................................................. 72. What is the area of natural and planted forest and how has it changed over time? ..................................................... 143. What are the stocks and growth rates of the forests and how have they changed? .....................................................204. What is the status of forest production and how has it changed over time? .................................................................335. How much forest area is managed for protection of soil and water and ecosystem services? ..................................... 406. How much forest area is protected and designated for the conservation of biodiversity and how has it changed overtime? ................................................................................................................................................................................... 457. What is the area of forest affected by woody invasive species? .................................................................................. 498. How much forest area is damaged each year? ............................................................................................................ 529. What is the forest area with reduced canopy cover? ....................................................................................................5710. What forest policy and regulatory framework exists to support implementation of sustainable forest managementSFM? .................................................................................................................................................................................. 5811. Is there a national platform that promotes stakeholder participation in forest policy development? ............................ 6012. What is the forest area intended to be in permanent forest land use and how has it changed over time? .................. 6113. How does your country measure and report progress towards SFM at the national level? ........................................ 6414. What is the area of forest under a forest management plan and how is this monitored? ........................................... 6615. How are stakeholders involved in the management decision making for publicly owned forests? .............................. 6816. What is the area of forest under an independently verified forest certification scheme? .............................................7017. How much money do governments collect from and spend on forests? .....................................................................7218. Who owns and manages the forests and how has this changed? ..............................................................................7419. How many people are directly employed in forestry? ................................................................................................. 7920. What is the contribution of forestry to Gross Domestic Product (GDP)? .................................................................... 8121. What is forest area likely to be in the future ...............................................................................................................82

FRA 2015 – Country Report, Denmark
4
Report preparation and contact personsContact personsThe present report was prepared by the following person(s)
Name (FAMILYNAME, first name)
Institution/address Email Tables
Thomas Nord-Larsen University of Copenhagen [email protected] N/A
Vivian Kvist Johannsen University of Copenhagen [email protected] N/A
N/A N/A N/A N/A
N/A N/A N/A N/A
Introductory TextPlace an introductory text on the content of this report
The main source of information on forest resources in Denmark is provided by the National Forest Inventory(NFI). Results from the NFI is reported in Skove og Plantager (Forests and Plantations) 2006, 2008, 2009, 2010,2011 and 2012. The publications on the Danish NFI are available at:
http://sl.life.ku.dk/erhverv_og_myndigheder/myndighedsbetjening/skovovervaagning.aspx
The most recent of the publications is:
Johannsen VK, Nord-Larsen T, Riis-Nielsen T, Suadicani K and Jørgensen BB (2013): Skove og plantager 2012, Skov &Landskab, Frederiksberg, 2013. 189 s. ill.The NFI is a sample-based forest inventory initiated in 2002. Today (2013), we are on the third five-year rotationof the measurements. The NFI is based on a 2 x 2 km grid covering the Danish land surface. At each gridintersection, a cluster of four circular plots for measuring forest factors (e.g. wood volume) are placed in a 200 x200 m grid. Each circular plot has a radius of 15 meters. When plots are intersected by different landuse classesor different forest stands, the individual plot is divided into tertiary sampling units.
About one third of the plots was assigned to be permanent and will be remeasured in subsequent inventoriesevery five years. Two thirds are temporary and are reassigned in subsequent inventories. The sample ofpermanent and temporary field plots has been systematically divided into five non-overlapping, interpenetratingpanels that are each measured in one year and constitute a systematic sample of the entire country. Hence allthe plots are measured in a 5-year cycle.
Based on analysis of maps and air photos, each plot is allocated to one of three basic categories, reflecting thelikelihood of forest or other wooded land cover in the plot (0) Unlikely to contain forest or other wooded landcover, (1) Likely to contain forest cover, and (2) Likely to contain other wooded land cover. Heath and wetlandsare viewed as likely to become forest/wooded land, and included in the “likely to contain other wooded landcover” category. All plots in the last two categories are to be inventoried in the field. Plots are included forinventory regardless of the forest status of the other plots in the cluster.
Other sources of information include forest statistics collected in forest census, performed before the initiationof the NFI in 2002.

FRA 2015 – Country Report, Denmark
5
Larsen, P.H. and Johannsen,V.K. (eds.)(2002). Skove og plantager 2000. Danmarks Statistik, Skov &Landskab og Skov- og Naturstyrelsen. 171 p. ISBN: 87-501-1287-2
This National Forest Census is based on questionnaires sent to all forest owners, resulting in information onarea, main species, age class distribution and productive indicators. The number of respondents for this surveywas 32.300, which is considerably higher than in the 1990 survey. The change in the number of respondentsmay cause differences in estimates of forest variables such as forest area between the 1990 and 2000 census.
Since the data are collected from questionnaires and not based on field observations, the actual forest definitionmay vary. The basic definition is that the forest area must be minimum 0.5 ha. There are no specific guidelineson the crown cover or the potential height of the trees.
All values for growing stock are estimated based on questionnaire data on main species, age class and siteproductivity.
Zangenberg, C.U. and Hansen, C.P. (1994). Skove og plantager 1990. Danmarks Statistik og Skov- ogNaturstyrelsen. 131 p. ISBN: 87-501-0887-5
This National Forest Census is based on questionnaires sent to all forest owners (number of respondents was22.300), resulting in information on area, main species, age class distribution and productive indicators.
Since the data are based on questionnaire and not field observations, the actual forest definition may vary. Thebasic definition is that the forest area must be minimum 0.5 ha. There is no specific guideline on the crowncover or the height of the trees.
All values for growing stock are estimated based on questionnaire data on main species, age class and siteproductivity.
StatBank Denmark (2012). www.statistikbanken. Statistics Denmark.
Provides official statistics on total land area, trade statistics, wood removals.
Beredskabsstyrelsen, Danish Emergency Management Agency
Records all occurrences of fire, also in forest.
http://www.beredskabsstyrelsen.dk/uk/index.htm
Johannsen, VK. et al. (2013): Evaluering af indsatsen for biodiversiteten i de danske skove 1992 - 2012.90 s. ill.
Provides collection on biodiversity information for Denmark, especially area managed for protection ofbiodiversity.
http://sl.life.ku.dk/erhverv_og_myndigheder/myndighedsbetjening/~/media/Sl/Erhverv_Myndigheder_Collaboration/Myndighedsbetjening/Evaluering%20biodiv1992%202012net.ashx
Desk Study?
Check "yes" if this survey is a Desk Study, "no" otherwise
FRA 2015 – Country Report, Denmark
6
Desk Study? no

FRA 2015 – Country Report, Denmark
7
1. What is the area of forest and other wooded land and how has it changed over time?Documents for this question:
• Guide for country reporting FRA 2015• FRA 2015 Terms and Definitions
1.1 Categories and definitions
Category Definition
Forest Land spanning more than 0.5 hectares with trees higher than 5 meters and a canopy cover of more than10 percent or trees able to reach these thresholds in situ. It does not include land that is predominantlyunder agricultural or urban land use.
Other wooded land Land not classified as "Forest" spanning more than 0.5 hectares with trees higher than 5 meters anda canopy cover of 5-10 percent or trees able to reach these thresholds ; or with a combined coverof shrubs bushes and trees above 10 percent. It does not include land that is predominantly underagricultural or urban land use.
Other land All land that is not classified as "Forest" or "Other wooded land".
...of which with tree cover(sub-category)
Land considered as "Other land", that is predominantly agricultural or urban lands use and has patchesof tree cover that span more than 0.5 hectares with a canopy cover of more than 10 percent of trees ableto reach a height of 5 meters at maturity. It includes bothe forest and non-forest tree species.
Inland water bodies Inland water bodies generally include major rivers, lakes and water reservoirs.
Forest expansion Expansion of forest on land that, until then, was not defined as forest.
...of which afforestation(sub-category)
Establishment of forest through planting and/or deliberate seeding on land that, until then, was notdefined as forest.
...of which naturalexpansion of forest (sub-category)
Expansion of forests through natural succession on land that, until then, was under another land use(e.g. forest succession on land previously used for agriculture).
Deforestation The conversion of forest to other land use or the longterm reduction of the tree canopy cover below theminimum 10 percent threshold.
...of which humaninduced (sub-category)
Human induced conversion of forest to other land use or the permanent reduction of the tree canopycover below the minimum 10 percent threshold.
Reforestation Natural regeneration or re-establishment of forest through planting and/or deliberate seeding on landalready in forest land use.
...of which artificialreforestation (sub-category)
Re-establishment of forest through planting and/or deliberate seeding on land already in forest land use.
1.2 National data
1.2.1 Data sources
References to sourcesof information
Variables Years Additional comments
1 Johannsen et al., 2013 Forest and other wooded land 2005 2010 2015 Definitions of forest andother wooded land is inaccordance with the FAOdefinition

FRA 2015 – Country Report, Denmark
8
2 Larsen and Johannsen, 2002 Forest 2000 The forest definition is ingeneral in accordance withthe FAO definition.
3 Zangenberg and Hansen,1994
Forest 1990 The forest definition is ingeneral in accordance withthe FAO definition.
4 Danmarks Statistik, 2013.http://www.dst.dk/pukora/epub/upload/17956/SAA2013.pdf
Other land, Other land withtree cover Inland waterbodies
2015 2010 2005 2000 1990 Other land with tree coverincludes only fruit orchardsbecause information on theextent of parks with treecover of more than 10 % isnot available.
5 Nielsen et al., 2013 Forest 2000 1990 The National InventoryReport for UNFCCC andthe Kyoto Protocol includea description of mappingof forest area in 1990 usingsatellite imagery. This datacomplements the forestcensus in 1990 and 2000
1.2.2 Classification and definitions
National class Definition
Forest Land spanning more than 0.5 hectares with trees higher than5 meters and a canopy cover of more than 10 percent, or treesable to reach these thresholds in situ. The definition includestemporarily unstocked areas and smaller, permanently unstockedareas necessary for forest management. It does not include landthat is predominantly under agricultural or urban land use.
Other wooded land Land not classified as “Forest”, spanning more than 0.5 hectares;with trees higher than 5 meters and a canopy cover of 5-10percent, or trees able to reach these thresholds in situ; or with acombined cover of shrubs, bushes and trees above 10 percent. Itdoes not include land that is predominantly under agricultural orurban land use.
Other land All land not classified as “Forest” or “Other wooded land”.
Other land with tree cover Land with tree cover not defined as forest or other wooded landaccording to the above definitions. Includes only fruit orchardsas information on tree covered park landscapes is not available.
Inland water bodies Inland water bodies generally include major rivers, lakes andwater reservoirs.
Afforestation Establishment of forest through planting and/or deliberateseeding on land that, until then, was not classified as forest.
Reforestation Re-establishment of forest through planting and/or deliberateseeding on land classified as forest.
Natural expansion of forest Expansion of forests through natural succession on land that,until then, was under another land use (e.g. forest succession onland previously used for agriculture).

FRA 2015 – Country Report, Denmark
9
1.2.3 Original data
Year 1990 1995 2000 2005 2010 2012
ha
Forest area 543,249 566,270 585,454 553,621 587,077 608,078
OWL 136,000 136,000 136,000 43,557 47,002 45,468
1.3 Analysis and processing of national data
1.3.1 Adjustment
Forest area
No calibration performed for the forest area or area of other wooded land.
1.3.2 Estimation and forecasting
Forest area
The estimation and forecasting of forest and other wooded land cover are based on two questionnaire basedforest surveys in 1990 and 2000, forest inventory data from 2002-2012 and forest maps based on satelliteimagery using Landsat 5 data.
The two surveys in 1990 and 2000 were questionnaire surveys, where forest owners reported the forest area andspecies and age class distribution. In 2000, more questionnaires were sent to respondents compared to the 1990survey, which caused an increase in forest area. To obtain consistent estimates, the forest area was mappedusing satellite imagery using Landsat 5 data. Subsequently, the forest area in 2000 was estimated using theforest area in 1990, observed afforestation from 1990 to 2005 and known deforestation from 1990 to 2000.
The forest area in 2005 is estimated using NFI data from 2002-2005. The forest areas in 2010 and 2012 isestimated based on NFI data from 2006-2010 and 2008-2012, respectively.
The forest area in 2015 is forecasted based on the 2012 forest area and assuming an annual afforestation of1,900 ha/year and an annual deforestation of 518 ha/year. This is consistent with a previous development ofbuisness-as-usual scenarios for the forest carbon pools in Denmark.
OWL
In previous reporting (FRA 2005 and FRA 2010), other wooded land cover in 1990 and 2000 was obtainedfrom the Area Information System (AIS) Land Cover Plus themes (Miljø- og Energiministeriet and DanmarksMiljøundersøgelser). Other wooded land cover in 2005, 2010 and 2012 is estimated using NFI data.

FRA 2015 – Country Report, Denmark
10
The differences in other wooded land cover between the previous and present forest inventories are probablyto some extend caused by the differences in methodology. However, nature restoration projects have to someextent restored open land nature types, such as heather, on previously tree covered areas. Hence, the actualchange in other wooded land area is difficult to assess.
Other wooded land cover in 2015 is forecasted assuming an unchanged area.
Forest expansion, reforestation
In the present survey, the assessment of afforestation in 1998-2002 and 2003-2007 is based on the records ofthe Forest and Nature Agency, under the assumption that private afforestation without subsidy is similar toprivate afforestation with subsidy. In the period 1988-1992, afforestation was not subsidized in Denmark andthe reported figures include only the public afforestation.
In the present survey, the assessment of reforestation 1988-1992 is based on the age-class distribution observedin the forest inventory from 2000. The reforestation is calculated as the five year average annual forestestablishment in 1980-1989 and 1990-1999.
The assessment of reforestation in 2005 include only sample plots where reforestation can be recognized i.e.where the establishment of the new stand is instigated by a deliberate act. However, conversion to near-naturalmanagement and a general trend towards utilizing spontaneous natural regeneration has lessened the arearegenerated by planting or selfseeding after soil preparation. This reduces the above assessment of reforestationcompared to the overall area affected by some type of regeneration. This might explain some of the observeddifference in reforestation in 1990 and 2000/2005.
1.3.3 Reclassification
Forest area
No reclassification was done as the results are obtained from the National Forest Inventory, which useinternational definitions in accordance with the FRA.
Forest expansion, reforestation
No reclassification has been done
1.4 DataTable 1a
Area (000 hectares)Categories
1990 2000 2005 2010 2015
Forest 543.2 585.5 557.7 587.1 612.2
Other wooded land 136 136 41.6 47 45.5

FRA 2015 – Country Report, Denmark
11
Other land 3563.8 3521.5 3643.7 3608.9 3585.3
... of which with tree cover 7 8 4.2 3.8 3.1
Inland water bodies 66 66 66 66 66
TOTAL 4309.00 4309.00 4309.00 4309.00 4309.00
Table 1bAnnual forest establishment /loss (000 hectares per year)
...of which of introducedspecies (000 hectares per year)
Categories
1990 2000 2005 2010 1990 2000 2005 2010
Forest expansion 4 4 4 5 1 1 4 2
... of which afforestation 4 4 4 5 1 1 4 2
... of which natural
expansion of forest
0 0 0 0 0 0 0 0
Deforestation 0 0 1 1 0 0 1 1
... of which human induced 0 0 1 1 0 0 1 1
Reforestation N/A 4 3 3 N/A 3 2 2
... of which artificial N/A 4 3 3 N/A 3 2 2
Tiers
Category Tier for status Tier for reported trend
Forest Tier 3 Tier 3
Other wooded land Tier 3 Tier 3
Forest expansion Tier 3 Tier 3
Deforestation Tier 1 Tier 1
Reforestation Tier 3 Tier 3
Tier criteria
Category Tier for status Tier for reported trend

FRA 2015 – Country Report, Denmark
12
• Forest• Other wooded land• Afforestation• Reforestation• Natural expansion of forest• Deforestation
Tier 3 : Data sources: Either recent(less than 10 years ago) National ForestInventory or remote sensing, with groundtruthing, or programme for repeatedcompatible NFIs Tier 2 : Data sources:Full cover mapping / remote sensing orold NFI (more than 10 years ago) Tier 1 :Other
Tier 3 : Estimate based on repeatedcompatible tiers 3 (tier for status) Tier 2 :Estimate based on repeated compatible tier2 or combination tier 3 and 2 or 1 (tier forstatus) Tier 1 : Other
1.5 Comments
CategoryComments related todata definitions etc
Comments on the reported trends
Forest The numbers presented in this assessmentdenotes a shift from questionnairebased survey to a sample based survey.Differences in the perception of thedefinition of "forest" between forestowners and trained professionals willlead to changes in the forest area. Weused satellite imagery to mitigate theseinconsistencies.
The observed increase in forest area from1990 to 2010 is caused by two factors.Since 1989 it has been a forest policyobjective in Denmark to double the forestarea - corresponding approximately toobtaining a 20- 25% forest cover withina tree generation (100 years) from thebase-year 1994. Private afforestation isencouraged by subsidies.
Other wooded land The numbers presented in this assessmentdenotes a shift from a survey basedinterpretation of maps to a sample basedsurvey. The reported other wooded landarea in 2015 is based on the forest areaassessed from the NFI measurements2008-2012, assuming no change in area.
The observed decrease in other woodedland cover from the FRA2005 tothe current reporting may in part bedue to changes in methodology andreported figures for 1990 and 2000 areprobably overestimated. However, naturerestoration projects have undoubtedlyaffected the area of other wooded land.Hence, it is not possible to estimate theextent of other wooded land in 1990 and2000 based on the 2006 census.
Other land Total land area is reported by StatisticsDenmark (Danmarks statistik, 2013)and the area of Other land is found bysubtracting the area of Forest, Otherwooded land and Inland water bodies.
N/A
Other land with tree cover Numbers are reported by StatisticsDenmark (Danmarks statistik, 2013) andincludes only the area of fruit orchards.
N/A
Inland water bodies Numbers are reported from StatisticsDenmark (Danmarks statistik, 2013).According to FAOSTAT figures (officialfigures reported by Denmark) the totalland area in 1990 is 4239 and the inlandwater 70. However these figures werebased on a survey from 1959 and we thusrather assumed that inland water area isunchanged from 1990 to 2000.
N/A
Forest expansion N/A N/A
Deforestation N/A N/A
FRA 2015 – Country Report, Denmark
13
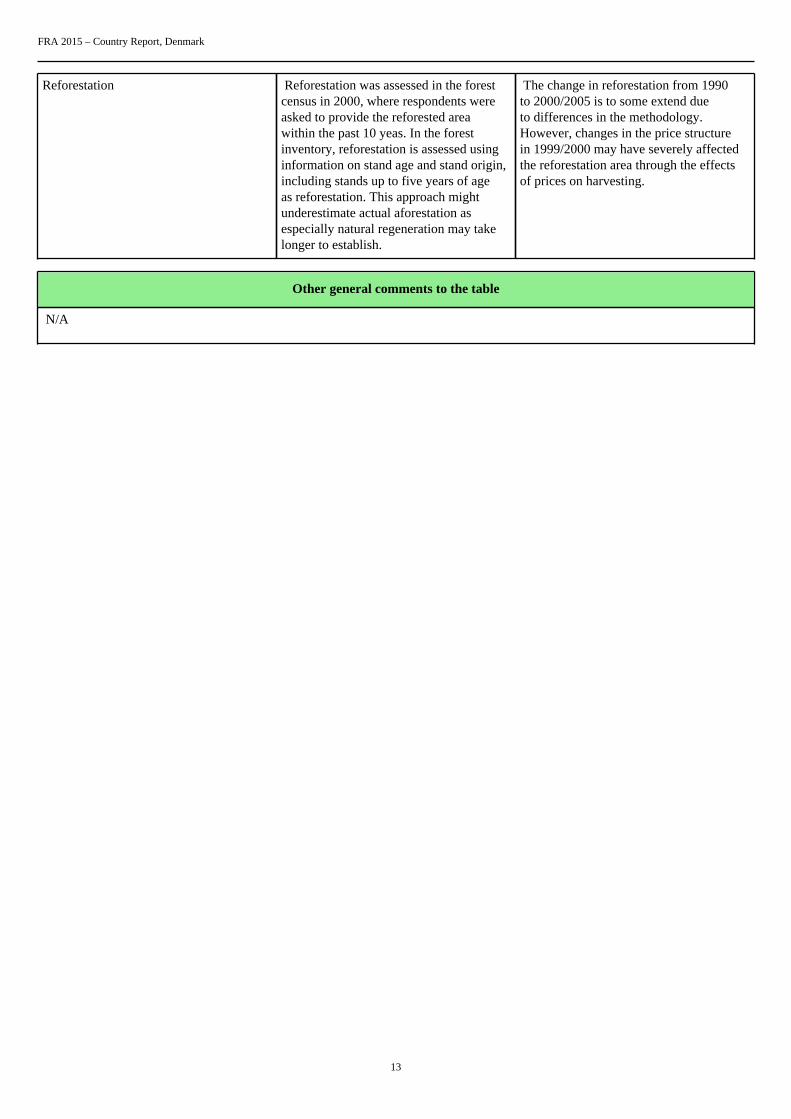
Reforestation Reforestation was assessed in the forestcensus in 2000, where respondents wereasked to provide the reforested areawithin the past 10 yeas. In the forestinventory, reforestation is assessed usinginformation on stand age and stand origin,including stands up to five years of ageas reforestation. This approach mightunderestimate actual aforestation asespecially natural regeneration may takelonger to establish.
The change in reforestation from 1990to 2000/2005 is to some extend dueto differences in the methodology.However, changes in the price structurein 1999/2000 may have severely affectedthe reforestation area through the effectsof prices on harvesting.
Other general comments to the table
N/A

FRA 2015 – Country Report, Denmark
14
2. What is the area of natural and planted forest and how has it changed over time?Documents for this question:
• Guide for country reporting FRA 2015• FRA 2015 Terms and Definitions
2.1 Categories and definitions
Term Definition
Naturally regeneratedforest
Forest predominantly composed of trees established through natural regeneration.
Naturalized introducedspecies
Other naturally regenerated forest where the tree species are predominantly non-native and do not needhuman help to reproduce/maintain populations over time.
Introduced species A species, subspecies or lower taxon occurring outside its natural range (past or present) and dispersalpotential (i.e. outside the range it occupies naturally or could occupy without direct or indirectintroduction or care by humans).
Category Definition
Primary forest Naturally regenerated forest of native species where there are no clearly visible indications of humanactivities and the ecological processes are not significantly disturbed.
Other naturallyregenerated forest
Naturally regenerated forest where there are clearly visible indications of human activities.
...of which of introducedspecies (sub-category)
Other naturally regenerated forest where the trees are predominantly of introduced species.
...of which naturalized(sub-sub category)
Other naturally regenerated forest where the trees are predominantly of naturalized introduced species.
Planted forest Forest predominantly composed of trees established through planting and/or deliberate seeding.
...of which of introducedspecies (sub-category)
Planted forest where the planted/seeded trees are predominantly of introduced species.
Mangroves Area of forest and other wooded land with mangrove vegetation.
...of which planted (sub-category)
Mangroves predominantly composed of trees established through planting.
2.2 National data
2.2.1 Data sources
References to sourcesof information
Variables Years Additional comments

FRA 2015 – Country Report, Denmark
15
1 Johannsen et al. (2013) All 2015 2010 2005 2000 1990 The estimates for 2005,2010 and 2015 are basedon data collected with theDanish NFI 2002-2012.Estimates for 2005 arebased on data collectedin 2002-2006. Estimatesfor 2010 are based on datacollected for 2006-2010.Estimates for 2015 arebased on data collectedin 2008-2012, assumingan annual aforestation of1900 ha. Estimates for1990 and 2000 are based onextrapolation.
2 N/A N/A N/A N/A
3 N/A N/A N/A N/A
4 N/A N/A N/A N/A
2.2.2 Classification and definitions
National class Definition
1) even-aged, planting Forests established by planting
2) even-aged, natural regeneration Forests established by natural seed fall after site preparation
3) Unevenaged, managed Forests established by natural seed fall, but where there areevident traces of management.
5) uneven-aged, natural forest Forests established by natural seed fall, where the forest structureis similar to natural forests.
7) coppice Stands managed by coppice. Typically stands of salix species forenergy production.
8) protective forest Forests planted mostly for protecting agricultural lands
9) grazing forest Forests with grazing animals. Mostly for preservation of specificecotypes.
10) Christmas trees and greenery Planted stands of Nordmann fir and noble fir for Christmas treeand greenery production.
2.2.3 Original data
Information regarding forest characteristics was collected in the 2006 forest inventory based on a visualinspection by the measurement crews. Similar information was not obtained in relation to the 1990 and 2000inventories. The distribution of different management forms observed on the national forest inventory plots isshown in the table below.

FRA 2015 – Country Report, Denmark
16
managem_name Total Indiginous Foreign Temporarilyunstocked
Auxiliaryareas
Unknown
Total 608.078 300.932 277.957 12.057 8.299
8.834
Evenagedplanting
402.792 155.297 241.605 2.024 110
3.755
Evenaged,naturalregeneration
54.494 44.389 9.488 210 407
Unevenaged,managed
47.907 38.677 8.550 680
Unevenaged,natural
39.618 32.293 5.497 13 1.814
Ancientmanagementforms
6.073 4.485 1.278 309
Protectiveforest
15.565 10.154 4.777 35 56
543
Other 21.709 14.635 5.546 735 68
725
Unknown 19.921 1.001 1.214 9.040 8.066
600
2.3 Analysis and processing of national data
2.3.1 Adjustment
To ensure that total forest areas sum up to
2.3.2 Estimation and forecasting
The identification of forest types for this survey is based on a visual assessment of management activity onthe sample plots in the 2002-2006 survey. When estimating the area of forest types in the other years we haveassumed that the distribution of forest types is unchanged in the different years. It is further assumed that theOther category (of which much is really Unknown) is distributed among the other categories according to theshare of the individual category.
The area of introduced species in the planted and naturally regenerated forests, respectively, represents onlythe area where introduced species have been observed and not areas where no species type have been recorded.Hence the true area of introduced species is probably a little larger.

FRA 2015 – Country Report, Denmark
17
In the 1990 and 2000 forest surveys, no assessment was made of the forest characteristics. Thus, the area ofplanted and naturally regenerated forest in 1990 and 2000 has been estimated under the assumption that thedistribution is similar to that in 2005. The area in 2010 has been forecasted under the assumption that thedistribution of planted and naturally regenerated forest in existing forests is unchanged and that all afforestationis planted.
2.3.3 Reclassification
National class FRA 2010 category
Even-aged, planting Planted forest
Even-aged, natural regeneration Other naturally regenerated forest
Historic management forms Other naturally regenerated forest
Ueven-aged, managed Other naturally regenerated forest
Uneven-aged, undistirbed Primary forest
Protection Planted forest
Other Temporarily unstocked and auxilary areas.
To ensure that forest areas sum up to the same total, temporarily unstocked and auxillary areas, totalling 20,356ha, were assigned to "Planted forest". It would be better if the FRA table included a category named "Other"or similar.
2.4 DataTable 2a
Forest area (000 hectares)Categories
1990 2000 2005 2010 2015
Primary forest 30 32 31 32 34
Other naturally regeneratedforest
102 110 104 101 114
... of which of introducedspecies
24 26 25 21 25
... of which naturalized 0 0 0 0 0

FRA 2015 – Country Report, Denmark
18
Planted forest 412 443 422 454 464
... of which of introducedspecies
239 258 246 255 256
TOTAL 544.00 585.00 557.00 587.00 612.00
Table 2b
Primary forest converted to (000 ha)
1990-2000 2000-2010 2010-2015
Othernatural
regenerationPlanted Other land
Othernatural
regenerationPlanted Other land
Othernatural
regenerationPlanted Other land
0 0 0 0 0 0 0 0 0
Table 2c
Area (000 hectares)Categories
1990 2000 2005 2010 2015
Mangroves (forest and OWL) 0 0 0 0 0
... of which planted 0 0 0 0 0
Tiers
Category Tier for status Tier for reported trend
Primary forest Tier 3 Tier 3
Other naturally regenerated forest Tier 3 Tier 3
Planted forest Tier 3 Tier 3
Mangroves Tier 3 Tier 3
Tier Criteria
Category Tier for status Tier for reported trend
Primary forest/Other naturally regeneratedforest/Planted forest
Tier 3 : Data sources: Recent (less than10 years) National Forest Inventory orremote sensing with ground truthing ordata provided by official agencies orprogramme for repeated compatible NFIsTier 2 : Data sources: Full cover mapping/remote sensing or old NFI (more than 10years) Tier 1 : Other
Tier 3 : Estimate based on repeatedcompatible tiers 3 (tier for status) Tier 2 :Estimate based on repeated compatible tier2 or combination tier 3 and 2 or 1 (tier forstatus) Tier 1 : Other
2.5 Comments

FRA 2015 – Country Report, Denmark
19
CategoryComments related todata definitions etc
Comments on reported trend
Primary forest Only a very limited number of the forestsare truly primary. The identificationof primary forest types for this surveyis based on a visual assessment ofmanagement activity on the sample plots.
There is a slight increase in the areaof primary forest. The reason for thistrend is that the Ministry of Environmentin 1992 made the strategy for Danishnatural forests and other important foresttypes (published in 1994). This strategyimplied that previously managed forestwas laid out as undisturbed forest. Asthe visible indications of human activitygradually disappear, these forest areas willgradually become 'primary' according tothe definition in FRA 2015.
Other naturally regenerating forest The identification of forest types for thissurvey is based on a visual assessment ofmanagement activity on the sample plots.
The reported trend is caused by thechosen methodology for calculating thedistribution of forest management typesin 1990 and 2000, which is based onthe assumption that the distribution ofmanagement types is unchanged. As theforest area is increasing this also causesboth planted and naturally regeneratedforest to increase. This assumption maynot be valid as focus on conversion tonear-natural forest management in recentdecades has probably increased the area ofnaturally regenerated forest stands.
Planted forest The identification of forest types for thissurvey is based on a visual assessment ofmanagement activity on the sample plots.
The reported trend is caused by thechosen methodology for calculating thedistribution of forest management typesin 1990 and 2000, which is based onthe assumption that the distribution ofmanagement types is unchanged. As theforest area is increasing this also causesboth planted and naturally regeneratedforest to increase. This assumption maynot be valid as focus on conversion tonear-natural forest management in recentdecades has probably increased the area ofnaturally regenerated forest stands.
Mangroves N/A N/A
Other general comments to the table
The amount of truly primary forest in Denmark is very limited (in fact only two forests are considered primary: Draved forest andSuserup forest). However, according to the definition in FRA 2010, the forests need not be undisturbed by man to be consideredprimary but there should be no visible indications of human activity. In the MCPFE report only the truly primary forest area wasreported whereas the reporting in 2015 is in accordance with the abovementioned definition.

FRA 2015 – Country Report, Denmark
20
3. What are the stocks and growth rates of the forests and how have they changed?Documents for this question:
• Guide for country reporting FRA 2015• FRA 2015 Terms and Definitions
3.1 Categories and definitions
Category Definition
Growing stock Volume over bark of all living trees with a minimum diameter of 10 cm at breast height (or abovebuttress if these are higher). Includes the stem from ground level up to a top diameter of 0 cm,excluding branches.
Net Annual Increment(NAI)
Average annual volume of gross increment over the given reference period less that of natural losses onall trees, measured to minimum diameters as defined for "Growing stock".
Above-ground biomass All living biomass above the soil including stem stump branches bark seeds and foliage.
Below-ground biomass All biomass of live roots. Fine roots of less than 2 mm diameter are excluded because these often cannotbe distinguished empirically from soil organic matter or litter.
Dead wood All non-living woody biomass not contained in the litter either standing lying on the ground or in thesoil. Dead wood includes wood lying on the surface dead roots and stumps larger than or equal to 10 cmin diameter or any other diameter used by the country.
Carbon in above-groundbiomass
Carbon in all living biomass above the soil including stem stump branches bark seeds and foliage.
Carbon in below-groundbiomass
Carbon in all biomass of live roots. Fine roots of less than 2 mm diameter are excluded because theseoften cannot be distinguished empirically from soil organic matter or litter.
Carbon in dead wood Carbon in all non-living woody biomass not contained in the litter, either standing, lying on the ground,or in the soil. Dead wood includes wood lying on the surface, dead roots and stumps larger than or equalto 10 cm in diameter or any other diameter used by the country.
Carbon in litter Carbon in all non-living biomass with a diameter less than the minimum diameter for dead wood (e.g.10 cm ) lying dead in various states of decomposition above the mineral or organic soil.
Soil carbon Organic carbon in mineral and organic soils (including peat) to a soil depth of 30 cm.
3.2 National data
3.2.1 Data sources
References to sourcesof information
Variables Years Additional comments
1 Johannsen et al. 2013 All 2015 2010 2005 Growing stock and netgrowth estimates for 2005and 2010 are based onmeasurements of the DanishNFI. Stocks in 2015 arebased on the the stocks in2012, assuming no change ingrowing stock until 2015.
FRA 2015 – Country Report, Denmark
21
2 Larsen and Johannsen (2002) growing stock Above-ground biomas Below-groundbiomass Carbon in above-ground biomass Carbon inbelow-ground biomass
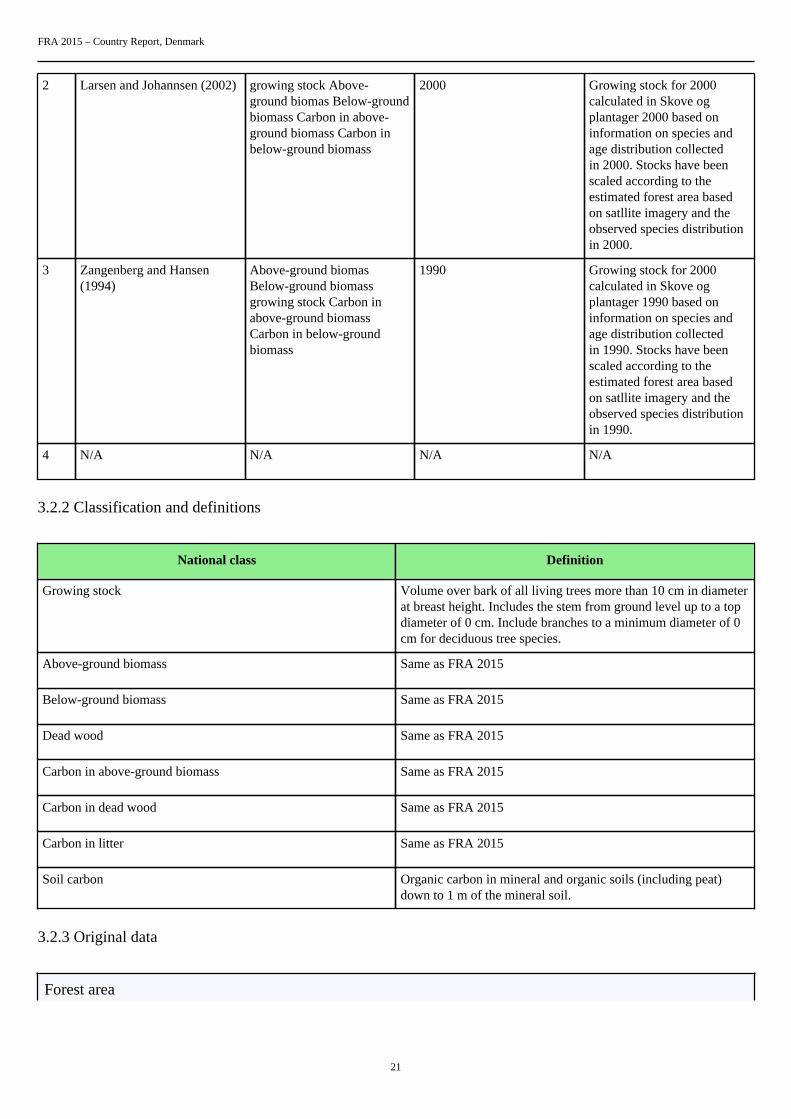
2000 Growing stock for 2000calculated in Skove ogplantager 2000 based oninformation on species andage distribution collectedin 2000. Stocks have beenscaled according to theestimated forest area basedon satllite imagery and theobserved species distributionin 2000.
3 Zangenberg and Hansen(1994)
Above-ground biomasBelow-ground biomassgrowing stock Carbon inabove-ground biomassCarbon in below-groundbiomass
1990 Growing stock for 2000calculated in Skove ogplantager 1990 based oninformation on species andage distribution collectedin 1990. Stocks have beenscaled according to theestimated forest area basedon satllite imagery and theobserved species distributionin 1990.
4 N/A N/A N/A N/A
3.2.2 Classification and definitions
National class Definition
Growing stock Volume over bark of all living trees more than 10 cm in diameterat breast height. Includes the stem from ground level up to a topdiameter of 0 cm. Include branches to a minimum diameter of 0cm for deciduous tree species.
Above-ground biomass Same as FRA 2015
Below-ground biomass Same as FRA 2015
Dead wood Same as FRA 2015
Carbon in above-ground biomass Same as FRA 2015
Carbon in dead wood Same as FRA 2015
Carbon in litter Same as FRA 2015
Soil carbon Organic carbon in mineral and organic soils (including peat)down to 1 m of the mineral soil.
3.2.3 Original data
Forest area

FRA 2015 – Country Report, Denmark
22
Area (hectares)
1990 2000 2005 2010 2015
Forest 543.249 585.454 557.719 587.077 608.078
Conifers 332.065 356.478 289.745 296.001 303.758
Broadleaves 113.448 130.678 245.625 269.709 281.863
Growing stock
Original data was collected in the inventories in 1990, 2000 and 2002-2005, 2006-2010 and 2008-2012. In1990 and 2000 , growing stock estimates were based on the observed species and age class distribution of theforest area and common yield tables for Danish forest tree species. In the latter inventory, growing stock wascalculated based on the individual tree measurements on the national forest inventory plots.
3D - forest 3D-OWL
Year 1990 2000 2005 2010 2012 1990 2000 2005 2010 2012
Area 543.249 585.454 557.719 587.077 608.078 139.000
139.000
41.579
47.002
45.468
Volume 114.335 118.017 125.176 3.683
3.683
1.102
1.026
613
Biomass - ag 62.613 64.470 68.464 1.917
1.917
573
539
334
Biomass -bg 12.283 12.676 13.516 456
456
136
128
73
Carbon - ag 29.313 31.654 31.306 32.235 34.232 958
958
287
269
167
Carbon - bg 4.721 5.096 6.142 6.338 6.758 228
228
68
64
36
Deadwoodvolume
3.005 3.248 3.449 100
100
30
89
65
Deadwoodbiomass
1.255 2.470 2.763 40
40
12
41
31
Deadwoodcarbon
466 526 628 1.235 1.381 20
20
6
21
15
Litter carbon 6.710 6.500 5.620 6.958 7.470 1.324
1.324
396
413
398
Mineral soilcarbon
91.700 99.415 95.277 99.369 103.012 29.234
29.234
8.745
10.358
9.464

FRA 2015 – Country Report, Denmark
23
3B 1990 2000 2005 2010 2012
Fagus sylvatica 17300 18267 29157 29062 31462
Picea abies 18900 25150 23185 21426 22036
Quercus robur 3600 4835 9667 11626 11760
Picea sitchensis 4900 6578 7368 7640 7518
Fraxinus exelsior 1000 1292 5493 5410 5402
Acerpseudoplatanus
800 1210 4877 5106 6114
Pinus sylvestris 5761 4867 4831 4913
Betula sp. 1200 3483 4358 4279 4810
Larix sp. 3646 3750 4099 4627
Abies alba 3100 4405 2462 3738 3743
Dead wood
Dead wood biomass and carbon is estimated from measurements with the Danish NFI 2002-2012
Litter
Estimation of carbon in the litter layer is based on the measurements of the litter-layer in the sample plots ofthe Danish NFI .
Mineral soil
Mineral soil carbon is estimated based on average carbon on different soil types and the distribution of the NFIplots to those types.
Mineral soil carbon
3.3 Analysis and processing of national data
3.3.1 Adjustment
Biomass and carbon stock

FRA 2015 – Country Report, Denmark
24
No adjustment has been made.
3.3.2 Estimation and forecasting
Growing stock
When forecasting the growing stock in 2015 it is assumed that the volume is unchanged from the volumeestimates for 2012.
Growing stock in 1990 and 2000 is estimated based on the average volume of broadleaves and conifers in2005, the estimated forest area based on satellite imagery and the observed area distribtion for broadleaves andconifers observed in the 1990 and 2000 inventories.
When calculating the growing stock on other wooded land in 1990 and 2000 it is assumed that the growingstock per hectare is identical to the growing stock per hectare in 2005.
Biomass stock
Biomass has been calculated, using the same standard as in the EEFSC reporting of carbon balances in Denmark.Growing stock has been converted to total biomass using species specific basic densities and expansion factors.
The biomass of deadwood is calculated using the densities in Table 1 and a reduction factor according to thestructural decay of the wood (see table belowTable 2).
Table1. Wood density of common tree species in Denmark.
Broadleaves Density Conifers Density
Tons per m 3 Tons per m 3
Beech 0.56 Norway spruce 0.38
Oak 0.57 Sitka spruce 0.37
Other broadleaves 0.56 Mountain pine 0.48
Sycamore 0.49 Contorta pine 0.37
Ash 0.56 Scots pine 0.43
Other pines 0.43
Silver fir 0.38

FRA 2015 – Country Report, Denmark
25
Nordmann fir 0.38
Noble fir 0.38
Douglas fir 0.41
Larch 0.45
Other conifers 0.38
Table2. Reduction factor according to the degree of structural decay for conifers and broadleaves.
Structural decay Reduction factor
Broadleaves Conifers
1 0.804 0.895
2 0.607 0.632
3 0.429 0.605
4 0.304 0.447
No measurements of deadwood were carried out in 1990 and 2000. Forecasting the amount of dead wood in theforest was made by assuming that the amount of dead wood per hectare is unchanged in 1990, 2000 and 2005.
As with the estimation of growing stock for 1990 and 2000, it is assumed that the average above- andbelowground biomass per hectare for deciduous and coniferous forest, respectively, is unchanged using theobserved area distribution to these forest types in the two surveys and the estimated forest area.
Carbon in biomass and dead wood (se table 7) has been estimated by multiplying biomass by a factor of 0.5.
Estimation of carbon in the litter layer is based on the measurements of the litter-layer in the sample plots of theDanish NFI . The depth is converted to volume per hectare and to biomass per hectare by applying observeddensity of the litter layer for different species (see table below). Carbon content in the litter layer was obtainedby multiplying the biomass with a factor 0.5.
The carbon content of the litter layer in 1990 and 2000 was obtained by assuming unchanged litter layer andusing the species-wise estimates of carbon per hectare obtained from the above analyses. C
Density of the litter layer in forest stands for different tree species (Vesterdal & Raulund-Rasmussen,1998).

FRA 2015 – Country Report, Denmark
26
Deciduousspecies
Density Coniferousspecies
Density
Tons per m 3 Tons per m 3
Beech 0.55 Norway spruce 1.09
Oak 0.36 Sitka spruce 0.86
Ash 0.55 Silver fir 1.09
Sycamore 0.55 Pines 0.79
Other broadleaves 0.55 Nordmann fir 1.09
Noble fir 1.09
Other conifers 0.94
3.3.3 Reclassification
No reclassification done.
3.4 DataTable 3a
Growing stock volume (million m 3 over bark)
Forest Other wooded landCategory
1990 2000 2005 2010 2015 1990 2000 2005 2010 2015
Totalgrowingstock
67 94 110 113 120 3.7 3.7 0.9 0.9 0.5
... ofwhichconiferous
38 59 51 52 54 0.4 0.4 0.1 0.1 0.1
... ofwhichbroadleaved
29 35 59 62 67 3.3 3.3 0.8 0.8 0.4
Table 3b
Category/Species name Growing stock in forest (million cubic meters)
FRA 2015 – Country Report, Denmark
27
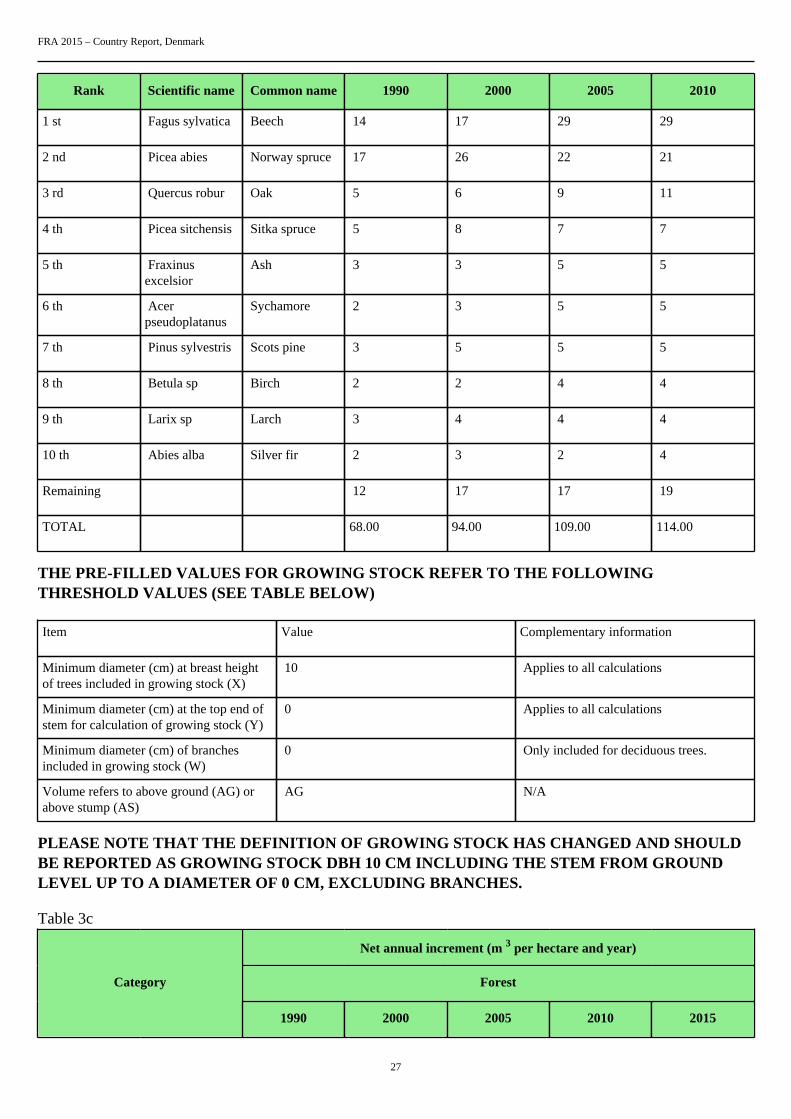
Rank Scientific name Common name 1990 2000 2005 2010
1 st Fagus sylvatica Beech 14 17 29 29
2 nd Picea abies Norway spruce 17 26 22 21
3 rd Quercus robur Oak 5 6 9 11
4 th Picea sitchensis Sitka spruce 5 8 7 7
5 th Fraxinusexcelsior
Ash 3 3 5 5
6 th Acerpseudoplatanus
Sychamore 2 3 5 5
7 th Pinus sylvestris Scots pine 3 5 5 5
8 th Betula sp Birch 2 2 4 4
9 th Larix sp Larch 3 4 4 4
10 th Abies alba Silver fir 2 3 2 4
Remaining 12 17 17 19
TOTAL 68.00 94.00 109.00 114.00
THE PRE-FILLED VALUES FOR GROWING STOCK REFER TO THE FOLLOWINGTHRESHOLD VALUES (SEE TABLE BELOW)
Item Value Complementary information
Minimum diameter (cm) at breast heightof trees included in growing stock (X)
10 Applies to all calculations
Minimum diameter (cm) at the top end ofstem for calculation of growing stock (Y)
0 Applies to all calculations
Minimum diameter (cm) of branchesincluded in growing stock (W)
0 Only included for deciduous trees.
Volume refers to above ground (AG) orabove stump (AS)
AG N/A
PLEASE NOTE THAT THE DEFINITION OF GROWING STOCK HAS CHANGED AND SHOULDBE REPORTED AS GROWING STOCK DBH 10 CM INCLUDING THE STEM FROM GROUNDLEVEL UP TO A DIAMETER OF 0 CM, EXCLUDING BRANCHES.
Table 3c
Net annual increment (m 3 per hectare and year)
ForestCategory
1990 2000 2005 2010 2015

FRA 2015 – Country Report, Denmark
28
Net annualincrement
9 9.2 8.7 8.6 8.7
... of whichconiferous
7.2 7.2 6.2 6 6.3
... of whichbroadleaved
1.8 2 2.5 2.6 2.4
Table 3d
Biomass (million metric tonnes oven-dry weight)
Forest Other wooded landCategory
1990 2000 2005 2010 2015 1990 2000 2005 2010 2015
Abovegroundbiomass
59 63 63 64 68 2 2 1 1 0
Belowgroundbiomass
9 10 12 13 14 0 0 0 0 0
Deadwood
1 1 1 2 3 0 0 0 0 0
TOTAL 69.00 74.00 76.00 79.00 85.00 2.00 2.00 1.00 1.00 .00
Table 3e
Carbon (Million metric tonnes)
Forest Other wooded landCategory
1990 2000 2005 2010 2015 1990 2000 2005 2010 2015
Carbonin abovegroundbiomass
29 32 31 32 34 1 1 0 0 0
Carbonin belowgroundbiomass
5 5 6 6 7 0 0 0 0 0
SubtotalLivingbiomass
34 37 37 39 41 1 1 0 0 0
Carbonin deadwood
0 1 1 1 1 0 0 0 0 0
Carbonin litter
7 7 6 7 7 1 1 0 0 0

FRA 2015 – Country Report, Denmark
29
SubtotalDeadwoodand litter
7 7 6 8 9 2 2 0 1 1
Soilcarbon
92 99 95 99 103 29 29 9 10 9
TOTAL 133.00 144.00 139.00 145.00 152.00 31.00 31.00 9.00 10.00 9.00
Tiers
Variable/category Tier for status Tier for trend
Total growing stock Tier 3 Tier 3
Net annual increment Tier 3 Tier 3
Above ground biomass Tier 2 Tier 2
Below ground biomass Tier 2 Tier 2
Dead wood Tier 3 Tier 3
Carbon in above-ground biomass Tier 2 Tier 2
Carbon in below ground biomass Tier 2 Tier 2
Carbon in dead wood and litter Tier 2 Tier 2
Soil carbon Tier 2 Tier 2
Tier criteria
Category Tier for status Tier for reported trend
Total growing stock Tier 3: Data sources Recent 10 yearsNational Forest Inventory or remotesensing with ground truthing orprogramme for repeated compatible NFI10 years Domestic volume functions Tier2: Data sources/registers and statisticsmodelling or old NFI 10 years or partialfield inventory Tier 1: Other data sources
Tier 3: Estimate based on repeatedcompatible tiers 3 (tier for status)Domestic growth functions Tier 2:Estimate based on repeated compatible tier2 or combination tier 3 and 2 or 1 tier forstatus Tier 1: Other
Net annual increment Tier 3: Scientifically tested nationalvolume and growth functions Tier 2:Selection of volume and growth functionsas relevant as possible Tier 1: Other
Tier 3: Confirmation/adjustment offunctions used through scientific workTier 2: Review work done to seekalternative functions Tier: 1 Other

FRA 2015 – Country Report, Denmark
30
Biomass Tier 3: Country-specific national or sub-national biomass conversion expansionfactors applied or other domestic orotherwise nationally relevant biomassstudies Tier 2: Application of countryspecific national or sub-national biomassconversion factors from other countrywith similar climatic conditions and foresttypes Tier 1: International/regional defaultbiomass expansion factors applied
Tier 3 : Estimate based on repeatedcompatible tiers 3 (tier for status) Tier 2 :Estimate based on repeated compatible tier2 or combination tier 3 and 2 or 1 (tier forstatus) Tier 1 : Other
• Carbon in above ground biomass• Carbon in below ground biomass• Carbon in dead wood and litter• Soil carbon
Tier 3: Country-specific national or sub-national biomass conversion expansionfactors applied Tier 2: Applicationof country specific national or sub-national biomass conversion factorsform from other country with similarclimatic conditions and forest types Tier1: International/regional default biomassexpansion factors applied
Tier 3 : Estimate based on repeatedcompatible tiers 3 (tier for status) Tier 2 :Estimate based on repeated compatible tier2 or combination tier 3 and 2 or 1 (tier forstatus) Tier 1 : Other
3.5 Comments on growing stock biomass and carbon
CategoryComments related todata definitions etc
Comments on the reported trend
Total growing stock From the table comments it appearsthat growing stock definitions have beenaltered to include only trees exceeding 10cm. As a general note, I find it unfortunateto have this definition for growing stockwhen the definition of above groundbiomass and carbon pools in this andother reporting (e.g. for the UNFCCC)include all trees larger than 0 cm. Furtherit is unclear from the document if annualincrement include trees smaller than 10cm and if not whether the diameter limitrefers to the diameter observed in the firstor second inventory used for calculatinggrowth. I believe that a much more soundand consistent definition would be to use adiameter limit of 0 cm.
Large changes have been observed in thevolumes of especially deciduous trees.Part of the reason is that unfavourableprices in the recent decade have ledto postponing thinning in broadleavesand a build up of biomass. Anotherand perhaps more significant reason isthe change in methodology from thequestionnaire surveys in 1990 and 2000to the sample-based survey started in2002. Apparently, the models underlyingthe calculation of growing stock in 1990and 2000 have predicted generally lowervolumes per hectare than observed inthe field. Among the reasons for thisare less intensive thinning regimes andoverlapping generations, especially inbeech. As the actual reason for the changein stocking level is not known and becauseeffects are probably confounded we didnot attempt to recalculates growing stockin 1990 and 2000 based on the 2006inventory.

FRA 2015 – Country Report, Denmark
31
Growing stock of broadleaved coniferous N/A A large increase in volume have beenobserved for all broadleaved species andespecially so for beech. The apparentreason for this is less intensive thinningand tending regimes in young standsthan used in the models underlying theestimates in 1990 and 2000. Anotherreason is a general change towards near-natural forestry that has spurred naturalregeneration and overlapping generationsin broadleaves and hereby generally highervolumes per hectare.
Growing stock composition Some of the categories are a group ofspecies. There is a difference betweenthe two data sources with respect tothe species group Pinus spp. In 1990 itonly included Pinus mugo, whereas itin 2000 included all pines, especiallyPinus sylvestris. The species Fagussylvatica, Pinus sylvestris, Quercus robur,Fraxinus exelsior and Acer pseudoplatanusare considered native tree species. Theremaining trees are introduced species
N/A
Net annual increment N/A N/A
Above-ground biomass As with the above tables on growingstock, the change in methodology fromquestionnaire surveys (1990, 2000) tosample based surveys (2006) denoteda shift from model-based estimationof above-ground biomass to actualmeasurements.
N/A
Below-ground biomass The estimation of below-ground biomassrelies on expansion factors. The appliedexpansion factors in this study are quitesimple. New expansion factors arecurrently being developed for commontree species in Denmark.
N/A
Dead wood The assessment of dead wood biomassin the Danish forests was undertaken forthe first time in 2006. Consequently, deadwood biomass in 1990 and 2000 wasestimated under the assumption that deadwood biomass per hectare is unchanged.
N/A
Carbon in above-ground biomass N/A N/A
Carbon in below-ground biomass N/A N/A
Carbon in dead wood Estimates in 1990 and 2000 are based onthe assumption that the amount of deadwood per hectare is similar to the observedin 2005. Forecasting dead wood carbon in2010 is done in a similar fashion.
N/A
FRA 2015 – Country Report, Denmark
32
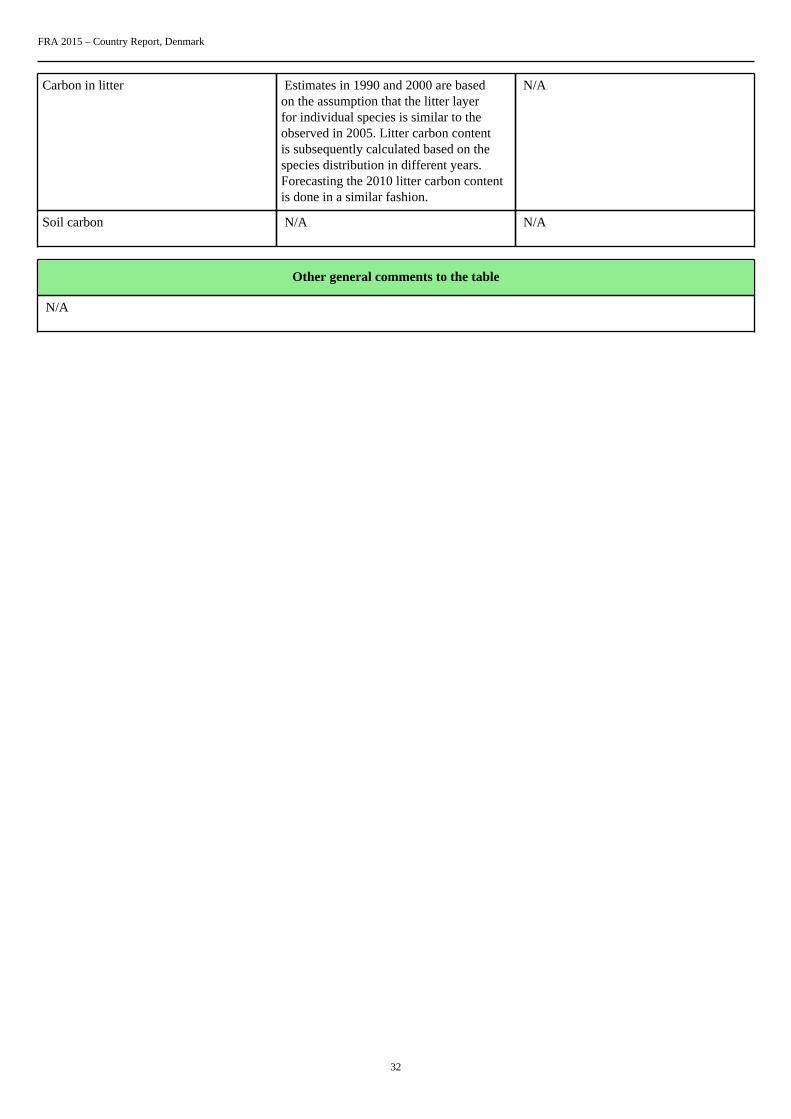
Carbon in litter Estimates in 1990 and 2000 are basedon the assumption that the litter layerfor individual species is similar to theobserved in 2005. Litter carbon contentis subsequently calculated based on thespecies distribution in different years.Forecasting the 2010 litter carbon contentis done in a similar fashion.
N/A
Soil carbon N/A N/A
Other general comments to the table
N/A

FRA 2015 – Country Report, Denmark
33
4. What is the status of forest production and how has it changed over time?Documents for this question:
• Guide for country reporting FRA 2015• FRA 2015 Terms and Definitions
4.1 Categories and definitions
Term Definition
Primary designatedfunction
The primary function or management objective assigned to a management unit either by legalprescription documented decision of the landowner/manager or evidence provided by documentedstudies of forest management practices and customary use.
Non wood forest product(NWFP)
Goods derived from forests that are tangible and physical objects of biological origin other than wood.
Commercial value ofNWFP
For the purpose of this table, value is defined as the commercial market value at the forest gate.
Category Definition
Production forest Forest area designated primarily for production of wood, fibre, bio-energy and/or non-wood forestproducts.
Multiple use forest Forest area designated for more than one purpose and where none of these alone is considered as thepredominant designated function.
Total wood removals The total of industrial round wood removals and woodfuel removals.
...of which woodfuel The wood removed for energy production purposes, regardless whether for industrial, commercial ordomestic use.
4.2 National data
4.2.1 Data sources
References to sourcesof information
Variables Years Additional comments
1 Johannsen et al., 2013 Production forest/multipleuse forest
2010 2005 2015 N/A
2 Larsen and Johannsen (2002) Production forest/multipleuse forest
2000 N/A
3 Statistics Denmark,LBFI1: Landbrugetsbruttofaktorindkomst eftertype
Christmas trees and greenery 2010 N/A
4 Statistics Denmark, SKOV6:Hugsten i skove og plantageri Danmark efter område,træsort og areal
Forest Removals 1990-2011 N/A
4.2.2 Classification and definitions
National class Definition

FRA 2015 – Country Report, Denmark
34
N/A N/A
N/A N/A
N/A N/A
N/A N/A
4.2.3 Original data
4a Production forest/Multiple use forest
Most Danish forests are productive, managed for the purpose of producing wood for industry and bioenergy.However, as stated in the forest act, the forests are at the same time managed for multiple uses. For the stateforests this is stated directly in the strategy for management of the state forests (Ministry of Environment, 2002).Consequently, all state forests are perceived as managed for multiple use.
Data on the the area covered by state forest in 1990 and 2000 are provided by the two questionnaire surveys,assuming that they assessed the state forest area correctly. Area covered by state forest in 2005, 2010 and 2015were assessed using NFI data.
4b Christmas trees and greenery
Figures are provided by Statistics Denmark and represent the GDP of the two products.
4c Forest removals
Figures are provided by Statistics Denmark in volume o.b. and were converted to u.b. by dividing by 1.15.Values represent harvested product at roadside.
4.3 Analysis and processing of national data
4.3.1 Adjustment
No calibration has been carried out.
4.3.2 Estimation and forecasting
Forecasting of the multiple use forest area was made by assuming that all afforestation from 2012 to 2015 wereconducted by private owners.

FRA 2015 – Country Report, Denmark
35
4.3.3 Reclassification
It is generally assumed that public forests are managed according to the criteria for multiple use and that privateforests are production forests.
4.4 DataTable 4a
Forest area (000 hectares)Categories
1990 2000 2005 2010 2015
Production forest 426 464 403 459 484
Multiple useforest
110 96 117 90 91
Table 4b
Rank Name of product Key species
Commercial valueof NWFP removals
2010 (value 1000local currency)
NWFP category
1 st Christmas trees andgreenery
Abies nordmaniana,Abies procera
1055000 8
2 nd N/A N/A N/A N/A
3 rd N/A N/A N/A N/A
4 th N/A N/A N/A N/A
5 th N/A N/A N/A N/A
6 th N/A N/A N/A N/A
7 th N/A N/A N/A N/A
8 th N/A N/A N/A N/A
9 th N/A N/A N/A N/A
10 th N/A N/A N/A N/A
TOTAL 1055000.00
2010
Name of local currency DKK (Danish crowns)

FRA 2015 – Country Report, Denmark
36
Category
Plant products / raw material
1 Food
2 Fodder
3 Raw material for medicine and aromatic products
4 Raw material for colorants and dyes
5 Raw material for utensils handicrafts construction
6 Ornamental plants
7 Exudates
8 Other plant products
Animal products / raw material
9 Living animals
10 Hides skins and trophies
11 Wild honey and beewax
12 Wild meat
13 Raw material for medicine
14 Raw material for colorants
15 Other edible animal products
16 Other non-edible animal products
Table 4c Pre-filled data from FAOSTAT
FRA 2015 category (1000 m 3 u.b.)Year
Total wood removals ...of which woodfuel
1990 1755 353
1991 1664 401
1992 1666 422
1993 1546 471
1994 1611 483

FRA 2015 – Country Report, Denmark
37
1995 1675 487
1996 1632 546
1997 1580 544
1998 1487 476
1999 1492 484
2000 3193 608
2001 1559 596
2002 1397 635
2003 1572 789
2004 1623 826
2005 2576 1114
2006 2043 1005
2007 2217 952
2008 2062 918
2009 2091 1210
2010 2309 1184
2011 2231 1232
Tiers
Category Tier for status Tier for reported trend
Production forest Tier 3 Tier 3
Multiple use forest Tier 3 Tier 3
Tier Criteria
Category Tier for status Tier for reported trend
Production forest Multiple use forest Tier 3: Updated including fieldverifications national forest mapsincluding functions Tier 2: Forest mapsolder than 6 years including forestfunctions Tier 1: Other
Tier 3 : Estimate based on repeatedcompatible tiers 3 (tier for status) Tier 2 :Estimate based on repeated compatible tier2 or combination tier 3 and 2 or 1 (tier forstatus) Tier 1 : Other
4.5 Comments

FRA 2015 – Country Report, Denmark
38
CategoryComments related todata definitions etc
Comments on the reported trend
Production forest Most Danish forests are productive,managed for the purpose of producingwood for industry and bioenergy.However, as stated in the forest act, theforests are at the same time managedfor multiple uses. For the state foreststhis is stated directly in the strategy formanagement of the state forests (Ministryof Environment, 2002). Consequently, allstate forests are perceived as managed formultiple use. For the private forests, mostowners manage their forests according tomultiple goals where hunting, aestheticvalue and nature preservation are often asimportant as wood production. However,as this is not often stated directly in themanagement plan or similar all privateforests are perceived as productionforest. It should however be stressed thatmost privately owned forests are in factmanaged according to the principles ofmultiple use.
N/A
Multiple use forest The Danish forest act, which covers allforests in forest reserves, states that theforests must be managed for multiple uses.For the state forests this is further statedin the strategy for management of thestate forests (Ministry of Environment,2002). Consequently, all state forests areperceived as managed for multiple use.
N/A
Total wood removals Total removals reported are reportedby forest owners to Statisics Denmark.Recent estimates of harvest volumes basedon the NFI, indicate that actual harvestmay be larger. However, we use thenumbers provided by Statistics Denmarkto obtain a consistent time-series and toenable the division into total removals andwood fuels.
N/A
Commercial value of NWFP The value reported correspond to theGDP of the two producs mentioned. OtherNWFP are important in Danish forestry,including revenues from hunting rights.However, no valid data is available for thisNWFP.
N/A
Other general comments to the table

FRA 2015 – Country Report, Denmark
39
In Denmark it may be inappropriate to distinguish between designated functions of the forests. Although most of the Danish forestsare productive, the designated function may best be characterized as #Multiple use#. For the state forests this is stated directly inthe strategy for management of the state forests (Ministry of Environment, 2002). For the private forests, most owners managetheir forests according to multiple goals where hunting, aesthetic value and nature preservation are often as important as woodproduction. The Forest Act requires that the forests are managed sustainably on both private and public forest lands. Sustainablemanagement entail the inclusion of economic as well as ecological and social values on areas designated as forest reserve landand the administration of the Forest Act take a holistic approach to:1) promote the establishment of robust forests, 2) ensure theproductivity of the forests, 3) conserve and increase the biological diversity of the forests, and 4) ensure that proper attention begiven to landscape, natural history, cultural history, environmental protection and outdoor recreation. The following shall applyto the individual area designated as forest reserve land: 1) The area must be stocked with trees, which form or will come to form,a closed canopy forest of high-boled trees within a reasonable period of time. 2) Logging, except thinning, may not be carried outbefore the stand or the individual tree has reached the rotation age (defined by age and/or dimension). 3) No later than 10 years aftersuch logging of a stand, the area must meet the requirement of no. 1. 4) Livestock farming is prohibited. This prohibition does not,however, apply to areas that may be legally kept without trees.

FRA 2015 – Country Report, Denmark
40
5. How much forest area is managed for protection of soil and water and ecosystemservices?Documents for this question:
• Guide for country reporting FRA 2015• FRA 2015 Terms and Definitions
5.1 Categories and definitions
Category Definition
Protection of soil andwater
Forest area designated or managed for protection of soil and water
...of which productionof clean water (sub-category)
Forest area primarily designated or managed for water production, where most human uses are excludedor heavily modified to protect water quality.
...of which coastalstabilization (sub-category)
Forest area primarily designated or managed for coastal stabilization.
...of which desertificationcontrol (sub-category)
Forest area primarily designated or managed for desertification control.
...of which avalanchecontrol (sub-category)
Forest area primarily designated or managed to prevent the development or impact of avalanches onhuman life assets or infrastructure.
...of which erosion, floodprotection or reducingflood risk (sub-category)
Forest area primarily designated or managed for protecting communities or assets from the impacts oferosion riparian floods and landslides or for providing flood plain services.
...of which other (sub-category)
Forest area primarily designated or managed for other protective functions.
Ecosystem services,cultural or spiritual values
Forest area primarily designated or managed for selected ecosystem services or cultural or spiritualvalues.
...of which publicrecreation (sub-category)
Forest area designated or managed for public recreation.
...of which carbon storageor sequestration (sub-category)
Forest area designated or managed for carbon storage or sequestration.
...of which spiritual orcultural services (sub-category)
Forest area designated or managed for spiritual or cultural services.
...of which other (sub-category)
Forest area designated or managed for other ecosystem services.
5.2 National data
5.2.1 Data sources
References to sourcesof information
Variables Years Additional comments
1 Johannsen et al. 2013 All All Reference to generalinformation about forestecosystem services inDenmark.

FRA 2015 – Country Report, Denmark
41
2 Nature Agency Recreational areas 1990 and 2010, 2015 Stand registry of the NatureAgency
3 N/A N/A N/A N/A
4 N/A N/A N/A N/A
5.2.2 Classification and definitions
National class Definition
N/A N/A
N/A N/A
N/A N/A
N/A N/A
5.2.3 Original data
5.3 Analysis and processing of national data
5.3.1 Adjustment
5.3.2 Estimation and forecasting
5.3.3 Reclassification
5.4 DataTable 5a
Forest area (1000 hectares)Categories
1990 2000 2005 2010 2015
Protection of soiland water
0 0 0 0 0
... of whichproduction ofclean water
0 0 0 0 0

FRA 2015 – Country Report, Denmark
42
... of whichcoastalstabilization
0 0 0 0 0
... of whichdesertificationcontrol
0 0 0 0 0
... of whichavalanchecontrol
0 0 0 0 0
... of whicherosion, floodprotection orreducing floodrisk
0 0 0 0 0
... of which other(please specifyin commentsbelow the table)
0 0 0 0 0
Other
N/A
Table 5b
Forest area (1000 hectares)Categories
1990 2000 2005 2010 2015
Ecosystem services,cultural or spiritualvalues
2.4 2.4 2.4 2.4 2.4
...of which publicrecreation
2.4 2.4 2.4 2.4 2.4
...of whichcarbon storage orsequestration
0 0 0 0 0
...of which spiritualor cultural services
0 0 0 0 0
...of which other(please specify incomments belowthe table)
0 0 0 0 0
Tiers
Category Tier for reported trend Tier for status
Protection of soil and water Tier 3 Tier 3
Ecosystem services, cultural or spiritualvalues
Tier 3 Tier 3

FRA 2015 – Country Report, Denmark
43
Tier criteria
Category Tier for status Tier for reported trend
Protection of soil and water Tier 3: High reliability data derived eitherfrom high intensity sample survey or dataobtained from national or state agenciesresponsible for regulations or legislationrelating to soil and water protection. Tier2: Approaches based on low intensityor incomplete sample-based surveys orstudies that provide data for specific areasthat is extrapolated through statisticalanalysis to national level estimates. Tier 1:Other
Tier 3 : Estimate based on repeatedcompatible tiers 3 (tier for status) Tier 2 :Estimate based on repeated compatible tier2 or combination tier 3 and 2 or 1 (tier forstatus) Tier 1 : Other
• Cultural or spiritual values• Public recreation• Spiritual or cultural services• Other
Tier 3: High reliability data derivedeither from high intensity sample surveyor data obtained from national or stateagencies responsible for regulations. Tier2: Approaches based on low intensityor incomplete sample-based surveys orstudies that provide data for specific areasthat is extrapolated through statisticalanalysis to national level estimates. Tier 1:Other
Tier 3 : Estimate based on repeatedcompatible tiers 3 (tier for status) Tier 2 :Estimate based on repeated compatible tier2 or combination tier 3 and 2 or 1 (tier forstatus) Tier 1 : Other
5.5 Comments
CategoryComments related todata definitions etc
Comments on the reported trend
Protection of soil and water See specific comments below. N/A
Production of clean water Forests provide a valuable source of cleanwater, due to the less frequent disturbanceregime compared to agriculture. However,there are no legislation limiting forestmanagement in designated waterprotection areas. In Denmark, 230,660 haof forest land is situated on caption areasfor drinking water.
N/A
Coastal stabilization Many of the forests in western andnorthern Denmark were establihed in1850-1950 for hindering sand drift.Although, these forests may still protectagricultural lands, soil protection is nottheir designated function.
N/A
Desertification control N/A N/A
Avalanche control N/A N/A
Erosion, flood protection or reducing floodrisk
N/A N/A
Other protective functions N/A N/A

FRA 2015 – Country Report, Denmark
44
Ecosystem services, cultural or spiritualvalues
Almost 30,000 ancient monuments havebeen registered in Denmark - of these61 pct. are found in the forests, and areprotected by law. However, although theforests provide protection for the ancientmonuments, this is nowhere the designatedfunction of the forest.
N/A
Public recreation Access to the Danish forests, includingboth private and public forests, is grantedby law. With more than 70 mio. visits ayear, the forests are very important for thepublic recreation. Especially in the stateforests, extensive consideration to publicrecreation is made by forest management.However, only quite few forests aremanaged specifically for recreation. In thissurvey we included Jægersporb Dyrehave(1100 ha) and Marselisborgskovene (1300ha).
N/A
Carbon storage or sequestration Carbon storage is an important asset ofthe Danish forests, but carbon storage isnot the designated function of the forests.
N/A
Spiritual or cultural services See comment for ecosystem services N/A
Other ecosystem services N/A N/A
Other general comments to the table
Most Danish forests are managed for different ecosystem services, including the protection of soil and water, stabelizing sanddunes to the west of the country and at the same time providing protection for cultural inheritance and providing public recreation.This is stated in the forest act for all forests and specifically for the state forests in the strategy for management of the stateforests (Ministry of Environment, 2002). Only very few forests are designated for producing a single ecosystem service as forexample clean water or recreation, but most forest management take the production of ecosystem services into consideration - mostpronounced in the state forests.
FRA 2015 – Country Report, Denmark
45
6. How much forest area is protected and designated for the conservation of biodiversityand how has it changed over time?Documents for this question:
• Guide for country reporting FRA 2015• FRA 2015 Terms and Definitions
6.1 Categories and definitions
Category Definition
Conservation ofbiodiversity
Forest area designated primarily for conservation of biological diversity. Includes but is not limited toareas designated for biodiversity conservation within the protected areas.
Forest area withinprotected areas
Forest area within formally established protected areas independently of the purpose for which theprotected areas were established.
6.2 National data
6.2.1 Data sources
References to sourcesof information
Variables Years Additional comments
1 Nord-Larsen et al. (2008) Primary designated function 2010 2005 The information ondesignated areas is uncertain.
2 Larsen and Johannsen (2002) Primary designated function 2000 1990 The information ondesignated areas is uncertain.
3 Danish Forest and NatureAgency (2001)
Protected areas 2000 2005 Summary statistics onProtected Forest Areas.
4 Danish Forest and NatureAgency (2008)
Protected forest nature typesin NATURA 2000 areas
2005 2010 N/A
5 Danish Nature Agency Areas with designatedfunction, with referenceto formal agreements andregulations
1992, 2002 and 2012 N/A
6 Johannsen et al. 2013b.Evaluering af indsatsen forbiodiversiteten i de danskeskove 1992-2012.
Designated function andprotected areas.
N/A N/A
7 Evaluering af indsatsen forbiodiversiteten i de danskeskove 1992 - 2012
Conservation of Biodiversityand Protected areas
N/A http://ign.ku.dk/formidling/publikationer/rapporter/filer-2013/evaluering-biodiversitet-1992-2012.pdf.
6.2.2 Classification and definitions
National class Definition

FRA 2015 – Country Report, Denmark
46
Forest reserve According to the Danish Forest Act it is mandated to manage so-called forest reserve land with sustainable management - withrespect to economic, ecological and social values. Approx. 70% of the forest area is designated forest reserve land. Forestreserves are not considered to be protected or designated forprotection of biodiversity.
Strict Nature Protection Areas Areas closed to the public due to special scientific values or veryfragile ecology. These areas are considered to be protected anddesignated for protection of biodiversity.
Non-intervention forest Smaller areas of semi-natural (mainly deciduous) forest leftunmanaged with no removal of wood and no drainage. Theseareas have been designated for non-intervention, in principle forperpetuity and are consequently considered to be protected anddesignated for protection of biodiversity.
Areas managed according to the Strategy for Natural Forests Smaller areas of forest designated for historic managementpractices, selective cutting and continuous forest cover. Theareas are protected according to agreements between forestowners and the Danish Nature Agency. As the main objective ismanagement for natural values, these areas are considered to beprotected and designated for protection of biodiversity.
Natura 2000 NATURA 2000 areas include areas protected according to theEU Habitat Directive and Bird Protection Directive. restrictionsare imposed on these areas, as forest owners are mandated toreport planned activities to the Danish Nature Agency, whichthen has the possibility to prohibit such activities. As forestmanagement in general is not restricted, Natura 2000 are notconsidered to be protected or designated for protection ofbiodiversity.
Forest Nature Types Specific forest nature types within NATURA 2000 areasprotected by the Habitat directive art. 17. Areas have beenmapped and are protected from activities damaging the naturetype and the organisms associated with it. These areas areconsequently considered to be protected and designated forprotection of biodiversity.
6.2.3 Original data
Original data consists of maps and data from agreements in reference to the Strategy for Natural Forests, thenon-intervention forests, the protection of specifik forest types (old oak scrubs) and the mapping of the forestnature types according to the Habitat directive in the Natura 2000 areas. The maps area available in GIS formatas well as tables.
6.3 Analysis and processing of national data
6.3.1 Adjustment
The data have been analysed using GIS to avoid double accounting, as some areas have been designatedaccording to more than one proteciton scheme.

FRA 2015 – Country Report, Denmark
47
6.3.2 Estimation and forecasting
The estimation for the period 1990 - 2010 have been based on the available data. The forecasting is based onthe trend from the last period and the forest strategy from 2002 indicating a gradual increase in the forest areadesignated for protection of biodiversity to 10 percent by 2020.
The data was also analysed in the evaluation of activities to protect biodiversity in the forests in the period1992-2012 (Johannsen et al. 2013)
6.3.3 Reclassification
no other reclassification than mentioned above was performed.
6.4 DataTable 6
Forest area (000 hectares)Categories
1990 2000 2005 2010 2015
Conservation ofbiodiversity
5 22 35 36 36
Forest areawithin protectedareas
5 22 35 36 36
Tiers
Category Tier for status Tier for reported trend
Conservation of biodiversity Tier 3 Tier 3
Forest area within protected areas Tier 3 Tier 3
Tier criteria
Category Tier for status Tier for reported trend
• Conservation of biodiversity• Forests within protected areas
Tier 3: Data obtained from national orstate agencies responsible for conservationand protected area or legislation relatingto area protection. Tier 2: Studies thatprovide data for specific areas that isextrapolated through statistical analysis tonational level estimates Tier 1 Other
Tier 3 : Estimate based on repeatedcompatible tiers 3 (tier for status) Tier 2 :Estimate based on repeated compatible tier2 or combination tier 3 and 2 or 1 (tier forstatus) Tier 1 : Other
6.5 Comments
CategoryComments related todata definitions etc
Comments on the reported trend

FRA 2015 – Country Report, Denmark
48
Conservation of biodiversity The area of forests designated forconservation of biodiversity comprisesprotected forest nature types inNatura 2000 areas, forests designatedfor the protection of biodiversity(Danish: fredninger) and areas withspecific management goals such asuntouched forest in the state forests orby appointment to the Forest and NatureAgency (Danish: udlægning af urørt skovog gamle driftsformer).
The increase in forest area designated forconservation of biodiversity from 1990to 2000 is due to the implementation ofthe Strategy for Natural Forests in 1994.The increase from 2005 to 2010 is causedby the implementation of the Habitatdirective.
Forest area within protected areas The area of forest within protected areasis comprised of areas within Natura 2000areas and national parks. As the firstnational park was established in 2008, noestimate is available on the forest cover innational parks.
N/A
Other general comments to the table
In Denmark it may be inappropriate to distinguish between designated functions of the forests. Although most of the Danishforests are productive, the designated function may best be characterized as #Multiple use#. For the state forests this is stateddirectly in the strategy for management of the state forests (Ministry of Environment, 2002). For the private forests, most ownersmanage their forests according to multiple goals where hunting, aesthetic value and nature preservation are often as importantas wood production. The Forest Act requires that the forests are managed sustainably on both private and public forest lands.Sustainable management entail the inclusion of economic as well as ecological and social values on areas designated as forestreserve land and the administration of the Forest Act take a holistic approach to:1) promote the establishment of robust forests,2) ensure the productivity of the forests, 3) conserve and increase the biological diversity of the forests, and 4) ensure that properattention be given to landscape, natural history, cultural history, environmental protection and outdoor recreation. The followingshall apply to the individual area designated as forest reserve land: 1) The area must be stocked with trees, which form or willcome to form, a closed canopy forest of high-boled trees within a reasonable period of time. 2) Logging, except thinning, may notbe carried out before the stand or the individual tree has reached the rotation age (defined by age and/or dimension). 3) No laterthan 10 years after such logging of a stand, the area must meet the requirement of no. 1. 4) Livestock farming is prohibited. Thisprohibition does not, however, apply to areas that may be legally kept without trees, cf. section 10. The reported figures are differentfrom what was reported in the FRA 2005. In the previous survey it was arbitrarily assumed that 50 % of the forest area could becategorized as #Production forestry# and 50 % as #Multible use#. Further, it was assumed that forests planted in the sandy coastalareas on previous sand drift areas are designated for soil protection. In the current reporting it was emphasized that the designationshould be documented either by legal prescription, by a documented decision of the forest owner, or a documented study. Theabovementioned method for assigning the primary designated function of the forest does not concur with these requirements.Therefore the methodology was changed in this survey to better accommodate the requirements of the FRA 2010.

FRA 2015 – Country Report, Denmark
49
7. What is the area of forest affected by woody invasive species?Documents for this question:
• Guide for country reporting FRA 2015• FRA 2015 Terms and Definitions
7.1 Categories and definitions
Category Definition
Invasive species Species that are non-native to a particular ecosystem and whose introduction and spread cause, or arelikely to cause, socio-cultural, economic or environmental harm or harm to human health.
7.2 National data
7.2.1 Data sources
References to sourcesof information
Variables Years Additional comments
1 Johannsen et al. 2013 Area grown with woodyinvasive species
2010, 2005 N/A
2 N/A N/A N/A N/A
3 N/A N/A N/A N/A
4 N/A N/A N/A N/A
7.2.2 Classification and definitions
National class Definition
N/A N/A
N/A N/A
N/A N/A
N/A N/A
7.2.3 Original data
Original data origins from the NFI and is estimated as the area covered by woody invasive species.
7.3 Analysis and processing of national data

FRA 2015 – Country Report, Denmark
50
7.3.1 Adjustment
No adjustments made
7.3.2 Estimation and forecasting
No estimation made
7.3.3 Reclassification
No reclassification made
7.4 DataTable 7
Forest area affected (000 ha)Scientific name of
woody invasive species2005 2010
Pinus contorta 11 11
Pinus mugo 21 17
N/A N/A N/A
N/A N/A N/A
N/A N/A N/A
N/A N/A N/A
N/A N/A N/A
N/A N/A N/A
N/A N/A N/A
N/A N/A N/A
Total 32 28
Tiers
Category Tier for status Tier for reported trend
Invasive species Tier 3 Tier 3

FRA 2015 – Country Report, Denmark
51
Tier Criteria
Category Tier for status Tier for reported trend
Invasive species Tier 3: Systematic assessment in forestinventory or other survey (e.g. byconservation department) within the last5 years) Tier 2: Systematic assessment inforest inventory or other survey (e.g. byconservation department conducted morethan 5 years ago) Tier 1: Other
Tier 3 : Estimate based on repeatedcompatible tiers 3 (tier for status) Tier 2 :Estimate based on repeated compatible tier2 or combination tier 3 and 2 or 1 (tier forstatus) Tier 1 : Other
7.5 Comments
CategoryComments related todata definitions etc
Comments on the reported trend
Invasive species Invasive species are defined by theDanish Nature Agency. See http://www.naturstyrelsen.dk/Naturbeskyttelse/invasivearter/Arter/Plantearter/Plantearter.htm
N/A
Other general comments to the table
N/A

FRA 2015 – Country Report, Denmark
52
8. How much forest area is damaged each year?Documents for this question:
• Guide for country reporting FRA 2015• FRA 2015 Terms and Definitions
8.1 Categories and definitions
Category Definition
Number of fires Number of fires per year
Burned area Area burned per year
Outbreaks of insects A detectable reduction in forest health caused by a sudden increase in numbers of harmful insects.
Outbreaks of diseases A detectable reduction in forest health caused by a sudden increase in numbers of harmful pathogens,such as bacteria, fungi, phytoplasma or virus.
Severe weather events Damage caused severe weather events, such as snow, storm, drought, etc.
8.2 National data
8.2.1 Data sources
References to sourcesof information
Variables Years Additional comments
1 Bredskabsstyrelsen, https://statistikbank.brs.dk
Forest and nature fires All N/A
2 Johannsen et al., 2013 Outbreaks of insects anddiseases
All N/A
3 Larsen and Johannsen, 2002 Winthrow 1999 N/A
4 Danish NatureAgency (Evaluering afStormdfaldsordningen, 2012)
Winthrow 2005 N/A
8.2.2 Classification and definitions
National class Definition
N/A N/A
N/A N/A
N/A N/A
N/A N/A

FRA 2015 – Country Report, Denmark
53
8.2.3 Original data
Forelocation(Number)
2007 2008 2009 2010 2011 2012 2013 Total
Meadow,heathlandsandsimilar
89 138 125 109 108 112 166 847
Garden 443 621 555 446 517 531 414 3.527
Cliffs,hill side
etc.
70 125 108 78 69 114 141 705
Field 388 698 661 514 443 394 266 3.364
Field withcereals
43 105 130 104 50 107 70 609
Moors 18 49 40 29 28 20 25 209
Forest,scrubs etc
370 738 664 440 508 400 388 3.508
Beach 17 30 29 26 34 34 26 196
Lake 6 4 8 6 4 5 5 38
Stream 3 5 3 2 3 1 1 18
Other nature fires 34 158 138 330
Nature fires 4 9 13
Total 1.447 2.513 2.323 1.754 1.798 1.880 1.649 13.364
Only "Forest, scrubs etc" is considered as forest.
8.3 Analysis and processing of national data
8.3.1 Adjustment
No adjustments have been made
8.3.2 Estimation and forecasting
No estimation has been made

FRA 2015 – Country Report, Denmark
54
8.3.3 Reclassification
No reclassification has been made.
8.4 DataTable 8a
000 ha, number of fires
2003 2004 2005 2006 2007Category
000 ha # 000 ha # 000 ha # 000 ha # 000 ha #
Totalland areaburned
0 N/A 0 N/A 0 N/A 0 N/A 0 1447
... ofwhichforestareaburned
0 N/A 0 N/A 0 N/A 0 N/A 0 370
2008 2009 2010 2011 2012Category
000 ha # 000 ha # 000 ha # 000 ha # 000 ha #
Totalland areaburned
0 2513 0 2323 0 1754 0 1798 0 1880
... ofwhichforestareaburned
0 738 0 664 0 440 0 508 0 400
Table 8b
Outbreak category Description/name Year(s) of latest outbreak Area damaged (000 hectares)
2 Ash dieback (Hymenoscyphuspseudoalbidus)
2005- 19
3 Winthrow 1981 N/A
3 Winthrow 1999 20
3 Winthrow 2005 4
1 Ips typhographus 2007 0
1 Winther moth and others(Operopthera brumata andothers)
2013 N/A
FRA 2015 – Country Report, Denmark
55
1 Green spruce aphid(Elatobium abietinum)
2008 0
1 Dendroctonus micans 2007 0
2 Neonectria neomacrospora 2013 5
N/A N/A N/A N/A
Outbreak category
1 Insects
2 Diseases
3 Severe weather events
Tiers
Category Tier for status Tier for trend
Area affected by fire Tier 3 Tier 3
• Insects• Diseases• Severe weather events
Tier 3 Tier 3
Tier criteria
Category Tier for status Tier for reported trend
Burned area Tier 3 : National fire monitoring routinesTier 2 : Remote sensing surveys Tier 1 :Other
Tier 3 : Estimate based on repeatedcompatible tiers 3 (tier for status) Tier 2 :Estimate based on repeated compatible tier2 or combination tier 3 and 2 or 1 (tier forstatus) Tier 1 : Other
• Insects• Diseases• Severe weather events
Tier 3 : Systematic survey (e.g. viainventory or aerial damage assessment)Tier 2 : Management records Tier 1 :Other
Tier 3 : Estimate based on repeatedcompatible tiers 3 (tier for status) Tier 2 :Estimate based on repeated compatible tier2 or combination tier 3 and 2 or 1 (tier forstatus) Tier 1 : Other
8.5 Comments
CategoryComments related todata definitions etc
Comments on the reported trend
Burned area Data include all fires on nature-areas suchas heathlands, forests, beaches etc. Thevast majority of these fires are very smallwith almost no area being affected. Thetotal area affected therefore adds up to lessthan 500 ha's.
Forest fires are a relatively rare event inDanish forests, and seldomly affect largerareas.
Insects N/A N/A

FRA 2015 – Country Report, Denmark
56
Diseases The area affected by ash dieback isestimated as of 2013. In addition tothe area affected by Ash dieback, largeareas of spruce are affected by root rot.However, the area affected by root rotis not assessed as it cannot be observedon live treees and does not have thecharacteristics of an outbreak. The areaaffected by Neonectria neomacrosporais estimated based on reports fromchristmass tree growers association.
N/A
Severe weather events Denmark is often affected by winthrow.Mainly conifers are affected.
N/A
Other general comments to the table
N/A
FRA 2015 – Country Report, Denmark
57
9. What is the forest area with reduced canopy cover?Documents for this question:
• Guide for country reporting FRA 2015• FRA 2015 Terms and Definitions
Category Definition
Reduction in canopycover
Forest that has undergone a reduction of canopy cover of more than 20% between the years 2000 and2010 within the forest canopy cover range of 30-80% as detected by the MODIS VCF sensor.
Table 9
Category Area of forest with reduced canopy cover (000 ha)
Reduction in canopycover
N/A
Tiers
Category Tier for reported trend
Reduction in canopycover
N/A
Tier criteria
Category Tier for reported trend
Reduction in canopycover
Tier 3 : Remote sensing with ground truthing and/or Landsat imagery Tier 2 : Remote sensing usingModis (using pre-filled data provided by FAO) Tier 1 : Expert opinion
Comments
Category Comments related to data definitions etc
Reduction in canopycover
As the Danish NFI was initiated in 2002, it is not possible to estimate the area with a reduction incanopy cover of more than 20%.
Other general comments

FRA 2015 – Country Report, Denmark
58
10. What forest policy and regulatory framework exists to support implementation ofsustainable forest management SFM?Documents for this question:
• Guide for country reporting FRA 2015• FRA 2015 Terms and Definitions
10.1 Categories and definitions
Category Definition
Policies supportingsustainable forestmanagement
Policies or strategies that explicitly encourage sustainable forest management.
Legislation andregulations supportingsustainable forestmanagement
Legislation and regulations that govern and guide sustainable forest management, operations and use.
10.2 National data
10.2.1 Data sources
References to sourcesof information
Variables Years Additional comments
1 Danmarks NationaleSkovprogram,Miljøministeriet Skov- ogNaturstyrelsen juni 2002
N/A 2002 National forest programme
2 Strategi for de danskenaturskove, Miljøministeriet,Skov- og Naturstyrelsen,december 1992
N/A 1992 Strategy for natural forests inDenmark
3 Skovloven,Lovbekendtgørelse nr. 678 af14. juni 2013 om skove.
N/A 2013 The Forest Law
4 Handlingsplan for naturnærskovdrift i statsskoveneMiljøministeriet, Skov- ogNaturstyrelsen, 2005
N/A 2005 Action plan for near-naturalmanagement
10.2.2 Classification and definitions
National class Definition
N/A N/A
N/A N/A
N/A N/A

FRA 2015 – Country Report, Denmark
59
N/A N/A
10.2.3 Original data
10.3 DataTable 10
Sub-nationalCategoryNational
Regional Provincial/State Local
Policies supportingsustainable forestmanagement
yes no no no
... of which, in publiclyowned forests
yes no no no
... of which, in privatelyowned forests
yes no no no
Legislation andregulations supportingsustainable forestmanagement
yes no no no
... of which, in publiclyowned forests
yes no no no
... of which, in privatelyowned forests
yes no no no
10.4 Comments
Variable / category Comments related to data definitions etc
Policies supporting sustainable forest management N/A
Legislation and regulations supporting sustainable forestmanagement
N/A
Other general comments

FRA 2015 – Country Report, Denmark
60
11. Is there a national platform that promotes stakeholder participation in forest policydevelopment?Documents for this question:
• Guide for country reporting FRA 2015• FRA 2015 Terms and Definitions
11.1 Categories and definitions
Category Definition
National stakeholderplatform
A recognized procedure that a broad range of stakeholders can use to provide opinions, suggestions,analysis, recommendations and other input into the development of national forest policy.
11.2 National data
11.2.1 Data sources
References to sources of information Years Additional comments
1 Skovrådet (Forest Council)http://www.naturstyrelsen.dk/Naturbeskyttelse/Skov/Skovloven/skovraadet/
2013 N/A
2 N/A N/A N/A
3 N/A N/A N/A
4 N/A N/A N/A
Table 11Is there a national platform that promotes or allows forstakeholder participation in forest policy development?
yes
11.3 Comments
Category Comments related to data definitions etc
National stakeholder platform The Forest Council has members among the most importantstakeholders including forest research, private and public forestowners and NGO's involved in environmental protection, publicrecreation etc
Other general comments

FRA 2015 – Country Report, Denmark
61
12. What is the forest area intended to be in permanent forest land use and how has itchanged over time?Documents for this question:
• Guide for country reporting FRA 2015• FRA 2015 Terms and Definitions
12.1 Categories and definitions
Category Definition
Forest area intended to bein permanent forest landuse
Forest area that is designated or expected to be retained as forest and is highly unlikely to be convertedto other land use.
...of which permanentforest estate (sub-category)
Forest area that is designated by law or regulation to be retained as forest and may not be converted toother land use.
12.2 National data
12.2.1 Data sources
References to sourcesof information
Variables Years Additional comments
1 Johannsen et al., 2013 Area of landuseclasses insideand outside forest reserve
2010 N/A
2 N/A N/A N/A N/A
3 N/A N/A N/A N/A
4 N/A N/A N/A N/A
12.2.2 Classification and definitions
National class Definition
Forest reserve In Denmark about 70 % of the forest area is declared forestreserve (Danish: fredsskov). According to the Forest Act, suchforest is permanent and the area must be stocked with trees,which form or will come to form, a closed canopy forest of high-boled trees within a reasonable period of time.
N/A N/A
N/A N/A
N/A N/A

FRA 2015 – Country Report, Denmark
62
12.2.3 Original data
fredskov_name landuse_nameDK landuse_nameUK Denmark
Not forest reserve Skov, nål Forest, conifers 56320,43
Not forest reserve Skov, løv Forest, broadleaves 57051,83
Not forest reserve Skov, blandet løv og nål Forest, mixture 24462,64
Not forest reserve Juletræproduktion Christmas_trees 17608,47
Not forest reserve Midlertidig ubevokset skov Temporarily unstocked 1961,439
Not forest reserve Hjælpearealer i skov Auxillary areas 1728,592
Forest reserve Skov, nål Forest, conifers 178355,9
Forest reserve Skov, løv Forest, broadleaves 178258,6
Forest reserve Skov, blandet løv og nål Forest, mixture 47217,97
Forest reserve Juletræproduktion Christmas_trees 9583,854
Forest reserve Midlertidig ubevokset skov Temporarily unstocked 8831,504
Forest reserve Hjælpearealer i skov Auxillary areas 5696,206
12.3 Analysis and processing of national data
12.3.1 Adjustment
No adjustment has been performed
12.3.2 Estimation and forecasting
The permanent forest estate area corresponds to the area of forest reserve ("fredskov" in Danish), which isprotected by the forest law.
The forest area intended to be permanent forest land use corresponds to the forest area minus the area ofChristmas trees outside forest reserves, as Christmas tree plantations on agricultural lands are often converted.

FRA 2015 – Country Report, Denmark
63
12.3.3 Reclassification
No reclassification has been performed
12.4 DataTable 12
Categories Forest area 2010 (000 ha)
Forest area intended to be in permanentforest land use
569
... of which permanent forest estate 428
Tiers
Category Tier for status
Forest area intended to be in permanent forest land use Tier 1
Permanent forest estate Tier 3
Tier Criteria
Category Tier for status
Forest area intended to be in permanent forest land use Tier 3 : National or sub-national land use plans strategydocuments or other reports within the past 10 years Tier 2 :National or sub-national land use plans strategy documents orother reports within the past 20 years Tier 1 : Other
Permanent forest estate Tier 3 : National or sub-national land use plans strategydocuments or other reports within the past 10 years Tier 2 :National or sub-national land use plans strategy documents orother reports within the past 20 years Tier 1 : Other
12.5 Comments
Category Comments related to data definitions etc
Forest area intended to be in permanent forest land use Forest areas outside forest reserves are not commonly convertedto other landuse, such as agriculture because they are oftensituated on lands unsuitable for agricultural production. Anexception is Christmas tree plantations on farmlands.
Permanent forest estate In Denmark about 70 % of the forest area is declared forestreserve (Danish: fredsskov). According to the Forest Act, suchforest is permanent and the area must be stocked with trees,which form or will come to form, a closed canopy forest of high-boled trees within a reasonable period of time.
Other general comments

FRA 2015 – Country Report, Denmark
64
13. How does your country measure and report progress towards SFM at the nationallevel?Documents for this question:
• Guide for country reporting FRA 2015• FRA 2015 Terms and Definitions
13.1 Categories and definitions
Category Definition
Forest area monitoredunder a national forestmonitoring framework
Forest area monitored by a national monitoring framework or systems that provide measurement basedperiodic monitoring of forest extent and quality.
Forest reporting atnational scale
National reporting of forest extent and characteristics that includes some measure of progress towardsustainable forest management.
13.2 National data
13.2.1 Data sources
References to sourcesof information
Variables Years Additional comments
1 Johannsen et al., 2013 N/A 2012 National report on the NFI
2 Nord-Larsen et al., 2013 N/A 2011 National report on the NFI
3 Nord-Larsen et al., 2012 N/A 2010 National report on the NFI
4 Nord-Larsen et al., 2010 N/A 2009 National report on the NFI
5 Nord-Larsen et al., 2009 N/A 2008 National report on the NFI
6 Nord-Larsen et al., 2008 N/A 2006 National report on the NFI
13.2.2 Classification and definitions
National class Definition
N/A N/A
N/A N/A
N/A N/A
N/A N/A
13.3 DataTable 13a

FRA 2015 – Country Report, Denmark
65
Check all boxes that apply
Category% of totalforest area
Mostrecent year
Continuous PeriodicPermanent
groundplots
Temporaryground
plots
Aerial/remotesensingsamplebased
Aerial/remote
sensing fullcoverage
Forestinventory
100 2013 yes no yes yes no yes
Other fieldassessments
N/A N/A yes no yes no no yes
Updatesto othersources
N/A N/A no no
Expertestimate
N/A N/A
Table 13b
Type of forest reporting used at national scale Check boxes that apply
1 Criteria and Indicators reporting yes
2 Periodic national state of the forest report yes
3 Other (please document) yes
4 None no
Other type of forest reporting
Evaluation reports of eg. biodiversity - see references.
13.4 Comments
Category Comments
N/A N/A
N/A N/A
N/A N/A
Other general comments
FRA 2015 – Country Report, Denmark
66
14. What is the area of forest under a forest management plan and how is this monitored?Documents for this question:
• Guide for country reporting FRA 2015• FRA 2015 Terms and Definitions
14.1 Categories and definitions
Category Definition
Forest area withmanagement plan
Forest area that has a long-term documented management plan, aiming at defined management goalswhich is periodically revised
...of which for production(sub-category)
Forest management plan mainly focused on production
...of which forconservation (sub-category)
Forest management plan mainly focused on conservation
Monitoring of forestmanagement plans
Government monitoring of forest management plan implementation conducted through field visits oraudits of forest management plan performance
14.2 National data
14.2.1 Data sources
References to sourcesof information
Variables Years Additional comments
1 Larsen & Johannsen, 2002 Forest area with managementplan
2010 Data was collected as part ofthe questionnaire based forestsurvey in 2000
2 N/A N/A N/A N/A
3 N/A N/A N/A N/A
4 N/A N/A N/A N/A
14.3 DataTable 14a
Forest plan type Forest area 2010 (000 ha)
Forest area with management plan 254
... of which for production 254
... of which for conservation 0
Table 14b
Indicate which (if any) of the following are required in forest management plans in your country
1 Soil and water management no

FRA 2015 – Country Report, Denmark
67
2 High conservation value forest delineation no
3 Social considerations community involvement no
Table 14c
Percent of area under forest management plan that is monitored annually N/A
Tiers
Category Tier for status
Forest area with management plan Tier 1
Percent of area under forest management plan that is monitoredannually
Tier 1
Tier criteria
Category Tier for status
Forest area with management plan Tier 3 : Reports that describe national records 5 years old or lessthat contain long-term forest monitoring plans Tier 2 : Industryor other records indicating the presence of a long-term forestmanagement plan Tier 1 : Other
Percent of area under forest management plan that is monitoredannually
Tier 3 : Government documentation of monitoring extent Tier 2: Reports from forest managers or other documental sources Tier1 : Other
14.4 Comments
Category Comments
Forest area with management plan Forest management plans may take different forms. Thereported number include only areas have a specific plan forfuture management. The area under forest management plan wassurveyed in the forest questionnaire survey in 2000. We expectthat the area with a forest management plan is unchanged. Anew questionnaire survey is currently being conducted and willprovide an updated estimate of the forest area under managementplan.
Percent of forest monitored annually Areas under forest management plan in the state forests may bemonitored as part of updating exsisting plans. This is howevernot conducted systematically and not to check if the plans arebeing followed. Private forests with a management plan are notmonitered by government in Denmark.
N/A N/A
Other general comments

FRA 2015 – Country Report, Denmark
68
15. How are stakeholders involved in the management decision making for publiclyowned forests?Documents for this question:
• Guide for country reporting FRA 2015• FRA 2015 Terms and Definitions
15.1 Categories and definitions
Category Definition
Stakeholder involvement Stakeholder involvement is defined as significant inputs into at least one aspect of forest management atthe operational scale
Table 15
Please indicate the type of stakeholder involvement in forest management decision making required in your country
1. Planning phase yes
2. Operations phase yes
3. Review of operations yes
Tiers
Category Tier for status
Type of stakeholder inputs Tier 2
Tier criteria
Category Tier for status
Type of stakeholder inputs Tier 3 : Government (national or sub-national) documentation ofstakeholder inputs Tier 2 : Government (national or subnational)requirement but stakeholder inputs not documented Tier 1 :Other
15.2 Comments
Category Comments
Stakeholder involvment In the state forests councils of users have been establishedfor the individual forest districts. The councils are advisory,and include representatives from the larger groups of users,including environmental NGO's (Retningslinier for brugerråd,Miljøministeriet Skov- og Naturstyrelsen Januar 2007).
N/A N/A
N/A N/A
FRA 2015 – Country Report, Denmark
69
Other general comments

FRA 2015 – Country Report, Denmark
70
16. What is the area of forest under an independently verified forest certification scheme?Documents for this question:
• Guide for country reporting FRA 2015• FRA 2015 Terms and Definitions
16.1 Categories and definitions
Category Definition
FSC certification Forest area certified under the Forest Stewardship Council certification scheme
PEFC certification Forest area certified under the Programme for the Endorsement of Forest Certification scheme
Other international forestmanagement certification
Forest area certified under an international forest management certification scheme with publishedstandards and is independently verified by a third-party, excluding FSC and PEFC certification.
Certified forest areausing a domestic forestmanagement certificationscheme
Area certified under a forest management certification scheme with published standards that arenationally recognized and independently verified by a thirdparty
16.2 DataTable 16a
Forest area (000 ha)International forest
management certification2000 2001 2002 2003 2004 2005 2006
FSC 0 0 0 0 0 0 0
PEFC 0 0 0 7 12 14 24
Other 0 0 0 0 0 0 0
2007 2008 2009 2010 2011 2012
FSC 188 190 190 192 196 196
PEFC 205 210 219 227 246 253
Other 0 0 0 0 0 0
Table 16b
Forest area (000 ha)Domestic forest
management certification2000 2001 2002 2003 2004 2005 2006
- 0 0 0 0 0 0 0
N/A 0 0 0 0 0 0 0
N/A 0 0 0 0 0 0 0

FRA 2015 – Country Report, Denmark
71
2007 2008 2009 2010 2011 2012
- 0 0 0 0 0 0
0 0 0 0 0 0
0 0 0 0 0 0
Tier criteria
Category Tier for status
International forest management certification Tier 3: International forest management scheme recordsmaintained by the certifying organization for the reporting yearTier 2: International forest management scheme records reportedby the certifying organization for a period 2 years prior to thereporting year Tier: 1 Other
Domestic forest management certification Tier 3: National registry reports for domestic forest managementcertification maintained by the certifying organization for thereporting year Tier 2: Domestic forest management schemerecords reported by the certifying organization for a period 2years prior to the reporting year Tier: 1 Other
Tiers
Category Tier for status
International forest management certification Tier 3
Domestic forest management certification Tier 3
16.3 Comments
Category Comments related to data definitions etc
Certified forest area using an international forest managementcertification scheme
There are no certification of forest in Denmark other than FSCand PEFC
Domestic forest management certification There is no domestic certification in Denmark
Other general comments

FRA 2015 – Country Report, Denmark
72
17. How much money do governments collect from and spend on forests?Documents for this question:
• Guide for country reporting FRA 2015• FRA 2015 Terms and Definitions
17.1 Categories and definitions
Category Definition
Forest revenue All government revenue collected from the domestic production and trade of forest products andservices. For this purpose revenue include:• Goods : roundwood; sawnwood; biomass; woodbased panels; pulp and paper and non-wood forest
products.• Services : including concession fees and royalties, stumpage payments, public timber sales revenue
taxes and charges based on forest area or yield, taxes on domestic trade and export of forest products,special levies on forestry activities and payments into forest related funds, other miscellaneousinspection, licence and administrative fees levied by forest administrations, permit and licence feesfor recreation and other forest related activities.
Public expenditure onforestry
All government expenditure on forest related activities.
17.2 National data
17.2.1 Data sources
References to sourcesof information
Variables Years Additional comments
1 Danish forest and natureagency
Forest revenue Operationalexpenditure Domesticfunding External funding
2000 2005 2010 N/A
2 N/A N/A N/A N/A
3 N/A N/A N/A N/A
4 N/A N/A N/A N/A
17.3 DataTable 17
Revenues / expenditures (000 local currency)Category
2000 2005 2010
Forest revenue 250000 238000 227000
Public expenditure on forestry 648700 276800 192200
2000 2005 2010
Name of Local Currency Danish crowns (DKK) N/A N/A

FRA 2015 – Country Report, Denmark
73
17.4 Comments
Category Comments related to data definitions etc
Forest revenue Data on forest revenue is based on reported figures fromthe Danish Nature Agency. Figures include income fromwood production in the state forests as well as income fromrecreational activities.
Public expenditure on forestry Data on public expenditure is based on reported figures from theDanish Nature Agency. Figures include expenditures related towood production in the state forests as well as expenditures onrecreational activities and nature protection.
Other general comments N/A
Other general comments

FRA 2015 – Country Report, Denmark
74
18. Who owns and manages the forests and how has this changed?Documents for this question:
• Guide for country reporting FRA 2015• FRA 2015 Terms and Definitions
18.1 Categories and definitions
Category Definition
Public ownership Forest owned by the State or administrative units of the public administration or by institutions orcorporations owned by the public administration.
...of which owned by thestate at national scale(sub-category)
Forest owned by the State at the national scale or administrative units of the public administration or byinstitutions or corporations owned by the public administration.
...of which owned by thestate at the sub-nationalgovernment scale (sub-category)
Forest owned by the State at the sub-national government scale or administrative units of the publicadministration or by institutions or corporations owned by the public administration.
Private ownership Forest owned by individuals, families, communities, private cooperatives corporations and otherbusiness entities, private, religious and educational institutions, pension or investment funds, NGOs,nature conservation associations and other private institutions.
...of which individuals(sub-category)
Forest owned by individuals and families.
...of which privatebusiness entities andinstitutions (sub-category)
Forest owned by private corporations cooperatives companies and other business entities as well asprivate nonprofit organizations such as NGOs nature conservation associations, and private religiousand educational institutions etc.
...of which local tribal andindigenous communities(sub-category)
Forest owned by a group of individuals belonging to the same community residing within or in thevicinity of a forest area or forest owned by communities of indigenous or tribal people The communitymembers are coowners that share exclusive rights and duties and benefits contribute to the communitydevelopment.
Unknown ownership Forest area where ownership is unknown includes areas where ownership is unclear or disputed.
Categories related tomanagement rights
of public forestsDefinition
Public Administration The Public Administration (or institutions or corporations owned by the Public Administration) retainsmanagement rights and responsibilities within the limits specified by the legislation.
Individuals households Forest management rights and responsibilities are transferred from the Public Administration toindividuals or households through long-term leases or management agreements.
Private companies Forest management rights and responsibilities are transferred from the Public Administration tocorporations, other business entities private cooperatives, private nonprofit institutions and associations,etc., through long-term leases or management agreements.
Communities Forest management rights and responsibilities are transferred from the Public Administration to localcommunities (including indigenous and tribal communities) through long-term leases or managementagreements.
Other form ofmanagement rights
Forests for which the transfer of management rights does not belong to any of the categories mentionedabove.
18.2 National data

FRA 2015 – Country Report, Denmark
75
18.2.1 Data sources
References to sourcesof information
Variables Years Additional comments
1 Johannsen et al., 2013 Forest area 2010, 2005 Based on interpretation ofmaps in the land registryGIS-theme (KMS-matrikel-matrikelregister)
2 Larsen and Johannsen (2002) Forest area 2000 Based on registrations offorest owners in the landregistry
3 Zangenberg and Hansen(1994)
Forest area 1990 Based on registrations offorest owners in the landregistry
4 N/A N/A N/A N/A
18.2.2 Classification and definitions
National class Definition
Public ownership Forest owned by the State; or administrative units of the publicadministration; or by institutions or corporations owned by thepublic administration.
Private ownership Forest owned by individuals, families, communities, privateco-operatives, corporations and other business entities, privatereligious and educational institutions, pension or investmentfunds, NGOs, nature conservation associations and other privateinstitutions.
Individuals (sub-category of Private ownership) Forest owned by individuals or families.
Private business entities and institutions (sub-category of Privateownership)
Forest owned by private corporations, co-operatives, companiesand other business entities, as well as private non-profitorganizations such as NGOs, nature conservation associations,and private religious and educational institutions, etc.
18.2.3 Original data
owner_name 1990 2000 2005 2010
Total 543249 585454 557719 587077
Private, person 202102 224000 318574 368433
Privat, buisness 74647 94000 32322 42177
Foundations 28786 30500 23676 22689
Nature Agency 114099 112900 136176 109301

FRA 2015 – Country Report, Denmark
76
Other state owned 3996 5400 8670 5323
Other public 21761 19500 34107 24791
Unknown 4194 14363
18.3 Analysis and processing of national data
18.3.1 Adjustment
No adjustment was made
18.3.2 Estimation and forecasting
In estimating the distribution to ownership types in 1990 and 2000 it was assumed that all public owned forestwas accounted for in the questionnaire surveys. The total forest area was obtained from the satellite basedmaps, described for table 1. The area of privately owned forest was estimated as the difference between totalforest area and public owned forest. The distributions between different types of private ownership follows thedistribution observed in the questionnaire surveys.
18.3.3 Reclassification
No reclassification was made.
18.4 DataTable 18a
Forest area (1000 hectares)Categories
1990 2000 2005 2010
Public ownership 137 138 179 139
... of which ownedby the state atnational scale
118 118 145 115
... of which ownedby the state atthe sub-nationalgovernment scale
22 20 34 25
Private ownership 406 447 375 433

FRA 2015 – Country Report, Denmark
77
... of which ownedby individuals
297 315 319 368
... of which ownedby private businessentities andinstitutions
110 132 56 65
... of which ownedby local, tribaland indigenouscommunities
0 0 0 0
Unknownownership
0 0 4 14
TOTAL 543.00 585.00 558.00 586.00
Tiers
Category Tier for status Tier for reported trend
Public ownership Tier 3 Tier 3
Private ownership Tier 3 Tier 3
Unknown ownership Tier 3 Tier 3
Tier criteria
Category Tier for status Tier for reported trend
Ownership Tier 3: National forestry statistics registersof land titles or maps on land ownershipor all forest area under one ownershipcategory that is five years old or less. Tier2:National forestry statistics registers ofland titles or maps on land ownership orquestionnaires that are more than fiveyears old. Tier 1: Other
Tier 3 : Estimate based on repeatedcompatible tiers 3 (tier for status) Tier 2 :Estimate based on repeated compatible tier2 or combination tier 3 and 2 or 1 (tier forstatus) Tier 1 : Other
Table 18b - Holder of management rights of public forests
Forest area (000 hectares)Categories
1990 2000 2005 2010
Public Administration 137 138 179 139
Individuals 0 0 0 0
Private companies 0 0 0 0
Communities 0 0 0 0
Other 0 0 0 0

FRA 2015 – Country Report, Denmark
78
TOTAL 137.00 138.00 179.00 139.00
Category Tier for reported trend Tier for status
Public Administration Tier 3 Tier 3
Individuals Tier 3 Tier 3
Private companies Tier 3 Tier 3
Communities Tier 3 Tier 3
Other Tier 3 Tier 3
18.5 Comments
CategoryComments related todata definitions etc
Comments on the reported trend
Public ownership Public ownership includes stateforests, forests owned by the military,municipalities and churches of the nationalchurch.
Some rather large fluctuations of publicownership can be observed in the data.The reason is inconsistent collection ofdata with the Danish NFI in the first years(2002, 2003) where access to private landcould only be gained by permission fromforest owners. Consequently, data wascollected disproportionately on publiclands. Although measures were taken tocorrect the bias these problems are stillvisible for reporting year 2005 in the data.Estimates after 2007 (and before 2002) areconsistent and unbiased.
Private ownership N/A N/A
Unknown ownership The Other types of ownership includesonly areas where ownership could not beeestablished in the 2006 survey.
N/A
Management rights Management rights in Danish forests aregenerally concurrent to ownership.
N/A
Other general comments to the table
N/A

FRA 2015 – Country Report, Denmark
79
19. How many people are directly employed in forestry?Documents for this question:
• Guide for country reporting FRA 2015• FRA 2015 Terms and Definitions
19.1 Categories and definitions
Category Definition
Full-time equivalents(FTE)
A measurement equal to one person working full-time during a specified reference period.
Employment in forestry Employment in activities related to production of goods derived from forests. This category correspondsto the ISIC/NACE Rev. 4 activity A02 (Forestry and logging).
19.2 National data
19.2.1 Data sources
References to sourcesof information
Variables Years Additional comments
1 StatBank Denmark (2011) 2010, 2005, 2000, 1990 N/A N/A
2 Johannsen et al., 2013 2010, 2005, 2000, 1990 N/A N/A
3 N/A N/A N/A N/A
4 N/A N/A N/A N/A
19.2.2 Classification and definitions
National class Definition
Primary production of goods Employment in activities related to primary production ofgoods, like industrial roundwood, woodfuel and non-wood forestproducts.
N/A N/A
N/A N/A
N/A N/A
19.2.3 Original data
Original data was provided by Statistics Denmark ( www.statistikbanken.dk , NAT18N: Beskæftigede og antaltimer (1000 timer) efter branche og anvendelsesident and ATR11: Årligt arbejdstidsregnskab efter branche(DB07), sektor, type, socio-økonomisk status og køn (AFSLUTTET)). A year of full time employment wasdefined as having 1700 hours.

FRA 2015 – Country Report, Denmark
80
19.3 DataTable 19
Employment (000 years FTE)Category
1990 2000 2005 2010
Employment inforestry
3 4 4 6
... of which female 1 1 1 1
19.4 Comments
CategoryComments related todata definitions etc
Comments on the reported trend
Employment in forestry N/A The observed increase in employees ispossibly a consequence of forest ownersincreasingly employ themselves in theforest administration.
Other general comments to the table
N/A

FRA 2015 – Country Report, Denmark
81
20. What is the contribution of forestry to Gross Domestic Product (GDP)?Documents for this question:
• Guide for country reporting FRA 2015• FRA 2015 Terms and Definitions
20.1 Categories and definitions
Category Definition
Gross value added fromforestry (at basic prices)
This category corresponds to the ISIC/NACE Rev. 4 activity A02 (Forestry and logging).
20.2 DataTable 20 (Pre-filled data from UNdata/EUROSTAT)
Category Million CurrencyYear for latest
available information
Gross value added fromforestry (at basic prices)
2185 DKK 2011
20.3 Comments
Category Comments
Gross value added from forestry (at basic prices) The gross value added include forest products as well asChristmass trees and greenery from Abies procera and Abiesnordmaniana
Other general comments
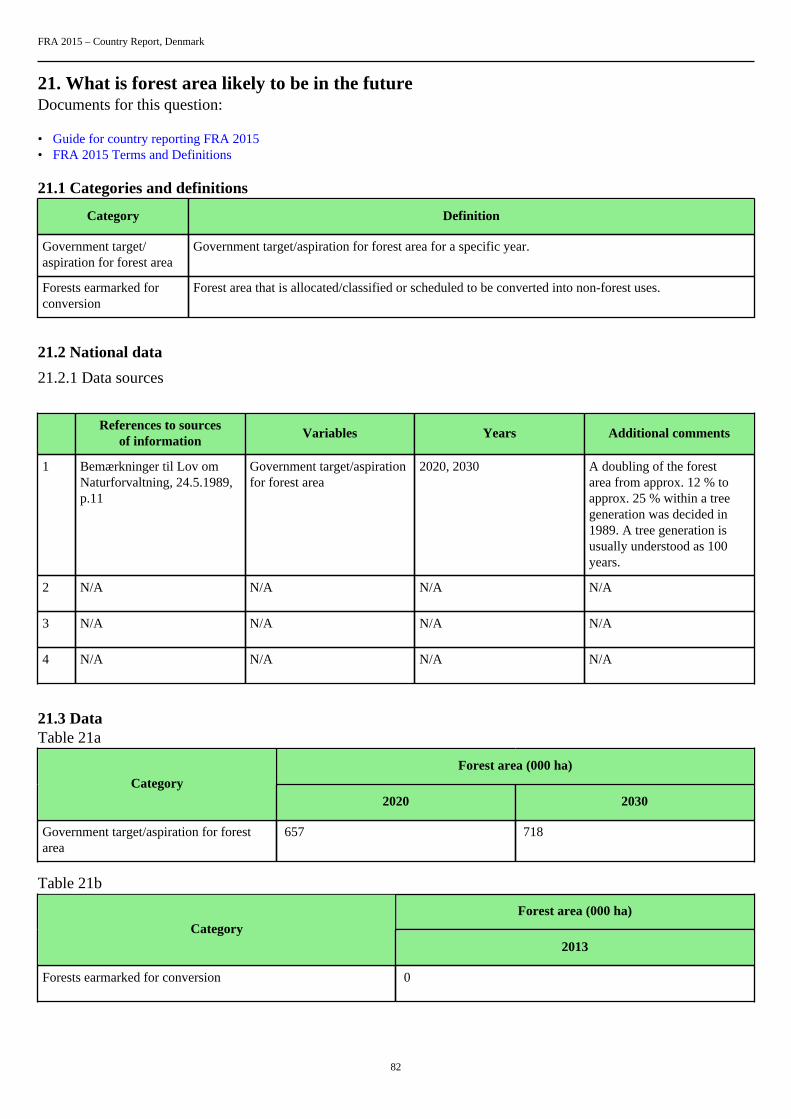
FRA 2015 – Country Report, Denmark
82
21. What is forest area likely to be in the futureDocuments for this question:
• Guide for country reporting FRA 2015• FRA 2015 Terms and Definitions
21.1 Categories and definitions
Category Definition
Government target/aspiration for forest area
Government target/aspiration for forest area for a specific year.
Forests earmarked forconversion
Forest area that is allocated/classified or scheduled to be converted into non-forest uses.
21.2 National data
21.2.1 Data sources
References to sourcesof information
Variables Years Additional comments
1 Bemærkninger til Lov omNaturforvaltning, 24.5.1989,p.11
Government target/aspirationfor forest area
2020, 2030 A doubling of the forestarea from approx. 12 % toapprox. 25 % within a treegeneration was decided in1989. A tree generation isusually understood as 100years.
2 N/A N/A N/A N/A
3 N/A N/A N/A N/A
4 N/A N/A N/A N/A
21.3 DataTable 21a
Forest area (000 ha)Category
2020 2030
Government target/aspiration for forestarea
657 718
Table 21b
Forest area (000 ha)Category
2013
Forests earmarked for conversion 0

FRA 2015 – Country Report, Denmark
83
21.4 Comments
Category Comments
Government target/aspiration for forest area We assumed a linear trend in the development of the forest area.Such linear trend is not part of the legislation.
Forests earmarked for conversion There may be new housing or roadbuilding planned that willlead to conversion into non-forest. However, such projectswill usually require that new forest is established elsewhere toreplace the forest lost. Therefore we set the forest earmaked forconversion at 0.
Other general comments