Embed Size (px)
Citation preview

Daylighting in Whole Foods MarketD
AY
LIG
HT
ING
IN W
HO
LE
FO
OD
S M
AR
KE
T
PortfolioDemonstration and Evaluation of Lighting Technologies and Applications Lighting Case Studies
Volu
me 4 Issu
e 1
DAYLIGHTING IN WHOLE FOODS MARKETYonkers, New York

Daylighting in Whole Foods Market
2Lighting Research Center
Contents
Project Profile...........2
Objectives ...............2
Project Specifications ...3
Daylight Design .......... 3
Electric Lighting Controlled in Response to Daylight .................. 4
Photometric Results ....5
Questionnaires: Customers and Employees...............6
Customer Results ........ 7
Employee Results ........ 8
Energy................. 10
Pollution Avoided ....... 11
Impact on Mechanical System Energy Use ..... 11
Economic Impact ....... 11
Lessons Learned ...... 12
Credits ................ 12
Project ProfileWhole Foods Market® is a chain of over 300 grocery stores specializing in
natural and organic foods. In 2012, DELTA evaluated a newly-built Whole
Foods Market in Yonkers, New York, with skylights, clerestory windows, and a
roof monitor that provide daylight. The store’s daylighting allows the building
management system to turn off half of the general lighting during the day.
Objectives• Create a pleasant environment that incorporates daylighting to reinforce
the image of the store
• Reduce electric lighting energy use by turning off half the general light-
ing when daylight is available
• Provide a low cost lighting control solution
3
Daylighting in Whole Foods Market
Lighting Research Center
Daylighting in Whole Foods Market
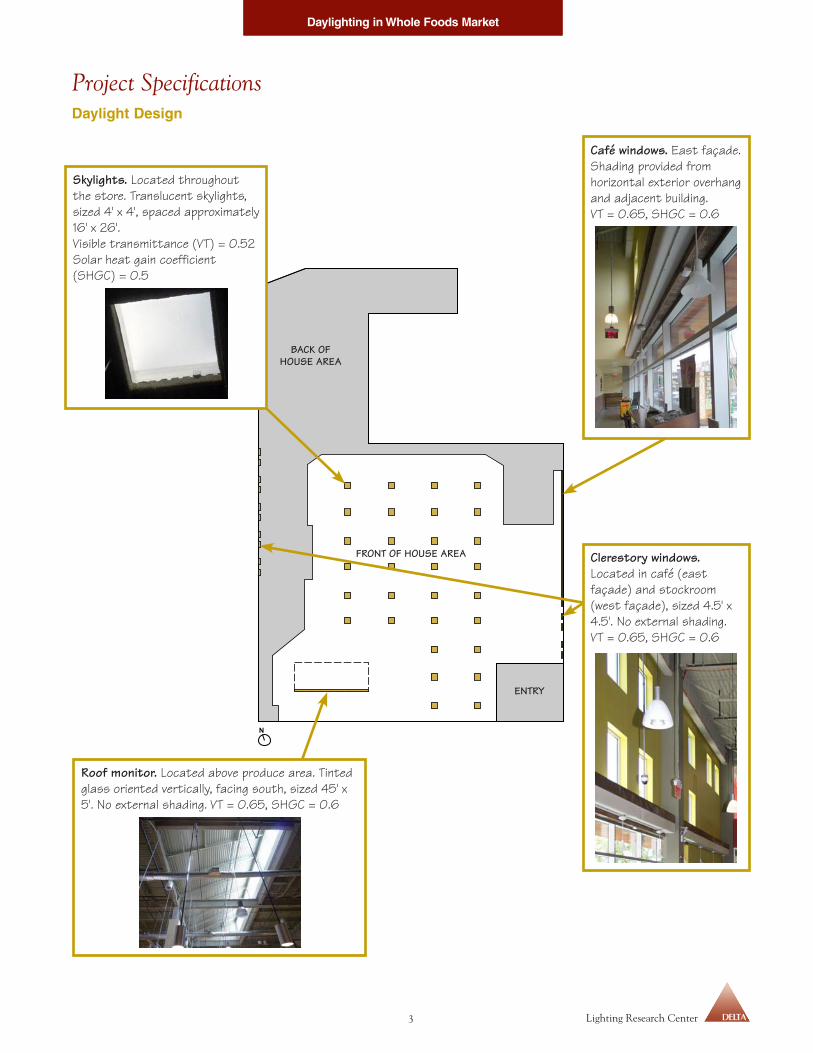
Project SpecificationsDaylight Design
BACK OF HOUSE AREA
FRONT OF HOUSE AREA
ENTRY
Skylights. Located throughout the store. Translucent skylights, sized 4' x 4', spaced approximately 16' x 26'. Visible transmittance (VT) = 0.52Solar heat gain coefficient (SHGC) = 0.5
Roof monitor. Located above produce area. Tinted glass oriented vertically, facing south, sized 45' x 5'. No external shading. VT = 0.65, SHGC = 0.6
Café windows. East façade. Shading provided from horizontal exterior overhang and adjacent building.VT = 0.65, SHGC = 0.6
Clerestory windows. Located in café (east façade) and stockroom (west façade), sized 4.5' x 4.5'. No external shading. VT = 0.65, SHGC = 0.6

Daylighting in Whole Foods Market
4Lighting Research Center
Daylighting in Whole Foods Market
Electric Lighting Controlled in Response to Daylight
Several layers of light are switched off in response to
daylight. The store uses additional lighting equipment
(such as track heads and case lighting, not shown here)
that is not controlled in response to daylight. One photo-
sensor controls general lighting in the store, as well as the
east-facing café and west-facing storage area.1 The com-
missioning agent reported that the photosensor switches
off lights when it measures greater than 55 footcandles (fc)
at the skylight,2 and switches lights back on when it mea-
sures less than 45 fc;3 visual evaluation was used to estab-
lish these set points, rather than quantification of design
illuminance on the workplane.
1 Use of a photosensor with a different daylight expo-sure (i.e., top-lighting) than the space being con-trolled (i.e., east/west side-lighting) was not intended; both photosensors installed for east/west side-lighting malfunctioned, thus the commissioning agent notified the client, and programmed the east/west circuits to be controlled by the skylight sensor.
2 1 footcandle = 10.76 lux3 DELTA believes set points were higher than these
reported values, due to illuminance data (page 5) and luminaire switching behavior (page 9).
Photosensor. Mounted in one skylight well, facing upward. Open loop system, measuring only daylight (not electric light) feeds data to the building management system.
Café pendants. Each with one 42 W, 3500 K CFL mounted 9'-11" above floor. Alternating luminaires switch off in response to daylight.
Aisle pendants. Linear fluorescent pendants with white cross-baffles. Two 32 W, T8, 3500 K lamps in cross-section. Ballasts tandem-wired to switch off one lamp in cross-section in response to daylight.
Café window pendants. Glass pendant with one 18 W, 3500 K CFL, mounted at 7'-5" above floor. All café window lights switch off in response to daylight.
Prismatic CFL pendants. Each with two 42 W, 3500 K CFLs, mounted 13'-1" above the floor. Alternating luminaires switch off in response to daylight.
Stockroom pendants. Linear fluorescent strip lights, hung at 11'-7" above floor. Two 32 W, T8, 3500 K lamps in cross-section. Alternating 8' segments switch off in response to daylight.
5
Daylighting in Whole Foods Market
Lighting Research Center
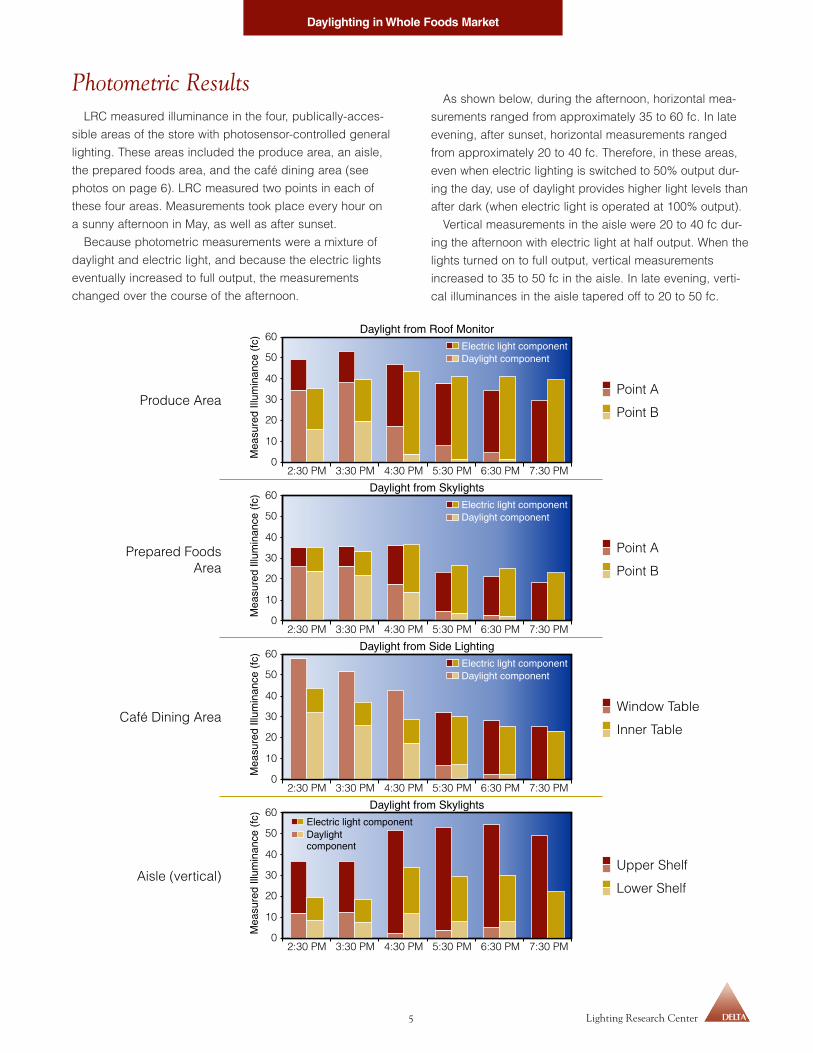
Photometric ResultsLRC measured illuminance in the four, publically-acces-
sible areas of the store with photosensor-controlled general
lighting. These areas included the produce area, an aisle,
the prepared foods area, and the café dining area (see
photos on page 6). LRC measured two points in each of
these four areas. Measurements took place every hour on
a sunny afternoon in May, as well as after sunset.
Because photometric measurements were a mixture of
daylight and electric light, and because the electric lights
eventually increased to full output, the measurements
changed over the course of the afternoon.
As shown below, during the afternoon, horizontal mea-
surements ranged from approximately 35 to 60 fc. In late
evening, after sunset, horizontal measurements ranged
from approximately 20 to 40 fc. Therefore, in these areas,
even when electric lighting is switched to 50% output dur-
ing the day, use of daylight provides higher light levels than
after dark (when electric light is operated at 100% output).
Vertical measurements in the aisle were 20 to 40 fc dur-
ing the afternoon with electric light at half output. When the
lights turned on to full output, vertical measurements
increased to 35 to 50 fc in the aisle. In late evening, verti-
cal illuminances in the aisle tapered off to 20 to 50 fc.
Daylighting in Whole Foods Market
6Lighting Research Center
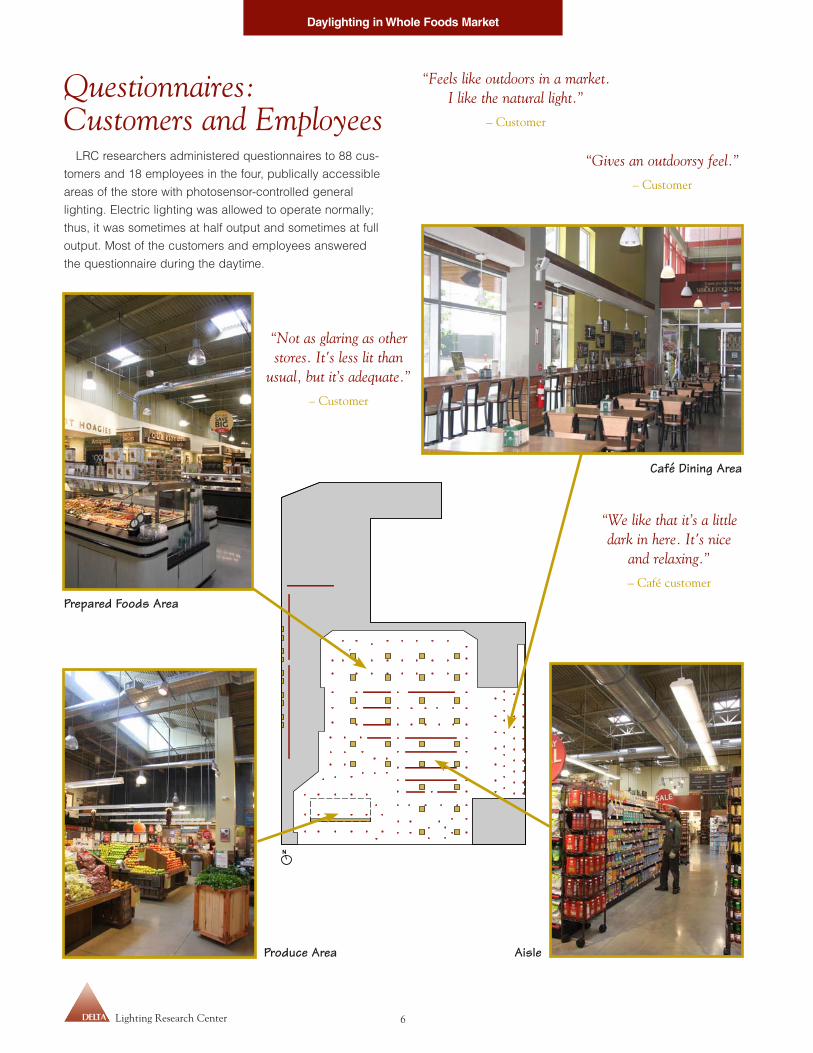
Questionnaires: Customers and Employees
LRC researchers administered questionnaires to 88 cus-
tomers and 18 employees in the four, publically accessible
areas of the store with photosensor-controlled general
lighting. Electric lighting was allowed to operate normally;
thus, it was sometimes at half output and sometimes at full
output. Most of the customers and employees answered
the questionnaire during the daytime.
Prepared Foods Area
Produce Area Aisle
Café Dining Area
“Not as glaring as other stores. It's less lit than
usual, but it’s adequate.”
– Customer
“Feels like outdoors in a market. I like the natural light.”
– Customer
“Gives an outdoorsy feel.”
– Customer
“We like that it’s a little dark in here. It's nice
and relaxing.”
– Café customer
7
Daylighting in Whole Foods Market
Lighting Research Center
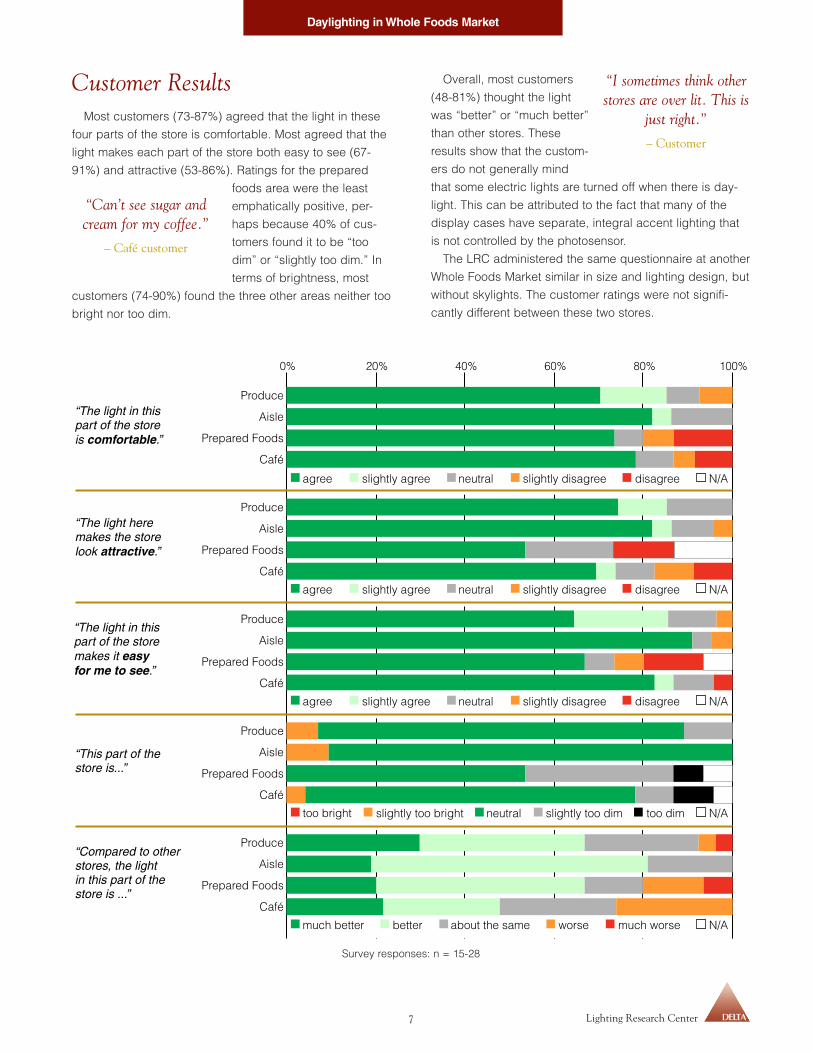
Customer ResultsMost customers (73-87%) agreed that the light in these
four parts of the store is comfortable. Most agreed that the
light makes each part of the store both easy to see (67-
91%) and attractive (53-86%). Ratings for the prepared
foods area were the least
emphatically positive, per-
haps because 40% of cus-
tomers found it to be “too
dim” or “slightly too dim.” In
terms of brightness, most
customers (74-90%) found the three other areas neither too
bright nor too dim.
Overall, most customers
(48-81%) thought the light
was “better” or “much better”
than other stores. These
results show that the custom-
ers do not generally mind
that some electric lights are turned off when there is day-
light. This can be attributed to the fact that many of the
display cases have separate, integral accent lighting that
is not controlled by the photosensor.
The LRC administered the same questionnaire at another
Whole Foods Market similar in size and lighting design, but
without skylights. The customer ratings were not signifi-
cantly different between these two stores.
“I sometimes think other stores are over lit. This is
just right.”
– Customer
“Can’t see sugar and cream for my coffee.”
– Café customer
Survey responses: n = 15-28

Daylighting in Whole Foods Market
8Lighting Research Center
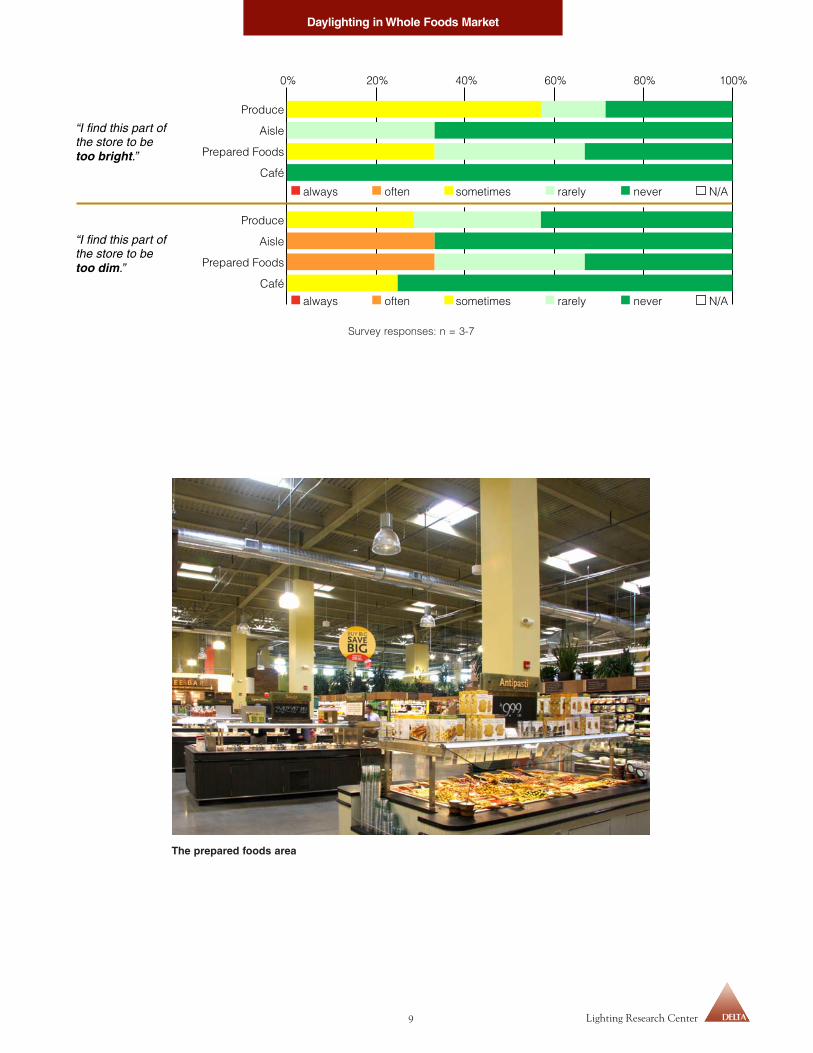
Employee ResultsThe majority of employees reported that all four spaces
are comfortable, attractive, and easy to see. In the two
areas where there is
direct sun (café dining
area and produce
area), employees
reported that the sun is
good for displaying the
products.
Because employees observe the store at many times of
day, the questionnaire asked employees how often they
found the space too bright or
too dim. In the aisles and
café, they indicated that it
was “rarely” or “never” too
bright. Over half the respon-
dents “sometimes” found the
produce area to be too bright. A third of the respondents
“sometimes” found the prepared foods area to be too
bright. About a third of the respondents “sometimes” or
“often” found these four areas of the store to be too dim.
Compared to other grocery stores, the majority of the
employees reported that the light was “better” or “much
better” in three of the four spaces evaluated.
“Natural light... I’m a big fan!”
– Employee
Survey responses: n = 3-7
“It’s a happy medium, because if it gets too dark, the lights automatically come on.”
– Employee
“I like the fact they save energy with sensors so it keeps the lighting even.”
– Employee
“No complaints from any customers.”
– Employee
9
Daylighting in Whole Foods Market
Lighting Research Center
Survey responses: n = 3-7
The prepared foods area

Daylighting in Whole Foods Market
10Lighting Research Center
EnergyThis Whole Foods Market is open 8 a.m. to 10 p.m.,
seven days a week. The energy management system is
programmed to operate the lights automatically. According
to the commissioning agent, when the photosensor mea-
sures greater than 55 fc,4 half the luminaires turn off.5 When
illuminance at the sensor drops below 45 fc, lights turn
back on.6 The range between these values is referred to as
“dead band.” The dead band reported at this store is nar-
row, which could result in frequent switching of lights.
LRC monitored luminaire switching at the Whole Foods
store. LRC installed monitoring devices in luminaires in the
four areas of the store controlled by the photosensor for 16
days in spring 2012. An example of the resulting pattern of
usage is shown below. Some days, the photosensor turned
off lights all day long; on other days, lights were intermit-
tently switched. For four days during the monitoring period,
the lights were all on, all day long. There were two Sunday
nights in which the override button was apparently used,
keeping lights on all night; interviews with the current store
manager indicated that use of the override is not typical
(monitoring was done under a previous manager). Most
nights, the energy management system switches the gen-
eral lighting to half output (shown in grey). Frequent
switching was not apparent in these data.
4 Lighting power use data suggest that the actual illuminance in the sky-light is substantially higher than the 45 fc and 55 fc set points reported by the commissioning agent; these set points would likely have kept the lights at reduced output from sunrise to sunset regardless of weather and season.
5 In the café, the row closest to the window switches off entirely, rather than alternating luminaires.
6 As shown in the Lighting Power Use figure, the café and stockroom areas spend more time at reduced output, thus they appear to have lower, more aggressive illuminance set points than the aisles/produce/prepared foods areas.
These usage patterns were translated to percent of mon-
itoring time (see figure below). The setpoint at which the
lighting in aisles, produce, and prepared foods turns off is
different (less aggressive) than in the café and stockroom.
As a result, the percentage of time in the daylight-off state
is greater for the café and stockroom.
Lighting power use during monitoring period
Usage percentages: lighting circuits controlled by photosensors (16 days of monitoring, April-May 2012)
11
Daylighting in Whole Foods Market
Lighting Research Center
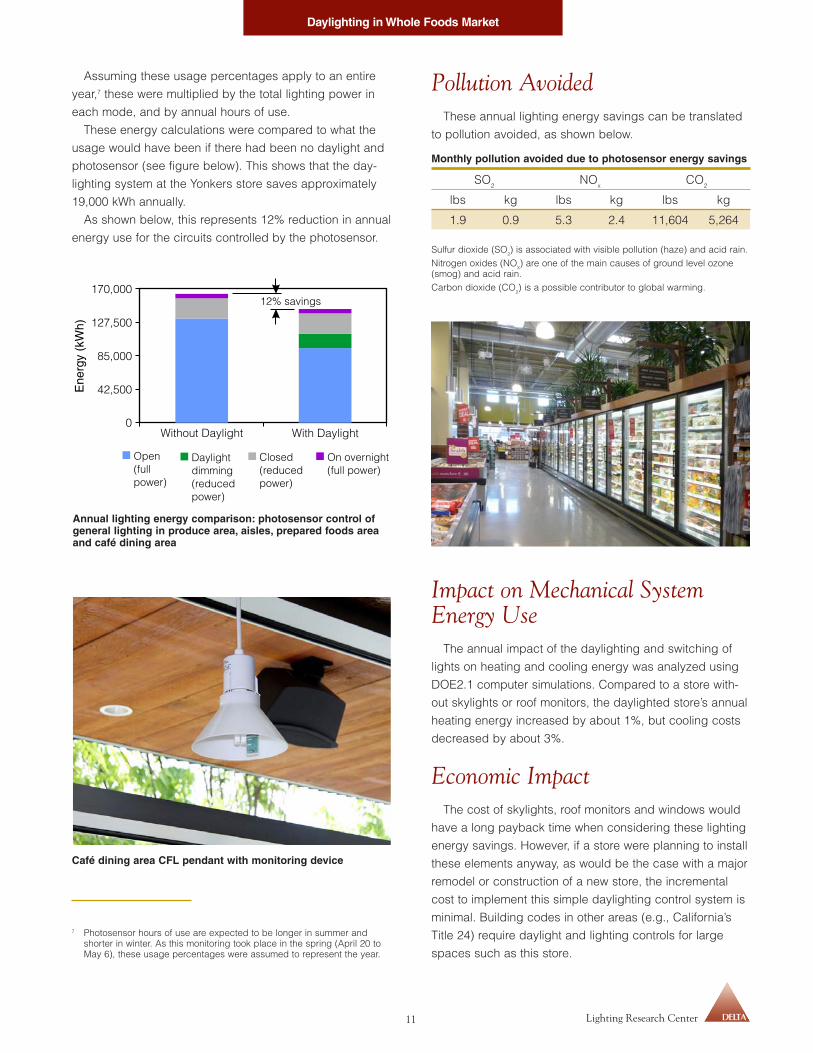
Assuming these usage percentages apply to an entire
year,7 these were multiplied by the total lighting power in
each mode, and by annual hours of use.
These energy calculations were compared to what the
usage would have been if there had been no daylight and
photosensor (see figure below). This shows that the day-
lighting system at the Yonkers store saves approximately
19,000 kWh annually.
As shown below, this represents 12% reduction in annual
energy use for the circuits controlled by the photosensor.
Annual lighting energy comparison: photosensor control of general lighting in produce area, aisles, prepared foods area and café dining area
Café dining area CFL pendant with monitoring device
7 Photosensor hours of use are expected to be longer in summer and shorter in winter. As this monitoring took place in the spring (April 20 to May 6), these usage percentages were assumed to represent the year.
Pollution AvoidedThese annual lighting energy savings can be translated
to pollution avoided, as shown below.
Monthly pollution avoided due to photosensor energy savings
SO2
NOx
CO2
lbs kg lbs kg lbs kg
1.9 0.9 5.3 2.4 11,604 5,264
Sulfur dioxide (SO2) is associated with visible pollution (haze) and acid rain.
Nitrogen oxides (NOX) are one of the main causes of ground level ozone
(smog) and acid rain.Carbon dioxide (CO
2) is a possible contributor to global warming.
Impact on Mechanical System Energy Use
The annual impact of the daylighting and switching of
lights on heating and cooling energy was analyzed using
DOE2.1 computer simulations. Compared to a store with-
out skylights or roof monitors, the daylighted store’s annual
heating energy increased by about 1%, but cooling costs
decreased by about 3%.
Economic ImpactThe cost of skylights, roof monitors and windows would
have a long payback time when considering these lighting
energy savings. However, if a store were planning to install
these elements anyway, as would be the case with a major
remodel or construction of a new store, the incremental
cost to implement this simple daylighting control system is
minimal. Building codes in other areas (e.g., California’s
Title 24) require daylight and lighting controls for large
spaces such as this store.

Daylighting in Whole Foods Market
Lessons Learned• Customers and employees enjoy the appearance of
the store with daylighting.
• There were no customer or employee complaints about lights switching off automatically; light on much of the merchandise is provided by integral case lighting or accent lighting that is not controlled by photosensors.
• Simple switching of electric lights in response to daylight provided a modest energy savings (12%).
• Skylights do add to the cost of operating mechanical equipment.
• While the skylights and roof monitor are not paid for by energy savings from electric lighting, the store was planning to provide daylight anyway to create an ambiance consistent with the image of the store.
• Net energy savings would pay for photosensor controls in about two years.
DELTA Portfolio, Lighting Case StudiesVolume 4, Issue 1, December 2013
Daylight in Whole Foods Market
Site Sponsor: New York State Energy Research and Development Authority (NYSERDA)
Program Director and Author: Jennifer Brons
Research Assistance: Dennis Guyon, Howard Ohlhous, Patricia Rizzo, Erin Ryan, Bonnie Westlake
Technical Review: Russ Leslie, Patricia Rizzo, Leora Radetsky
Editor: Rebekah Mullaney
Photography: Jennifer Brons, Dennis Guyon
Graphic Design: Dennis Guyon
CREDITS
Site: Whole Foods Market, Yonkers, NY
NYSERDA: Marsha Walton
Architects: Studio Gee Architects, SBLM Architects
Mechanical and Electrical Design: Harold Rosen Associates
Commissioning Agent: e²s
Lighting Manufacturers: AccuLite, AEI Lighting, Delray Lighting, Louis Poulsen Lighting, Philips Day-Brite Lighting
Building Energy Modeling: Woods and Byk Associates
Special thanks to Tristam Coffin and J'aime Mitchell for their help coordinating with Whole Foods stores, consultants, and documentation.
ISSN 1075-3966
Rensselaer Polytechnic InstituteTroy, New York 12180-3590(518) 687-7100e-mail: [email protected] • www.lrc.rpi.edu
Copyright © 2013, Rensselaer Polytechnic Institute. All rights reserved. Neither the entire publication nor any of the information contained herein may be duplicated or excerpted in any way in any other publication, database, or other medium and may not be reproduced without express written permission of Rensselaer Polytechnic Institute. Making copies of all or part of this publication for any pur-pose other than for undistributed personal use is a violation of United States copyright law.