Embed Size (px)
Citation preview

Deloitte Tohmatsu Financial Advisory LLC
Demand forecast based on the impact of COVID-19Introduction to forecasting office demand
September 2020
© 2020. For information, contact Deloitte Tohmatsu Financial Advisory LLC.
Contents
1. Overview of forecasting model for office demand p.3
2. How to build a forecast model p.6
3. Demand forecasting results p.11
4. Concept of forecasting for specific areas and company p.17

© 2020. For information, contact Deloitte Tohmatsu Financial Advisory LLC.
1. Overview of forecasting model for office demand
3
© 2020. For information, contact Deloitte Tohmatsu Financial Advisory LLC.4
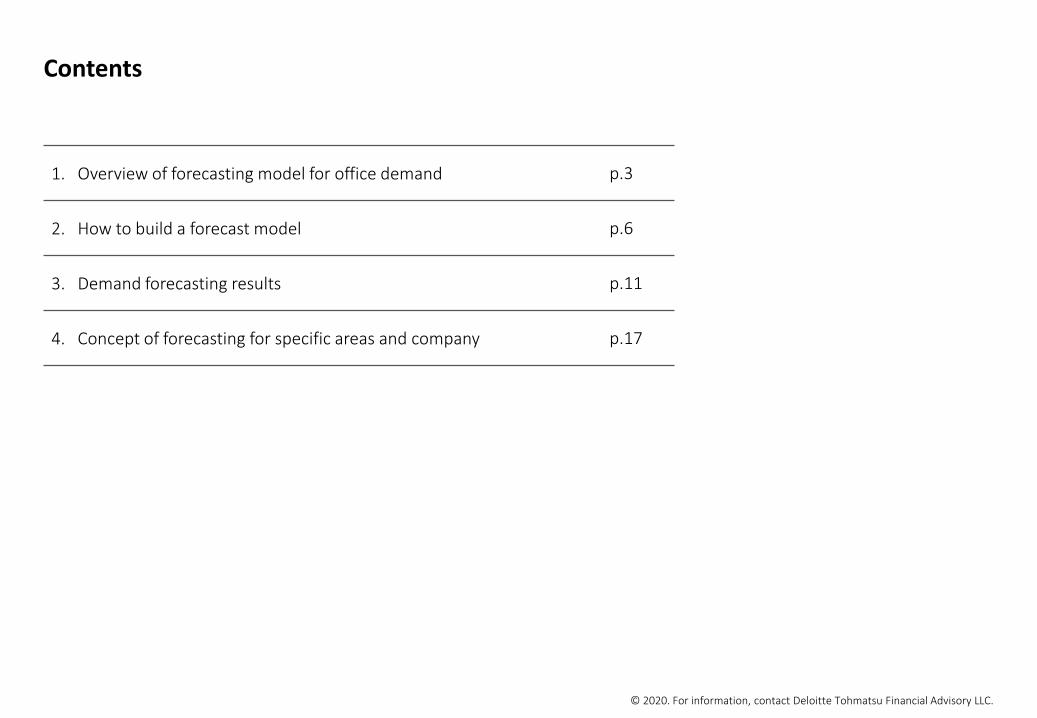
The Purpose of demand forecast
Future economic impact can be simulated by constructing forecast model based on the related indicators in the real estate market under the influence of COVID-19.
Build a forecast model for real estate market trend based on prior research in order to understand the impact of COVID-19.
Building a forecast model
Following prior research by XYMAX Corporation, we try to build a forecast model for office demand.
Organizing related data sets
The learning data, such as the number of office workers, rent, or other information related to office market trend, is collected for building the forecast model.
Building a forecast model
Clarify the time and cost required to recover from the decline due to COVID-19 from the demand forecast.
Visualize the degree of decline of each index using forecast model in Deloitte way
The forecast model is constructed by using the various economic index as leading indicator and including the materials published by public organization. The downward trend of the indicators that lead to decision making in companies can be predicted.
Forecast the time required for recovery
Estimate the time needed to overcome the recession due to the influence of COVID-19
Forecasting future demand
notes※This forecast is based on publicly available information as of mid-July 2020.※This forecast does not identify and quantify all uncertainties related to COVID-19 and the impact of their consequences. It might cause a great impact based on changes in market conditions.
© 2020. For information, contact Deloitte Tohmatsu Financial Advisory LLC.
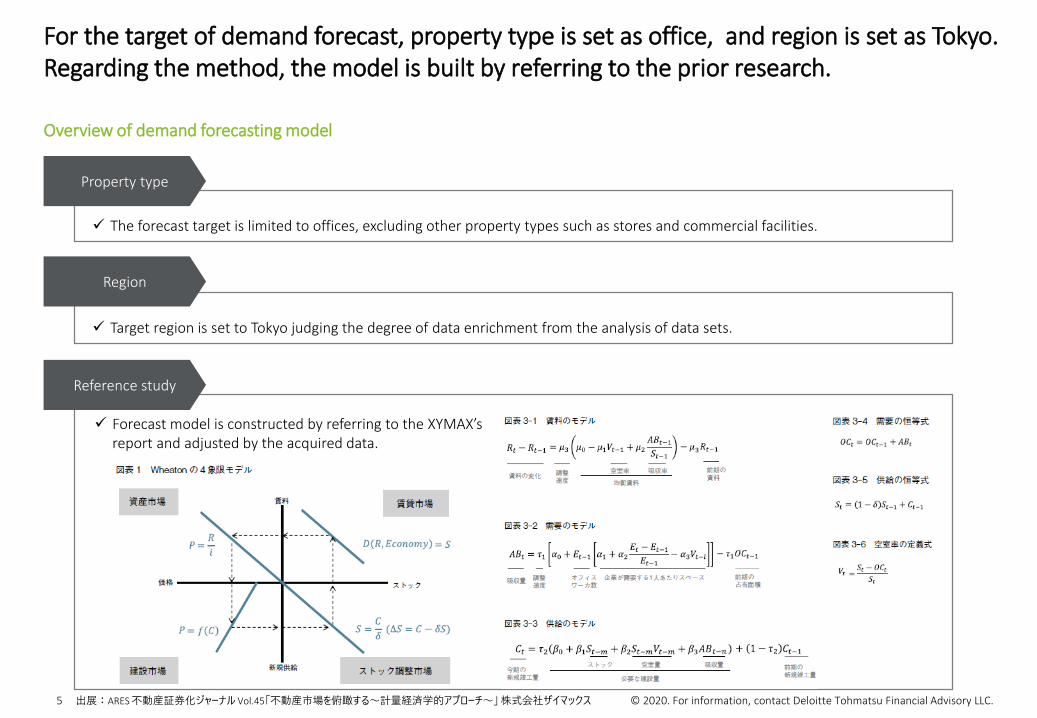
The forecast target is limited to offices, excluding other property types such as stores and commercial facilities.
Property type
Overview of demand forecasting model
For the target of demand forecast, property type is set as office, and region is set as Tokyo. Regarding the method, the model is built by referring to the prior research.
5
Target region is set to Tokyo judging the degree of data enrichment from the analysis of data sets.
Region
Reference study
出展:ARES 不動産証券化ジャーナル Vol.45「不動産市場を俯瞰する~計量経済学的アプローチ~」株式会社ザイマックス
Forecast model is constructed by referring to the XYMAX’s report and adjusted by the acquired data.
© 2020. For information, contact Deloitte Tohmatsu Financial Advisory LLC.
2. How to build a forecast model
6
© 2020. For information, contact Deloitte Tohmatsu Financial Advisory LLC.7
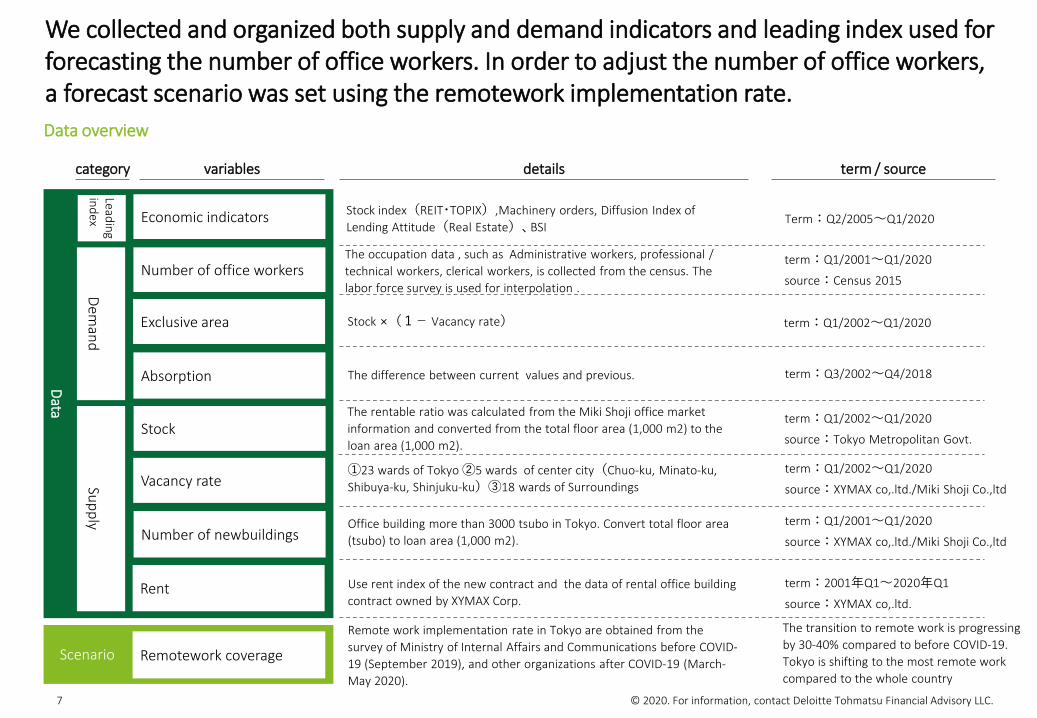
Data overview
We collected and organized both supply and demand indicators and leading index used for forecasting the number of office workers. In order to adjust the number of office workers, a forecast scenario was set using the remotework implementation rate.
Data
Stock
Vacancy rate
Remotework coverage
Demand
Supply
details term / sourcevariablescategory
Stock ×(1- Vacancy rate)
The difference between current values and previous.
①23 wards of Tokyo ②5 wards of center city(Chuo-ku, Minato-ku, Shibuya-ku, Shinjuku-ku)③18 wards of Surroundings
Office building more than 3000 tsubo in Tokyo. Convert total floor area (tsubo) to loan area (1,000 m2).
Use rent index of the new contract and the data of rental office building contract owned by XYMAX Corp.
Remote work implementation rate in Tokyo are obtained from the survey of Ministry of Internal Affairs and Communications before COVID-19 (September 2019), and other organizations after COVID-19 (March-May 2020).
term:Q1/2001~Q1/2020
source:Census 2015
term:Q3/2002~Q4/2018
term:Q1/2002~Q1/2020
source:XYMAX co,.ltd./Miki Shoji Co.,ltd
term:Q1/2001~Q1/2020
source:XYMAX co,.ltd./Miki Shoji Co.,ltd
term:2001年Q1~2020年Q1
source:XYMAX co,.ltd.
The transition to remote work is progressing by 30-40% compared to before COVID-19. Tokyo is shifting to the most remote work compared to the whole country
Scenario
Rent
Number of newbuildings
The rentable ratio was calculated from the Miki Shoji office market information and converted from the total floor area (1,000 m2) to the loan area (1,000 m2).
term:Q1/2002~Q1/2020
source:Tokyo Metropolitan Govt.
Number of office workers
Exclusive area
Absorption
term:Q1/2002~Q1/2020
The occupation data , such as Administrative workers, professional / technical workers, clerical workers, is collected from the census. The labor force survey is used for interpolation .
Leading index Economic indicators Stock index(REIT・TOPIX),Machinery orders, Diffusion Index of
Lending Attitude(Real Estate)、BSITerm:Q2/2005~Q1/2020

© 2020. For information, contact Deloitte Tohmatsu Financial Advisory LLC.
We forecast the number of office workers from economic indicators, which are leading indicatorsand the remote work implementation rate. We try to build a model that predicts rent from the causal relationship between supply and demand indicators.
8
Causal relationship between data and indicators required for demand forecasting
Exclusive area
Absorption
Forecast for office workers by leading indicators
Number of office workers
Machinery orders
Leading indicators
BSI
Diffusion Index of Lending Attitude
TOPIX
REIT
Demand index Supply index
Number of newbuildings
Stock
Vacancy rate
rent
Office rent
Forecast for supply and demand index by causal relationship of variables Forecast for rent
Scenario parameter
Remotework coverage ratio
①
②
③
③
④
④④
⑤
Deloitte way
Deloitte way
© 2020. For information, contact Deloitte Tohmatsu Financial Advisory LLC.
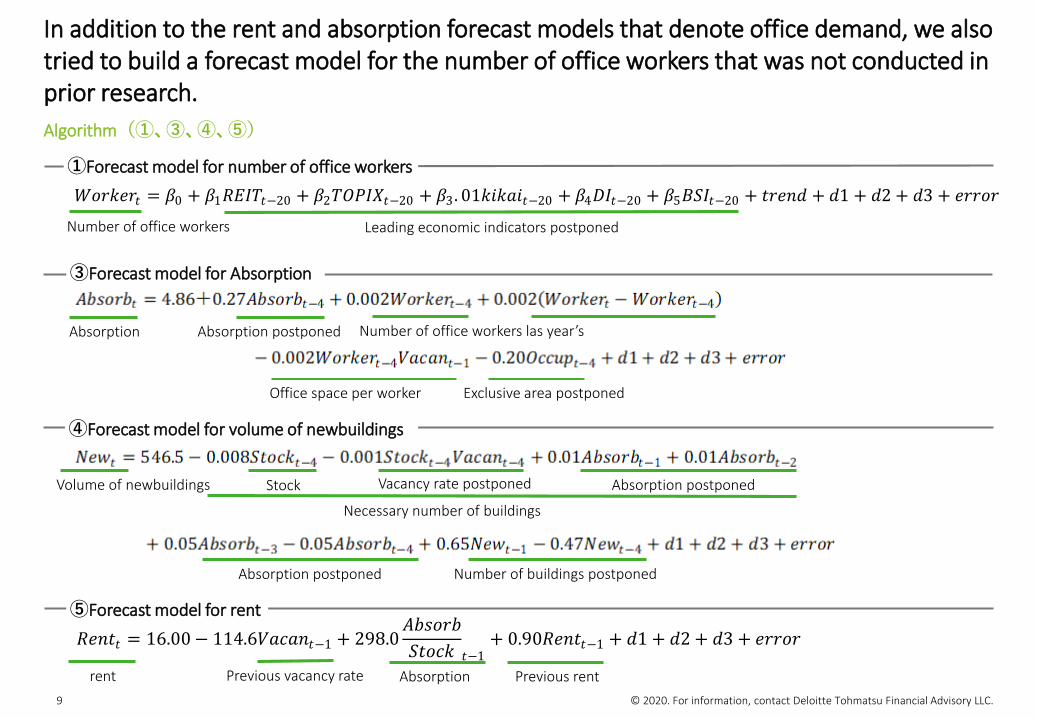
Algorithm(①、③、④、⑤)
In addition to the rent and absorption forecast models that denote office demand, we also tried to build a forecast model for the number of office workers that was not conducted in prior research.
9
𝑊𝑊𝑊𝑊𝑊𝑊𝑊𝑊𝑊𝑊𝑊𝑊𝑡𝑡 = 𝛽𝛽0 + 𝛽𝛽1𝑅𝑅𝑅𝑅𝑅𝑅𝑅𝑅𝑡𝑡−20 + 𝛽𝛽2𝑅𝑅𝑇𝑇𝑇𝑇𝑅𝑅𝑇𝑇𝑡𝑡−20 + 𝛽𝛽3. 01𝑊𝑊𝑘𝑘𝑊𝑊𝑘𝑘𝑘𝑘𝑡𝑡−20 + 𝛽𝛽4𝐷𝐷𝑅𝑅𝑡𝑡−20 + 𝛽𝛽5𝐵𝐵𝐵𝐵𝑅𝑅𝑡𝑡−20 + 𝑡𝑡𝑊𝑊𝑊𝑊𝑡𝑡𝑡𝑡 + 𝑡𝑡1 + 𝑡𝑡2 + 𝑡𝑡3 + 𝑊𝑊𝑊𝑊𝑊𝑊𝑊𝑊𝑊𝑊
𝑅𝑅𝑊𝑊𝑡𝑡𝑡𝑡𝑡𝑡 = 16.00− 114.6𝑉𝑉𝑘𝑘𝑉𝑉𝑘𝑘𝑡𝑡𝑡𝑡−1 + 298.0𝐴𝐴𝐴𝐴𝐴𝐴𝑊𝑊𝑊𝑊𝐴𝐴𝐵𝐵𝑡𝑡𝑊𝑊𝑉𝑉𝑊𝑊 𝑡𝑡−1
+ 0.90𝑅𝑅𝑊𝑊𝑡𝑡𝑡𝑡𝑡𝑡−1 + 𝑡𝑡1 + 𝑡𝑡2 + 𝑡𝑡3 + 𝑊𝑊𝑊𝑊𝑊𝑊𝑊𝑊𝑊𝑊
①Forecast model for number of office workers
③Forecast model for Absorption
④Forecast model for volume of newbuildings
⑤Forecast model for rent
Previous vacancy rate Previous rentAbsorption
Number of buildings postponed
Stock Vacancy rate postponed Absorption postponed
Necessary number of buildings
Volume of newbuildings
rent
Absorption Number of office workers las year’s
Office space per worker
Absorption postponed
Exclusive area postponed
Leading economic indicators postponedNumber of office workers
Absorption postponed
© 2020. For information, contact Deloitte Tohmatsu Financial Advisory LLC.10
Summary of the forecast scenario(②)
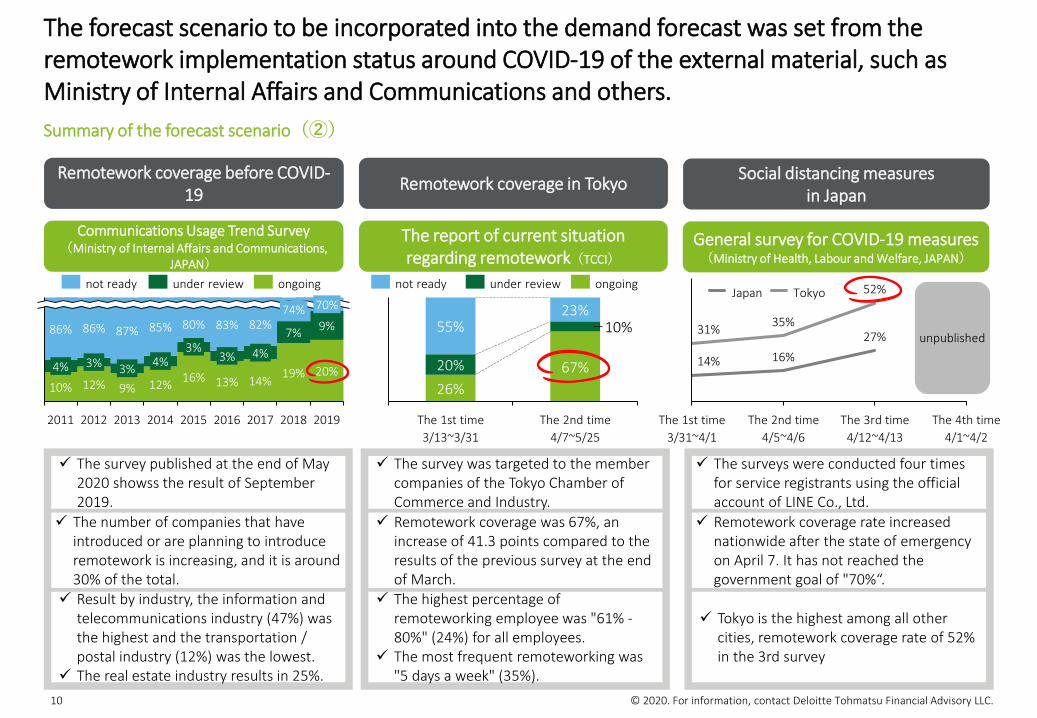
The forecast scenario to be incorporated into the demand forecast was set from the remotework implementation status around COVID-19 of the external material, such as Ministry of Internal Affairs and Communications and others.
The report of current situation regarding remotework(TCCI)
Communications Usage Trend Survey(Ministry of Internal Affairs and Communications,
JAPAN)
Remotework coverage was 67%, an increase of 41.3 points compared to the results of the previous survey at the end of March.
The highest percentage of remoteworking employee was "61% -80%" (24%) for all employees.
The most frequent remoteworking was "5 days a week" (35%).
The survey was targeted to the member companies of the Tokyo Chamber of Commerce and Industry.
The survey published at the end of May 2020 showss the result of September 2019.
The number of companies that have introduced or are planning to introduce remotework is increasing, and it is around 30% of the total.
Result by industry, the information and telecommunications industry (47%) was the highest and the transportation / postal industry (12%) was the lowest.
The real estate industry results in 25%.
Remotework coverage in TokyoRemotework coverage before COVID-19
55%
20%
10%
The 1st time3/13~3/31
23%
The 2nd time4/7~5/25
26%67%
under reviewnot ready ongoing
10% 12% 9% 12% 16% 13% 14% 19% 20%
7% 9%
2013
85%86%
2019
3%
83%
2015
3%
2016
82%
4%
2017
74%
20182012
86%
3%4%
80%
20142011
4%
87%
3%
70%
not ready under review ongoing
General survey for COVID-19 measures(Ministry of Health, Labour and Welfare, JAPAN)
The surveys were conducted four times for service registrants using the official account of LINE Co., Ltd.
Remotework coverage rate increased nationwide after the state of emergency on April 7. It has not reached the government goal of "70%“.
Tokyo is the highest among all other cities, remotework coverage rate of 52% in the 3rd survey
Social distancing measures in Japan
14% 16%
27%31% 35%
52%
The 1st time3/31~4/1
The 3rd time4/12~4/13
The 2nd time4/5~4/6
The 4th time4/1~4/2
Japan Tokyo
unpublished
© 2020. For information, contact Deloitte Tohmatsu Financial Advisory LLC.
3. Demand forecasting results
11

© 2020. For information, contact Deloitte Tohmatsu Financial Advisory LLC.
Forecast for number of office worker
The number of office workers is estimated based on the historical trends of leading indicators. After COVID-19, the number of office workers is estimated according to new normal workstyle premised on remote work.
12
2,000,000
2,100,000
2,200,000
2,300,000
2,400,000
2,500,000
2,600,000
2,700,000
2,800,000
2,900,000
3,000,000
20242004 2005 2016 202520122006
(people)
2003 2007 20092008 2010 20182011 2013 2014 2015 2017 2019 2020 2021 2022 2023
Forecast
Model Structure
machinery orders
BSI
Diffusion Index of Lending Attitude
Number of office worker
TOPIX
TSE REIT
explanatory variable outcome variableAdjusted number of
office worker
Remoteworkcoverage ratio
Parameter value
predictive value
15% down from forecast
①
②
Actual value
© 2020. For information, contact Deloitte Tohmatsu Financial Advisory LLC.
Forecast for Absorption
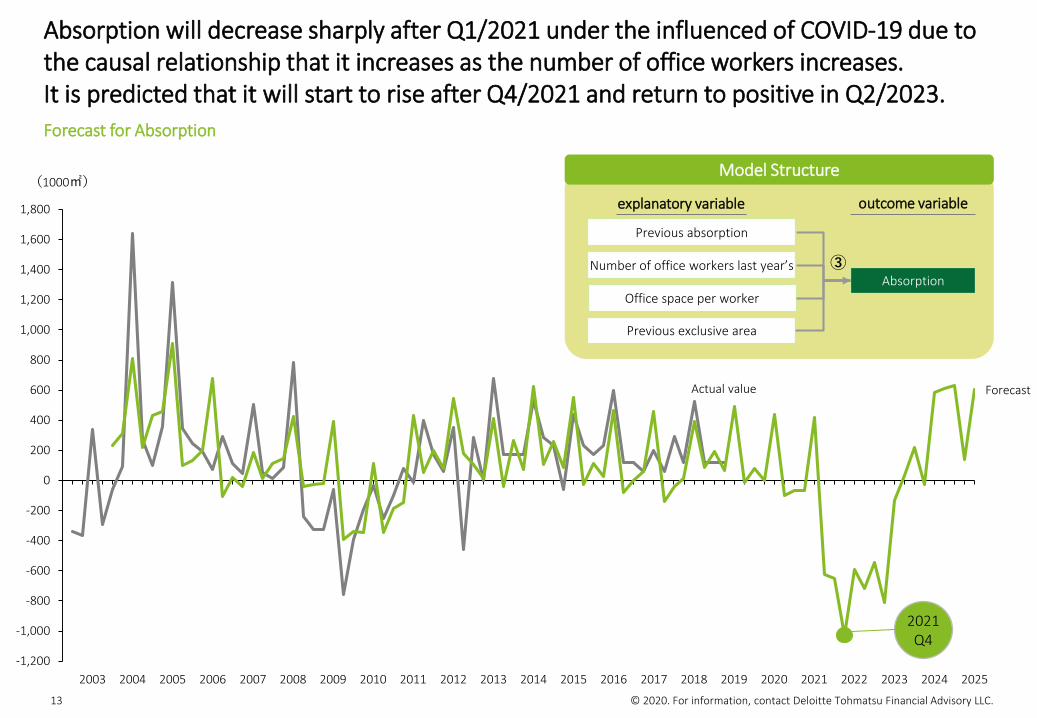
Absorption will decrease sharply after Q1/2021 under the influenced of COVID-19 due to the causal relationship that it increases as the number of office workers increases.It is predicted that it will start to rise after Q4/2021 and return to positive in Q2/2023.
13
-1,200
-1,000
-800
-600
-400
-200
0
200
400
600
800
1,000
1,200
1,400
1,600
1,800
20172008 20122009
(1000㎡)
20042003 2005 2006 2007 20152010 2011 2013 20242014 2016 2018 2019 2020 2021 2022 2023 2025
Forecast
Model Structure
Previous absorption
Number of office workers last year’s
Office space per workerAbsorption
Previous exclusive area
explanatory variable outcome variable
2021Q4
③
Actual value
© 2020. For information, contact Deloitte Tohmatsu Financial Advisory LLC.
Forecast for volume of newbuildings
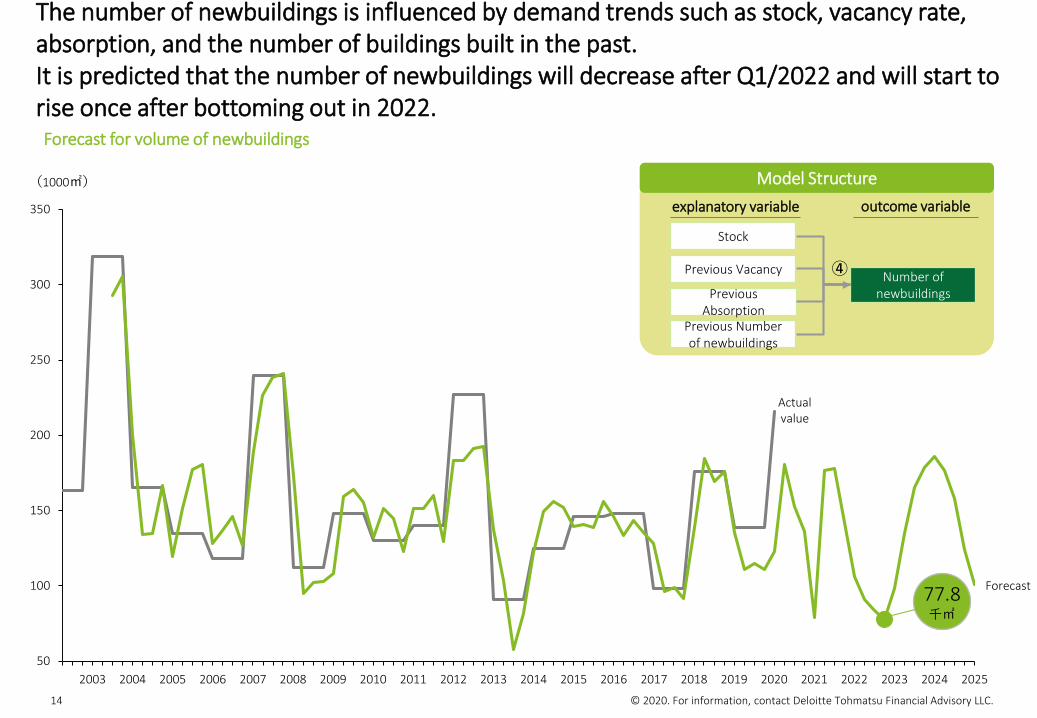
The number of newbuildings is influenced by demand trends such as stock, vacancy rate, absorption, and the number of buildings built in the past.It is predicted that the number of newbuildings will decrease after Q1/2022 and will start to rise once after bottoming out in 2022.
14
50
100
150
200
250
300
350
202520172004 2010
(1000㎡)
20132003 20072005 2006 2008 2009 2011 2012 20202014 2015 2016 2018 2019 2021 2022 2023 2024
Forecast
Model Structure
Stock
Previous Vacancy
Previous Absorption
Number of newbuildings
Previous Number of newbuildings
explanatory variable outcome variable
77.8千㎡
④
Actualvalue
© 2020. For information, contact Deloitte Tohmatsu Financial Advisory LLC.15
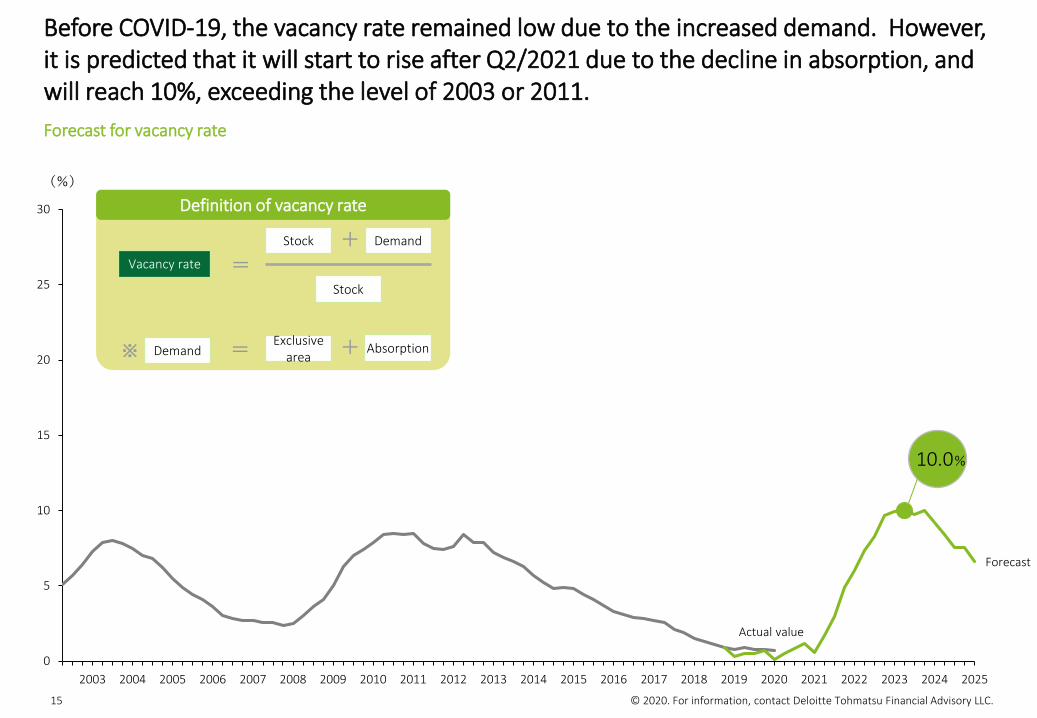
Forecast for vacancy rate
Before COVID-19, the vacancy rate remained low due to the increased demand. However, it is predicted that it will start to rise after Q2/2021 due to the decline in absorption, and will reach 10%, exceeding the level of 2003 or 2011.
0
5
10
15
20
25
30
2016 20182003
(%)
201220052004 2006 2007 2008 2009 2010 2011 2013 2014 2015 2017 2019 2020 2021 2022 2023 2024 2025
Forecast
10.0%
Definition of vacancy rate
DemandStock
Vacancy rate
Stock=
+
※ Demand = Exclusive area
Absorption+
Actual value
© 2020. For information, contact Deloitte Tohmatsu Financial Advisory LLC.
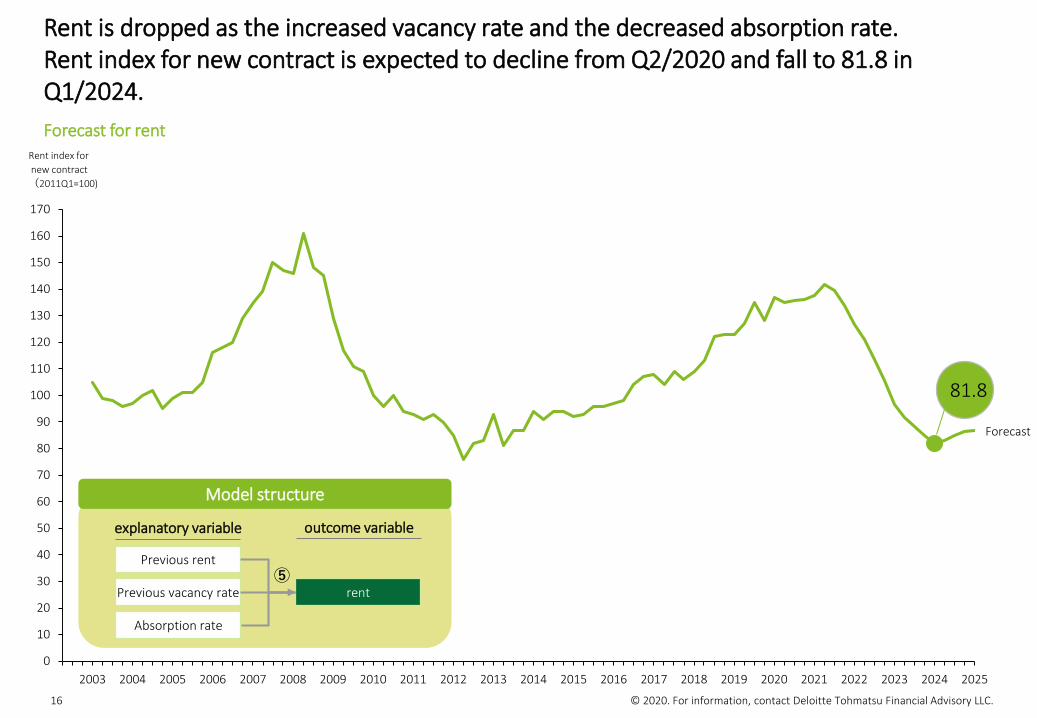
Forecast for rent
Rent is dropped as the increased vacancy rate and the decreased absorption rate.Rent index for new contract is expected to decline from Q2/2020 and fall to 81.8 in Q1/2024.
16
0
10
20
30
40
50
60
70
80
90
100
110
120
130
140
150
160
170
20182007
Rent index fornew contract (2011Q1=100)
2003 2008 201020052004 2006 2009 2011 2012 2013 2014 2015 2016 2017 2019 2020 2021 2022 2023 2024 2025
Forecast
Model structure
Previous rent
Previous vacancy rate
Absorption rate
rent
explanatory variable outcome variable
⑤
81.8
© 2020. For information, contact Deloitte Tohmatsu Financial Advisory LLC.
4. Concept of forecasting for specific areas and company
17
© 2020. For information, contact Deloitte Tohmatsu Financial Advisory LLC.
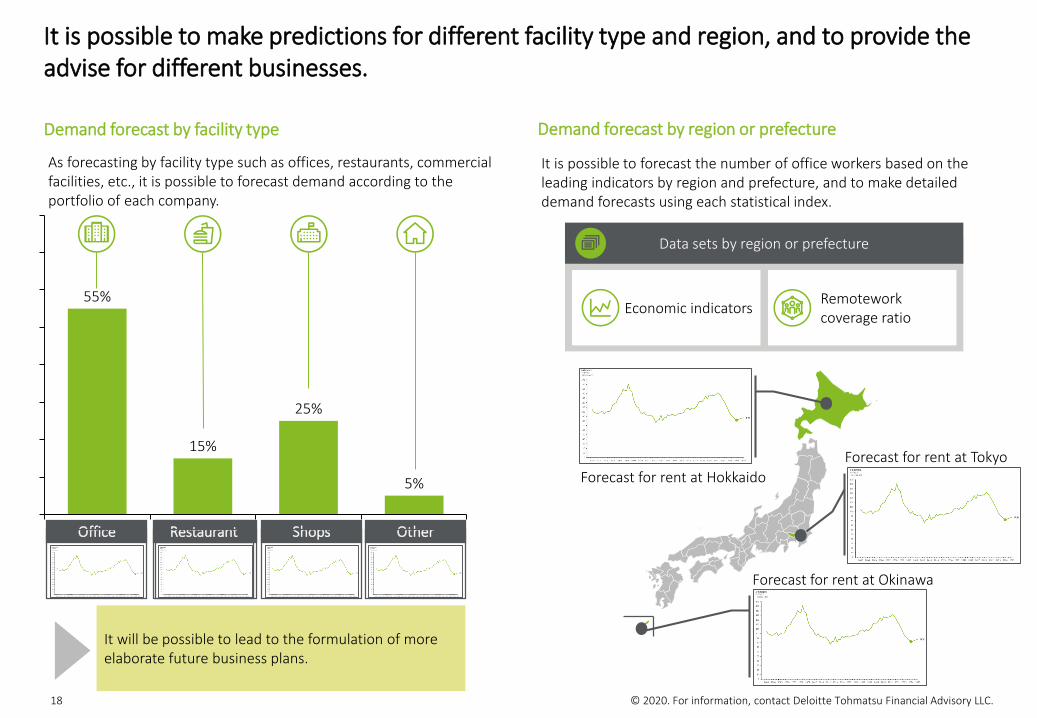
It is possible to make predictions for different facility type and region, and to provide the advise for different businesses.
Demand forecast by facility type
It is possible to forecast the number of office workers based on the leading indicators by region and prefecture, and to make detailed demand forecasts using each statistical index.
Demand forecast by region or prefecture
Economic indicators
Data sets by region or prefecture
Remoteworkcoverage ratio
Forecast for rent at Hokkaido
As forecasting by facility type such as offices, restaurants, commercial facilities, etc., it is possible to forecast demand according to the portfolio of each company.
18
Forecast for rent at Tokyo
Forecast for rent at Okinawa
55%
15%
25%
5%
Office オフィスRestaurant Shops Other
It will be possible to lead to the formulation of more elaborate future business plans.

Member ofDeloitte Touche Tohmatsu Limited
Deloitte Tohmatsu Group (Deloitte Japan) is a collective term that refers to Deloitte Tohmatsu LLC, which is the Member of Deloitte Asia Pacific Limited and of the Deloitte Network in Japan, and firms affiliated with Deloitte Tohmatsu LLC that include Deloitte Touche Tohmatsu LLC, Deloitte Tohmatsu Consulting LLC, Deloitte Tohmatsu Financial Advisory LLC, Deloitte Tohmatsu Tax Co., DT Legal Japan, and Deloitte Tohmatsu Corporate Solutions LLC. Deloitte Tohmatsu Group is known as one of the largest professional services groups in Japan. Through the firms in the Group, Deloitte Tohmatsu Group provides audit & assurance, risk advisory, consulting, financial advisory, tax, legal and related services in accordance with applicable laws and regulations. With more than 10,000 professionals in over 30 cities throughout Japan, Deloitte Tohmatsu Group serves a number of clients including multinational enterprises and major Japanese businesses. For more information, please visit the Group’s website at www.deloitte.com/jp/en.
Deloitte refers to one or more of Deloitte Touche Tohmatsu Limited (“DTTL”), its global network of member firms, and their related entities (collectively, the “Deloitte organization”). DTTL (also referred to as “Deloitte Global”) and each of its member firms and related entities are legally separate and independent entities, which cannot obligate or bind each other in respect of third parties. DTTL and each DTTL member firm and related entity is liable only for its own acts and omissions, and not those of each other. DTTL does not provide services to clients. Please see www.deloitte.com/about to learn more.Deloitte Asia Pacific Limited is a company limited by guarantee and a member firm of DTTL. Members of Deloitte Asia Pacific Limited and their related entities, each of which are separate and independent legal entities, provide services from more than 100 cities across the region, including Auckland, Bangkok, Beijing, Hanoi, Hong Kong, Jakarta, Kuala Lumpur, Manila, Melbourne, Osaka, Seoul, Shanghai, Singapore, Sydney, Taipei and Tokyo.
This communication contains general information only, and none of Deloitte Touche Tohmatsu Limited (“DTTL”), its global network of member firms, or their related entities (collectively, the “Deloitte organization”) is, by means of this communication, rendering professional advice or services. Before making any decision or taking any action that may affect your finances or your business, you should consult a qualified professional adviser. No representations, warranties or undertakings (express or implied) are given as to the accuracy or completeness of the information in this communication, and none of DTTL, its member firms, related entities, employees or agents shall be liable or responsible for any loss or damage whatsoever arising directly or indirectly in connection with any person relying on this communication. DTTL and each of its member firms, and their related entities, are legally separate and independent entities.
© 2020. For information, contact Deloitte Tohmatsu Financial Advisory LLC.