Embed Size (px)
Citation preview
SANDEE Working Paper No. 5-04 I
Demand for Eco-tourism:Estimating Recreational Benefits from the
Margalla Hills National Park in Northern Pakistan
HIMAYATULLAH KHAN
Institute of Development Studies (IDS)Peshawar, Pakistan
April 2004
South Asian Network for Development and Environmental Economics (SANDEE)PO Box 8975, EPC 1056
Kathmandu, Nepal
Working Paper No. 5-04

II SANDEE Working Paper No. 5-04
Published by the South Asian Network for Development and Environmental Economics (SANDEE),PO Box 8975, EPC 1056 Kathmandu, Nepal.Telephone: 977-1-552 8761, 552 6391 Fax: 977-1-553 6786
SANDEE research reports are the output of research projects supported by the South Asian Network forDevelopment and Environmental Economics. The reports have been peer reviewed and edited. A summaryof the findings of SANDEE reports are also available as SANDEE Policy Briefs.
National Library of Nepal Catalogue Service:
Himayatullah Khan
Demand for Eco-tourism: Estimating Recreational Benefits from the Margalla Hills National Park in
Northern Pakistan
ISBN: 99933–826–4–7
Key Words
1. Environmental Valuation
2. Travel Cost Method
3. Willingness to Pay
4. Total Recreational Value
5. National Parks
6. Pakistan
The views expressed in this publication are those of the author and do not necessarily represent those ofthe South Asian Network for Development and Environmental Economics or its sponsors unless otherwisestated.

SANDEE Working Paper No. 5-04 III
The South Asian Network for Development and Environmental Economics
The South Asian Network for Development and Environmental Economics (SANDEE) is aregional network that brings together analysts from different countries in South Asia to addressenvironment-development problems. SANDEE’s activities include research support, training,and information dissemination. SANDEE is supported by contributions from international donorsand its members. Please see www.sandeeonline.org for further information about SANDEE.
Technical Editors:
Herath Gunatilake
Priya Shyamsundar
English Editor:
Carmen Wickramagamage
Comments should be sent to Himayatullah Khan, Institute of Development Studies (IDS), NWFPAgricultural University, Peshawar-25000, Pakistan. E-mail: [email protected] [email protected]

SANDEE Working Paper No. 5-04 V
TABLE OF CONTENTS
1. INTRODUCTION 1
2. RESEARCH PROBLEM 2
3. DESCRIPTION OF THE STUDY SITE 3
4. VALUING NATURE WITH TRAVEL COST MODELS (TCM) 4
5. VALUING ECOTOURISM IN DEVELOPING COUNTRIES: AN OVERVIEW 4
6. RESEARCH METHODS 6
6.1 Theoretical Framework 7
6.2 Factors that Determine Recreational Demand 8
6.3 Sample Size, Sampling and Data Collection Methods 10
6.4 Econometric Models 11
7. RESULTS AND DISCUSSIONS 12
7.1 Descriptive Statistics 12
7.2 Empirical Results 16
7.2.1 Test Statistics 16
7.3 Estimation of Benefits Based on Individual Cost Travel Method 16
7.4 The Impact of Quality Improvements on Recreational Demand 17
7.5 Recreational Value of MHN Park 18
7.6 Simulation of Entrance Fee 19
8. CONCLUSIONS AND POLICY IMPLICATIONS 20
9. ACKNOWLEDGEMENTS 21
REFERENCES 23
APPENDIX 1: Interview Schedule 27
APPENDIX 2: MHNP in the Region 31
APPENDIX 3: Map of MHNP and Islamabad 33
APPENDIX 4: Correlation Matrix of Variables 35

SANDEE Working Paper No. 5-04 VII
LIST OF TABLES
Table 1: Sample respondents interviewed in different seasons and locations of the MHN Park 10
Table 2: Explanatory variables and hypotheses 12
Table 3: Sample respondents reporting recreational trips, income, and travel costs to MHN 13
Park and substitute site
Table 4: Descriptive characteristics of sample respondents 13
Table 5: Reasons for visiting MHN Park by sample respondents 14
Table 6: Frequency distribution of household monthly income 15
Table 7: Classification of sample respondents by occupation 15
Table 8: Estimated results of linear regression equations 16
Table 9: Visitors’ perceptions regarding improvements in MHN Park 17
Table 10: Recreational value of the MHN Park in 2002-03 18
LIST OF FIGURES
Figure 1: Frequency Distribution of Trips to MHN Park 14
Figure 2: Park Visitation Demand Curves 18
Figure 3: Visitors of MHNP Distinguished by WTP at Different Entrance Fee 19
Figure 4: Entrance Fee, Total Revenue and Consumer Surplus 20
Abstract
This study, which is among the first in Pakistan to value recreational benefits, estimates the benefits ofestablishing and managing the Margalla Hills National Park near Islamabad. The study examines howmuch park visitors are willing to pay to visit and enjoy the park. Annual benefits from the Park areconsiderable—the total annual consumer surplus or economic benefit obtained from recreation in thePark is approximately Rs. 23 million (US$ 0.4 million). Various factors influence the value visitors obtainfrom the park — these include travel cost, household income, and the quality of the park. Improvementsin the quality of the park are likely to increase recreational benefits by a significant 39%. The studyrecommends that a Park entrance fee of Rs. 20 per person be introduced, which could be utilized for parkmanagement. This would generate nearly Rs. 11 million in revenues annually, a sizable amount of moneythat represents about 4% of the annual budget allocated to the Environment Sector in Pakistan.
Keywords: Environmental valuation, travel cost method, total recreational value, national parks, Pakistan.
SANDEE Working Paper No. 5-04 1
Demand for Eco-tourism: Estimating Recreational Benefitsfrom the Margalla Hills National Park in Northern Pakistan
Himayatullah Khan
1. Introduction
No time to see, when woods we passWhere squirrels hide their nuts in grass
A poor life this if, full of care,We have no time to stand and stare
(“Leisure,” William Henry Davies, 1871-1940)
In developing countries, governments are often strapped for resources to protect, conserve and sustainablyuse natural resources. In such situations, ecotourism can play an important role in ensuring both naturalresource conservation and economic growth. A growing body of literature stresses the role eco-tourismcan play in managing national parks and protected areas. In developing countries, park entry fees areoften low, or sometimes non-existent, generating little revenue therefore for park management. Further,whatever tourism revenues that exist are frequently merged with other general sources and not earmarkedfor park maintenance. Because of the ineffective capture of ecotourism revenues, alternative land usesthat provide greater short-run returns, such as logging, agriculture, and cattle grazing, seem profitableeven on public lands. The result is often deforestation, soil erosion, watershed degradation, and irreversibleloss of bio-diversity (Southgate and Whitaker, 1994).
The potential benefits from charging user fees and using differential pricing in national parks are significant.User fees are a mechanism to capture the public benefits of ecotourism, which often accrue primarily tothe private sector. They can also be used to reduce visits to areas that suffer from overuse and ecologicaldamage. Developing countries have little experience in guiding natural resource managers to design effectivepricing strategies. Analyses that assess the impacts of user fees and differential pricing are needed so thatappropriate policies can be devised and implemented (Chase, et al., 1998).
Like many other developing countries, Pakistan is seeking to revitalize its tourism sector, including nature-based tourism. Pakistan is one of the poorest South Asian countries in terms of bio-diversity. Forestscover as little as 5% of the country and deforestation rates have been high (World Resource Institute,1996). In recent years, however, the Government of Pakistan has shown an interest in the expansion andproper maintenance of the national park system. But, though the number of national parks and reserves issmall in Pakistan, their management is far from satisfactory. This may be partly because of insufficientgovernmental funds and open access of visitors to these places. Economic valuation of these environmentalresources can provide valuable information for the better management of parks.
This paper seeks to value the recreational benefits from a specific national park in Pakistan: the MargallaHills National Park in Northern Pakistan. The main objective of the paper is to assess overall recreationalvalues emanating from the park and to use this information in order to estimate a specific entry fee foraccessing the park. This, it must be stressed, is the first valuation study in Pakistan to examine thebenefits of recreation.
2 SANDEE Working Paper No. 5-04
2. Research Problem
Many natural resource systems such as lakes, rivers, streams, estuaries, forests and parks are used extensivelyby people for various types of recreational activities. Natural resource systems provide valuable servicesto people. From an economic perspective, these services have two important features. Firstly, the economicvalue of these services depends upon the characteristics of the natural resource system. A knowledge ofthe value of these services is therefore important for a variety of resource management decisions. Secondly,access to the resource for recreation is typically not allocated through markets. Rather, access is typicallyopen to all visitors at a zero price or a nominal entrance fee that bears no relationship to the cost ofproviding access to, or consumer valuation of, the resources. Moreover, there is little or no variation inthese access prices over time, or across sites, in order to enable an econometric estimation of demandfunctions (Freeman, 1993).
Like other environmental resources and public goods, national parks benefit society in many differentways. They perform not only ecological functions but also provide recreational facilities to those whovisit these parks. National parks also help contribute precious foreign exchange earnings to national coffers.Pakistan is very deficient in forest resources because, as mentioned earlier, forests cover only 5 percent ofits area and there are only a few parks in the country. These parks are, however, threatened by variousactivities such as forest fire, soil erosion, human settlement inside the parks and encroachment by localvillagers, and pollution created by the villagers or visitors inside the parks. The overall negative impact ofthe above mentioned factors, along with insufficient funding, may have contributed to the mismanagementof these parks.
Two sources of funds are available for park management: (a) federal and/or provincial government budgetaryallocations; (b) revenues generated from park entry fees. The government budget allocated for themanagement of national parks in Pakistan is very limited as it must compete with other programmes, suchas education, healthcare, infrastructure, defense spending, etc., in the country. Therefore, the other alternativewould be to generate more revenues for park management through user fees. At present, either there is noentry fee or only a nominal entry fee for accessing national parks. Therefore, charging entry fees to theseparks could generate sufficient funds for the proper upkeep of these parks. Moreover, park revenues fromentry fees might even go up if parks were suitably priced. This suggests that although the federal governmentbudget allocation for National Park management faces stiff competition from other items in the budget,adjusting park entrance fees may increase park revenue. There is a dire need, however, to manage them ona sustainable basis, which in turn requires their correct valuation. The present study investigates thepossibility of enhancing park entry fees to reflect the recreational benefits that national parks provide tovisitors. This study focuses on the Margalla Hills National (MHN) Park, Islamabad.
The overall goal of the study is to measure the recreational value of the Margalla Hills National Park,Islamabad, Pakistan. The specific objectives of the study are to investigate (i) if there exists the usualfunctional relationship between travel cost (p) and park visitation (q); (ii) to determine the factors thataffect the visitors’ willingness to pay (WTP) for recreational services of the park; (iii) to estimate theconsumer surplus and recreational value (benefits) of the MHN Park; (iv) to use these values to determinean optimal entrance fee for visiting the MHN park; (v) to find out whether improvements in the recreationalbenefits of the park would lead to a higher demand for park visitation; and (vi) to offer policyrecommendations on how overall benefits of the park can be improved. In this study, we use the TravelCost Method (TCM) to estimate the recreational benefits associated with MHN Park.
SANDEE Working Paper No. 5-04 3
3. Description of the Study Site
Margalla Hills National (MHN) Park constitutes the area of this study. The MHN Park is spread over anarea of about 15,800 hectares. It is situated on the northern, eastern and western sides of Islamabad. Itincludes the Margalla Hills, Rawal Lake and Shakar Parian and was given the status of a national park in1980 after the government recognized the growing threat to its flora and fauna. Of the three distinct units,the largest area, the Margalla Hills, of approximately 12,600 hectares, represents the natural environmentchanged by villagers living in direct contact with and depending on the fertility of the land. The MargallaHills consist of mountain wilderness, an urban recreation and cultural centre, and a large reservoir. TheRawal Lake of approximately 1,900 hectares represents a man-made park environment, which has theappearance of a natural ecosystem. To provide a continuous supply of drinking water, city plannersrenovated part of a pre-historic lake, which created a rare opportunity for the population in the CapitalTerritory to experience a lake environment and to watch waterfowl as well as to indulge in sports otherthan the usual outdoor recreation activities such as picnics, strolls, and jogging. It has a 2-km perimeteraround the lakeshore buffer, which contains a domestic water supply, waterfowl habitat, and recreationalarea. Shakar Parian, covering approximately 1,300 hectares, represents an urban recreational and culturalpark and provides the urban population with excellent recreational facilities for activities such as sports,jogging, strolls, picnics, etc.
The combination of land-use types in the three units of the Margalla Hills National (MHN) Park offersoutstanding recreational and educational opportunities for the people of Pakistan. It is located in thefoothills of the Himalayan range and is the most accessible park in Pakistan due to its close proximity tothe national capital, Islamabad. The Margalla Hills add to the scenic beauty of Islamabad. These hills aretraversed by over 15 winding trails. Coiling around various hills and passing through gorges, the trailsprovide a rare opportunity for trekkers, hikers and riders to choose from distances between 1.5 to 15kilometers that rise from 640 to 1850 meters above sea level. Of limestone structure, the Margalla Hillscover over 31,000 acres of reserve forests and grass farms and offer convenient options to plan and climbany day of the week.
The Park has a predominantly subtropical flora that consists of dry, semi-evergreen vegetation and pines.In recent years, a number of ornamental plants have been introduced and prominent among these areGul-e-Nashter, Jacaranda, Bottlebrush, Amaltas, Chir, Eucalyptus, etc. Main species of trees are Phulaiand Kao while Sanatha, Granda and Bair are the major associate species. Kachnar, Khair, Kamila, KangarAmaltas, Dhawi, Amla, Dharruni, Shamshad, Sheesham and Date Palm add richness to the floral variety.
The Park is a habitat for various species of animals and birds. The Gray Goral, Barking Deer, Monkey,Kalij, Chir Pheasants and Grey and Black Partridges particularly arouse the interest of wild life enthusiasts.Other mammals in the park include the Asiatic Leopard, Wild Boar, Jackal, Rhesus Macaque, LeopardCat, Gray Goral Sheep, Chinkara Gazelle (rare), Red Fox, Pangolin, Porcupine, Yellow-throated Martenand Fruit Bats. Although the park is not the natural abode of the Panther and Leopard, sightings of theseanimals have not been uncommon in this area in winter and are always religiously reported.
Protection of these animals has benefited other unusual and interesting smaller animals as well. TheMargalla Hills Park provides an excellent opportunity for bird-watching. A Chir Pheasant hatchery hasbeen established at Chak Jabri to raise captive Chir Pheasants that have become extinct in the hills. Theseare then released in the wild. Other birds in the park are Griffin Vulture, Laggar Falcon, Peregrine Falcon,Kestrel, Indian Sparrow Hawk, Egyptian Vulture, White Cheeked Bulbul, Yellow Vented Bulbul, Paradise

4 SANDEE Working Paper No. 5-04
Flycatcher, Golden Oriole, Spotted Dove, Collared Dove, Larks, Shrikes, and Buntings. Among the Reptilesin the park are the Russelles Viper, Indian Cobra and Saw-Scaled Viper.
4. Valuing Nature with Travel Cost Models (TCM)
The TCM was developed from a suggestion made by Harold Hotelling in 1947 in a release on the economicsof recreation in US national parks by the National Park Service. Hotelling suggested measuring differentialtravel rates according to travel distances that visitors had to overcome in order to reach a park. Exploitingthe empirical relationship between increased travel distances and associated declining visitation rates,according to him, would permit one to estimate a true demand relationship. If estimated empirically, thisdemand schedule could be used to compute the total benefits produced to park visitors, which should beequal to any entry fees they paid plus other unpriced benefits or consumer surplus (Hotelling, 1947).
Clawson (1959), Knetsch (1963), and later Clawson and Knetsch (1966) were instrumental in furtherdeveloping TCM. Clawson and Knetsch (1966) showed how a zonal methodology (ZTCM) could be usedto derive a demand curve for a site. The derived demand curves estimated by them appeared generallysatisfactory. They exhibited a negative relationship between price and output in accordance with demandtheory. Brown and Nawas (1973) and Gum and Martin (1974) developed a new form of TCM based onindividual visitors, where the dependant variable, i.e., the quantity consumed, is the number of trips takenper period by individuals or households (ITCM).
The three decades following the issue of Clawson and Knetsch’s (1966) book have been characterized bythe publication of empirical analyses and attempts to develop the methodology further. Walsh, Johnsonand McKean (1992) conducted a survey of published and unpublished empirical studies in the US andfound that 156 benefit estimates had been completed during the period 1968-88. The purpose of theWalsh, Johnson and McKean study was to analyze empirical results in order to develop an understandingof the factors that are most important in predicting recreational use and benefits to the visitor. They alsoidentified additional explanatory variables including site quality, travel time cost, and substitute price.
Ward (1983) and Shaw (1992) concluded that the opportunity cost of an individual’s time was not necessarilyrelated to wage rate and that information on personal situations and preferences was necessary beforeappropriate assumptions could be made. McKean, et al., (1995), building on Shaw’s (1992) work, theorizedthat time-rationing rather than time-pricing may be more appropriate given labor market and institutionalconsiderations.
McConnell (1992) concluded that since accounting for on-site time is so difficult, no systematic methodhas been developed, either conceptually or empirically. Freeman (1993) approached the substitute sitedilemma by suggesting that researchers ask visitors which other single site is visited frequently and includeonly that site’s price as the relevant substitute price. He asserted that the next-best site yielding similarattributes (a national park, in this instance) is the appropriate alternative.
5. Valuing Ecotourism in Developing Countries: An Overview
There is a growing body of literature that focuses on valuing ecotourism and wilderness areas in developingcountries. The primary approaches used in these studies—the travel cost method (TCM) and contingent

SANDEE Working Paper No. 5-04 5
valuation (CV)—were both pioneered in the USA and have only recently been applied in developingcountries. The TC approach assumes that the various factors affecting visitors’ travel costs, includingboth direct costs and the opportunity costs of visitors’ time, influence the length and frequency of a visitto a given destination. The TCM, however, has limitations, particularly in applications to multiple destinationtrips (Pearse, 1968). In addition, assumptions such as the homogeneity of marginal costs and preferencesof visitors from each origin are questionable (Wennergen, 1964). To circumvent such limitations, studiesthat have estimated the use values of protected areas in developing countries have often excludednonresidents (Durojaiye and Ipki, 1988; Tobias and Mendelsohn, 1991). Or if foreign visitors are included,restrictive simplifying assumptions have been imposed (Mungatana and Navrud, 1994). While studiesusing TC have provided useful insights into the value of ecotourism in protected areas in developingcountries, they may have typically focused more on estimating consumer surplus than on evaluating userfees as a guide toward designing improved park pricing strategies, which is the primary objective of thisstudy.
On the contrary, CV relies on surveys containing hypothetical valuation scenarios in order to generatevalues for goods that cannot be priced directly through a market (Cummings, et al., 1986). Thus, CV hasmore flexibility than TC in that a survey can be designed to elicit many different types of values and notjust the use value of a specific area such as a national park. Although CV has been applied to developingcountries less often than TC (Lindberg and Johnson, 1994), there is growing recognition of the importanceof these applications, particularly when results have direct implications for natural resource managementand policy. CV has been used to measure total preservation value, which includes both use and non-usecomponents (Echeverria, Hanrahan and Solorzano, 1995). Use values have been examined through analysesof the explanatory factors influencing WTP for increases in entrance fees and trip costs as well asimprovements in park amenities (Abala, 1987; Baldares and Laarman, 1990; Moran, 1994; Shultz, et al.,1997).
There are a number of environmental valuation studies but only a few have used an economic approach tocalculate welfare measurement1 . The Lumpinee Park study by Grandstaff and Dixon (Grandstaff andDixon, 1986) and TDRI/HIID study on Khao Yai National Park (Kaosa-ard, et al., 1995) are two importantstudies conducted in Thailand that have used economic valuation methods. Both studies have combinedthe travel cost method (TCM) with the open-ended contingent valuation method (CVM) in order to assesswillingness to pay (WTP).
Chase, et al., (1998) studied ecotourism demand and the differential pricing of National Park access inCosta Rica. The study presents a conceptual framework and an empirical analysis of the impacts ofintroducing a differential entrance fee policy at three national parks in Costa Rica. A contingent behaviourmethodology was designed to elicit information on foreign tourists’ hypothetical park visitation behaviourat alternative entrance fee levels. The study also estimated park visitation demand functions and price andincome elasticities. It also discussed revenue maximizing fees and applications of differential pricingprinciples to park management in Costa Rica. The case study by Chase, et al., (1988) therefore makes asignificant contribution to understanding the role that economic analysis can play in the management ofprotected areas.
Grandstaff and Dixon (1986) used the zonal TCM and found the consumer surplus of Lumpinee Park usevalue to be 132 million baht. However, the CVM found this value to be in the region of 130 million baht.
1 For further details about environmental valuation methods, see Bateman and Willis (1999) and Freeman (1993).

6 SANDEE Working Paper No. 5-04
Kaosa-ard, et al., (1995) used TCM to measure the Khao Yai National Park use value and the CVMmethod to measure its nonuse value. The TCM estimates showed a direct benefit of 1,420 baht per visit,of which 870 baht is the consumer surplus. The average WTP for entrance fee is 22 baht per person. Theaverage WTP after some improvements was 44 baht per person. The average nonuse value for Thais was730 baht per person per year. The average nonuse value for non-Thais is 183 baht per person per year.These findings indicated that the value of Khao Yai National Park was certainly positive and was ofreasonable magnitude. After some improvements, the WTP for each park visit increases from 22 to 44baht per person, which suggests some positive marginal benefits from park improvements. When comparedto the marginal cost, the increase in WTP indicates that park improvements would yield a net gain tosociety.
This review of relevant studies2 shows that even though some studies (Grandstaff and Dixon, 1986 andKaosa-ard, et. al., 1995) have carefully measured environmental benefits, they focus on a single park anddo not include park substitutability in their analysis. Only one study undertaken in Thailand (e.g., Isangkura,1998) was based on a multi-park system. Studies conducted in other developing countries, though somewhatbetter, suffered from methodological limitations of one sort or another. No such study has ever beenconducted in Pakistan. The present study, which studies the valuation of MHN Park, Islamabad, willtherefore be the first of its kind in Pakistan and could be considered a pioneering work in park valuation inthis country.
6. Research Methods
This study employs TCM to assess the benefits associated with recreation in a specific park, the MargallaHills National Park. The TCM is basically an extension of conventional household production function(HPF) models that treat the household as maximizing utility based on numerous consumption and productiondecisions. The TCM enables an assessment of individual preferences for the consumption of non-marketgoods. It uses the cost of travelling to a non-priced recreation site in order to infer recreational benefitsprovided by the site. TCM studies have consistently shown that as the price of access (cost of travel)increases, the visit rate to the site falls. The TCM is usually estimated as a trip generating function wherethe visit rate depends upon the cost of travel to the site, travel costs to substitute sites, and other socio-economic characteristics of the visitors (Garrod and Willis, 1999).
There are two approaches to TCM, the zonal total cost method (ZTCM) and the individual travel costmethod (ITCM). Since the MHN Park is an urban park that is located very close to the twin cities ofIslamabad and Rawalpindi, and a majority of visitors are from nearby areas, we use the ITCM. The ITCMhas a distinct advantage over the ZTCM in that it takes into account the inherent variation in the data,rather than relying on zonal aggregate data. For a more practical travel perspective, the ITCM has theadvantage that its trip generating function can be estimated using a smaller number of observations thanthe ZTCM (Garrod and Willis, 1999). However, the former requires more information about individualvisitors and is reliant on an expensive questionnaire survey being undertaken to elicit visitor characteristics,preferences, and behaviour. Nevertheless, the ITCM is generally more flexible and applicable at a widerrange of sites than ZTCM.
2 Although there are a large number of relevant studies conducted in developing countries, including Sri Lanka, Bangladesh,India, etc., the literature review in the present study is only a sub-set of all such studies on valuation.
SANDEE Working Paper No. 5-04 7
6.1 Theoretical Framework
In order to model the travel cost function, we follow Freeman (1993) and assume that the individual’sutility depends on the total time spent at the site (the MHN Park, in this instance), the quality of the park,and the quantity of the numeraire. With the duration of the visit fixed for simplicity, the time on site can berepresented by the number of visits. The individual solves the following utility maximizing problem:3
Max: U (X, r, q) . . . . . . . . . . . . . . . . . . . . . . . . . . . . . . . . . . . . . . (1)
Subject to the twin constraints of monetary and time budgets:
M + pw . tw = X + c.r . . . . . . . . . . . . . . . . . . . . . . . . . . . . . . . . . . (2)t* = tw + (t1 + t2 )r . . . . . . . . . . . . . . . . . . . . . . . . . . . . . . . . . . . . . (3)
Where X = the quantity of numeraire whose price is one,r = number of visits to the MHN Park,q = environmental quality at the site,M = exogenous income,pw = wage rate,c = monetary cost of a trip,t* = total discretionary time,tw = hours worked,t1 = round-trip travel time, andt2 = time spent on site.
It is assumed that r and q are (weak) complements in the utility function, implying that the number ofvisits will be an increasing function of the site’s environmental quality. The time constraint reflects thefact that both travel to the site and time spent on the site take time away from other activities. Thus thereis an opportunity cost to the time spent in the recreation activity. We also assume that the individual is freeto choose the amount of time spent at work and that work does not convey utility (or disutility) directly.Thus the opportunity cost of time is the wage rate. Finally, we also assume that the monetary cost of a tripto the site has two components: the entry fee f, which could be zero, and the monetary cost of travel. Thiscost of travel is pd .d, where pd is the per-kilometer cost of travel and d is the distance to the site and returnfrom it.
Substituting equation (3) into (2) yields:
M + pw . t* = X + pr . r . . . . . . . . . . . . . . . . . . . . . . . . . . . . . . . . . (4)
Where pr is the full price of a visit, which is the sum of entry fee (f, which could be zero), pd is the per/kmcost of travel and d is the distance in km as shown in equation 5.
pr = c + pw (t1 + t2) = f + pd . d + pw (t1 + t2) . . . . . . . . . . . . . . . . . . . . . . . . . . . . . . . (5)
As equation (5) makes clear, the full price of a visit consists of four components: the entry fee, the monetarycost of travel to the site, the time cost of travel to the site, and the cost of time spent at the site. On the
3 This section draws heavily on Freeman (1993), and Ward and Beal (2000).
8 SANDEE Working Paper No. 5-04
assumption that individuals are free to choose the number of hours worked at a given wage rate, the twotime costs are valued at the wage rate.
Maximizing equation (1) subject to the constraint of equation (4) will yield the individual’s demandfunctions for visits:
r = r (pr, M, q) . . . . . . . . . . . . . . . . . . . . . . . . . . . . . . . . . . . . . . (6)
The data on rates of visitation, travel costs, and variation in entry fees (if any) can be used to estimate thecoefficient on pr in a travel cost-visitation function. Because of the linearity of equation (5), the coefficienton pr can be used to derive the individual’s demand for visits to a site as a function of the entry fee.
We further assume that there are substitute sites available. In such cases, the interactions and the substitutioneffects among sites must be modeled explicitly. This calls for some form of multi-site model. Multi-sitemodels are estimated as systems of demand equations. For each site j (j = 1,…,j,…,m), a demand equationof the following form is specified:
rji = rj( prji , (prki , Mi , qi ) . . . . . . . . . . . . . . . . . . . . . . . . . . . . . . . (7)(i = (i = 1,…i,….., s), (k = 1,….., k,…., m), and k ≠ j
Where rji is the number of visits individual i makes to the jth site, prji is the full price of a visit by i to j, andprki is the set of substitute prices for visits to other sites. This type of model can be estimated from data onindividual observations (see, for example, Freeman 1993 and McConnell, 1985).
6.2 Factors that Determine Recreational Demand
Because we use ITCM, in our model, the number of trips per period made to MHN Park by each individualis denoted by r. Various independent variables are used to explain variation in the dependent variable r.Both economic theory and the considerable experience of recreation managers have shown that demographicand other independent variables influence recreation visitation. Apart from demographic variables, themost important variables include travel cost, travel time, substitute sites, and site quality and congestion.
Demographic variables such as age, sex, education, income, employment status, rural versus urban residenceand family size affect recreational demand. Intuitively, age would appear to be an important determinantof demand for park visitation and is expected to be inversely related. That is, as age increases, participationdecreases. Sex may be another determinant. We expect that men would be more likely to participate thanwomen. With regard to education, people with higher education, it could be said, appreciate outdoornature-based activities more than people with less formal education. Household income has also, generally,been found to have a positive correlation with participation in many outdoor recreation activities. Weexpect that the higher the household income, the higher the number of park visitations. Urban dwellers arelikely to participate more than people from rural areas. Similarly, a better-quality park may attract anindividual more often than a degraded-quality park.
The relationship between travel cost and park visitation may be negative. On the question of what costsshould be included under travel costs, some researchers have inquired closely into the costs of fuel, oil,tires, repairs and maintenance of vehicles in order to estimate appropriate travel costs. Seller, et al., (1985)used the cost of fuel, accommodation and food costs. Beal (1995) also found that a majority of respondents

SANDEE Working Paper No. 5-04 9
considered fuel, food, and accommodation costs as relevant to their trip decision. Regarding the value ofon-site time, McConnel (1992) argued that the opportunity cost of on-site time should be included in theprice variable. McConnel, however, concluded that accounting for on-site time is so difficult that nosystematic method has been developed, either conceptually or empirically.
Smith, et al., (1983) suggested that cost would be some proportion k of each individual’s wage rate.Numerous attempts have been made to value travel time. It should be noted though that despite the factthat the issue of valuing travel time has been addressed in several studies, there seems to be no consensuson a consistent procedure yet (Nillesen, 2002). Cesario (1976) argued that it seems more reasonable thata trade-off is made between time for travel and leisure activities rather than between work and travel time.He reviewed a number of empirical studies of commuting and found that the value of time varied betweenone quarter and one half of the wage rate. Like Freeman (1993), full wage was used to value time in thisstudy. If time costs are ignored, demand will be biased. The effects of both time costs and transportationcosts on the demand for recreation need to be estimated separately. However, since the two may be highlycorrelated and a separate estimation too difficult to carry out, time costs was given a monetary value andadded to the transportation costs. In our paper, travel costs include all monetary costs of travel to MHNPark as well as time cost. The time spent in traveling to the site and time spent on the site were valued atthe prevailing wage rate and were added to the monetary cost of travel, including the cost of fuel (in casethe visitor was using his own car) or the fare of public transportation, meals, accommodation, etc.
Prices of substitute sites also affect recreational demand for MHN Park. Some visitors may believe thateach national park is unique and has no substitute. Conversely, some people use other forms of outdoorrecreation (like going to a movie) as substitutes for nature-based recreation in national parks. Freeman(1993) approached the substitute site dilemma by suggesting that researchers ask visitors which othersingle site is visited frequently and include only that site’s price as the relevant substitute price. He assertedthat a next-best site yielding similar characteristics and services (a national park, in this instance) is theappropriate alternative. We have followed this approach in our study. The possible inclusion of substituteprices stems from the demand theory that states that the demand for a good is dependent on its own price,prices and qualities of substitutes, and other factors. Hence the demand for the environmental good shouldinclude the prices of substitute goods. As mentioned earlier, Freeman (1993) suggested that researchersask visitors which other single site is visited frequently and include only that site’s price as the relevantsubstitute price. He asserted that a next-best site yielding similar services (a national park, in this instance)is the appropriate alternative. Ayubia National Park4 in Galliat was identified as the closest substitute sitefor the MHN Park. It is located about 40 miles from MHNP.
Site quality may also affect park visitation. The higher the site quality perceived by visitors, the higher theconsumer benefit. There may also be the issue of multi-purpose-or-destination trips. People often visitseveral sites within one trip. The problem that arises then is how to allocate the total travel costs amongthese multiple destinations. Loomis and Walsh (1977) suggested two options. First, one can drop
4 Ayubia National Park is located North of Murree in the Himalayan Range Mountains. Ayubia, consisting of four hill stations,namely, Khaira Gali, Changla Gali, Khanspur and Gora Dhaka, is spread over an area of 26 kilometers. These hill stations havebeen developed into a hill resort known as Ayubia. The chairlifts provided at this place are a matter of great attraction. It is animportant place from the viewpoint of wild life, nature, ecotourism, and education. This park provides refuge to the elusiveleopard and the black bear. Bird-watching is excellent here. There are steep precipices and cliffs on one side and on the otherare tall pine trees. Wild animals are also found in the thick forests around. Mammals in the park include Asiatic leopard, Blackbear, Yellow throated marten, Kashmir hill fox, Red Flying squirrel, Himalayan palm civet, masked civet and Rhesus Macaque.Birds in the park are Golden eagle, Griffin vulture, Honey buzzard, Peregrine falcon, Kestrel, Indian sparrow hawk, Hillpigeon, Spotted dove and Collared dove.
10 SANDEE Working Paper No. 5-04
observations from multiple destination trips and estimate demand with just the single destination users and computea per-visit consumer surplus figure based on these functions. This average visitor consumer surplus can then beaggregated across all visitors to estimate total consumer surplus. Alternatively, one could ask visitors what proportionof the cost of the trip should be attributed to each destination. To provide for this, a multi-purpose question wasasked and some crude allocation of costs was used to estimate travel costs.
Visiting a site may be part of a round trip involving visits to other locations. Only a portion of the travel cost thenrelates to the recreational site in question. Since there was only one substitute site located nearby, multiple siteswere not a serious problem in the present study. However, we did put the question about multiple sites to therespondents and travel costs were calculated accordingly.
6.3 Sample Size, Sampling and Data Collection Methods
Sampling is a critical issue for travel cost studies. While some scholars prefer stratified sampling from the totalpopulation (Choe, et al., 1996; Hanker, et al., 1997), others use random sampling from user groups only (Farber,1988; Yaping, 1998). In our study, we concentrated on the user group for a number of reasons. Individualvisitors instead of households were chosen as respondents for interviews. “Visitors” were broadly defined asthose who use the MHN Park for recreation.
In order to estimate the total universe (U) of visitors, a daily head count method was used at various entry pointsto the park on weekends and weekdays for one and a half months during the four seasons of data collection. Ahead count survey was undertaken at various entry points of the MHN Park for about 45 days in the four seasonsof the year 2002-03. The average number of visitors was 200 and 350 on weekdays and weekends respectively.Thus, the total population was approximated as 100,400 visitors per year based on a daily average of 275.Although secondary information is not available on the total number of annual visitors, we had discussions regardingthe approximate population of visitors with various officials of the Environment Directorate of the CapitalDevelopment Authority, Islamabad. It was inferred from these discussions that the daily average of visitors rangedbetween 240 and 320, which was nearly the same as our head count average.
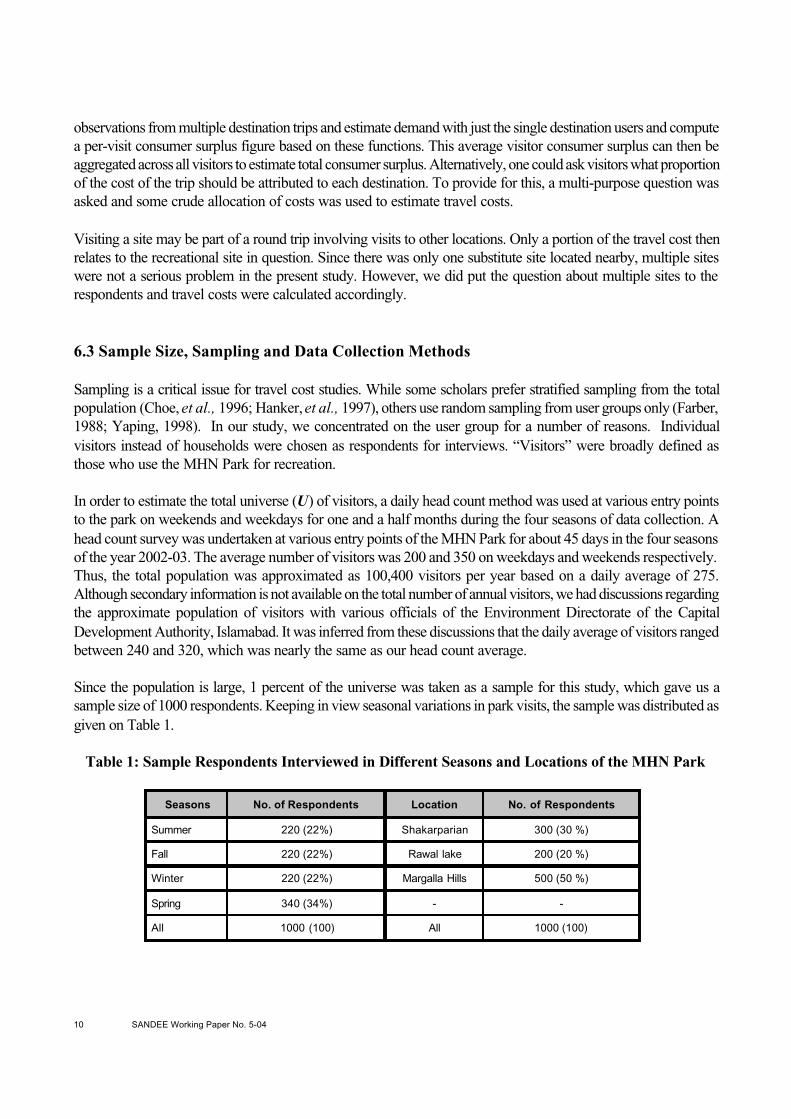
Since the population is large, 1 percent of the universe was taken as a sample for this study, which gave us asample size of 1000 respondents. Keeping in view seasonal variations in park visits, the sample was distributed asgiven on Table 1.
Table 1: Sample Respondents Interviewed in Different Seasons and Locations of the MHN Park
Seasons No. of Respondents Location No. of Respondents
Summer 220 (22%) Shakarparian 300 (30 %)
Fall 220 (22%) Rawal lake 200 (20 %)
Winter 220 (22%) Margalla Hills 500 (50 %)
Spring 340 (34%) - -
All 1000 (100) All 1000 (100)

SANDEE Working Paper No. 5-04 11
Regarding sampling, Schaeffer, et al., (1996) suggests that “[a] systematic sample is generally spread moreuniformly over the entire population and thus may provide more information about the population than any amountof data contained in a simple random sample.” This study used systematic random sampling where every 10th
visitor was interviewed. In case he/she refused, another visitor was interviewed. The sampling was arranged toreflect changes in seasonal uses of the park (34 percent in spring, and 22 percent in summer, autumn and winterrespectively) as it is believed that visitors come to MHN Park for recreation more in spring than in any otherseason. The data were collected by the Principal Investigator, Research officer and two investigators (one maleand one female).
6.4 Econometric Models
Economic theory does not suggest any particular functional form for TCMs. The most common practice is tostatistically test various functional forms such as:
(1) Linear r = α+βP(2) Log-linear log r = α+βP(3) Double-log log r = α+log βP(4) Negative exponential r = α+ logβ P
The estimated consumer surplus for an individual making rvisits to the site in case of a linear form is given by CS= -r2 /2β . The linear functional form implies finite visits at zero cost and has a critical cost above which the modelpredicts negative visits. The consumer surplus in case of the log-linear functional form is given by CS= -r/2β . Itimplies a finite number of visits at a zero cost and never predicts negative visits, even at a very high cost (Garrodand Willis, 1999). Having tried various functional forms, it was decided that the linear functional form was thebest fit for our data. Therefore, only linear regression results were reported.
The basic model used in this study depicts the number of visits to MHN Park as a function of factors such as thetravel cost, time spent in traveling, substitute sites, income, education, age, sex, rural versus urban residence,family size, site quality, employment status, etc. Thus, the model may be specified as follows:
ri = ß0 + ß1 travel cost + ß2 household income + ß3 travel cost (substitute site) + ß4 age ofvisitor + ß5 visitor’s highest level of education + ß6 household size + ß7 D1 (sex dummy)+ ß8 D2 (residence dummy) + ß9 D3 (park quality dummy) + ei . . . . . . . . . . . . . . . . (eq. 8)
Where ri , the dependent variable, stands for the number of visits by the ith individual to MHN Park per period oftime, travel cost means round trip total cost from an individual’s residence to and from the site and includes theopportunity cost of travel time and stay at park. Travel cost to substitute site means travel cost to and from aresidence to a substitute site including travel time costs. D1 = 1 if male and 0 otherwise, D2 = 1 if urban dwellerand 0 otherwise, D3 = 1 if the visitor’s perception about the site’s recreational facilities is good and 0 if bad. Table2 summarizes explanatory variables and hypotheses.
12 SANDEE Working Paper No. 5-04
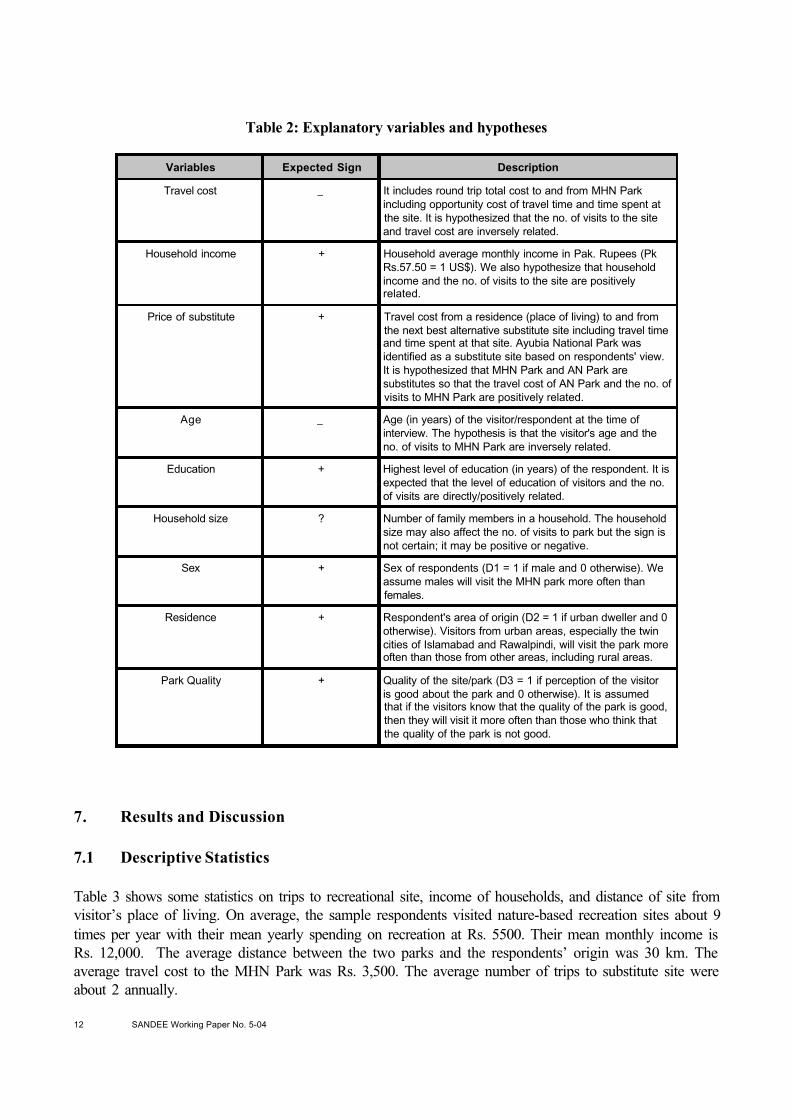
Table 2: Explanatory variables and hypotheses
7. Results and Discussion
7.1 Descriptive Statistics
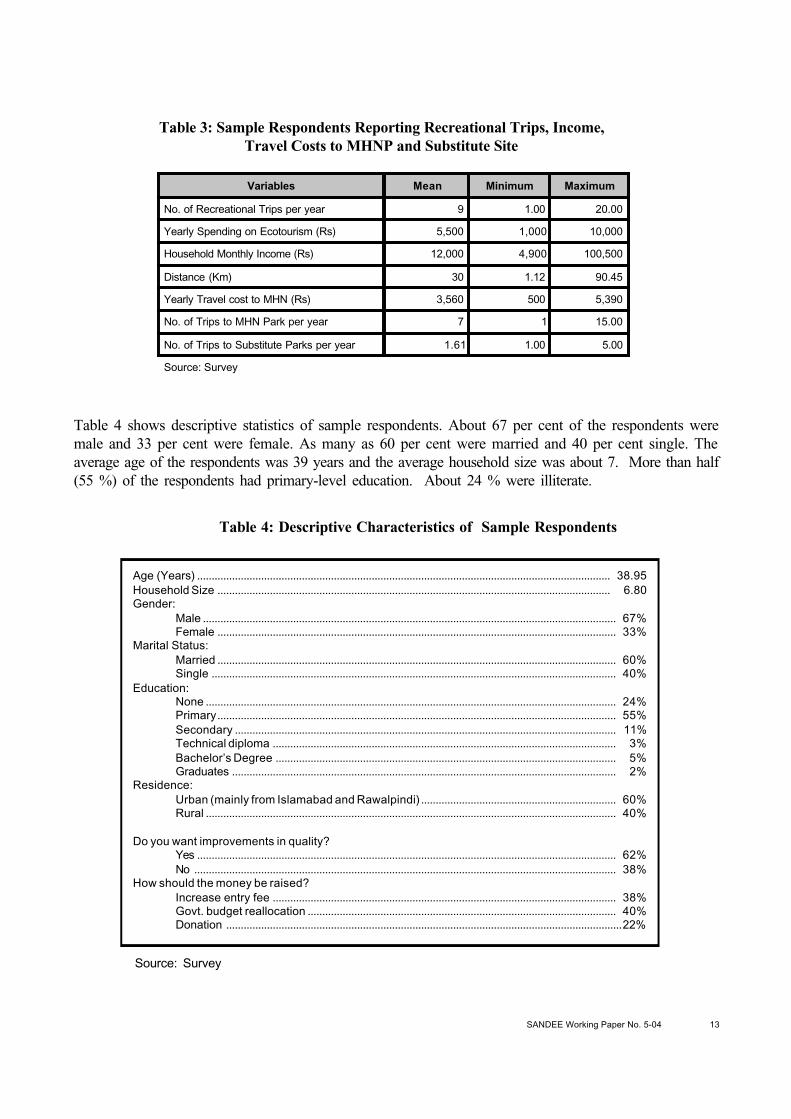
Table 3 shows some statistics on trips to recreational site, income of households, and distance of site fromvisitor’s place of living. On average, the sample respondents visited nature-based recreation sites about 9times per year with their mean yearly spending on recreation at Rs. 5500. Their mean monthly income isRs. 12,000. The average distance between the two parks and the respondents’ origin was 30 km. Theaverage travel cost to the MHN Park was Rs. 3,500. The average number of trips to substitute site wereabout 2 annually.
Variables Expected Sign Description
Travel cost _ It includes round trip total cost to and from MHN Parkincluding opportunity cost of travel time and time spent atthe site. It is hypothesized that the no. of visits to the siteand travel cost are inversely related.
Household income + Household average monthly income in Pak. Rupees (PkRs.57.50 = 1 US$). We also hypothesize that householdincome and the no. of visits to the site are positivelyrelated.
Price of substitute + Travel cost from a residence (place of living) to and fromthe next best alternative substitute site including travel timeand time spent at that site. Ayubia National Park wasidentified as a substitute site based on respondents' view.It is hypothesized that MHN Park and AN Park aresubstitutes so that the travel cost of AN Park and the no. ofvisits to MHN Park are positively related.
Age _ Age (in years) of the visitor/respondent at the time ofinterview. The hypothesis is that the visitor's age and theno. of visits to MHN Park are inversely related.
Education + Highest level of education (in years) of the respondent. It isexpected that the level of education of visitors and the no.of visits are directly/positively related.
Household size ? Number of family members in a household. The householdsize may also affect the no. of visits to park but the sign isnot certain; it may be positive or negative.
Sex + Sex of respondents (D1 = 1 if male and 0 otherwise). Weassume males will visit the MHN park more often thanfemales.
Residence + Respondent's area of origin (D2 = 1 if urban dweller and 0otherwise). Visitors from urban areas, especially the twincities of Islamabad and Rawalpindi, will visit the park moreoften than those from other areas, including rural areas.
Park Quality + Quality of the site/park (D3 = 1 if perception of the visitoris good about the park and 0 otherwise). It is assumedthat if the visitors know that the quality of the park is good,then they will visit it more often than those who think thatthe quality of the park is not good.
SANDEE Working Paper No. 5-04 13
Table 3: Sample Respondents Reporting Recreational Trips, Income,Travel Costs to MHNP and Substitute Site
Table 4 shows descriptive statistics of sample respondents. About 67 per cent of the respondents weremale and 33 per cent were female. As many as 60 per cent were married and 40 per cent single. Theaverage age of the respondents was 39 years and the average household size was about 7. More than half(55 %) of the respondents had primary-level education. About 24 % were illiterate.
Table 4: Descriptive Characteristics of Sample Respondents
Variables Mean Minimum Maximum
No. of Recreational Trips per year 9 1.00 20.00
Yearly Spending on Ecotourism (Rs) 5,500 1,000 10,000
Household Monthly Income (Rs) 12,000 4,900 100,500
Distance (Km) 30 1.12 90.45
Yearly Travel cost to MHN (Rs) 3,560 500 5,390
No. of Trips to MHN Park per year 7 1 15.00
No. of Trips to Substitute Parks per year 1.61 1.00 5.00
Source: Survey
Age (Years) .............................................................................................................................................. 38.95Household Size ....................................................................................................................................... 6.80Gender:
Male .............................................................................................................................................. 67%Female ......................................................................................................................................... 33%
Marital Status:Married ......................................................................................................................................... 60%Single ........................................................................................................................................... 40%
Education:None ............................................................................................................................................. 24%Primary......................................................................................................................................... 55%Secondary ................................................................................................................................... 11%Technical diploma ...................................................................................................................... 3%Bachelor’s Degree ..................................................................................................................... 5%Graduates .................................................................................................................................... 2%
Residence:Urban (mainly from Islamabad and Rawalpindi) ................................................................... 60%Rural ............................................................................................................................................. 40%
Do you want improvements in quality?Yes ................................................................................................................................................ 62%No ................................................................................................................................................. 38%
How should the money be raised?Increase entry fee ...................................................................................................................... 38%Govt. budget reallocation .......................................................................................................... 40%Donation ........................................................................................................................................22%
Source: Survey
14 SANDEE Working Paper No. 5-04
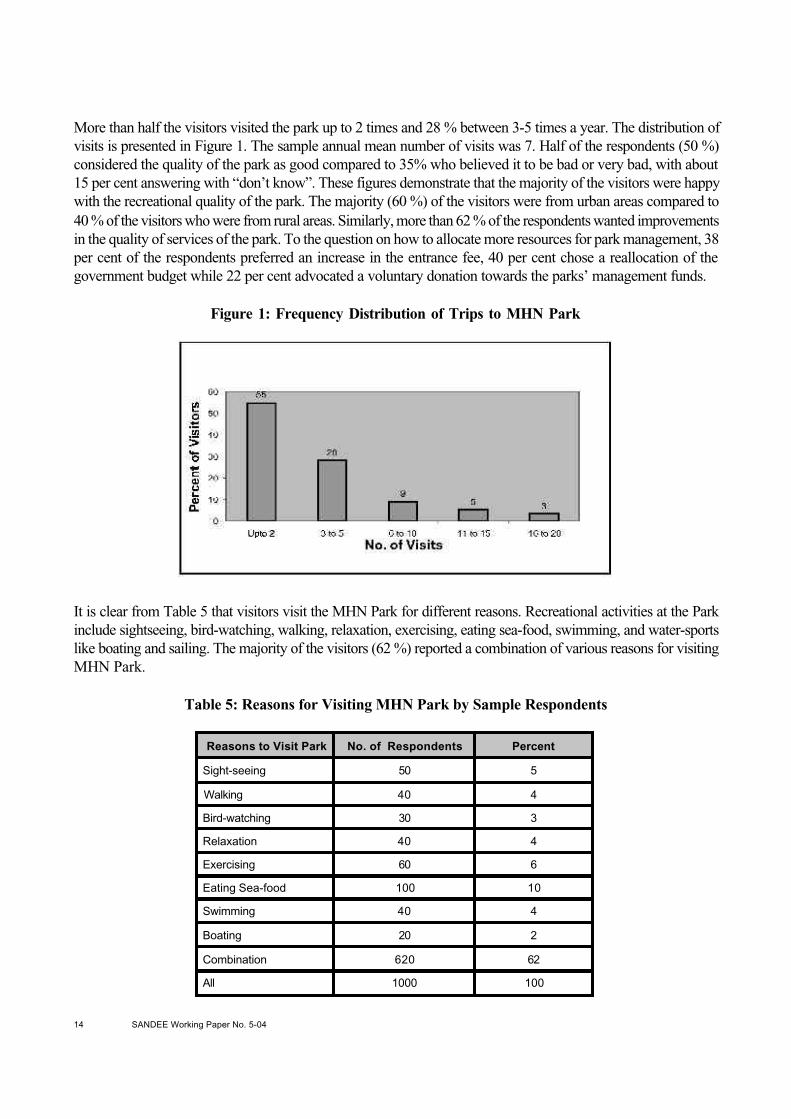
More than half the visitors visited the park up to 2 times and 28 % between 3-5 times a year. The distribution ofvisits is presented in Figure 1. The sample annual mean number of visits was 7. Half of the respondents (50 %)considered the quality of the park as good compared to 35% who believed it to be bad or very bad, with about15 per cent answering with “don’t know”. These figures demonstrate that the majority of the visitors were happywith the recreational quality of the park. The majority (60 %) of the visitors were from urban areas compared to40 % of the visitors who were from rural areas. Similarly, more than 62 % of the respondents wanted improvementsin the quality of services of the park. To the question on how to allocate more resources for park management, 38per cent of the respondents preferred an increase in the entrance fee, 40 per cent chose a reallocation of thegovernment budget while 22 per cent advocated a voluntary donation towards the parks’ management funds.
Figure 1: Frequency Distribution of Trips to MHN Park
It is clear from Table 5 that visitors visit the MHN Park for different reasons. Recreational activities at the Parkinclude sightseeing, bird-watching, walking, relaxation, exercising, eating sea-food, swimming, and water-sportslike boating and sailing. The majority of the visitors (62 %) reported a combination of various reasons for visitingMHN Park.
Table 5: Reasons for Visiting MHN Park by Sample Respondents
Reasons to Visit Park No. of Respondents Percent
Sight-seeing 50 5
Walking 40 4
Bird-watching 30 3
Relaxation 40 4
Exercising 60 6
Eating Sea-food 100 10
Swimming 40 4
Boating 20 2
Combination 620 62
All 1000 100
SANDEE Working Paper No. 5-04 15
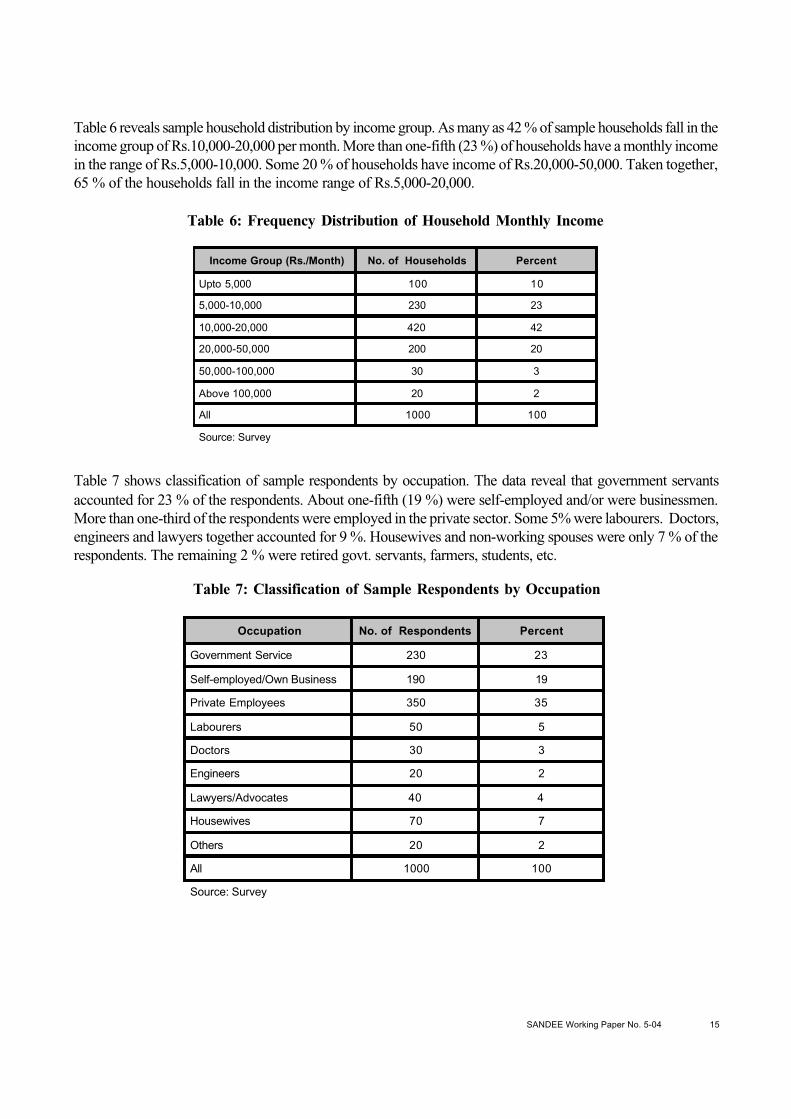
Table 6 reveals sample household distribution by income group. As many as 42 % of sample households fall in theincome group of Rs.10,000-20,000 per month. More than one-fifth (23 %) of households have a monthly incomein the range of Rs.5,000-10,000. Some 20 % of households have income of Rs.20,000-50,000. Taken together,65 % of the households fall in the income range of Rs.5,000-20,000.
Table 6: Frequency Distribution of Household Monthly Income
Table 7 shows classification of sample respondents by occupation. The data reveal that government servantsaccounted for 23 % of the respondents. About one-fifth (19 %) were self-employed and/or were businessmen.More than one-third of the respondents were employed in the private sector. Some 5% were labourers. Doctors,engineers and lawyers together accounted for 9 %. Housewives and non-working spouses were only 7 % of therespondents. The remaining 2 % were retired govt. servants, farmers, students, etc.
Table 7: Classification of Sample Respondents by Occupation
Income Group (Rs./Month) No. of Households Percent
Upto 5,000 100 10
5,000-10,000 230 23
10,000-20,000 420 42
20,000-50,000 200 20
50,000-100,000 30 3
Above 100,000 20 2
All 1000 100
Source: Survey
Occupation No. of Respondents Percent
Government Service 230 23
Self-employed/Own Business 190 19
Private Employees 350 35
Labourers 50 5
Doctors 30 3
Engineers 20 2
Lawyers/Advocates 40 4
Housewives 70 7
Others 20 2
All 1000 100
Source: Survey
16 SANDEE Working Paper No. 5-04
7.2 Empirical Results
7.2.1 Test Statistics
The variables were included according to the logic of an underlying economic theory. First, the variableswere tested for correlation. According to Loomis and Walsh (1997), an absolute value of 0.8 indicates thepossibility of multicollinearity. The correlation matrix displayed in Appendix 4 however shows nocorrelation higher than 0.47, which indicates that multicollinearity is not a problem with our data set. Allvariables could thus initially be included in the analysis.
7.3 Estimation of Benefits Based on the Individual Cost Travel Method
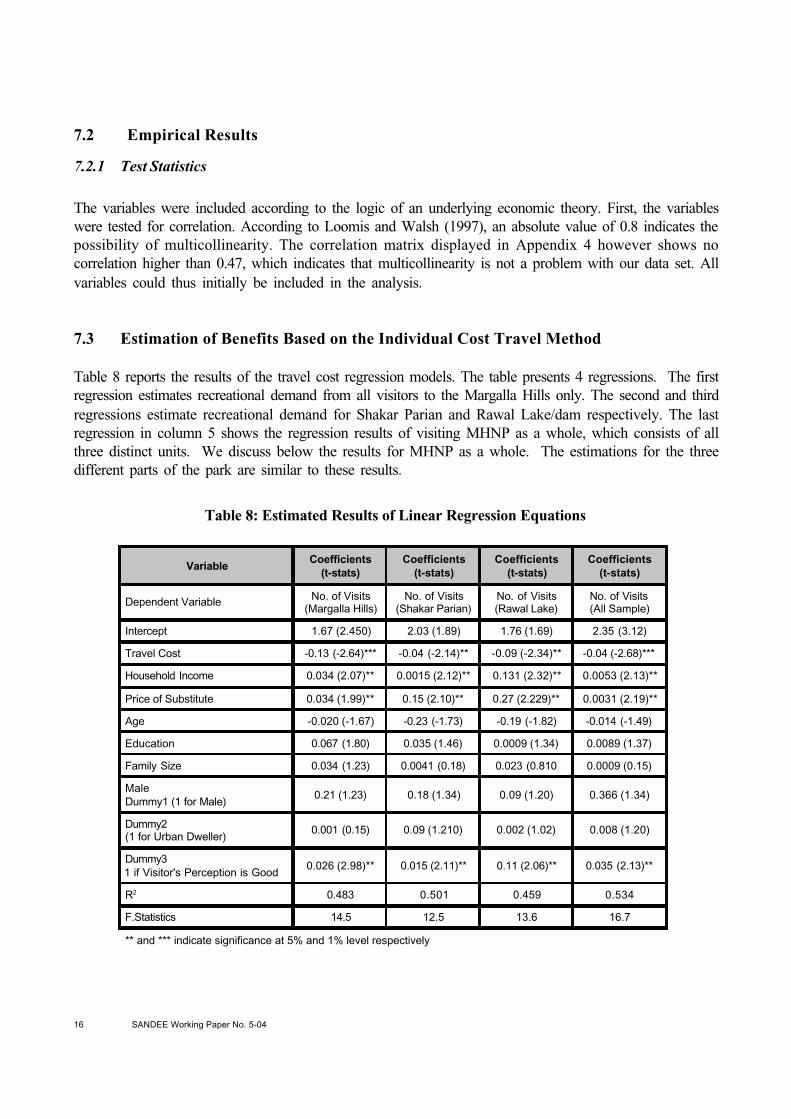
Table 8 reports the results of the travel cost regression models. The table presents 4 regressions. The firstregression estimates recreational demand from all visitors to the Margalla Hills only. The second and thirdregressions estimate recreational demand for Shakar Parian and Rawal Lake/dam respectively. The lastregression in column 5 shows the regression results of visiting MHNP as a whole, which consists of allthree distinct units. We discuss below the results for MHNP as a whole. The estimations for the threedifferent parts of the park are similar to these results.
Table 8: Estimated Results of Linear Regression Equations
VariableCoefficients
(t-stats)Coefficients
(t-stats)Coefficients
(t-stats)Coefficients
(t-stats)
Dependent Variable No. of Visits(Margalla Hills)
No. of Visits(Shakar Parian)
No. of Visits(Rawal Lake)
No. of Visits(All Sample)
Intercept 1.67 (2.450) 2.03 (1.89) 1.76 (1.69) 2.35 (3.12)
Travel Cost -0.13 (-2.64)*** -0.04 (-2.14)** -0.09 (-2.34)** -0.04 (-2.68)***
Household Income 0.034 (2.07)** 0.0015 (2.12)** 0.131 (2.32)** 0.0053 (2.13)**
Price of Substitute 0.034 (1.99)** 0.15 (2.10)** 0.27 (2.229)** 0.0031 (2.19)**
Age -0.020 (-1.67) -0.23 (-1.73) -0.19 (-1.82) -0.014 (-1.49)
Education 0.067 (1.80) 0.035 (1.46) 0.0009 (1.34) 0.0089 (1.37)
Family Size 0.034 (1.23) 0.0041 (0.18) 0.023 (0.810 0.0009 (0.15)
MaleDummy1 (1 for Male)
0.21 (1.23) 0.18 (1.34) 0.09 (1.20) 0.366 (1.34)
Dummy2(1 for Urban Dweller)
0.001 (0.15) 0.09 (1.210) 0.002 (1.02) 0.008 (1.20)
Dummy31 if Visitor's Perception is Good
0.026 (2.98)** 0.015 (2.11)** 0.11 (2.06)** 0.035 (2.13)**
R2 0.483 0.501 0.459 0.534
F.Statistics 14.5 12.5 13.6 16.7
** and *** indicate significance at 5% and 1% level respectively
SANDEE Working Paper No. 5-04 17
As expected, high travel costs incurred by individuals are inversely related to park visitation rates. This impliesthat the higher the travel cost paid by visitors to reach MHN Park, the less frequently they visit. We may thus inferthat there is less demand to visit the park from those visitors who live far from it compared to those who live closeto the park. In addition to travel cost, household income has a positive impact on recreational demand. Visitorswith high income are willing to pay more visits to the park. This implies that if the income level of visitors increasesso would the recreational demand. There is also a significant relationship between the cost of the substitute siteand the demand for MHN Park. This is in line with the economic demand theory that the demand for a site willincrease if the prices of substitute sites increase. The education of visitors bears a positive sign while the agevariable has a negative algebraic sign. But both these variables have insignificant coefficients.
The dummy variables for male, urban dweller, and good perception of visitors about the environmental quality ofthe park have positive coefficients. However, only the latter dummy has a statistically significant coefficient. Thisimplies that if the quality of services of the MHN Park were improved, visitor would like to pay more visits to thepark. We have also explored the possibility of whether the demand curve for MHN Park will shift upward to theright if its quality is improved. This is shown in Figure 2.
Most of the coefficients have the expected signs. As the R-square shows, about 50% of the total variation in thedependent variable is the explained variation. This is a reasonable R-square for cross-sectional data.
7.4 The impact of quality improvements on recreational demand
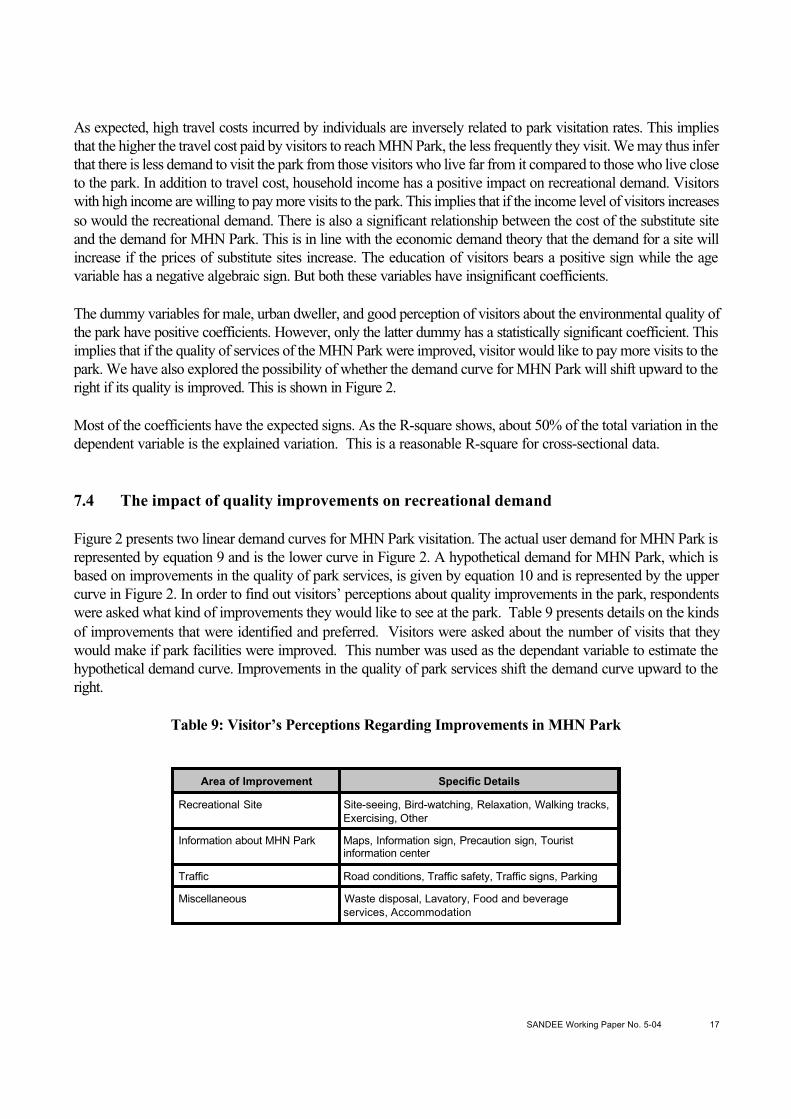
Figure 2 presents two linear demand curves for MHN Park visitation. The actual user demand for MHN Park isrepresented by equation 9 and is the lower curve in Figure 2. A hypothetical demand for MHN Park, which isbased on improvements in the quality of park services, is given by equation 10 and is represented by the uppercurve in Figure 2. In order to find out visitors’ perceptions about quality improvements in the park, respondentswere asked what kind of improvements they would like to see at the park. Table 9 presents details on the kindsof improvements that were identified and preferred. Visitors were asked about the number of visits that theywould make if park facilities were improved. This number was used as the dependant variable to estimate thehypothetical demand curve. Improvements in the quality of park services shift the demand curve upward to theright.
Table 9: Visitor’s Perceptions Regarding Improvements in MHN Park
Area of Improvement Specific Details
Recreational Site Site-seeing, Bird-watching, Relaxation, Walking tracks,Exercising, Other
Information about MHN Park Maps, Information sign, Precaution sign, Touristinformation center
Traffic Road conditions, Traffic safety, Traffic signs, Parking
Miscellaneous Waste disposal, Lavatory, Food and beverageservices, Accommodation

18 SANDEE Working Paper No. 5-04
ri = 38.16 – 0.011 tc (R2=0. 6813) . . . . . . . . . . . . . . . . . . . . . ( 9) ri = 47.39 –0.0129 tc (R2=0.5786) . . . . . . . . . . . . . . . . . . . . (10)
Figure 2: Park Visitation Demand Curves
7.5 Recreational Value of MHN Park
Table 10 shows consumer surplus and total recreational value of the MHN Park for the year 2002-03. The totalrecreational value equals the consumer surplus plus total cost of the visit.
Table 10: Recreational Value of the MHN Park in 2002-03
The annual monetary recreational value of the MHN Park is about Rs. 200 million (approximately US$ 3.47million). This is the value that the park yields every year for the economy. However, this is not the revenue of thepark. This value is divided into consumer surplus of the visitors and total travel cost of the visitors. The total travelcosts include the opportunity costs of time as well as payments by visitors to transportation companies andservice providers such as hotels, restaurants, tourist agencies, etc. Total recreational value was also projected inthe new (quality improved) scenario, which amounted to Rs. 209 million (US$ 3.63 million).
Consumer Surplus Recreational Value
Actual New Scenario Actual New Scenario
Per Visitor (Rs.) 231.0 319.0 1994.0 2081.4
Total (Rs.million) 23.2 32.01 200.1 208.9
Source: Survey
SANDEE Working Paper No. 5-04 19
The total actual consumer surplus was estimated to be Rs 23.3 million (US$ 0.4 million). This shows the value ofthe benefit that visitors gain by visiting the MHN Park. This is a significant amount since it could be seen as 8% ofthe total budget allocation for the environment sector in the country. The overall allocation for the environmentsector in the Federal Development Plan is Pak. Rs. 287 million or US$ 4.99 million (Govt. of Pakistan, 2000-01). The surplus also indicates the amount that the visitors are willing to pay to enjoy the park’s environmentalresources such as air, water, fish, birds, animals and, in general, scenic beauty. This figure, however, does notshow the non-use value of the MHN Park. The annual consumer surplus, in the case of an improved MHN Park,was projected at Rs. 32.01 million (or US$ 0.55 million).
7.6 Simulation of Entrance Fee
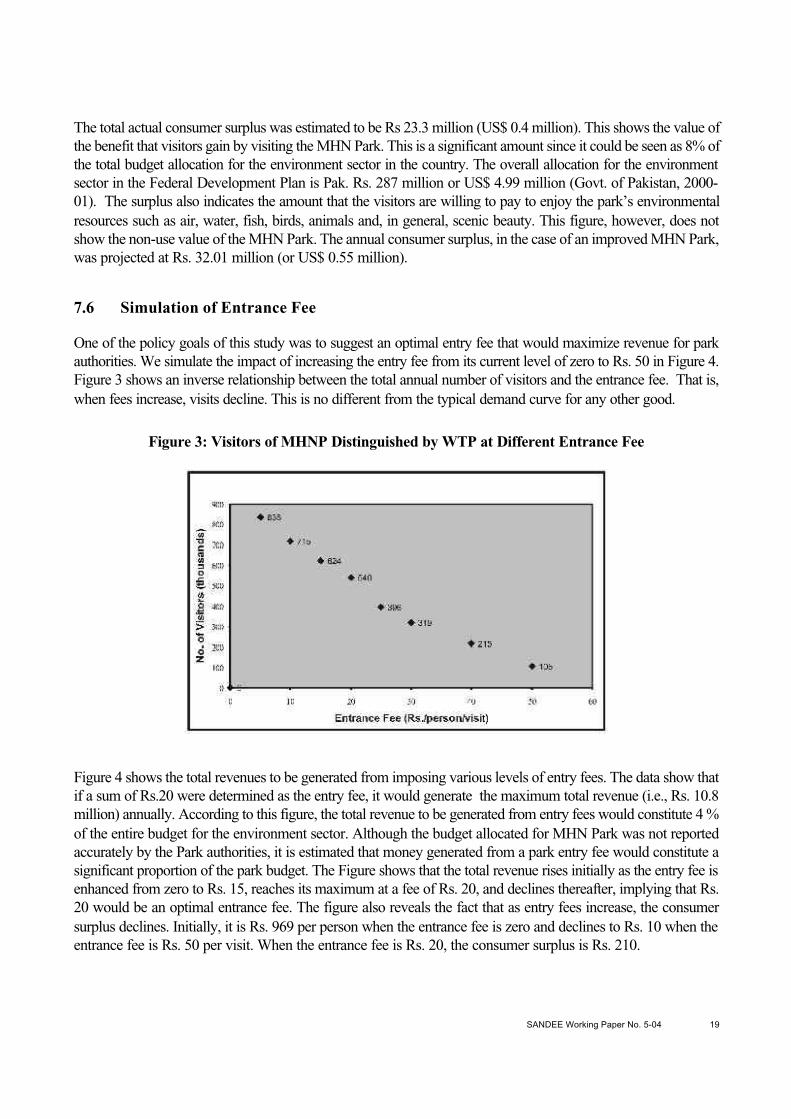
One of the policy goals of this study was to suggest an optimal entry fee that would maximize revenue for parkauthorities. We simulate the impact of increasing the entry fee from its current level of zero to Rs. 50 in Figure 4.Figure 3 shows an inverse relationship between the total annual number of visitors and the entrance fee. That is,when fees increase, visits decline. This is no different from the typical demand curve for any other good.
Figure 3: Visitors of MHNP Distinguished by WTP at Different Entrance Fee
Figure 4 shows the total revenues to be generated from imposing various levels of entry fees. The data show thatif a sum of Rs.20 were determined as the entry fee, it would generate the maximum total revenue (i.e., Rs. 10.8million) annually. According to this figure, the total revenue to be generated from entry fees would constitute 4 %of the entire budget for the environment sector. Although the budget allocated for MHN Park was not reportedaccurately by the Park authorities, it is estimated that money generated from a park entry fee would constitute asignificant proportion of the park budget. The Figure shows that the total revenue rises initially as the entry fee isenhanced from zero to Rs. 15, reaches its maximum at a fee of Rs. 20, and declines thereafter, implying that Rs.20 would be an optimal entrance fee. The figure also reveals the fact that as entry fees increase, the consumersurplus declines. Initially, it is Rs. 969 per person when the entrance fee is zero and declines to Rs. 10 when theentrance fee is Rs. 50 per visit. When the entrance fee is Rs. 20, the consumer surplus is Rs. 210.

20 SANDEE Working Paper No. 5-04
Ideally, we would have liked to compare revenues generated from the entry fee with the costs of improvements inpark quality. But, in the absence of reliable cost estimates5 for park improvements, the present study could notmake such a comparison. The recommendation that the entry fee be set at Rs. 20 is based on revenue andconsumer surplus as well as the researcher’s own observations.
Figure 4: Entrance Fee, Total Revenue and Consumer Surplus
8. Conclusions and Policy Implications
Given the growth in eco-tourism and increasing interest among NGOs and governments in natural resourceconservation, non-market valuation techniques are needed to estimate the economic benefits of environmentalresources such as national parks. In this study, we use the individual travel cost model to analyze and measure therecreational value of the MHN Park.
Government planners envision MHN Park as an eco-tourism destination. Keeping in view the large amountof consumer surplus and recreational values of the MHN Park, Federal and provincial level governmentscan justify a larger annual budget for managing the park. Our analysis shows that if the quality of MHNPark is improved, it will attract more visitors and, in turn, generate greater revenue. This calls for thegovernment to reallocate monies for Park improvements.
Alternatively, the government could also consider introducing an entry fee to access the MHN Park. Sinceconsumers are willing to pay much higher fees than they actually do for park visits, an entry fee of Rs. 20 can beimposed. This entry fee would generate estimated revenue of Rs. 10.8 millions/year, which could be used toimprove park management.
5 Although, a number of attempts were made at an official level to inquire about the costs of improvements, it was impossible toget such estimates from the relevant officials. No one was in a position to provide such information. Thus, we could notsimulate cost estimates of park improvement vis-à-vis total revenue and consumer surplus.
SANDEE Working Paper No. 5-04 21
The recreational benefits and entry fees estimated for MHN Park could provide guidance for park managementbeyond the Margalla Hills National Park. There are several national parks in Pakistan that too are in need ofadditional investments. We hope our study will draw attention to the demand for nature and the benefits thataccrue from investing in nature.
9. Acknowledgements
Perhaps the most rewarding part of conducting this study has been that it has put me in touch with so manythoughtful people I had not previously met. I very much appreciate the support of all those individuals who helpedme during the course of this study. I owe an intellectual debt to Professor Karl–Goran Maler, Professor ParthaDasguptha and Dr. Herath Gunatilake for their valuable comments and expert criticism on earlier drafts of thisstudy and for their suggestions during various SANDEE Research and Training Workshops. I am grateful to themfor providing me with useful literature. Special thanks are due to Professor Gopal Kadekodi, Dr. A.K. EnamulHaq, Dr. Priya Shyamsundar, Professor M.N. Murthy, Professor Kanchan Chopra, Professor Jeffrey R. Vincent,Ms. Lucy Emerton, Dr. Sajjad Zohair, Professor Hemesiri Kotagama and Dr. Rehana Siddiqui who pointed outareas of particular strength or areas where coverage could be expanded in this study. The support this study hasreceived from SANDEE’s other resource persons as well as fellow researchers has been gratifying and energizing.The final version of this study reflects the impact of their comments. I would like to make special mention of Dr.Priya Shyamsundar who read the revised draft report thoroughly and gave some very valuable comments andsuggestions. My debt to Professor Mir Kalan Shah, Director, IDS, is no less since he graciously gave me permissionto participate in SANDEE’s Research and Training Workshops in Nepal, Bangkok, Dhaka, and Colombo. Mydebt to him, I believe, exceeds that which is normally accorded to people in such positions. This research wouldnever have been completed without his friendship and support, moral, technical and institutional.
SANDEE Working Paper No. 5-04 23
References
Abala, D.O. (1987), ‘A Theoretical and Empirical Investigation of the Willingness to Pay for Recreational Services:A Case Study of Nairobi National Park’, Eastern Economic Review, 3: 271-92.
Baldares, M.J. and J.G. Laarman (1990), ‘Derechos de Entrada a las Areas Protegidas de Costa Rica’, CienciasEconomicas 10: 63-76.
Bateman, I.J. and K.G. Willis (eds.) (1999), Valuing Environmental Resources: Theory and Practice ofthe Contingent Valuation Method in the US, EU, and Developing Countries, New York: OxfordUniversity Press.
Beal, D.J. (1995), ‘Sources of Variation in Estimates of Cost Reported by Respondents in Travel CostSurveys’, Australian Journal of Leisure and Recreation 5 (1): 3-8.
Brown, W.G. and F. Nawas (973), ‘Impact of Aggregation on the Estimation of Outdoor Recreation DemandFunctions’, American Journal of Agricultural Economics, 55: 246-9.
Cesario, F.J. (1976), ‘Value of Time in Recreation Benefit Studies’, Land Economics, 51 (2): 32-41.
Chase, L., D. Lee, W. Schulze, and D. Anderson (1998), ‘Ecotourism Demand and Differential Pricing ofNational Park Access in Costa Rica’, Land Economics, 74 (4): 466-482.
Choe, K., D. Whittington and D.T. Lauria (1996), ‘The Economic Benefits of Surface Water QualityImprovements in Developing Countries: A Case Study of Davao, Philippines’, Land Economics,72 (4): 519-527.
Clawson, M. and J.L. Knetsch (1966), Economics of Outdoor Recreation, Washington, D.C: John HopkinsUniversity Press.
Clawson, M. (1959), Methods of Measuring the demand for and value of outdoor Recreation, Reprint No.10, Washington: Resources for the Future.
Cummings, R.G., D.S. Brookshire, and W.D. Schulze (1986), Valuing Environmental Goods: An Assessmentof the Contingent Valuation Method, Savage, MD: Rowman and Littlefield Publishers.
Durojaiye, B.O. and A.E. Ipki (1988), ‘The Monetary Value of Recreational Facilities in a DevelopingCountry: A Case Study of Three Centres in Nigeria’, Natural Resources Journal, 28: 315-28.
Echeverria, J., M. Hanrahan, and R. Solorazano (1995), ‘Valuation of Non-Priced Amenities Provided bythe Biological Resources within the Monteverde Cloud Forest Preserve, Costa Rica’, EcologicalEconomics, 13: 43-52.
Farber, S. (1988), ‘The Value of Coastal Wetlands for Recreation: An Application of Travel Cost andContingent Valuation Methodologies’, Journal of Environmental Management, 26: 299-312.
Freeman, A. Myrick III (1993), The Measurement of Environmental and Resource Values: Theory andMethods, Washington, D.C: Resources for the Future.
Garrod, Guy and K.G. Willis (1999), Economic Valuation of the Environment: Methods and Case Studies,Cheltenham, UK and Northampton, MA, USA: Edward Elgar.
24 SANDEE Working Paper No. 5-04
Govt. of Pakistan (2001), Economic Survey 2000-01. Finance Division, Economic Advisor’s Wing, Islamabad.
Grandstaff, S. and J.A. Dixon (1986), ‘Evaluation of Lumpinee Park in Bangkok, Thailand’, in J.A. Dixonand M.M. Hufschmidt (eds), Economic Valuation Techniques for the Environment: A Case StudyWorkbook, Baltimore: Johns Hopkins University Press.
Gum, R.L. and W.E. Martin (1974), ‘Problems and Solutions in Estimating the Demand for and Value of RuralOutdoor Recreation’, American Journal of Agricultural Economics, 56: 558-66.
Hotelling, H. (1947), ‘The Economics of Public Recreation: The Prewitt Report’, Washington, D.C: NationalPark Services.
Hanker, N., et al., (1997), ‘Willingness to Pay for Borivli National Park: Evidence from a ContingentValuation’, Ecological Economics, 105-122.
Isangkura, A. (1998), Environmental Valuation: An Entrance Fee System for National Parks in Thailand,EEPSEA Research Report Series, Economy and Environment Program for Southeast Asia, Tanglin,Singapore.
Kaosa-ard, M., D. Patmasiriwat, T. Panayotou, and J.R. Deshazo (1995), Green Financing: Valuation andFinancing of Khao Yai National Park in Thailand, Thailand Development Research Institute,Bangkok.
Knetsch, J.L. (1963), ‘Outdoor Recreation Demands and Values’, Land Economics, 39: 387-86.
Lindberg, K. and R.L. Johnson (1994), ‘Estimating Demand for Ecotourism Sites in Developing Nations’,Trends, 31: 10-15.
Loomis, J.B. and R.G. Walsh (1997), Recreation Economic Decisions: Comparing Benefits and Costs,Venture Publishing, State College, PA.
McConnell, K.E. (1985), ‘The Economics of Outdoor Recreation’, in Allen V. Kneese and James L.Sweeney (eds.), Handbook of Natural Resources and Energy Economics, vol.1. Amsterdam, TheNetherlands: North-Holland.
McConnell, K.E. (1992), ‘On-site Time in the Demand for Recreation’, American Journal of AgriculturalEconomics, 74: 918-25.
McKean, J.R., D.M. Johnson and R.G. Walsh (1995), ‘Valuing Time in Travel Cost Demand Analysis: AnEmpirical Investigation’ Land Economics, 71 (1): 96-105.
Moran, D. (1994), ‘Contingent Valuation and Biodiversity. Measuring the User Surplus of Kenyan ProtectedArea’, Biodiversity and Conservation, 3: 663-84.
Munganata, E.D. and S. Navrud (1994), ‘Environmental Valuation in Developing Countries: TheRecreational Value of Wildlife Viewing’, Ecological Economics, 11: 135-51.
Nillesen, E. (2002), ‘The Travel Cost Approach: An Application to Bellenden Ker National Park’, AnUnpublished Thesis Submitted to the School of Economics, University of Queensland, Australia.
Pearse, P.H. (1968), ‘A New Approach to the Evaluation of Non-priced Recreational Resources’, LandEconomics, 11: 135-51.

SANDEE Working Paper No. 5-04 27
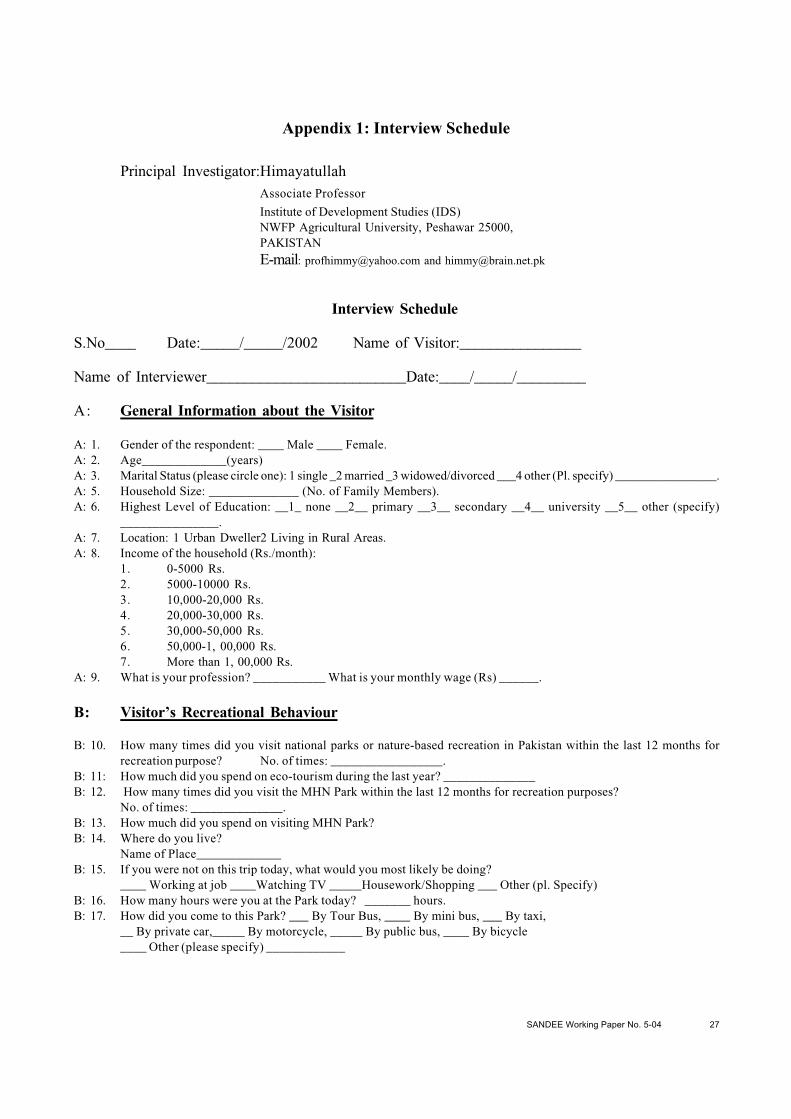
Appendix 1: Interview Schedule
Principal Investigator:HimayatullahAssociate Professor
Institute of Development Studies (IDS)NWFP Agricultural University, Peshawar 25000,PAKISTANE-mail: [email protected] and [email protected]
Interview Schedule
S.No____ Date:_____/_____/2002 Name of Visitor:________________
Name of Interviewer__________________________Date:____/_____/_________
A: General Information about the Visitor
A: 1. Gender of the respondent: ____ Male ____ Female.A: 2. Age_____________(years)A: 3. Marital Status (please circle one): 1 single _2 married _3 widowed/divorced ___4 other (Pl. specify) ________________.A: 5. Household Size: ______________ (No. of Family Members).A: 6. Highest Level of Education: __1_ none __2__ primary __3__ secondary __4__ university __5__ other (specify)
_______________.A: 7. Location: 1 Urban Dweller2 Living in Rural Areas.A: 8. Income of the household (Rs./month):
1. 0-5000 Rs.2. 5000-10000 Rs.3. 10,000-20,000 Rs.4. 20,000-30,000 Rs.5. 30,000-50,000 Rs.6. 50,000-1, 00,000 Rs.7. More than 1, 00,000 Rs.
A: 9. What is your profession? ___________ What is your monthly wage (Rs) ______.
B: Visitor’s Recreational Behaviour
B: 10. How many times did you visit national parks or nature-based recreation in Pakistan within the last 12 months forrecreation purpose? No. of times: _________________.
B: 11: How much did you spend on eco-tourism during the last year? ______________B: 12. How many times did you visit the MHN Park within the last 12 months for recreation purposes?
No. of times: ______________.B: 13. How much did you spend on visiting MHN Park?B: 14. Where do you live?
Name of Place_____________B: 15. If you were not on this trip today, what would you most likely be doing?
____ Working at job ____Watching TV _____Housework/Shopping ___ Other (pl. Specify)B: 16. How many hours were you at the Park today? _______ hours.B: 17. How did you come to this Park? ___ By Tour Bus, ____ By mini bus, ___ By taxi,
__ By private car,_____ By motorcycle, _____ By public bus, ____ By bicycle____ Other (please specify) ____________
28 SANDEE Working Paper No. 5-04
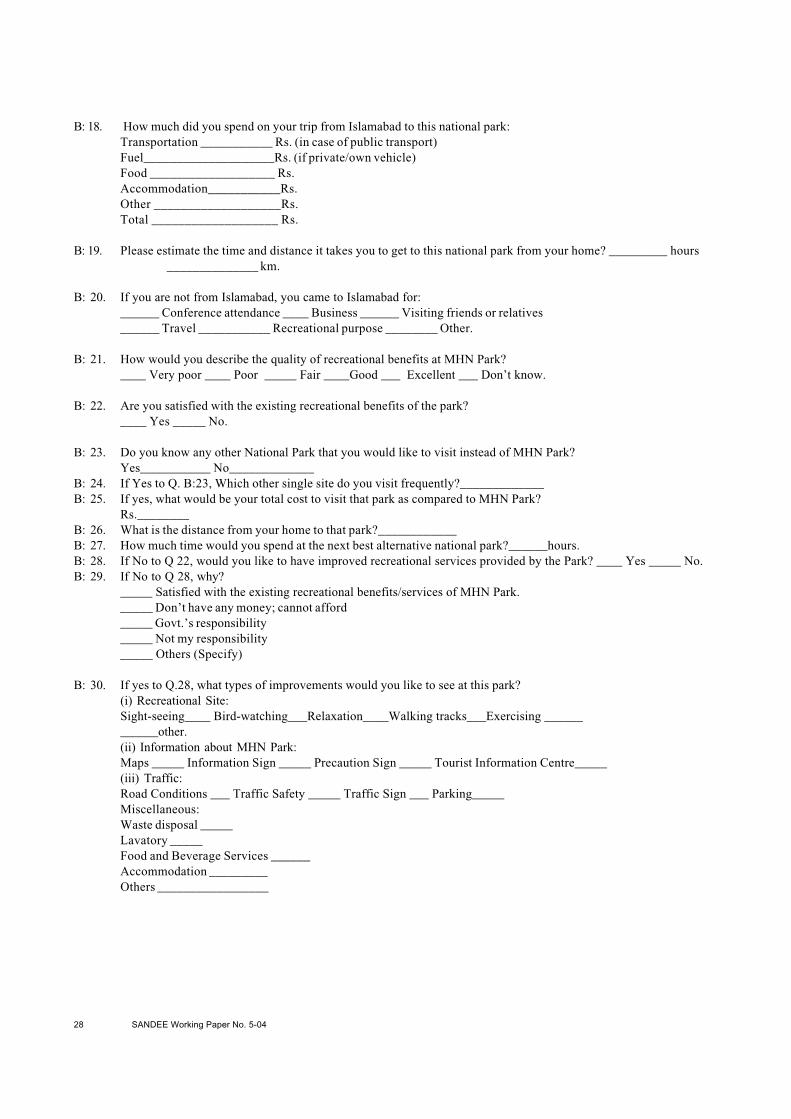
B: 18. How much did you spend on your trip from Islamabad to this national park:Transportation ___________ Rs. (in case of public transport)Fuel____________________Rs. (if private/own vehicle)Food ___________________ Rs.Accommodation___________Rs.Other ___________________Rs.Total ___________________ Rs.
B: 19. Please estimate the time and distance it takes you to get to this national park from your home? _________ hours______________ km.
B: 20. If you are not from Islamabad, you came to Islamabad for:______ Conference attendance ____ Business ______ Visiting friends or relatives______ Travel ___________ Recreational purpose ________ Other.
B: 21. How would you describe the quality of recreational benefits at MHN Park?____ Very poor ____ Poor _____ Fair ____Good ___ Excellent ___ Don’t know.
B: 22. Are you satisfied with the existing recreational benefits of the park?____ Yes _____ No.
B: 23. Do you know any other National Park that you would like to visit instead of MHN Park?Yes___________ No_____________
B: 24. If Yes to Q. B:23, Which other single site do you visit frequently?_____________B: 25. If yes, what would be your total cost to visit that park as compared to MHN Park?
Rs.________B: 26. What is the distance from your home to that park?____________B: 27. How much time would you spend at the next best alternative national park?______hours.B: 28. If No to Q 22, would you like to have improved recreational services provided by the Park? ____ Yes _____ No.B: 29. If No to Q 28, why?
_____ Satisfied with the existing recreational benefits/services of MHN Park._____ Don’t have any money; cannot afford_____ Govt.’s responsibility_____ Not my responsibility_____ Others (Specify)
B: 30. If yes to Q.28, what types of improvements would you like to see at this park?(i) Recreational Site:Sight-seeing____ Bird-watching___Relaxation____Walking tracks___Exercising ____________other.(ii) Information about MHN Park:Maps _____ Information Sign _____ Precaution Sign _____ Tourist Information Centre_____(iii) Traffic:Road Conditions ___ Traffic Safety _____ Traffic Sign ___ Parking_____Miscellaneous:Waste disposal _____Lavatory _____Food and Beverage Services ______Accommodation _________Others _________________

SANDEE Working Paper No. 5-04 29
C: Visitor’s Attitude towards Entrance Fees
C: 31. What is the entry free to MHN Park_______(Rs.)C: 32. If MHN Park needs more income to provide better services for visitors, such as more recreational sites, improved
cleanliness, greater traffic safety, public safety and forest fire protection, how should these recreational services befinanced?____Raise the entry fees ____ Raise govt. budget ____Donation to Park fund ___ Other.
C: 33. Suppose there were no other sources of improvement except imposing/raising entry fees, would you be willing to payhigher entry fee? Yes_____ No______.
C: 34. (a) If the entry fee were Rs. 20, would you be willing to pay it to visit the MHN Park? Yes_____(go to Q. b),No_________(go to Q. d).(b) Suppose that the engineers designing the project for improving environmental services of the park confrontedsome unexpected technical problems, and that instead of Rs. 20 the entry fee was Rs. 50. In this case would you bewilling to pay the entry fee or not? Yes ______ (finished; go to Q. 35) No._______(go to Q. c)( c ) Suppose that instead of Rs. 50 the entry fee was Rs. 35. In this case would you be willing to pay the entry fee ornot? Yes_____ (finished; go to Q. 35) No______ (go to Q. f).(d) Suppose that instead of Rs. 20 the entry fee was Rs. 15. In this case would you be willing to pay? Yes___(finished;go to Q. 35) No____ (go to Q. e)(e) Suppose that instead of Rs. 15 the entry fee was Rs. 10. In this case would you be willing to pay? Yes___(finished;go to Q. 35) No____ (go to Q. f)(f) What is the most you would be willing to pay for the entry fee to this park?Maximum amount _____ Rs.
C: 35. If you are willing to pay for improved quality of recreational services in the near future, perhaps you may wish to cometo the park and spend more time for recreation. How many more times would you then be here?_____ visits/year.

SANDEE Working Paper No. 5-04 31
Appendix 2: MHNP in the Region

SANDEE Working Paper No. 5-04 33
Appendix 3: Map of MHNP and Islamabad
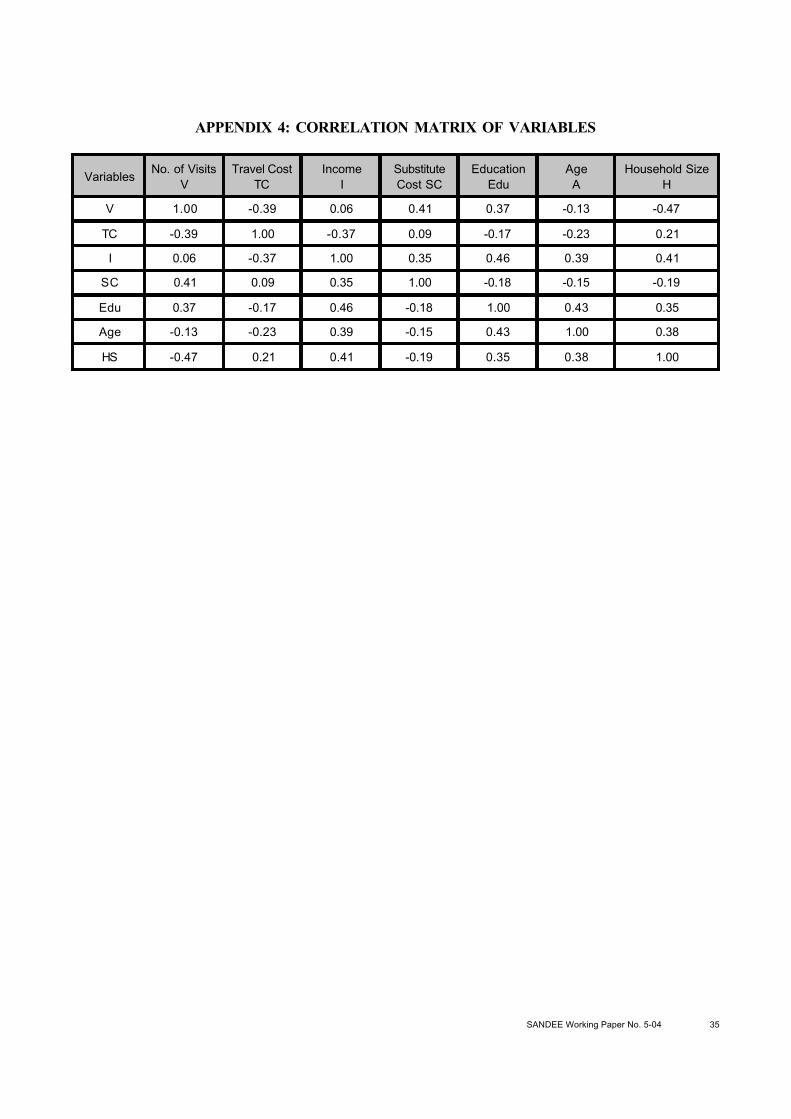
SANDEE Working Paper No. 5-04 35
VariablesNo. of Visits
VTravel Cost
TCIncome
ISubstituteCost SC
EducationEdu
AgeA
Household SizeH
V 1.00 -0.39 0.06 0.41 0.37 -0.13 -0.47
TC -0.39 1.00 -0.37 0.09 -0.17 -0.23 0.21
I 0.06 -0.37 1.00 0.35 0.46 0.39 0.41
SC 0.41 0.09 0.35 1.00 -0.18 -0.15 -0.19
Edu 0.37 -0.17 0.46 -0.18 1.00 0.43 0.35
Age -0.13 -0.23 0.39 -0.15 0.43 1.00 0.38
HS -0.47 0.21 0.41 -0.19 0.35 0.38 1.00
APPENDIX 4: CORRELATION MATRIX OF VARIABLES