Embed Size (px)
Citation preview
�����������
�����������
� ������ ���� � ���� �� �������������������
�� ����� ������������������������������������������ ��� �������������������������������
������������ ���������������������������
��!� ��"�"���#$$$%��! ��"�"���#$ �"��&�!�&�'()�������&��*+,-�.)&��!�///*)�������&��*+,
SANDEE Working Paper No. 51 - 10
September 2010
South Asian Network for Development and Environmental Economics (SANDEE)PO Box 8975, EPC 1056
Kathmandu, Nepal
Mani Nepal*, Apsara Nepal** and Kristine Grimsrud**
Unbelievable but True — Improved cook-stoves arenot helpful in reducing firewood demand in Nepal
*SANDEE Kathmandu Nepal,**University of New Mexico, Albuquerque, USA
2 SANDEE Working Paper No. 51-10
Published by the South Asian Network for Development and Environmental Economics(SANDEE)PO Box 8975, EPC 1056, Kathmandu, Nepal.Telephone: 977-1-5003222 Fax: 977-1-5003299
SANDEE research reports are the output of research projects supported by the SouthAsian Network for Development and Environmental Economics. The reports have beenpeer reviewed and edited. A summary of the findings of SANDEE reports are alsoavailable as SANDEE Policy Briefs.
National Library of Nepal Catalogue Service:
Mani Nepal, Apsara Nepal and Kristine GrimsrudUnbelievable but True — Improved cook-stoves are not helpful in reducing firewood demandin Nepal(SANDEE Working Papers, ISSN 1893-1891; 2010- WP 51)
ISBN: 978 - 9937 - 8376 - 0 - 6
Key words:
1. Firewood consumption
2. Improved stove
3. Mud stove
4. Open-fire stove
5. Deforestation
II
The views expressed in this publication are those of the author and do not necessarilyrepresent those of the South Asian Network for Development and EnvironmentalEconomics or its sponsors unless otherwise stated.
SANDEE Working Paper No. 51-10 3III
Comments should be sent to Mani Nepal, SANDEE, ICIMOD, Khumaltar, NepalEmail:[email protected].
The South Asian Network for Development andEnvironmental Economics
The South Asian Network for Development and Environmental Economics (SANDEE) is aregional network that brings together analysts from different countries in South Asia to addressenvironment-development problems. SANDEE’s activities include research support, training,and information dissemination. Please see www.sandeeonline.org for further information aboutSANDEE.
SANDEE is financially supported by International Development Research Center (IDRC),The Ford Foundation, Swedish International Development Cooperation Agency (SIDA),the World Bank and the Norwegian Agency for Development Cooperation (NORAD). Theopinions expressed in this paper are the author’s and do not necessarily represent those ofSANDEE’s donors.
The Working Paper series is based on research funded by SANDEE and supported withtechnical assistance from network members, SANDEE staff and advisors.
English EditorCarmen Wickragamage

4 SANDEE Working Paper No. 51-10IV
SANDEE Working Paper No. 51-10 5V
TABLE OF CONTENTS
1. INTRODUCTION 1
2. A BRIEF OVERVIEW OF EXISTING STUDIES 2
3. IMPROVED COOK-STOVES IN NEPAL 4
4. BASIC THEORY, ECONOMETRIC MODEL AND HYPOTHESES 4
5. DATA AND VARIABLES 7
6. RESULTS AND DISCUSSION 8
7. CONCLUSION 11
8. ACKNOWLEDGEMENTS 12
REFERENCES 13
LIST OF TABLES
Table 1: Variable Definition and Descriptive Statistics 16
Table 2: Distribution of Household Level Variables by Stove Types (N = 2607) 17
Table 3: Distribution of Variables by Stove Type for the Households Hiring FemaleFarm Workers (N = 757) 17
Table 4: Ordinary Least Squared Regression Results 18
Table 5: Two Stage Least Squared Regression Results 19
Table 6: OLS and 2SLS Regression Results (Dep Var: Log(FIREWOOD) whereCOLLECTIONTIME is replaced with FEMALEWAGE ) 20
Table 7: Random Effect Regression (Dep Var: Log(FIREWOOD) 21

6 SANDEE Working Paper No. 51-10VI
SANDEE Working Paper No. 51-10 7VII
Abstract
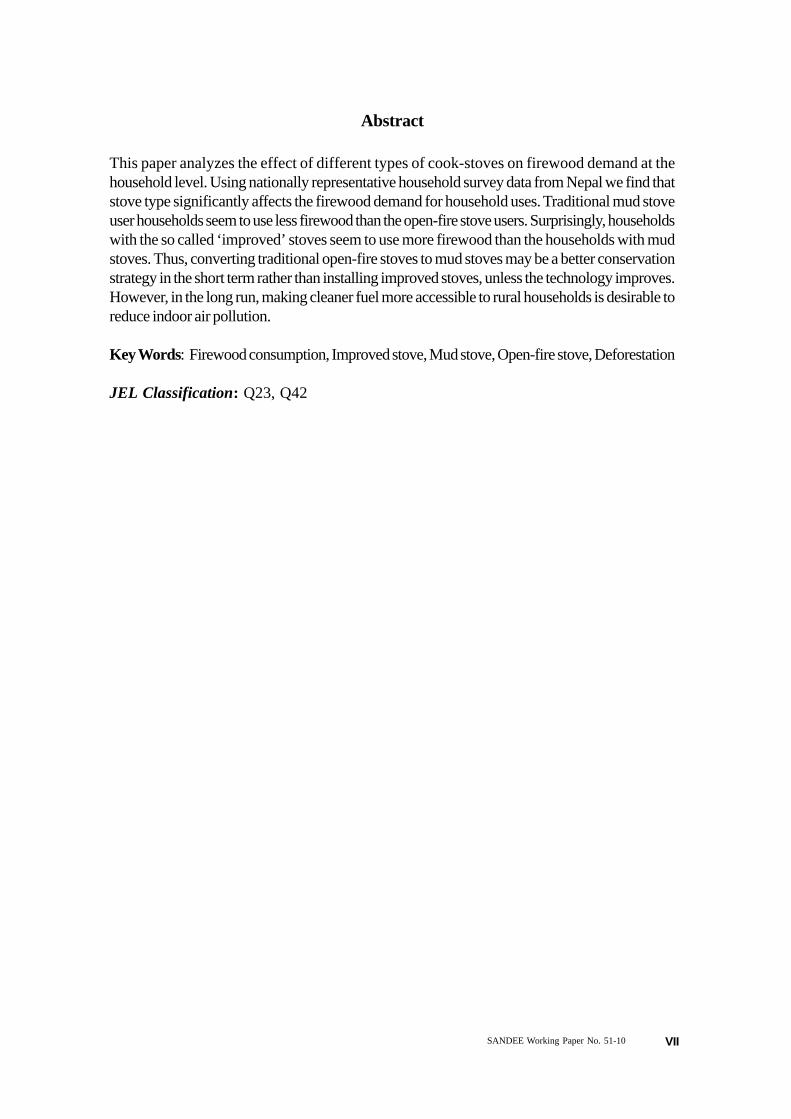
This paper analyzes the effect of different types of cook-stoves on firewood demand at thehousehold level. Using nationally representative household survey data from Nepal we find thatstove type significantly affects the firewood demand for household uses. Traditional mud stoveuser households seem to use less firewood than the open-fire stove users. Surprisingly, householdswith the so called ‘improved’ stoves seem to use more firewood than the households with mudstoves. Thus, converting traditional open-fire stoves to mud stoves may be a better conservationstrategy in the short term rather than installing improved stoves, unless the technology improves.However, in the long run, making cleaner fuel more accessible to rural households is desirable toreduce indoor air pollution.
Key Words: Firewood consumption, Improved stove, Mud stove, Open-fire stove, Deforestation
JEL Classification: Q23, Q42

8 SANDEE Working Paper No. 51-10
SANDEE Working Paper No. 51-10 1
Unbelievable but True — Improved cook-stoves are nothelpful in reducing firewood demand in Nepal
Mani Nepal, Apsara Nepal and Kristine Grimsrud
1. Introduction
In developing countries, biomass remains the most widely used fuel type. Firewood takes thebiggest share of it. Burning biomass for household energy is mainly related to indoor air pollutionthat causes numerous health problems, emission of greenhouse gases, brown clouds and blackcarbon (Edwards et al., 2004; Chengappa et al., 2007; Pant, 2008; Malla, 2009; Gustafssonet al., 2009). Deforestation and climate change are interlinked where deforestation combinedwith natural decaying of biomass is contributing more than 17% of the CO2 emissions globally(IPCC, 2007). While the debate on the link between fuelwood use and deforestation is far fromover (e.g. Arnold et al.., 2006), scholars have attributed one major reason for deforestation tothe extraction of wood for fuelwood, charcoal, polewood, and the commercial harvesting offorest products (Geist and Lambin, 2002).
Two successive Nepal Living Standard Measurement Surveys (NLSS I and II) indicate that theuse and collection of firewood seems to be increasing over years in Nepal. In 1995/96, about77% households reported that they were using firewood for cooking and 84% of those firewoodusers collected it (CBS, 1996). However, in 2003/04 about 84% households use firewood forcooking, and 88% of these firewood user households collect it (CBS, 2004). Such a widespreadand increasing trend in firewood collection and use may have two potential impacts: it may wellthreaten the sustainability of Nepal’s forests resources and also causing the negative health impactsdue to indoor air pollution (Pant, 2008; Malla, 2009) given that very small number of householdsare using the improved cook-stoves.
Historically, deforestation in Nepal is due mainly to expansion in agriculture, illegal timber extraction,and firewood collection (Bajracharya, 1983). To avoid the massive deforestation, Nepalgovernment started transferring the user rights of the government managed forests to the localcommunities to manage locally under the widely celebrated community forestry program. Whiletransferring the forest to the local communities during 1980s, Nepal government also try todistribute improved cook-stoves in a limited scale hoping that these cook-stoves would be ableto reduce firewood demand. In principle, alternative energy sources, such as electricity, solar,bio-gas, etc., can be used in place of dirty energy, such as firewood. However, replacing thecurrent use of firewood by such alternative energy sources may not be feasible given the currentstate of electricity generation and its coverage,1 and unavailability of relatively cleaner energysources in Nepali villages.2 One possible solution would be to change cooking stoves that wouldconsume less firewood. The expectation is that such energy efficient cooking stoves may help toreduce firewood consumption and reduce the emissions at the household level. The improvedcook-stove (ICS) technology was first introduced in Nepal in the 1950s and its use has been on
1 Less than 40% households have access to electricity, and during the dry season, the power outage can goon for over 16 hours per day during dry season.
2 About 8% households in Nepal (mostly concentrated in the Kathmandu valley and few other urbancenters) use Liquefied Petroleum Gas (LPG), and additional 5% use kerosene stoves for cooking purposein Nepal (CBS, 2004).
2 SANDEE Working Paper No. 51-10
the rise since the latter part of the 1990s. NLSS data indicate that the ICS program has country-wide coverage that households in 31 out of 75 districts have reported the use of ICS in 2003/04 survey.
This paper investigates the impact of different types of cook-stoves on firewood consumption inNepal. More specifically, we want to investigate whether households with improved stoves useless firewood than households with the traditional mud stove or the open-fire stove. Many typesof cooking stoves are in use throughout Nepal. If an improved stove consumes less firewoodthan mud or open-fire stove while meeting the household’s energy need, then, the adoption ofsuch less firewood consuming cook-stove may help to maintain the sustainable use of firewood.This may be helpful in reducing indoor air pollution and lowering the pressures on the existingforests resources.
We use data from the Nepal Living Standards Survey 2003/04 for empirical analysis. This is themost recent and the comprehensive household survey in Nepal. It provides socioeconomic anddemographic information of the households, such as income, consumption, firewood collection,stove types, health, education, etc. For this analysis, household level firewood consumption isused as the outcome variable. After controlling for different variables, such as average time tocollect one bhari3 of firewood, household size, number of animals (cows and buffalos), we findthat the type of cook-stoves significantly affects the amount of firewood demand. More specifically,we find that the improved stoves are not really improved in terms of firewood saving. Householdswith traditional mud stoves seem to consume less firewood than households that use the so called‘improved’ stoves. The results are not significantly different across different functional forms anddifferent estimation methods after correcting for endogeneity in stoves adoption.
The paper is organized as follows. In the next section, we provide a short review of the relatedliterature. Section 3 presents a brief history of ICS in Nepal. A basic theory, the econometricmodel, and the hypotheses of the study are presented in section 4. Data and the variables used inthe paper are discussed in section 5. Regression results are presented and discussed in section 6.The final section concludes.
2. A Brief Overview of Existing Studies
Despite the widespread use of firewood in developing countries and its potential impacts onindoor air pollution and deforestation, the literature on the contribution of improved stoves tofirewood saving is very limited. Cooke et al. (2008) provide a review of empirical literature fromthree developing countries on the adoption of improved cook-stoves. They document that theempirical evidence is inconclusive on the role of improved cook-stove on fuelwood demand.Zein-Elabdin (1997) gives two reasons for the scarcity of the research on the impact of improvedstoves on fuelwood demand in developing countries: lack of databases and the lack of understandingon the market for traditional fuels, such as firewood.
Using time-series data, Zein-Elabdin (1997) estimates the demand and supply elasticities forcharcoal in Khartoum (Sudan) in order to analyze the rebound effect of new technology adoption.Rebound effect is the behavioral response that offsets the beneficial effect of new technology.For example, if a new technology improves stove efficiency by 20% and fuelwood consumptiondrops by 15%, then the 5% differential between the fuel efficiency and the decrease in fuelwood
3 Bhari is a local unit of firewood where one bhari is a bundle of firewood one can carry. Its average weightis 30-35 kilograms (approx).
SANDEE Working Paper No. 51-10 3
demand may be due to an increase in consumption of fuelwood as a result of efficient stoves.The author indicates that such ‘rebound effect’ gets larger if household’s budget share on fuelwoodis large, the income elasticity of fuelwood demand is high, and the supply elasticity is low. Zein-Elabdin (1997) study is based on the market data in an urban environment. The author findsincreased fuelwood consumption (charcoal) with efficient stoves. This is because the incomeelasticity of fuelwood demand is very high in the case study where efficient stoves reduce thedemand for fuelwood in the first place. Lower demand, however, reduces the price of charcoal.As a result, households adopt cheaper fuel in alternative uses leading to overall higher demandfor fuelwood.
But other studies have shown that the use of fuel efficient cooking stoves could reduce thedemand for fuelwood. Studies from China (Edwards et al., 2004), Guatemala (McCracken etal., 1998), India (Chengappa et al., 2007), Madagascar (Bazile, 2001), Mexico (Masera etal., 2007), and Tanzania (Makame, 2007) show mixed impacts of the improved stoves onfuelwood saving. However, the diffusion of the new technology is not smooth in most of thesecountries except in China. The main reason of slow or no diffusion of cook-stoves is attributed tothe stove designs that sometimes do not meet the cooking requirements of the households.
Sinton et al. (2004) provide a detailed account of how the diffusion of the improved cook-stovebecame successful in China. On the other hand, Barnes et al. (1993) provide an excellent reviewof diffusion of the improved stoves and provide explanation of why households remain reluctantto adopt the new technology in many developing countries. This review highlights the importanceof responding to the specificity of the local conditions when introducing a new technology. Basically,the authors claim that while the scarcity and higher price of fuelwood may help the disseminationof the improved stoves, their adoption is not guaranteed. In a related review article, Barnes etal. (1994, p v) summarize the conditions for the success or failure of the improved cook stovesadoption as, “no matter how efficient or cheap the stove, individual households have provedreluctant to adopt it if it is difficult to install and maintain or less convenient and less adaptable tolocal preferences than its traditional counterpart.” The emphasis is that the improved stove shouldnot be totally different from what households have been using; it should be improved but nottotally new to the users. Using survey data from two rural villages in Nepal, Amacher et al.(1992) find that household characteristics, income level, and the availability of firewood determinethe adoption of the improved stoves.
A related area of research is the contribution of improved stoves on reducing indoor air pollutionand time saving. McCracken and Smith (1998) conducted a study in the Guatemalan highlandswhere they compared the thermal efficiency, emission content, and the length of cooking timebetween the traditional three-stone fire-stove and an improved Plancha fire-stove. Their experimentrevealed that while the improved stoves emitted less PM2.5 (fine air pollutant particles that are 2.5micrometers in diameter or smaller) they took more time to prepare food as compared to theopen-fire stoves.
In a study conducted in China, Edwards et al. (2004) find that the thermal efficiency that reducesfuel demand mainly leads to combustion inefficiency causing increased greenhouse pollutants andhealth damaging particulates. Chengappa et al. (2007) conducted a study in India similar to whatEdwards et al. (2004) did in China. They find that the improved stove reduces the PM2.5concentration and CO, improving the indoor air quality. Masera et al. (2007) find the same typeof results in the case of the Mexican version of the improved stove. Pant (2008) and Malla(2009) study the health impact of indoor air pollution using small surveys in a few Nepali villages.
4 SANDEE Working Paper No. 51-10
Both of these studies find that the improved stoves help to reduce the respiratory diseasessignificantly. Malla’s study that covers five villages from one district (400 households) indicatesthat the improved stoves can help reduce the use of firewood. Pant’s study that covers sixvillages from two districts (600 households), however, does not analyze the fuelwood efficiencyof the cook-stoves.
Results from these studies show that the evidence on the impact of improved stoves on firewoodsaving, indoor air pollution, and time saving remains inconclusive. However, most of these studiesfocus mainly on the technical aspects of the stove design using small sample sizes with limitedgeographical coverage. Our study analyzes the impact of the stove-type on household levelfirewood consumption with a nationally representative household survey.
3. Improved Cook-stoves in Nepal
The improved cook-stove (ICS) program in Nepal was introduced in the mid 1950s, but itscoverage remained very low during the next three decades. The main objectives of the programwere to reduce the rate of deforestation along with reducing the indoor air pollution and increasingthe efficiency of household energy use. During the 1980s, Nepal government tried to tie up theICS program with community forestry program in the hope of containing the massive deforestation(Clemens, 2010). In 1999, Nepal government introduced the National ICS Program under theEnergy Sector Assistance Program funded by the Danish International Development Agency. Atthe national level, the Alternative Energy Promotion Center has been administering the programwith the help of several organizations, such as the Center for Rural Technology, Nepal (CRT/N),the Department of Women’s Development, and other non-governmental and community basedorganizations.
The ICS program in Nepal is mostly supply driven. Interested organizations have been introducingseveral types of ICS technologies with different shapes and sizes, such as, mud-brick ICS, andmetallic ICS (Practical Action, 2009). The most popular one is the mud-brick ICS. It can haveone to three pot-holes, depending on household’s requirement. By 2004, the number of ICS inthe country was estimated to be 150,000 where CRT/N alone distributed 100,000 mud-brickICS (Clemens, 2010). The NLSS data suggest that while the use of ICS covers all geographicalareas, its rate of adoption is very low with only two percent of households in 31 districts (out of75) using ICS during 2003/04. Though not identified in the NLSS data set, secondary informationindicate that a very few user households adopt the metallic cook-stoves with a damper to regulatethe air (Practical Action, 2009).
4. Basic Theory, Econometric Model and Hypotheses
Assume that a representative household derives utility from the consumption of energy (both forheating and cooking), consumption of all other goods, and leisure time. The utility level alsodepends on household characteristics. A household can get energy from firewood or fromalternative sources, such as biomass burning, or petroleum products (e.g., kerosene and LPG).The firewood market is very thin in Nepal. Very few households actually buy firewood in themarket, and most of the households collect it rather than buying from the market. Therefore, amarket price for firewood is non-existent for most of the households. However, the time spentcollecting firewood has an opportunity cost. The opportunity cost could be the returns on
SANDEE Working Paper No. 51-10 5
household labor. But such information is not available for many households. Thus, we use thecollection time as a proxy for firewood price.
Maximizing a household’s utility function subject to the budget constraint yields the demand forfirewood (see Kohlin and Parks, 2001; Palmer and MacGregor, 2009, for more discussions).For household i at the community j, the firewood demand (FWij) is a function of collection time(CTij), household characteristics (HCij), and community characteristics (CCj). The firewooddemand also depends on the efficiency of the stove that the household uses. Stove efficiencydepends on its type (STij). Based on this premise, the reduced form equation for firewooddemand is given by the following expression:
FWij = βο + Σ3r=1 βr STrij + β4 CTij + Σ7
k=5 βk HCkij + β8 CCj + ui (1)
There are five types of cook-stoves reported in the survey: open-fire stove (i.e., the traditionaltripods type), mud stove, improved stove, kerosene stove, and other. Since the ‘other’ categoryis not specified and has very few observations, we use the four types of stove for the analysis.4Out of these four stove-types, we use the traditional open-fire stove for comparison. Since theopen-fire stove requires more firewood, researchers consider it as the most inefficient of allstove-types (see Edmonds, 2002). The open-fire stove has poor heat transmission because thefire is open in all directions. In comparison, the mud-stove is more enclosed which can transfermore heat energy for cooking. Since we expect other varieties of stoves to be more efficient (i.e.require less fuel) than the open-fire stove, we expect that households would use less firewood ifthey adopt mud, or improved stoves. Statistically, we expect negative coefficients of these stovetypes (βr < 0). Additionally, we expect that households with improved stove consume less firewoodthan households with mud stove. So, the coefficient of the mud stove is expected to be smaller inabsolute term than the coefficient of the improved stove.
If firewood is a normal good, then an increase in household income should increase the demandfor firewood. However, firewood is also the most dirty fuel type generating smoke that causesindoor air pollution. Therefore, with an increase in income a household may want to replace thedirty fuel with a cleaner one, such as kerosene or LPG. As we are using stove types as the mainvariable on the right hand side, we do not include household income as a control variable toavoid the potential multicollinearity with stove types. Since the collection time (CTij) is a proxyfor the price of firewood, we expect β4 < 0.
Another group of control variables is a vector of household characteristics (HCij), which includeshousehold size (HHSIZE), gender of the household head (MALE), and the presence of a childbelow six years (CHILD) of age. The rationale for using these control variables is that householdsize controls for the scale factor, i.e., we expect a positive relationship between household sizeand firewood demand. As women are mostly responsible for collecting firewood (see Amacher,1993; Khare et al., 2000), presence of a small child (below six years) in the house may affect theamount of time they can spend on firewood collection.
4 Question may arise about the rationale of using kerosene stoves while analyzing the firewood demandassuming that when people use kerosene stoves, then there is no question of using firewood. But, in ouranalysis, we only use households who collect and use firewood. In our sample, and about 95 householdsuse kerosene as well as firewood for household energy.
6 SANDEE Working Paper No. 51-10
5 This information is based on authors’ personal experiences while visiting several villages in the hilly andmountain areas.
We also control for the number of big-head animals (cows and buffaloes) as households generallyuse these animals for milk production (female) and for plowing agricultural fields (males). Theseanimals are mostly fed cooked or warm feed (i.e., a mixture of water, salt, leftover food, ricehusk, etc) at least once a day. So, we expect positive effect of number of such animals onfirewood demand. We also control for sources of firewood – community forest, governmentforest and private forest. Since the Government of Nepal initiated the community forestry programwith the objective of supplying more forest products (such as firewood, and fodder) whileconserving the forest, we expect households with access to a community forest to collect andconsume more firewood compared to an access to a government-controlled forest or a privateforest.
The literature on the adoption of improved stoves (e.g., Amacher et al, 1992; Makame, 2007)indicates that adoption rates mostly depend on the availability of firewood. It may also dependon knowledge about the harmful effects of indoor air pollution or the benefits of the improvedstoves, and the location of households. In that sense, the types of stove a household uses couldwell be endogenously and jointly determined with the amount of firewood a household woulddemand. Therefore, we instrument the stove-type variable using the ordered logit model as wehave four different types of stoves in our sample.
Stove-type may well depend on the cultural factors (such as cooking habits), location (whetherhilly or mountain area vs. southern plain area), and the level of education along with the availabilityof firewood. We, therefore, use the following four variables as a set of instruments: Brahmin/Chhetri (culture), mountain/hills (location), remittance, and education. Here, the first three are theindicator variables, and the last one is household head’s years of schooling. The variable relatedto the cultural factor controls for the cultural traditions of the Brahmin and Chhetri, which are thetwo dominant high castes in Nepali Hindu society. These two castes generally use the mud stovefor cooking their main food items (mostly lunch and dinner), which is generally not the case forother castes/ethnic groups. The reason for including the remittance dummy as an instrument isthat when a household member goes away for work and sends money back home, such moneymay come with attached information. What this means is that the person sending the money mayalso provide information regarding the negative impact of the indoor air pollution to the familyback home if the household is using firewood for household energy.
Finally, the choice of stove also depends on the location of the households. In Nepal, if householdsare located in the hills or in the mountain region, they mostly use the open-fire stove for keepingthemselves warm during winter as well as for drying food grains and other items, such as chilies,during both the rainy summers and the cold winters. During these seasons, the days are eithershorter or the sunshine is rare and not enough to dry food grains or other items. The open-firestove is convenient for these purposes as this type of stove is mainly placed in the middle of theliving room so that household members can sit around it to avoid the cold. Above the open-firestove, households fix a layer underneath the ceiling with enough gap for putting food grains orother items for drying. On the other hand, the mud-stove is mostly placed in a corner of the livingroom, which prevents household members from sitting around it to avoid the cold, and this kindof stove is not much useful for drying food grains or other items as the heat transmits mostlytowards the walls rather than directly towards the ceiling.5 Given these unique features regardingthe locational choice for placing different stove types, we use the mountain/hill dummy as an
SANDEE Working Paper No. 51-10 7
additional instrument. We also perform a statistical test in order to verify that our instruments arenot directly affecting the firewood demand.
5. Data and Variables
We use the Nepal Living Standards Survey 2003/04 (also called NLSS-II) for the empiricalanalysis. This survey follows the World Bank’s Living Standard Measurement Survey (LSMS)methodology. This is the most recent and comprehensive household survey in Nepal that providessocioeconomic and demographic information of the households (such as income, consumption,labor market, firewood demand, collection time, education, etc). This multi-topic survey consistsof a nationally representative sample of 3912 households from 326 primary sampling units (PSUs).These PSUs are selected from six strata using probability proportional to size (PPS) sampling,where size is measured based on the number of households. From each PSU, 12 households areselected systematically (CBS, 2004).
As the main objective of this paper is to investigate the impact of stove types on household-levelfirewood consumption, we include only a sub-sample of households who collect and use firewoodfor household energy. We define these households as firewood self-sufficient. In other words,we exclude those household from our analysis who buy firewood, or who collect firewood forselling purpose, and keep only those households who collect and use firewood. In the sample,these self-sufficient households are in majority, and we use firewood collection time as a proxymeasure of unit price (as in Amacher, 1993). Additionally, 10 households who reported collectingunusually high amount (more than 40 bharis) of firewood per month are also excluded. Withsuch adjustments, our sample size came down to 2607 observations.
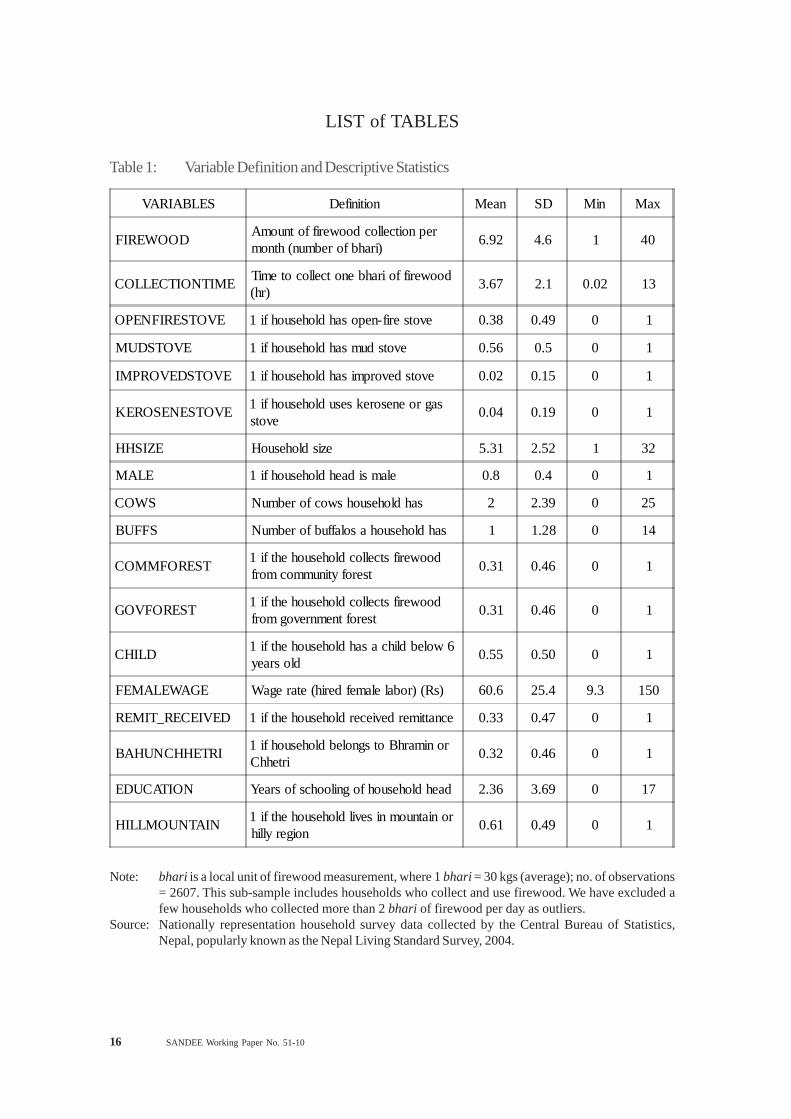
Table 1 presents the descriptive statistics of the variables used in the paper. FIREWOOD indicatesthe average monthly firewood collection by households, measured in the local unit bhari. In anaverage a household collects about 7 bharis of firewood per month. The average time to collectone bhari of the firewood (COLLECTIONTIME) is less than 4 hours.
The next four variables are the types of stove used by the households. In our sample, more than38% households use the most traditional OPENFIRESTOVE, 56% households useMUDSTOVE, and 2% household use the IMPROVEDSTOVE. About 4% households use theKEROSENESTOVE.
Other variables used for the analysis are household size (HHSIZE), the gender of householdhead (MALE), the number of cows (COWS) and buffalos (BUFFS) the household owns, theplace where the households collect the firewood (community, government or private forest), andan indicator of the presence of a child below six years of age (CHILD). The last four variablesare used as the instruments. In our sample, about one-third of households receive remittances,and the same fraction of households belongs to the upper caste (Brahmin or Chhetri). About61% household are from the hill/mountain region and the average years of schooling of household’shead is less than three years, meaning that majority of household heads are either illiterate or havevery low education.
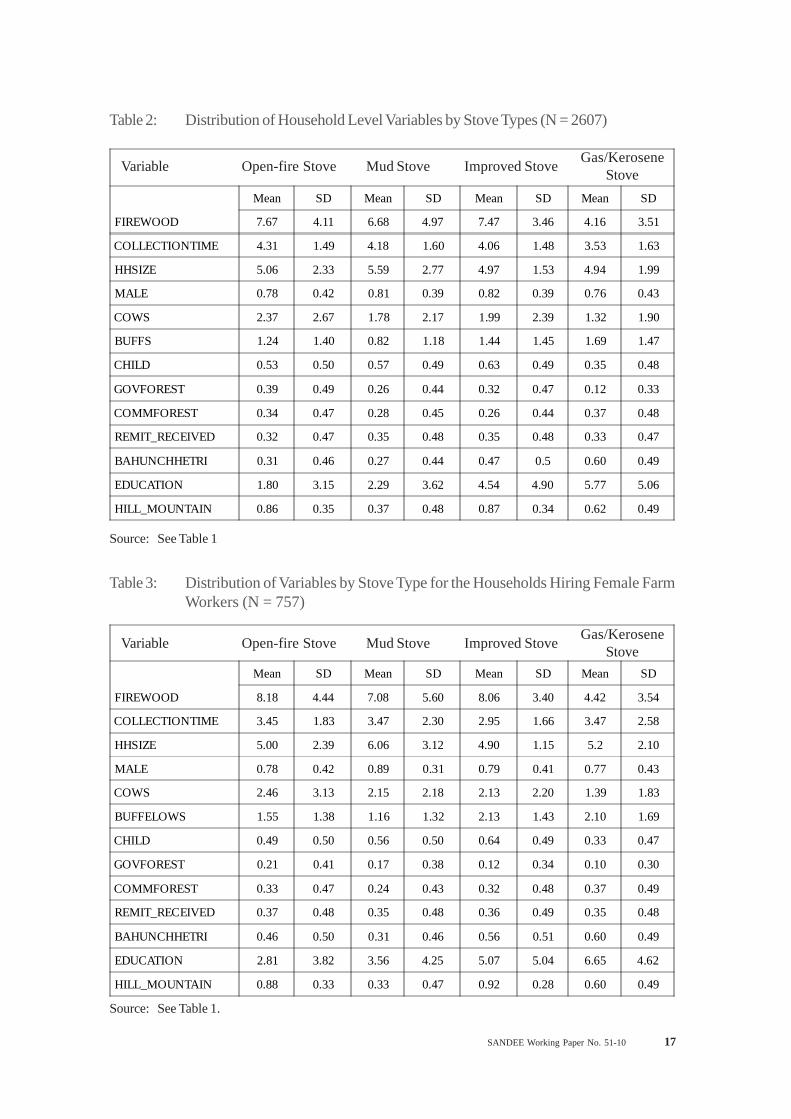
Table 2 presents the distribution of the same variables by the stove types, which is our mainvariable of interest at household level. This table indicates that households with open-fire orimproved stoves collect more firewood compared to households with mud-stove.
8 SANDEE Working Paper No. 51-10
An alternative to firewood collection time as the unit price of firewood could be the opportunitycost of firewood collection time. When the wage rate of hired farm workers increases, theopportunity cost of collecting firewood also goes up for the rural agricultural economy, thusdrawing labor away from firewood collection. For the firewood self-sufficient households, theincreased productivity of agricultural labor (in terms of the higher wage rate) leads to reducefirewood collection (Palmer and MacGregor, 2009). In our data set, a sub-sample of 757households hired female farm workers paying cash or in-kind wages. We use the wage rate ofthese hired female farm workers as the opportunity cost of firewood collection in our analysis.Table 3 presents summary statistics of this sub-sample by stove-type.
6. Results and Discussions
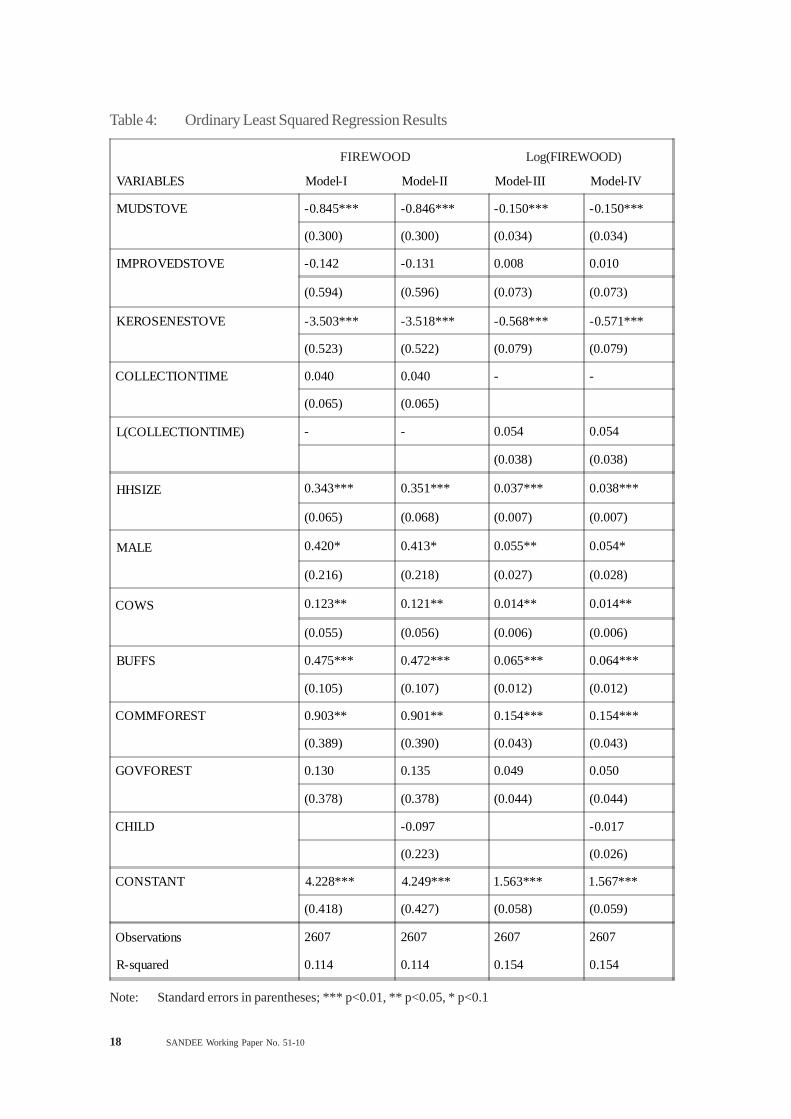
In this section, we present and discuss the regression results. In our model, we use the dependentvariable, FIREWOOD, in two different ways: in level (Table 4) and in logs (Tables 5 – 7).Similarly, we use COLLECTIONTIME in level (Table 4) as well as in logs (Table 5 and Table 7)in order to see how sensitive the results are to the choice of the functional forms.
We estimate ordinary least squared (OLS), two-stage least squared (2SLS), and random effect(RE) models in order to see whether the results are sensitive to a particular estimation method.Firewood collection time could be endogenous (Palmer and MacGregor, 2009). The best wayto confirm such endogeneity issue is to perform the Hausman specification test. However, theNLSS data are collected using a two-stage stratified sampling method where our observationsare clustered within the primary sampling units (PSU). These PSUs are selected based on theprobability proportional to size (PPS) (CEB, 2004). While the Hausman specification test requiresone of the estimators to be efficient, such clustered and p-weighted (or PPS) sample observationsviolate the requirements for the Hausman specification test (StataCorp, 2009).
Another issue is the difficulties in finding convincing exclusion restrictions (i.e., good instruments)in the data set for the COLLECTIONTIME that are not correlated with FIREWOOD demand.Therefore, we estimate alternative models using the wage rate of hired female farm workers(FEMALEWAGE) as a proxy of the opportunity cost of collection time. This wage rate of hiredfarm workers is exogenous to the households who hire such labor. This alternative comes, however,with a significant cost in terms of smaller sample size of 757 observations, but it is worth doing tofind the sensitivity of our resutls. Earlier, with the COLLECTIONTIME as a proxy of the unitprice of firewood, the sample size was 2607 observations.
Ordinary Least Squared Results
Table 4 displays the regression results where the dependent variable, FIREWOOD, is in level.The first two columns (Model-I and Model-II) display the results from the Ordinary Least Squares(OLS) regression where the signs of the coefficients of all stove categories (mud, improved andkerosene) are negative. While estimating these models, we also take into account the clusteringand weighting issues of the NLSS data. The results indicate that households that use the mudstove, the improved stove or the kerosene stove demand less firewood as compared to thetraditional open-fire stove users. The results also indicate that the IMPROVEDSTOVE iscomparatively less effective in terms of reducing firewood demand as the coefficient of the improved
SANDEE Working Paper No. 51-10 9
stove is smaller than the coefficients of other stove types. Additionally, the coefficient of theimproved stove is insignificant indicating that households with the improved stoves or open-firestoves may use statistically comparable amount of firewood per month, ceteris paribus.
Results in Table 4 indicate that a household with the MUDSTOVE could consume 0.85 bhariless firewood per month, or over 10 bharis less firewood in a given year compared to a householdwith the traditional open-fire stove. In the case of the KEROSENESTOVE, the monthly firewoodsaving by a household is about 3.5 bharis per month or about 42 bharis per year on an average.An interesting result here is the sign of the coefficient of firewood COLLECTIONTIME. As aproxy of firewood price, its coefficient is expected to be negative. Though not significant, it ispositive. This result, however, is consistent with some other studies (e.g., Malla, 2009). Such apositive price effect indicates that the firewood could be a Giffen good where the demand curveslopes upward. The positive sign of the coefficient of firewood collection time indicates that forthe self-sufficient firewood user households from rural Nepal, no cheaper substitutes are availablefor firewood that they can use when the collection time gets higher.6
As expected, household size has a positive and significant effect on firewood consumption. Othervariables with positive and significant coefficients are the number of cows and buffalos thathouseholds have. The positive coefficient of community forest indicates that households collectmore firewood from the community forests as compared to what they do collect from the privateor the other forests. This is expected as the one of the main objectives of the community forestryin Nepal is to increase the availability of the forest products, such as firewood, to the localcommunities (Kanel, 2004).
For the robustness check, we added CHILD, an indicator variable for the presence of a belowsix years old child in the family. Since firewood collection in Nepal is done mostly by women(Amacher, 1993), the presence of a young child may limit their ability to go out and collect morefirewood. As expected, the sign of the coefficient of CHILD is negative. The signs and thesignificance of the coefficients of other variables in Model-I and Model-II do not change whileadding this new variable, CHILD.
While the coefficient of COLLECTIONTIME is positive we expect firewood collection time toact as a brake on firewood collection after a certain point. In other words, we expect a non-linear relationship between firewood collection time and firewood demand. One way of addressingthis issue is to get log transformation of these variables. So, we replace COLLECTIONTIMEwith its log transformation in Model-III and Model-IV. After such changes, the results arecomparable with the first two models except that the sign of the coefficient of theIMPROVEDSTOVE is now positive, but still insignificant. These results indicate that on averagethe MUDSTOVE could save about 15% firewood while the KEROSENESTOVE could saveup to 58% firewood compared to the traditional open-fire stove. However, households with theIMPROVEDSTOVE and open-fire stoves could consume comparable amount of firewood asthere is no significant difference in firewood demand between mud-stove user and improvedstove user households.
6 An alternative explanation for the positive sign of the coefficient of the collection time is that in Nepal,underemployment rate is very high. Results from the recent labor force survey (CBS, 2009) indicate thatamong the employed, only 68% workers worked 40 hours and more in 2008. When collection time in-creases, household may use additional labor time (as the opportunity cost of the surplus time is negli-gible) and more effort to collect firewood so that they may wind up collecting more firewood.
10 SANDEE Working Paper No. 51-10
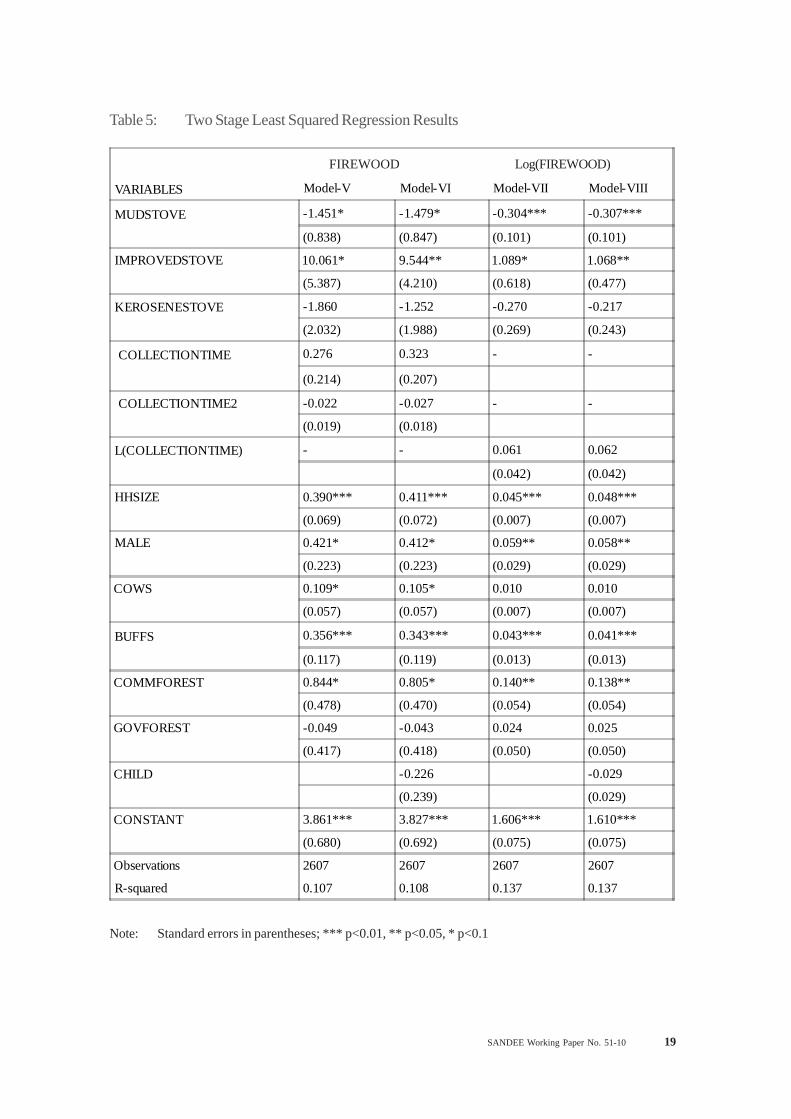
Two Stage Least Squared Results
As discussed earlier, the type of stove households use may be endogenously determined dependingupon the availability of firewood. If firewood is abundant, households may use open-fire stove,and if no or less firewood is available then family may use some other alternatives, such as,improved stoves or kerosene stoves. We use a two-stage (instrumental variable) estimationapproach to address the issue of endogeneity.
As discussed earlier, the choice of the instruments is based on the premise that stove adoptionmay depend on cultural factors (Brahmin/Chhetri), location of households (mountain/hills), theknowledge on available options, the benefits of using alternative stove types and the harmfuleffects of the indoor air pollution (education); and the link to the urban centers and beyond interms of remittance flow. As we have four different types of stoves, we use ordered logit for thefirst-stage regression.
We test the exclusion restriction for the proposed set of instruments as follows. First, we runregression of FIREWOOD on all explanatory variables plus the set of instruments by stove types(open-fire stove and mud-stove, two widely used stove types). Second, we test the jointhypothesis that the set of instruments has no joint significant effect on FIREWOOD demand. Aswe estimate four 2SLS models (see Table 5), we perform the joint significant tests for all fourcases. The F-statistic ranges from 0.55 to 1.77 with p-value 0.17 to 0.69 indicating that there isnot enough statistical evidence to reject the null hypothesis that the set of instruments has nosignificant effect on household level firewood demand.
Results from the 2SLS regressions are presented in Table 5. While comparing these results withthe OLS results from Table 4, we can see that after instrumenting the types of stove, the coefficientof the MUDSTOVE becomes bigger with negative sign, while the coefficient of theIMPROVEDSTOVE also becomes bigger but with positive sign. These results indicate that, onaverage, households with the IMPROVEDSTOVE are using more firewood than householdswith the open-fire, or the mud stoves. This result may seem counter intuitive but it actuallyconfirms what some of the researchers have been reporting on the inefficiency of the improvedstoves with regard to fuel-wood consumption and cooking time (see McCracken and Smith,1998).
Other results in Table 5 are mostly consistent with the results from the OLS estimates (see Table4). The signs of the coefficients of the COLLECTIONTIME (Models-V and VI) and thelog(COLLECTIONTIME) are stable. As expected, the sign of the COLLECTIONTIME squaredis negative, indicating that when collection time goes beyond 12 hours (0.276/0.022) for onebhari of firewood, households may start switching to other fuels. Given that the average collectiontime for firewood self-sufficient households is less than four hours in our sample, the turning pointseems to be quite far, meaning that those households would continue to collect firewood forhousehold energy conditional on other control factors.
As before, the coefficient of community forest is positive and significant. After correcting forendogeneity, the effect of the presence of children below six years of age is still stable but notstrong enough to draw any definite inference. The results are mostly stable with alternative modelspecifications.
SANDEE Working Paper No. 51-10 11
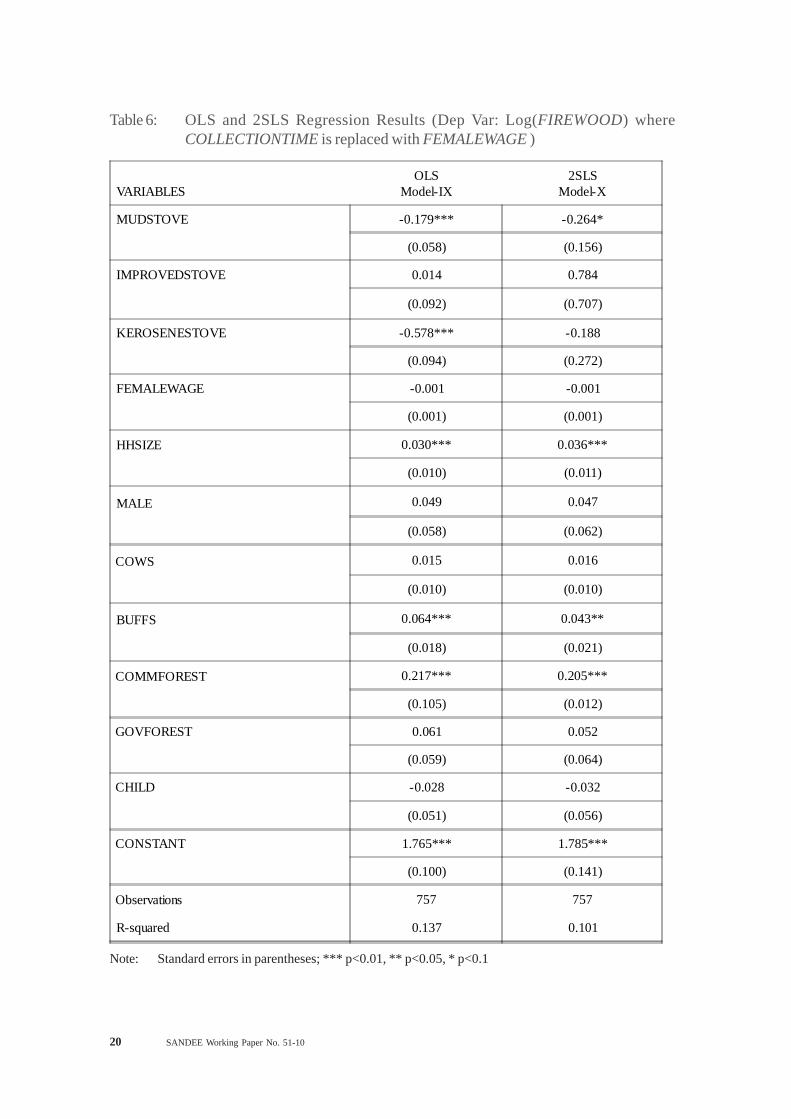
Alternative Measure of Opportunity Cost
So far, we use the time taken to collect one unit of firewood as a proxy measure of the unit priceof firewood. However, a better measure of a unit price of firewood would be the opportunitycost of collection time. This opportunity cost could be the wage rate of the person in alternativeactivity who collects firewood. The NLSS data do not provide information on who actuallycollects firewood, but Amacher (1993) and Khare et al. (2000) find that firewood scarcityresults into increased labor burden on women. This indicates that women may be the ones whomostly collect firewood.
In the NLSS data, a small sub-sample of households hired female farm workers for agriculturalactivities. We utilize this information as a proxy measure of the opportunity cost of firewoodcollection time. As an individual household has no control over the wage rate of the hired femalefarm workers, we treat this variable as exogenous.
Table 6 reports the OLS and 2SLS results where collection time is replaced by the wage rate ofthe hired female farm workers. Again, these results are mostly consistent with earlier ones. FromTable 6, we can see that the MUDSTOVE user households would consume 18% - 27% lessfirewood while the IMPROVEDSTOVE user households may consume 78% more firewoodcompared to households that use open-fire stoves. The sign of the coefficient of theFEMALEWAGE is negative but not significant. Other results are mostly comparable to what wediscussed earlier.
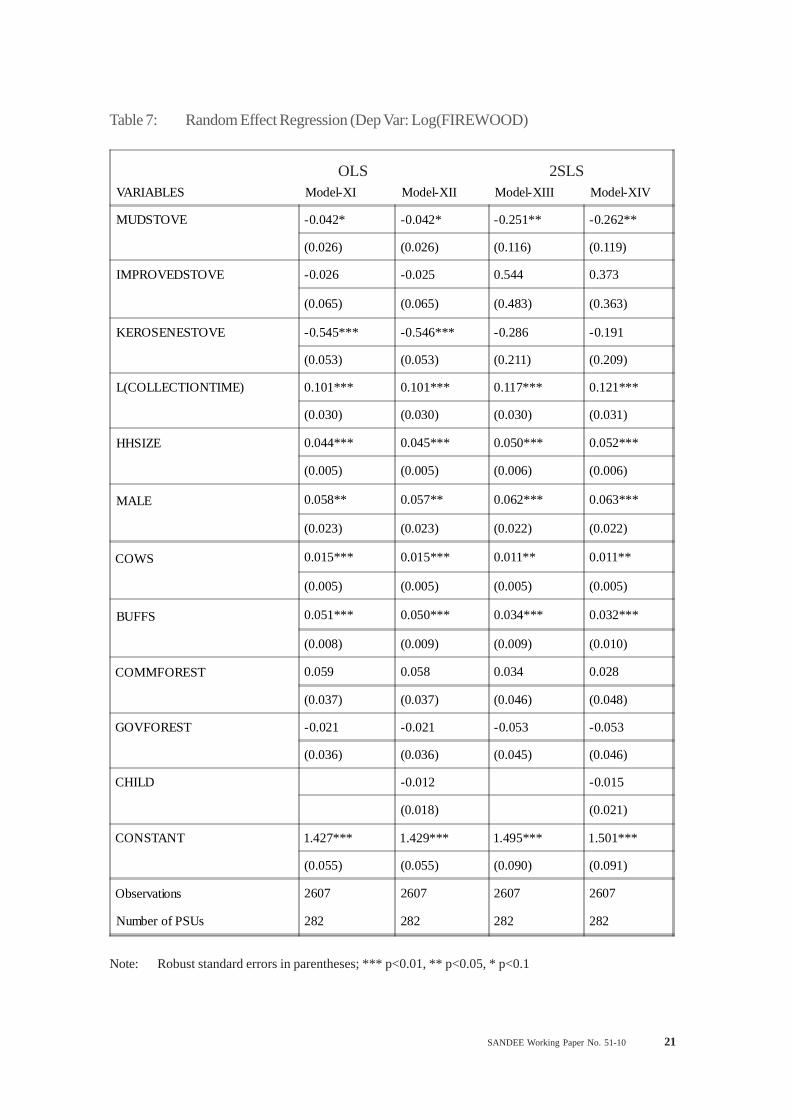
Random Effect Estimates
As an alternative to the simple OLS and the 2SLS estimation methods, we also use the randomeffect estimator. Our interest here is to examine whether we could get the comparable resultsfrom such alternative estimation. The choice of the random effect estimation is based on theargument that in the two-stage stratified sampling, 326 primary sampling units are chosen randomlyout of over 36,000 potential units across the country for the NLSS (CBS, 2004).
Table 7 presents the results from the random effect estimator. In terms of the right hand sidevariables, these results are comparable to Models III and IV in Table 4, and Models VII andVIII in Table 5. In all respects these results are mostly consistent with what we have discussedearlier. The coefficient of MUDSTOVE is negative and significant across all models, while thecoefficient of IMPROVEDSTOVE is positive and insignificant in statistical terms; but it is largerthan the coefficient of MUDSTOVE in 2SLS models. In practical terms, we can see that householdsthat use mud-stove could consume up to 25% less firewood in an average, whereas improvedstove user households could consume over 37% more firewood compared to the open-firestove user households see Model XIV).
7. Conclusion
This paper analyzes the effect of stove-type on firewood consumption at the household level inNepal. Using nationally representative household survey data from Nepal, we find that the typeof stove significantly affects firewood demand for household uses. For this analysis, we use asub-sample of firewood user households from the NLSS survey that collect and use firewoodfor household energy. Our results are somewhat unexpected. More specifically, contrary to the
12 SANDEE Working Paper No. 51-10
common belief regarding the efficiency of improved stoves, we find that households with theimproved stoves may use more firewood than households with the traditional mud stove or theopen-fire stove. This issue, however, needs further investigation to arrive at a definite conclusionsince only 2% of households were using improved stoves during the survey year in our data set.One possible explanation of why the improved stove user households may consume more firewoodthan the traditional open-fire stove or the mud stove users could be the rebound effect as in Zein-Elabdin (1997).7 For example, when the improved stoves reduce firewood demand in the firstplace, it would lower the shadow price of firewood. A lower shadow price could in turn prompthouseholds to consume more firewood. An alternative explanation would be that the improvedstoves mostly come with attached chimneys that help reduce the amount of smoke in the house.Traditionally, the chimney is not a part of the open-fire or the traditional mud stoves in Nepal. Asthe smoke level declines due to the chimney (Malla, 2009), household members may feel betterin terms of health benefits. Consequently, they may either keep their stove running for longerhours to keep the house warm or cook more frequently requiring more firewood.
Our results indicate that in the presence of a rebound effect and given existing improved stovetechnology, if we want to reduce demand for firewood the short term solution is to replace open-fire stoves with mud stoves. This switching of stove from open-fire to mud stove would be quiteacceptable as about 56% of the households are already using the mud stoves. Such replacementof the open-fire traditional stove with the mud stove does not require any heavy investment sinceit can be done with simple and locally available technology. While switching from open-fire tomud stove, adding smoke-hood or chimney would help address indoor air pollution problems(Malla, 2009) but it might generate the rebound effect (see Roy, 2000). We wish to reiterate thatour intension here is not to ignore negative externalities such as IAP or the GHG emissions andrelated climate change issues from burning firewood in traditional stoves. Our suggestion is justa short term measure that could potentially reduce firewood demand, and in the long term, thefirst best option would be to make cleaner fuels or gasifier more accessible to the rural people.
8. Acknowledgements
The authors wish to acknowledge the Central Bureau of Statistics of Nepal and Nepal StudyCenter at UNM for providing Nepal Living Standard Survey (2003/04) data.
7 For a recent review on the rebound effect on energy use, see Sorrell et al. (2009).
SANDEE Working Paper No. 51-10 13
References
Amacher, G. S., W. F. Hyde, and B. R. Joshee (1992), 'The Adoption of Consumption Technologyunder Uncertainty: A Case of Improved Stoves in Nepal,' Journal of Economic Development17(2): 93-105.
Amacher, G. S., W. F. Hyde, and B. R. Joshee (1993), 'Joint production and consumption intraditional households: fuelwood and crop residues in two districts of Nepal,',Journal ofDevelopment Studies 30: 206-225.
Arnold, J.E.M, Gunnar Kohling, and Reidar Persson (2006), 'Woodfuels, Livelihoods, and PolicyInterventions: Changing Perspectives,' World Development 34 (3): 596-611.
Bajracharya, Deepak (1983), 'Deforestation in the Food/Fuel Context: Historical and PoliticalPerspectives from Nepal,' Mountain Research and Development 3 (3): 227-240.
Barnes, D. F., K. Openshaw, K. R. Smith, and R. van der Plas (1993), 'The Design and Diffusionof Improved Cooking Stoves,' The World Bank Research Observer 8(2): 119-141.
Barnes, D. F., K. Openshaw, K. R. Smith, and R. van der Plas (1994), 'What Makes PeopleCook with Improved Biomass Stoves?' World Bank Technical Paper 242.
Bazile, D. (2001), 'Improved Stoves for Preventing Deforestation: Myth or Reality?' BoilingPoint 46: 33-34.
CBS (1996), Nepal Living Standards Survey Report 1996 Vol I, Kathmandu: Central Bureau ofStatistics.
CBS (2004), Nepal Living Standards Survey 2003/04, Statistical Report Vol I and II, Kathmandu:Central Bureau of Statistics.
CBS (2009), Executive Summary, Nepal Labor Force Survey, 2009, Kathmandu: Central Bureauof Statistics.
Chengappa, C., R. Edwards, R. Bajpai, K. N. Shields and K. R. Smith (2007), 'Impact ofImproved Cook-stoves on Indoor air Quality in the Bundelkhand Region in India,' Energy forSustainable Development XI (2): 33-44.
Clemens, Elisabeth, Kamal Rijal, and Minoru Takada (2010), Capacity Development for ScalingUp Decentralized Energy Access Programmes: Lessons from Nepal on its role, costs, andfinancing, Practical Action Publishing Ltd, Warwickshire, UK.
Cooke, Priscilla, Gunnar Kohlin, and Willim F. Hyde (2008), 'Fuelwood, forests and communitymanagement -evidence from household studies,' Environment and Development Economics 13:103-135.
Edwards, R. D., K. R. Smith, J. Zhang, and Y. Ma, (2004), 'Implications of Changes in HouseholdStoves and Fuel use in China,' Energy Policy 32: 395-411.
14 SANDEE Working Paper No. 51-10
Geist, Helmut J. and Eric F. Lambin (2002), ' Proximate Causes and Underlying Driving Forcesof Tropical Deforestation,' BioScience 52 ( 2): 143-150.
Gustafsson, O., M. Krusa, Z. Zencak, R. J. Sheesley, L. Granat, E. Engstrom, P. S. Praveen, P.S. P. Rao, C. Leck, and H. Rodhe (2009), 'Brown Clouds over South Asia: Biomass or FossilFuel Combustion?' Science 323 (23 January): 495-498.
IPCC (2007), Climate Change 2007: Synthesis Report, An Assessment of the IntergovernmentalPanel on Climate Change.
Kanel, Keshab Raj (2004), 'Twenty Five Years' of Community Forestry: Contribution to MillenniumDevelopment Goals,' Department of Forest, Government of Nepal.
Khare, A., M. Sarin, N. Saxena, S. Palit, S. Bathla, F. Vania, and M. Satyanarayana (2000),'Joint forest management: Policy, practice, and prospects, Policy that works for forests andpeople,' Series 3, World Wide Fund for Nature-India, New Delhi and International Institute forEnvironment and Development, London.
Kohlin, Gunnar and Peter J. Parks (2001), 'Spatial Variability and Disincentives to Harvest:Deforestation and Fuelwood Collection in South Asia,' Land Economics 77 (2): 206-218.
Makame, M. O. (2007), 'Adoption of Improved Stoves and Deforestation in Zanzibar,'Management of Environmental Quality 18(3): 353-365.
Malla, M B (2009), 'Revisiting the Need for Improved Stoves: Estimating Health, Time andCarbon Benefits,' SANDEE Working Paper (forthcoming), The South Asian Network forDevelopment and Environmental Economics, Kathmandu.
Masera, O. , R. Edwards, C. A. Arnez, V. Berrueta, M. Johnson, L. R Bracho, H. Rioja-Rodriguez, K. R. Smith (2007), 'Impact of Patsari Improved Cookstoves on Indoor Air Qualityin Michoacan, Mexico,' Energy for Sustainable Development XI (2): 45-56.
McCracken, J. P., and K. R. Smith (1998), 'Emissions and Efficiency of Improved WoodburingCookstoves in Highland Guatemala,' Environmental International 24 (7): 739-747.
Pant, K P (2008), 'Estimating Health Benefits when Behaviors are Endogenous: A Case of IndoorAir Pollution in Rural Nepal,' SANDEE Working Paper 34-08, The South Asian Network forDevelopment and Environmental Economics, Kathmandu.
Practical Action (2009), Inventory of Innovative Indoor Air Pollution Alleviating Technologies InNepal, Kathmandu: Practical Action.
Roy, Joyashree (2000), 'The rebound e!ect: some empirical evidence from India,' Energy Policy28: 433-438.
Sinton, Jonathan E., Kirk R. Smith, John W. Peabody, Liu Yaping, Zhang Xiliang, Rufus Edwards,and Gan Quan (2004), 'An assessment of programs to promote improved household stoves inChina,' Energy for Sustainable Development VIII (3): 33-52.

SANDEE Working Paper No. 51-10 15
Sorrell, Steve, John Dimitropoulos, and Matt Sommerville (2009), ‘Empirical estimates of thedirect rebound effect: A review,’ Energy Policy 37: 1356–1371.
StataCorp (2009), Stata: Release 11. Statistical Software. College Station, TX: StataCorp LP.
Zein-Elabdin, E. O. (1997), ‘Improved Stoves in Sub-Saharan Africa: The Case of the Sudan,’Energy Economics 19: 465-475.
16 SANDEE Working Paper No. 51-10
LIST of TABLES
Table 1: Variable Definition and Descriptive Statistics
VARIABLES Definition Mean SD Min Max
FIREWOOD Amount of firewood collection permonth (number of bhari) 6.92 4.6 1 40
COLLECTIONTIME Time to collect one bhari of firewood(hr) 3.67 2.1 0.02 13
OPENFIRESTOVE 1 if household has open-fire stove 0.38 0.49 0 1
MUDSTOVE 1 if household has mud stove 0.56 0.5 0 1
IMPROVEDSTOVE 1 if household has improved stove 0.02 0.15 0 1
KEROSENESTOVE 1 if household uses kerosene or gasstove 0.04 0.19 0 1
HHSIZE Household size 5.31 2.52 1 32
MALE 1 if household head is male 0.8 0.4 0 1
COWS Number of cows household has 2 2.39 0 25
BUFFS Number of buffalos a household has 1 1.28 0 14
COMMFOREST 1 if the household collects firewoodfrom community forest 0.31 0.46 0 1
GOVFOREST 1 if the household collects firewoodfrom government forest 0.31 0.46 0 1
CHILD 1 if the household has a child below 6years old 0.55 0.50 0 1
FEMALEWAGE Wage rate (hired female labor) (Rs) 60.6 25.4 9.3 150
REMIT_RECEIVED 1 if the household received remittance 0.33 0.47 0 1
BAHUNCHHETRI 1 if household belongs to Bhramin orChhetri 0.32 0.46 0 1
EDUCATION Years of schooling of household head 2.36 3.69 0 17
HILLMOUNTAIN 1 if the household lives in mountain orhilly region 0.61 0.49 0 1
Note: bhari is a local unit of firewood measurement, where 1 bhari = 30 kgs (average); no. of observations= 2607. This sub-sample includes households who collect and use firewood. We have excluded afew households who collected more than 2 bhari of firewood per day as outliers.
Source: Nationally representation household survey data collected by the Central Bureau of Statistics,Nepal, popularly known as the Nepal Living Standard Survey, 2004.
SANDEE Working Paper No. 51-10 17
Table 2: Distribution of Household Level Variables by Stove Types (N = 2607)
Mean SD Mean SD Mean SD Mean SD
FIREWOOD 7.67 4.11 6.68 4.97 7.47 3.46 4.16 3.51
COLLECTIONTIME 4.31 1.49 4.18 1.60 4.06 1.48 3.53 1.63
HHSIZE 5.06 2.33 5.59 2.77 4.97 1.53 4.94 1.99
MALE 0.78 0.42 0.81 0.39 0.82 0.39 0.76 0.43
COWS 2.37 2.67 1.78 2.17 1.99 2.39 1.32 1.90
BUFFS 1.24 1.40 0.82 1.18 1.44 1.45 1.69 1.47
CHILD 0.53 0.50 0.57 0.49 0.63 0.49 0.35 0.48
GOVFOREST 0.39 0.49 0.26 0.44 0.32 0.47 0.12 0.33
COMMFOREST 0.34 0.47 0.28 0.45 0.26 0.44 0.37 0.48
REMIT_RECEIVED 0.32 0.47 0.35 0.48 0.35 0.48 0.33 0.47
BAHUNCHHETRI 0.31 0.46 0.27 0.44 0.47 0.5 0.60 0.49
EDUCATION 1.80 3.15 2.29 3.62 4.54 4.90 5.77 5.06
HILL_MOUNTAIN 0.86 0.35 0.37 0.48 0.87 0.34 0.62 0.49
Source: See Table 1
Table 3: Distribution of Variables by Stove Type for the Households Hiring Female FarmWorkers (N = 757)
Variable Open-fire Stove Mud Stove Improved Stove Gas/KeroseneStove
Source: See Table 1.
Mean SD Mean SD Mean SD Mean SD
FIREWOOD 8.18 4.44 7.08 5.60 8.06 3.40 4.42 3.54
COLLECTIONTIME 3.45 1.83 3.47 2.30 2.95 1.66 3.47 2.58
HHSIZE 5.00 2.39 6.06 3.12 4.90 1.15 5.2 2.10
MALE 0.78 0.42 0.89 0.31 0.79 0.41 0.77 0.43
COWS 2.46 3.13 2.15 2.18 2.13 2.20 1.39 1.83
BUFFELOWS 1.55 1.38 1.16 1.32 2.13 1.43 2.10 1.69
CHILD 0.49 0.50 0.56 0.50 0.64 0.49 0.33 0.47
GOVFOREST 0.21 0.41 0.17 0.38 0.12 0.34 0.10 0.30
COMMFOREST 0.33 0.47 0.24 0.43 0.32 0.48 0.37 0.49
REMIT_RECEIVED 0.37 0.48 0.35 0.48 0.36 0.49 0.35 0.48
BAHUNCHHETRI 0.46 0.50 0.31 0.46 0.56 0.51 0.60 0.49
EDUCATION 2.81 3.82 3.56 4.25 5.07 5.04 6.65 4.62
HILL_MOUNTAIN 0.88 0.33 0.33 0.47 0.92 0.28 0.60 0.49
Variable Open-fire Stove Mud Stove Improved Stove Gas/KeroseneStove
18 SANDEE Working Paper No. 51-10
VARIABLES Model-I Model-II Model-III Model-IV
MUDSTOVE -0.845*** -0.846*** -0.150*** -0.150***
(0.300) (0.300) (0.034) (0.034)
IMPROVEDSTOVE -0.142 -0.131 0.008 0.010
(0.594) (0.596) (0.073) (0.073)
KEROSENESTOVE -3.503*** -3.518*** -0.568*** -0.571***
(0.523) (0.522) (0.079) (0.079)
COLLECTIONTIME 0.040 0.040 - -
(0.065) (0.065)
L(COLLECTIONTIME) - - 0.054 0.054
(0.038) (0.038)
HHSIZE 0.343*** 0.351*** 0.037*** 0.038***
(0.065) (0.068) (0.007) (0.007)
MALE 0.420* 0.413* 0.055** 0.054*
(0.216) (0.218) (0.027) (0.028)
COWS 0.123** 0.121** 0.014** 0.014**
(0.055) (0.056) (0.006) (0.006)
BUFFS 0.475*** 0.472*** 0.065*** 0.064***
(0.105) (0.107) (0.012) (0.012)
COMMFOREST 0.903** 0.901** 0.154*** 0.154***
(0.389) (0.390) (0.043) (0.043)
GOVFOREST 0.130 0.135 0.049 0.050
(0.378) (0.378) (0.044) (0.044)
CHILD -0.097 -0.017
(0.223) (0.026)
CONSTANT 4.228*** 4.249*** 1.563*** 1.567***
(0.418) (0.427) (0.058) (0.059)
Observations 2607 2607 2607 2607
R-squared 0.114 0.114 0.154 0.154
Table 4: Ordinary Least Squared Regression Results
Note: Standard errors in parentheses; *** p<0.01, ** p<0.05, * p<0.1
FIREWOOD Log(FIREWOOD)
SANDEE Working Paper No. 51-10 19
VARIABLES Model-V Model-VI Model-VII Model-VIII
MUDSTOVE -1.451* -1.479* -0.304*** -0.307***
(0.838) (0.847) (0.101) (0.101)
IMPROVEDSTOVE 10.061* 9.544** 1.089* 1.068**
(5.387) (4.210) (0.618) (0.477)
KEROSENESTOVE -1.860 -1.252 -0.270 -0.217
(2.032) (1.988) (0.269) (0.243)
COLLECTIONTIME 0.276 0.323 - -
(0.214) (0.207)
COLLECTIONTIME2 -0.022 -0.027 - -
(0.019) (0.018)
L(COLLECTIONTIME) - - 0.061 0.062
(0.042) (0.042)
HHSIZE 0.390*** 0.411*** 0.045*** 0.048***
(0.069) (0.072) (0.007) (0.007)
MALE 0.421* 0.412* 0.059** 0.058**
(0.223) (0.223) (0.029) (0.029)
COWS 0.109* 0.105* 0.010 0.010
(0.057) (0.057) (0.007) (0.007)
BUFFS 0.356*** 0.343*** 0.043*** 0.041***
(0.117) (0.119) (0.013) (0.013)
COMMFOREST 0.844* 0.805* 0.140** 0.138**
(0.478) (0.470) (0.054) (0.054)
GOVFOREST -0.049 -0.043 0.024 0.025
(0.417) (0.418) (0.050) (0.050)
CHILD -0.226 -0.029
(0.239) (0.029)
CONSTANT 3.861*** 3.827*** 1.606*** 1.610***
(0.680) (0.692) (0.075) (0.075)
Observations 2607 2607 2607 2607
R-squared 0.107 0.108 0.137 0.137
Table 5: Two Stage Least Squared Regression Results
Note: Standard errors in parentheses; *** p<0.01, ** p<0.05, * p<0.1
FIREWOOD Log(FIREWOOD)
20 SANDEE Working Paper No. 51-10
Table 6: OLS and 2SLS Regression Results (Dep Var: Log(FIREWOOD) whereCOLLECTIONTIME is replaced with FEMALEWAGE )
Note: Standard errors in parentheses; *** p<0.01, ** p<0.05, * p<0.1
VARIABLESOLS
Model-IX2SLS
Model-X
MUDSTOVE -0.179*** -0.264*
(0.058) (0.156)
IMPROVEDSTOVE 0.014 0.784
(0.092) (0.707)
KEROSENESTOVE -0.578*** -0.188
(0.094) (0.272)
FEMALEWAGE -0.001 -0.001
(0.001) (0.001)
HHSIZE 0.030*** 0.036***
(0.010) (0.011)
MALE 0.049 0.047
(0.058) (0.062)
COWS 0.015 0.016
(0.010) (0.010)
BUFFS 0.064*** 0.043**
(0.018) (0.021)
COMMFOREST 0.217*** 0.205***
(0.105) (0.012)
GOVFOREST 0.061 0.052
(0.059) (0.064)
CHILD -0.028 -0.032
(0.051) (0.056)
CONSTANT 1.765*** 1.785***
(0.100) (0.141)
Observations 757 757
R-squared 0.137 0.101
SANDEE Working Paper No. 51-10 21
Table 7: Random Effect Regression (Dep Var: Log(FIREWOOD)
Note: Robust standard errors in parentheses; *** p<0.01, ** p<0.05, * p<0.1
VARIABLES Model-XI Model-XII Model-XIII Model-XIV
MUDSTOVE -0.042* -0.042* -0.251** -0.262**
(0.026) (0.026) (0.116) (0.119)
IMPROVEDSTOVE -0.026 -0.025 0.544 0.373
(0.065) (0.065) (0.483) (0.363)
KEROSENESTOVE -0.545*** -0.546*** -0.286 -0.191
(0.053) (0.053) (0.211) (0.209)
L(COLLECTIONTIME) 0.101*** 0.101*** 0.117*** 0.121***
(0.030) (0.030) (0.030) (0.031)
HHSIZE 0.044*** 0.045*** 0.050*** 0.052***
(0.005) (0.005) (0.006) (0.006)
MALE 0.058** 0.057** 0.062*** 0.063***
(0.023) (0.023) (0.022) (0.022)
COWS 0.015*** 0.015*** 0.011** 0.011**
(0.005) (0.005) (0.005) (0.005)
BUFFS 0.051*** 0.050*** 0.034*** 0.032***
(0.008) (0.009) (0.009) (0.010)
COMMFOREST 0.059 0.058 0.034 0.028
(0.037) (0.037) (0.046) (0.048)
GOVFOREST -0.021 -0.021 -0.053 -0.053
(0.036) (0.036) (0.045) (0.046)
CHILD -0.012 -0.015
(0.018) (0.021)
CONSTANT 1.427*** 1.429*** 1.495*** 1.501***
(0.055) (0.055) (0.090) (0.091)
Observations 2607 2607 2607 2607
Number of PSUs 282 282 282 282
OLS 2SLS

22 SANDEE Working Paper No. 51-10
�����������
�����������
� ������ ���� � ���� �� �������������������
�� ����� ������������������������������������������ ��� �������������������������������
������������ ���������������������������
��!� ��"�"���#$$$%��! ��"�"���#$ �"��&�!�&�'()�������&��*+,-�.)&��!�///*)�������&��*+,