Embed Size (px)
Citation preview

Deflection Test Results
on D0 RunIIb Stave
Giobatta Lanfranco
Fermi National Accelerator Laboratory
Particle Physics Division / Silicon Engineering Group - Mechanical Dep. e-mail: [email protected]
9 September 2003
1. Abstract
The D0 RunIIb final design stave has been tested to verify its actual mechanical performance. The
effectiveness of four G-11 (fiberglass/epoxy) braces to bridge the two channels has been investigated as
well. All staves have met the goal stiffness for the silicon area. The stave mockups with braces have
shown excellent stiffness in complete agreement with what theoretically calculated.
2. Deflection test
2.1. Test description
Four sapphire bearings glued on carbon fiber plates simulate the stave bulkhead supports. These plates
are mounted on two aluminum blocks interconnected by two 1” OD rods. The whole supporting
structure is glued onto the CMM granite table. Figure 1 illustrates the test setup.
Two different mechanical staves were investigated. Mechanical Stave #1 was initially tested without
braces1. That test indicated that some local deflection and rotation of the C-channels was occurring. A
set of carbon fiber braces was installed at the mid-span of the C-channels to eliminate this unwanted
motion. Mechanical stave #3 was tested after complete assembly with G-11 braces. The G-11 material
was preferred over carbon fiber for electrical reasons (an enclosed conductive tube would act as a
1 Small strips used to interconnect the upper and lower flanges of the channels, also called bridges.
FERMILAB-TM-2300-E

Fermi National Accelerator Laboratory Giobatta Lanfranco Silicon Engineering Group - Mechanical Dep.
2
transformer to transfer noise to the silicon enclosed within it). G-11 performs similarly to G-10/FR4
(Table 2 G-11 reports its properties) and has the advantage that it does not contain any flame retardant2.
Four brass pieces with masses of 144.0 - 144.4 gr were used for the load test. The load was applied at
the mid-span on the stave, directly on the silicon for mechanical stave #1 with carbon fiber bridges, but
on top of channel flanges in the other two cases. The load test steps are summarized in Table 1. The
purpose of step 2 was to have the stave well settled in the supporting bearing. The stave was unloaded
and measured before applying any subsequent load with the intention to find out whether the structure
behaved elastically or not and to investigate if there was a shear component to the deflection.
Figure 1 – The deflection test setup.
2 Flame retardants have two disadvantages: they contain heavy elements that lower the radiation length of the material and
contain ions which, once liberated under irradiation, may migrate into the silicon damaging it or attack the aluminum wire
bonds connecting the electronics to the sensors.

Fermi National Accelerator Laboratory Giobatta Lanfranco Silicon Engineering Group - Mechanical Dep.
3
Figure 2 – Detail of the G11 bridges on mechanical stave #3.
STEP Load Condition Concentrated mass [grams]
1 No load - 2 3M 433.1 3 No load - 4 2M 288.8 5 No load - 6 3M 433.1 7 No load - 8 4M 577.1 9 No load -
Table 1 – Deflection test load steps
A total of 11 points were measured at each stave section, with 34 sections taken along the 600 mm
length of the stave. In Figure 3 the points are sketched with the same symbols used in the charts of
Figure 4 through Figure 6. Green and red colors are used for left and right channels, respectively, while
blue points are measurements taken on the silicon surface.

Fermi National Accelerator Laboratory Giobatta Lanfranco Silicon Engineering Group - Mechanical Dep.
4
Figure 3 –A total of 11 points has been measured at each stave section. The same shape and color of the points appear on each charts (for clarity this illustration has been anyway reported on each graph). Green and red colors are used for left and right channels respectively, blue for the sensors. Points at similar locations have similar shape.
2.2. Deflection test results
The target bending stiffness of the RunIIb stave is 69.9 N×m2, equivalent to a sag of 60 µm under its
own mass and the mass of electrical cables and coolant. The projected deflection of such a stave in the
various loading conditions is drawn in Figure 4 through Figure 6 with a green solid line.
Based on the channel carbon fiber laminate properties and the stave geometry, a theoretical estimate of
the bending performance of the effective stave has been calculated as well and found equal to 91.96
N×m2. In Figure 4 through Figure 6 the black dotted line represents the strain the real stave is expected
to undergo.
In Figure 4 the deflections of the mechanical stave #1 without bridges are charted. Despite the non
uniform channel behaviour, the measured bending stiffness on the silicon area is 69.1 N×m2,
comparable with the target stiffness; this translates in a maximum deflection of the sensor area of
60.5µm for the case of stave simply supported under its own weight (145gr).
The two bridged mockups performed in excellent agreement with what theoretically estimated. As
expected, the braces effectively carry the shear stresses between the two channels reducing the torque
on the channels in the mid span region. This greatly reduces the flange rotation and induces a more
homogeneous behaviour of the whole structure as it can be seen in Figure 5. The dramatic

Fermi National Accelerator Laboratory Giobatta Lanfranco Silicon Engineering Group - Mechanical Dep.
5
improvement of the mechanical stave #1 performance once that the carbon fiber bridges were glued on
is clearly visible. All points deflected in a more consistent way and the measured bending stiffness of
the whole stave turned out to be 83.9 N×m2 (a 21% increase, i.e. 49.8micron sag for the case of stave
simply supported under its own weight).
Since the two channels must be electrically insulated from each other, glass epoxy G-11 bridges were
tested. Deflection results for load condition 4M are depicted in Figure 6. The slightly higher bending
stiffness of mechanical stave #3 (87.49 N×m2 versus 83.9 N×m2 of stave #1 with carbon fiber braces)
proved that switching the bridges material to G-11 did not compromise the stave performance.
The points measured on the silicon surface under the load condition 3M for the three mockups have
been averaged and plotted in Figure 7 confirming what said so far.
Finally, it can be seen in Figure 8 that before and after the loading test (step 1 and step 9 respectively)
the sensor profile did not retain any significant memory of the load test confirming the good elastic
performance of the stave.
In §4 (Appendix – Theoretical Deflection Calculations) it is possible to find the calculations relative to
what theoretically predicted.

Fermi National Accelerator Laboratory Giobatta Lanfranco Silicon Engineering Group - Mechanical Dep.
6
STAVE DEFLECTION - MECH STAVE #1 wo/ BRIDGES3M
-450
-400
-350
-300
-250
-200
-150
-100
-50
0
0 100 200 300 400 500 600
longitudinal axis [mm]
defle
ctio
n [m
icro
n]
Y=-19 [TOP] Y=-10 [TOP] Y=-6 [TOP] Y=0 [TOP] Y=+6 [TOP]Y=+10 [TOP] Y=+19 [TOP] Y=-19 [BOT] Y=-10 [BOT] Y=+10 [BOT]Y=+19 [BOT] THEORETICAL (69.9Nm²) EXTIM (91.96Nm²) SILICON DATA FIT
EI(measured on SILICON) = 69.1 N*m² = 167.2 lbf*ft²==> 60.5 micron for 145gr stave simply supported
EI(goal) = 69.9 N*m² = 169.1 lbf*ft² ==> 60micron for 145gr stave simply supported
EI(extimated) = 91.96 N*m² = 222.52 lbf*ft²
Figure 4 - Load condition 3M on mechanical stave #1 without bridges. While the silicon sensor surface deflects in a homogeneous way, the channel flanges rotate considerably due to the fact that the absence of a structure bridging the shear stresses from one channel to the other induces a torque on the channel itself3. Despite the non uniform channel behaviour, the measured bending stiffness on the silicon area is 69.1 N×m2, comparable with the target stiffness; this translates in a maximum deflection of the sensor area of 60.5 micron for the case of stave simply supported under its own weight (145gr).
3 The center of torsion of a C shaped section is located outside of the part, i.e. – respect to the web – opposite to its center of
mass.

Fermi National Accelerator Laboratory Giobatta Lanfranco Silicon Engineering Group - Mechanical Dep.
7
STAVE DEFLECTION - MECH STAVE #1 w/ CF BRIDGES4M
-450
-400
-350
-300
-250
-200
-150
-100
-50
0
0 100 200 300 400 500 600
longitudinal axis [mm]
defle
ctio
n [m
icro
n]
Y=-19 [TOP] Y=-10 [TOP] Y=-6 [TOP] Y=0 [TOP] Y=+6 [TOP]Y=+10 [TOP] Y=+19 [TOP] Y=-19 [BOT] Y=-10 [BOT] Y=+10 [BOT]Y=+19 [BOT] THEORETICAL (69.9Nm²) EXTIM (91.96Nm²) DATA FIT
EI(goal) = 69.9 N*m² = 169.1 lbf*ft² ==> 60micron for 145gr stave simply supported
EI(measured) = 83.9 N*m² = 203.0 lbf*ft²==> 49.8 micron for 145gr stave simply supported
EI(extimated) = 91.96 N*m² = 222.52 lbf*ft²
Figure 5 – Load condition 4M on mechanical stave #1 with carbon fiber bridges. The measured bending stiffness of the stave is 83.9 N×m2 which translates in a maximum deflection of 49.8micron for the case of stave simply supported under its own weight (145gr).

Fermi National Accelerator Laboratory Giobatta Lanfranco Silicon Engineering Group - Mechanical Dep.
8
STAVE DEFLECTION - MECH STAVE #3 w/ G-11 BRIDGES4M
-450
-400
-350
-300
-250
-200
-150
-100
-50
0
0 100 200 300 400 500 600
longitudinal axis [mm]
defle
ctio
n [m
icro
n]
Y=-19 [TOP] Y=-10 [TOP] Y=-6 [TOP] Y=0 [TOP] Y=+6 [TOP]Y=+10 [TOP] Y=+19 [TOP] Y=-19 [BOT] Y=-10 [BOT] Y=+10 [BOT]Y=+19 [BOT] THEORETICAL (69.9Nm²) ESTIM (91.96Nm²) DATA FIT
EI(goal) = 69.9 N*m² = 169.1 lbf*ft² ==> 60micron for 145gr stave simply supported
EI(measured) = 87.49 N*m² = 211.7 lbf*ft²==> 47.8 micron for 145gr stave simply supported
EI(estimated) = 91.96 N*m² = 222.52 lbf*ft²
Figure 6 - Load condition 4M on mechanical stave #3 with G11 bridges. The measured bending stiffness of the stave is 87.49 N×m2 which translates in a maximum deflection of 47.8 micron for the case of stave simply supported under its own weight (145gr).
Fermi National Accelerator Laboratory Giobatta Lanfranco Silicon Engineering Group - Mechanical Dep.
9
STAVE DEFLECTION COMPARISON3M
-450
-400
-350
-300
-250
-200
-150
-100
-50
0
0 100 200 300 400 500 600
3M LOAD on Channel - Mech Stave #1 - No/Bridges 3M LOAD on Silicon - Mech Stave #1 - CF Bridges 3M LOAD on Channel - Mech Stave #3 - G11 Bridges
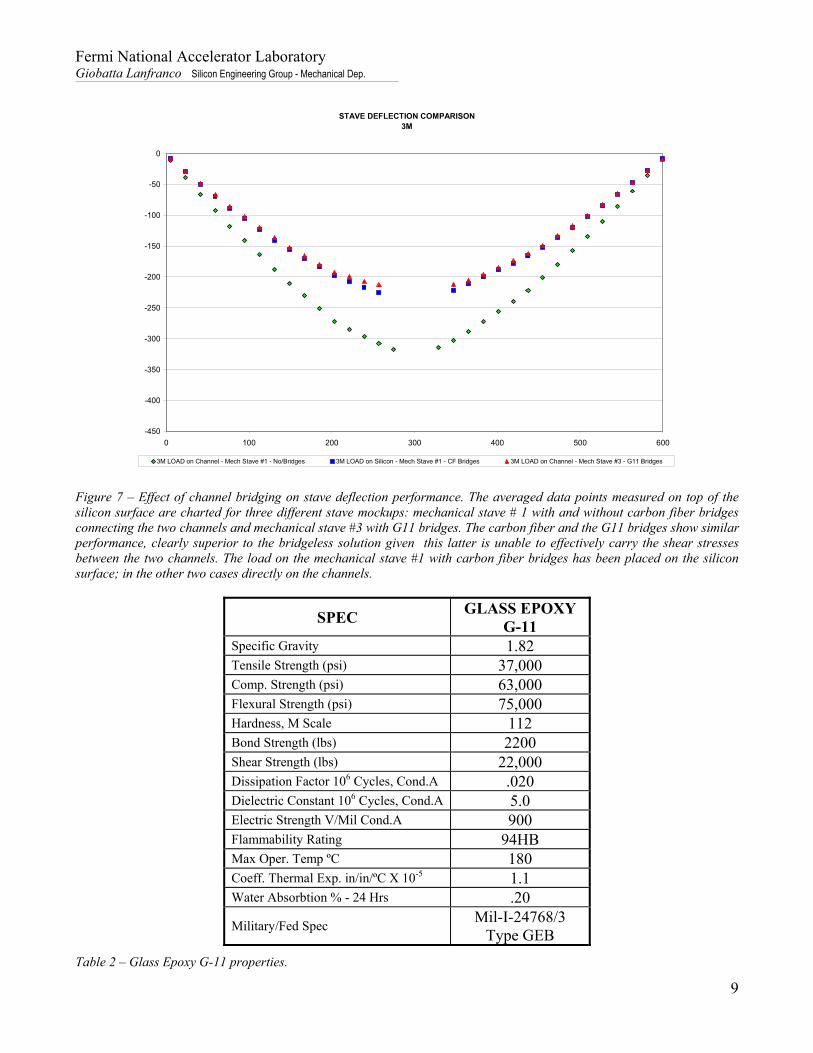
Figure 7 – Effect of channel bridging on stave deflection performance. The averaged data points measured on top of the silicon surface are charted for three different stave mockups: mechanical stave # 1 with and without carbon fiber bridges connecting the two channels and mechanical stave #3 with G11 bridges. The carbon fiber and the G11 bridges show similar performance, clearly superior to the bridgeless solution given this latter is unable to effectively carry the shear stresses between the two channels. The load on the mechanical stave #1 with carbon fiber bridges has been placed on the silicon surface; in the other two cases directly on the channels.
SPEC GLASS EPOXY G-11
Specific Gravity 1.82 Tensile Strength (psi) 37,000 Comp. Strength (psi) 63,000 Flexural Strength (psi) 75,000 Hardness, M Scale 112 Bond Strength (lbs) 2200 Shear Strength (lbs) 22,000 Dissipation Factor 106 Cycles, Cond.A .020 Dielectric Constant 106 Cycles, Cond.A 5.0 Electric Strength V/Mil Cond.A 900 Flammability Rating 94HB Max Oper. Temp ºC 180 Coeff. Thermal Exp. in/in/ºC X 10-5 1.1 Water Absorbtion % - 24 Hrs .20
Military/Fed Spec Mil-I-24768/3 Type GEB
Table 2 – Glass Epoxy G-11 properties.

Fermi National Accelerator Laboratory Giobatta Lanfranco Silicon Engineering Group - Mechanical Dep.
10
Sensor Area Profile - BEFORE LOADING CONDITIONS
-0.050
-0.045
-0.040
-0.035
-0.030
-0.025
-0.020
-0.015
-0.010
-0.005
0.000
0 100 200 300 400 500 600
longitudinal axis [mm]
prof
ile [m
m]
Y=-6 [TOP] Y=0 [TOP] Y=+6 [TOP]
Sensor Area Profile - AFTER LOADING CONDITIONS
-0.050
-0.045
-0.040
-0.035
-0.030
-0.025
-0.020
-0.015
-0.010
-0.005
0.000
0 100 200 300 400 500 600
longitudinal axis [mm]
prof
ile [m
m]
Y=-6 [TOP] Y=0 [TOP] Y=+6 [TOP]
Figure 8 – Longitudinal sensor profile. Each sensor is contained within the vertical grid lines. The good elastic performance of the stave can be seen in the similar sensor profile before and after the loading condition.
3. Summary
The D0 RunIIb final design stave was successfully tested and the measured mechanical performance
proved to be in great agreement with what theoretically predicted. The epoxy glass G-11 braces
confirmed to be effective in minimizing the channel rotation and allowed the stave achieve and exceed
the required stiffness.

Fermi National Accelerator Laboratory Giobatta Lanfranco Silicon Engineering Group - Mechanical Dep.
11
4. Appendix – Theoretical Deflection Calculations
STAVE DEFLECTION This code calculates the goal EI for the stave assuming the sag for 0.013lbf/in is 60 micron and then
compares this goal EI with the actual one and gives an estimate of the sag such actual stave would have
under 0.013lbf/in
micron 0.001mm:=
mils 11000
in⋅:=
channel wall thickness
t 400micron:=
9 plies lay-up 0 ±45 0 0 0 ±45 0
K1392U / BT250E-1
t_laminate=400microns ==> 29.3% resin content by mass
E 2.415 1011× Pa⋅:=
stave length
L 24 in⋅:=
web height (see page 279 notebook 1)
hh 2.5mm:=
distance between mid line flanges
HH 8mm t+:=
flange width
w 14.5mm:=
channel section angle
α 47.5π
180⋅:=
ww w HH hh−( )2tan α( )−
t2
−:=
ww 11.597 mm=
expected stave distributed load
p 145 g⋅ gmL
:=
maximum allowed sag

Fermi National Accelerator Laboratory Giobatta Lanfranco Silicon Engineering Group - Mechanical Dep.
12
yallowed 60micron:=
target bending stiffness
EIref5
384p L4⋅
yallowed⋅:=
EIref 69.905m4Pa=
Section moment of inertia
I 2 112
t⋅ hh3⋅ 2 1
12ww⋅ t3⋅ ww t⋅ HH2
4⋅+
⎛⎜⎝
⎞
⎠⋅+ 2
0
HH hh−2 sin α( )⋅
lhh2
l sin α( )⋅+⎛⎜⎝
⎞⎠
2t⋅
⌠⎮⎮⌡
d⋅+
⎡⎢⎢⎢⎣
⎤⎥⎥⎥⎦
⋅:=
I 380.779 mm4=
Effective bending stiffness
E I⋅ 91.958m4Pa=
percentage bending stiffness increment
EI_rate E I⋅EIref
:=
EI_rate 131.546 %=
expected sag for 0.013lbf/in and simply supported beam
sagexptd5
384p L4⋅
E I⋅⋅:=
sagexptd 45.61micron=
fundamental frequency (formula for elliptical plate)
Kn 9.87:=
fnKn2 π⋅
E I⋅ g⋅
p L4⋅
⋅:=
fn 83.1Hz=
Further Considerations - deflection test
Brass masses and consequent loads
Mbrass1 144.39gm:=
Mbrass2 144.38gm:=
Mbrass3 144.32gm:=
Mbrass4 144.02gm:=

Fermi National Accelerator Laboratory Giobatta Lanfranco Silicon Engineering Group - Mechanical Dep.
13
LOAD1 Mbrass1:=
LOAD21
2
i
Mbrassi∑=
:=
LOAD31
3
i
Mbrassi∑=
:=
LOAD4 Mbrass∑:=
LOAD
0
144.39
288.77
433.09
577.11
⎛⎜⎜⎜⎜⎜⎝
⎞
⎟⎟⎟
⎠
gm=
Deflection of beam left end
yA 0m:=
distance from beam left end of concentrated load
a L2
:=
beam section angles for simply supported beam of target stiffness
θA i( )LOADi− g⋅ a⋅
6EIref L⋅2 L⋅ a−( )⋅ L a−( )⋅:=
Moment at beam left end
MA 0N m⋅:=
Reaction force at beam left end
RA i( )gLOADi
LL a−( )⋅:=
Deflections due to concentrated loading LOADn for simply supported beam of target stiffness and
graphical representation
yconcentrated x n,( ) yA θA n( ) x⋅+MA x2
⋅
2 EIref⋅+
RA n( ) x3⋅
6 EIref⋅+
g LOADn⋅
6 EIref⋅x a−( )3⋅− x a≥( )if
yA θA n( ) x⋅+MA x2
⋅
2 EIref⋅+
RA n( ) x3⋅
6 EIref⋅+ otherwise
:=
x 0mm 1mm, 600mm..:=

Fermi National Accelerator Laboratory Giobatta Lanfranco Silicon Engineering Group - Mechanical Dep.
14
0 0.1 0.2 0.3 0.4 0.5 0.6
3 .10 4
2 .10 4
1 .10 4
0
yconcentrated x 1,( )
yconcentrated x 2,( )
yconcentrated x 3,( )
yconcentrated x 4,( )
x
Simply supported target stiffness beam sag for concentrated LOADn
X 0mm 10mm, 600 mm⋅..:=
n 1 4..:=
theretical_sagn148
LOADng L3⋅
EIref⋅:=
theretical_sag
0
95.596
191.186
286.735
382.087
⎛⎜⎜⎜⎜⎜⎝
⎞
⎟⎟⎟
⎠
micron=
beam section angles for simply supported beam of effective stiffness
θA_eff i( )LOADi− g⋅ a⋅
6E I⋅ L⋅2 L⋅ a−( )⋅ L a−( )⋅:=
Deflections due to concentrated loading LOADn for simply supported beam of effective stiffness
yeff x n,( ) yA θA_eff n( ) x⋅+MA x2
⋅
2 E⋅ I⋅+
RA n( ) x3⋅
6 E⋅ I⋅+
g LOADn⋅
6 E⋅ I⋅x a−( )3⋅− x a≥( )if
yA θA_eff n( ) x⋅+MA x2
⋅
2 E⋅ I⋅+
RA n( ) x3⋅
6 E⋅ I⋅+ otherwise
:=
expected sag for 0.013lbf/in and simply supported beam given the data fitted bending stiffness EI_fit
EI_fit 87.49m4 Pa⋅:=

Fermi National Accelerator Laboratory Giobatta Lanfranco Silicon Engineering Group - Mechanical Dep.
15
expected_sagdata_fit5
384p L4⋅
EI_fit⋅:=
expected_sagdata_fit 47.8micron=
beam section angles for simply supported beam of data fitted stiffness
θA_fit i( )LOADi− g⋅ a⋅
6EI_fit L⋅2 L⋅ a−( )⋅ L a−( )⋅:=
Deflections due to concentrated loading LOADn for simply supported beam of data fitted stiffness
yfit x n,( ) yA θA_fit n( ) x⋅+MA x2
⋅
2 EI_fit⋅+
RA n( ) x3⋅
6 EI_fit⋅+
g LOADn⋅
6 EI_fit⋅x a−( )3⋅− x a≥( )if
yA θA_fit n( ) x⋅+MA x2
⋅
2 EI_fit⋅+
RA n( ) x3⋅
6 EI_fit⋅+ otherwise
:=