Embed Size (px)
Citation preview

OPEN ACCESS
EURASIA Journal of Mathematics Science and Technology Education ISSN: 1305-8223 (online) 1305-8215 (print)
2017 13(7):2883-2896 DOI 10.12973/eurasia.2017.00724a
© Authors. Terms and conditions of Creative Commons Attribution 4.0 International (CC BY 4.0) apply.
Correspondence: Mu Yu Ting, National Formosa University, Taiwan.
Definite Integral Automatic Analysis Mechanism
Research and Development Using the “Find the Area
by Integration” Unit as an Example
Mu Yu Ting National Formosa University, TAIWAN
Received 3 August 2016 ▪ Revised 13 November 2016 ▪ Accepted 22 April 2017
ABSTRACT
Using the capabilities of expert knowledge structures, the researcher prepared test
questions on the university calculus topic of "finding the area by integration.” The quiz is
divided into two types of multiple choice items (one out of four and one out of many). After
the calculus course was taught and tested, the results revealed that the Q matrix of the
second type of multiple choice items (one out of many) is closer to that of the experts
compared with that of the first type of multiple choice items (one out of four). The statistical
information was then analyzed using Bayesian probability analysis methods to establish the
“find the area by integration” unit model as an example of a Bayesian network adaptive
diagnostic test system and to establish how this structure could be used as the foundation
for developing remedial teaching approaches.
Keywords: Bayesian network, DINA model, error type, expert knowledge structure, Q matrix
INTRODUCTION
Regardless of the teaching method used, a general dissatisfaction with calculus courses has
emerged in various countries in the last decade (Tall, 1993). In the UK, a recent report from the
London Mathematical Society acknowledges the difficulty of university mathematics and the
need to reduce the content and reorganize the course (London Mathematical Society, 1992).
Students face difficulties in learning the computational procedures without understanding the
concepts (Serdina Parrot & Eu, 2014; Artigue, Batanero, & Kent, 2007). For the overwhelming
majority of students, calculus is not a body of knowledge, but a repertoire of imitative behavior
patterns that are abstract, complex and difficult to understand (Tapare, 2013; Moise, 1948). The
focus of this study was on methods for helping students discover their own errors and revise
their own concepts, separating bothersome theory from practical methods. This approach was
particularly applied to solve problems with the definite integral in university-level calculus
courses.

M. Y. Ting / Find the Area by Integration
2884
LITERATURE
Related Calculus Literature
Mathematics education is based on problem solving, which has been widely recognized
as a framework for analyzing the learning of mathematical processes (Fernando & Aarón,
2013; Marchis, 2013). As students explore mathematical problem solving processes, they must
understand the foundations of mathematics. However, their existing mental structures are not
fully consistent with the new structures of mathematics they are learning (Herscovics, 1989;
Hiebert & Carpenter, 1992). In new contexts, old experiences can cause serious conflicts (Tall,
2004). The students then have cognitive obstacles, such as the symbolic representation of
integrals, the integral sign itself, and the cognitive concept of the ‘area under the curve’
interpretation (Mallet, 2011). However, without a complementary conceptual understanding,
the students will be less able to generalize their skills to other contexts and thereby lose much
of the problem-solving power of calculus (Zerr, 2010).
It does seem to be a fact of life that few prosper in mathematics. Therefore, a good begin
to struggle and need appropriate help to be able to pursue mathematics further (Tarmizi,
2010). As instructors, we, the ‘experts,’ need to recognize the difficulties placed on learners by
our reliance on common symbols for new concepts (Mallet, 2011). Thus, to make progress in
the actual teaching and learning of mathematics, one needs to deepen and further one’s
understanding of the theoretical ideas that frame teaching and learning (Larson et al., 2010).
Mistakes in mathematics are as important and as significant as correct answers. In some
cases, they are more significant (Schwarzenberger, 1984). Errors help us understand the
students' thoughts and why the errors occur and can thereby be a diagnostic tool that helps us
to understand the context of mathematical errors and support the development of
mathematics instruction.
State of the literature
• This study has no relation to the price, there is no criticism of the earlier article, and there is no
plagiarism. This study wanted to be a lively network of learning calculus to attract students to
enhance students' confidence and thus stimulate interest.
Contribution of this paper to the literature
• Based on the literature showing that computerized tests are generally used for more basic
primary and secondary school mathematics, the present study of university calculus indicates
that "Find the Area by Integration" constitutes an attempt
• The present study discusses "error types" on the "Find the Area by Integration" unit
• The present study develops items related to "Find the Area by Integration" and builds a
computerized test interface to assist Bayesian network diagnostic analysis.

EURASIA J Math Sci and Tech Ed
2885
Computer-based Tests
Traditional tests have been criticized for having only limited effectiveness because they
cannot accurately assess potential changes in students (Caffrey, Fuchs, & Fuchs, 2008).
Additionally, observing a particular student’s situation in a large class is difficult
(Chatzopoulou & Economides, 2010). Therefore, increasingly more instructors use software to
assist in the process of teaching and learning in higher education (Schroeder, Minocha, &
Schneider, 2010). The development of information technology over the last two decades has
made computer- based testing feasible in both educational research and practice (Bunderson,
Inouye, & Olsen, 1988).
Furthermore, today’s e-learning technology enables organizations to start adopting
online instructions as well as online testing (Tao, Wu, & Chang, 2008). These test systems can
effectively improve students’ learning (Chatzopoulou etc, 2010; Wauters, Desmet, &
Noortgate, 2010). Given this success, computer technology is gradually being introduced to
the testing field. Moreover, computer-based tests save time and have a better implementation
of remedial teaching.
Q matrix
This study is aimed at different types of items designed to obtain different Q matrices,
using the DINA estimated property subject cognitive status, and to identify the rate of
assessment indicators. To clearly explain the relationship between the items and skills, a
cognitive diagnosis model is primarily used as a skills matrix Q to influence the item table
(Tatsuoka, 1985). If there is a test of J × K items and skills, the Q matrix with J × K matrix
elements is defined as follows:
𝑞𝑗𝑘 = {1, to answer the j − th item needs k − th skill.0, otherwise.
where 𝑗 = 1,2, , … , 𝐽. 𝑘 = 1,2, … , 𝐾.
For example, if a test has two items and three skills, then Q23 = [1 0 11 1 0
], to answer the
first item, you need skills 1 and 3, and to correctly answer item 2, you need skills 1 and 2.
A Q-matrix can be viewed as a cognitive design matrix that explicitly identifies the
cognitive specification for each item (Torre, 2009). Using the Q matrix to determine the
required skills for each test item, subject experts must also decide on the degree of mastery of
each skill and how it affects the chances of correctly answering the question. Teachers can use
the displayed students' Q matrix to estimate the cognitive properties of the students is master
or not, and the students show different learning state.

M. Y. Ting / Find the Area by Integration
2886
Recognition Rate
For all items of cognitive diagnostic modes, the recognition rate is the consistency of the
results of students’ tests, where experts determine the attribute states. In this study, the
recognition rate between the true value (e.g., expert judgment) and the estimated value (e.g.,
where the DINA mode determines the results) is 1 when the two results agree and 0 when
they are inconsistent, as shown in Table 1.
This study describes the DINA mode as follows.
DINA Mode (Deterministic Inputs, Noisy and Gate Model)
Junker and Sijtsma (2001) first used the DINA mode, which is the basis of various
cognitive diagnostic assessments (Doignon & Falmagne, 1999; Tatsuoka, 1995). This mode is
considered to have all cognitive attributes of the item required to correctly answer this item,
but the answer probability of this item will be affected by two parameters: carelessness and
guessing.
𝑃(𝑌𝑖𝑗 = 1|𝜂𝑖𝑗 = 1) = (1 − 𝑠𝑗)𝜂𝑖𝑗𝑔𝑗(1−𝜂𝑖𝑗) (1)
𝜂𝑖𝑗 = ∏ 𝛼𝑖𝑘
𝑄𝑗𝑘
𝐾
𝑘=1
𝑠𝑗 = 𝑃(𝑌𝑖𝑗 = 0 |𝜂𝑖𝑗 = 1),
𝑔𝑗 = 𝑃(𝑌𝑖𝑗 = 1 |𝜂𝑖𝑗 = 0)
where 𝑌𝑖𝑗: the reaction of the i-th student to the j-th item is as follows:
𝑠𝑗: the student has the required cognitive attributes for the j-th item, but, because of
carelessness, has a probability of giving the wrong answer.
𝑔𝑗: the student does not have the required cognitive attributes for the j-th item, but,
because of guessing, has a probability of giving the correct answer.
𝛼𝑖𝑘: the i-th student either has the k-th cognitive attribute or not; if he has the property,
then he is given the label 1; otherwise, he is given a label of 0.
Table 1. The recognition rate
Estimated value
True False
True value
True 𝑛11 𝑛10
False 𝑛01 𝑛00
Note: 𝑛𝑖𝑗 = 1, if the estimate value is consistent with the true value; otherwise, 𝑛𝑖𝑗 = 0.
EURASIA J Math Sci and Tech Ed
2887
This model assumes that the student, who needs to have all required cognitive
properties, can answer correctly questions, but the probability of the answer questions, will be
subject to the impact of two parameters - slip and guessing. DINA model divides students into
two categories, one answers correctly the question - to master the all required cognitive
properties for the test item or to solve the item by means of the probability of guessing, the
other answers incorrectly the item - the lack of one or some of the necessary cognitive
properties to reduce the chances of their correct answers, or careless. While the DINA model
only considers two parameters, i.e., careless 𝑠𝑗 and guess 𝑔𝑗. But it has a good model fit (de la
Torre & Douglas, 2008) and is a simple and easily interpretable model (de la Torre & Douglas,
2004). It is often used in tests. Based on this, this study will use this model as a tool to assess
the cognitive properties of students.
Bayesian Network
In recent years, the Bayesian network has become an important modeling method for
decision making problems in real-world applications (Irad, 2007). The Bayesian network (BN)
is also known as a belief network, probability network or causal network. A graphical
representation mode, a reasoning tool for knowledge representation, was based on Bayes'
theorem to explain the degree of probability of the interaction between several variables,
which is a probabilistic expert system. The content is formulated as follows: Suppose 𝑈 =
{𝑆1, 𝑆2, … , 𝑆𝑛}, 𝑆𝑖 which is finite (for i =1,2,…,n). In the event E, the probability of occurrence of
𝑆𝑖 is
𝑃(𝑆𝑖|𝐸) =𝑃(𝐸|𝑆𝑖)𝑃(𝑆𝑖)
𝑃(𝐸)=
𝑃(𝐸|𝑆𝑖)𝑃(𝑆𝑖)
∑ 𝑃(𝐸|𝑆𝑖)𝑃(𝑆𝑖)𝑖
(2)
where 𝑃(𝑆𝑖) prior probability, 𝑃(𝐸|𝑆𝑖) sample probability, 𝑃(𝑆𝑖|𝐸) posterior probability.
Bayes' theorem uses the prior probability and sample probability to infer the posterior
probability. These conditional dependencies in the graph are often estimated by using known
statistical and computational methods. The directed acyclic graphical Bayesian network is
based on Bayes' theorem to constitute a series of conceptual nodes and arrow symbols between
nodes. In the knowledge structure figure, each node represents an event, or a random variable
in the network. A connecting link indicates a causal relationship between events, an
association or a causal relationship between two variables in a network. The presence or
absence of links and the influence degree are represented by the strength of the conditional
probability. Thus, this directed graph is a joint probability distribution representation of
several variables. These graphical structures are used to represent knowledge about an
uncertain domain. Students’ errors could be caused by random and other uncertainty factors
(Friedman, Goldszmidt, Heckerman, & Russell, 1997). Yet the Bayesian network can still be
used with incomplete or missing information.
Some of the main advantages of Bayesian networks are their ease of understandability,
simplicity in the acquisition of prior knowledge, potential for causal interpretation, and

M. Y. Ting / Find the Area by Integration
2888
effective handling of missing data (Wu, Kuo, & Yang, 2012). In this study, the students’
responses were input into the Bayesian network models, and the joint probabilities were
calculated by using the MATLAB analysis software. According to the updated the posterior
probability distributions of the sub skills or error types, a standard (critical ratio = 0.3) was
used to make the decision to deduce the recognition rates of Bayesian network to estimate
whether the students have mastered the sub-skills, or whether exhibit error types, allowing us
to understand the abilities and errors of students.
RESEARCH
Assessment of Content Analysis
Calculus includes functions, limits, derivative functions, integrals, etc., and interesting
applications to real life. A closed area gives the size of a two-dimensional region, and the
degree of coverage represents a particular area, which refers to the size of the surface to be
covered. In elementary school, one learns about the areas of rule graphs, such as squares,
rectangles, triangles, circles, and trapezoids. However, how will we find the areas of irregular
shapes? To do so, this study employs the "find the area by integration" issue.
Expert Knowledge Structure
After much discussion, the domain experts decide the sequence of the concept
development and relationships among these concepts to depict the expert knowledge
structure for each unit in a tree diagram (Wu et al., 2012).
In this study, first, five university teachers are urged to analyze our expert knowledge
structure for the “find the area by integration" unit of the one-year compulsory calculus
textbook and to understand the teaching experience and knowledge that the students should
theoretically have. There are many relationships between concepts, which can be divided into
vertical and horizontal relationships (Rosch, 1975). The vertical relationships between the
concepts were discussed in this study. In this knowledge structure diagram, each concept is a
node, and concept B and C should be mastered before concept A can be attempted. The
Figure 1. The knowledge structure

EURASIA J Math Sci and Tech Ed
2889
concepts D~ F should be mastered before concept B can be attempted. The concepts G~J should
be mastered before concept C can be attempted. The knowledge structure is shown in Figure
1.
This study organizes the items according to expert knowledge structures. The expert
knowledge structure, refers to Ting & Kuo (2016) is shown in Figure 2.
A survey of the first type of multiple choice items (one out of four) is given as the Figure
3.
A survey of the second type of multiple choice items (one out of many) is given as the
Figure 4.
Figure 2. Expert knowledge structure
Figure 3. A survey of the first type of multiple choice items (one out of four)

M. Y. Ting / Find the Area by Integration
2890
Sub-skills of "Finding the Area by Integration"
To find the area by integration, this study uses the following sub-skills as Table 2:
Participators
In this study, a paper and pencil test was administered at one university, and then, the
items were altered to obtain more suitable questions. A second test was then held at the same
university. The effective sample size is 157 freshmen. A third academic year was held a formal
test, 155 valid samples.
Error Type Analysis
Misconceptions may come from students' self-learning and from traditional mechanical
teaching. These misconceptions result in fuzzy concepts and produce different error types.
Teachers who want to help students must first determine the cause of the students’ error types.
The researchers determine the teaching materials necessary to construct a quantitative analysis
of error types as the smallest unit of teaching so that teachers can directly estimate students'
error types from their responses as Table 3.
Figure 4. A survey of the second type of multiple choice items (one out of many)
Table 2. Sub-skills of “finding the area by integration”
Node Sub-skill
S1 Find the left and right bounds
S2 Determine the upper and lower integrating functions
S3 Find the upper and lower bounds
S4 Determine the left and right integrating functions
S5 Find the axis parameter
EURASIA J Math Sci and Tech Ed
2891
Research Tools
As shown in Figure 2, which lists eight nodes of the expert knowledge structure, the
researcher designed problem sets were divided into two sets of eight multiple choice items
(one out of four and one out of many). Each item set represents only a concept of the
knowledge structure, which is represented in the diagram as a node. For the multiple choice
items with four possible answers, only one option is correct, and the remaining answers
represent the most common errors that students make on the pre-test. Based on the student's
answers, the researcher can determine the student's error type. Multiple choice items with
many possible answers must be listed with a reaction formula, so that the student’s thinking
process can be clearly seen. In this study, when the true value is consistent with the estimated
value, the recognition rate is considered 1; otherwise, it is 0.
RESULTS AND DISCUSSION
When students complete online quizzes, their response procedures can be obtained from
a database. Using experts’ interpretations of the wrong answers, the researcher used MATLAB
to write programs that can automatically determine the wrong types of problem solving
processes for future students. According to the students’ responses, this study calculates the
joint probability using a Bayesian network to estimate whether students have the necessary
sub-skills or whether they exhibit error types; this approach also allows one to understand the
ability of students given the errors they make.
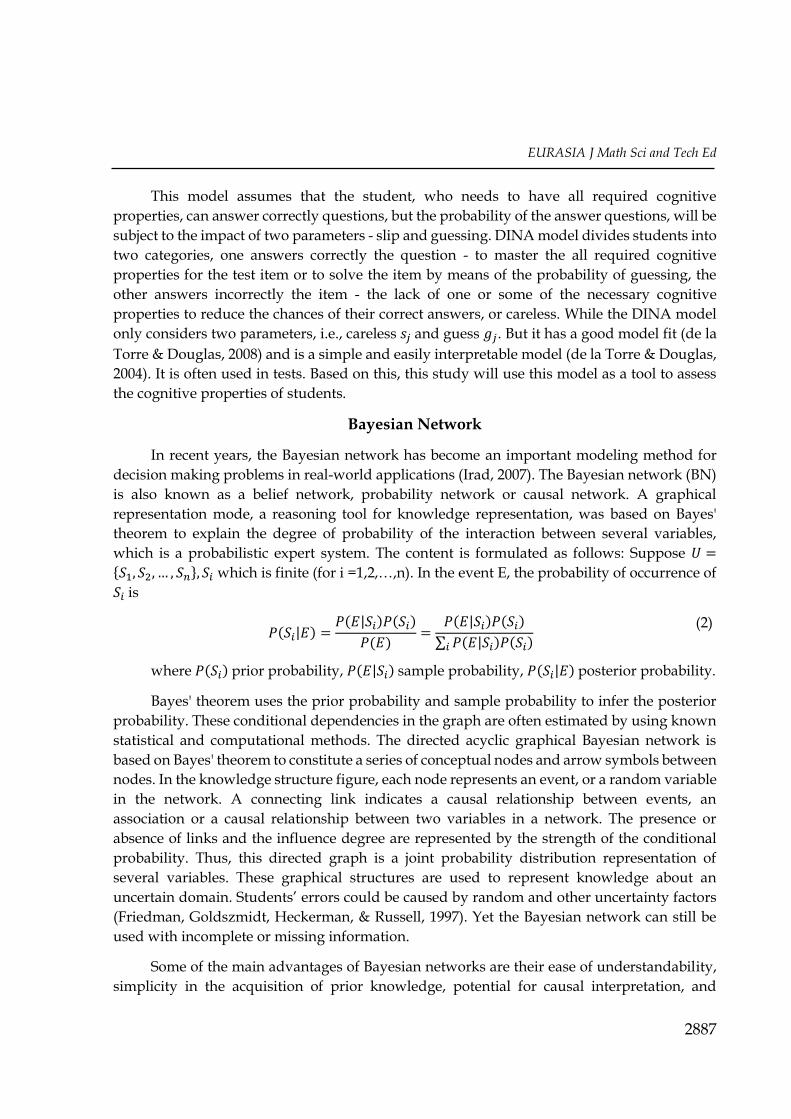
Table 3. Student error types
Node Error type
E1 Ignore the inevitability of the lower or the left integrated function.
E2 Mispick or un-select the lower or the left integrated function.
E3 Mispick or un-select the upper or the right integrated function.
E4 Misplace the axis parameter.
E5 Misplace or un-select the lower boundary.
E6 Misplace or un-select the upper boundary.
Table 4. Expert-defined Q matrix
Attribute Item S1 S2 S3 S4 S5
I1 1 1 0 0 1
I2 1 1 0 0 1
I3 0 0 1 1 1
I4 0 0 1 1 1
I5 1 1 0 0 1
I6 1 1 0 0 1
I7 0 0 1 1 1
I8 0 0 1 1 1

M. Y. Ting / Find the Area by Integration
2892
Given a quiz to assess specific items of cognitive skill or the concepts of a single desired
set of cognitive attributes, a Q matrix is obtained. Given J × K items and a test of cognitive
attributes, a corresponding Q matrix of size J × K will be defined by experts as shown in Table
4.
The recognition rate for the Q matrices for the first type of multiple choice items (one out
of four) and the experts is 0.7635. The recognition rate for the Q matrices for the second type
of multiple choice items (one out of many) and the experts is 0.8888. The Q matrix for the
second type of multiple choice items (one out of many) is closer to that of the experts.
The Bayesian network diagram is divided into three layers from left to right: the first
layer is the items; the second layer is the error types; and the third layer is the sub-skills. As
shown in Figures 5 and 6, the single solid-line arrow represents the association between both
layers. In the definite integral Bayesian network diagram, the link inputs in the MATLAB 7.0
codes "0" or "1" between nodes. This research explores the following two modes:
Mode 1: This mode includes eight of the first type of multiple choice items (one out of
four), with I1 ~ I8, error types E1 ~ E6 and sub-skills S1 ~ S5.
Mode 2: In addition to Mode 1, eight of the first type of multiple choice items (one out
of four) (I1 ~ I8) were then incorporated with eight of the second type of multiple choice items
(one out of many) (M1 ~ M8) to evaluate the corresponding error types as Figure 5.
The multiple choice items (one out of many) correspond to additional error types, as
Figure 6:
Figure 5. Mode 1 Bayesian network

EURASIA J Math Sci and Tech Ed
2893
E7: The two functions of the integral are inverted.
E8: There is an error in solving simultaneous equations.
E9: There is a cognitive error in size or height.
The average recognition rates of skills, from Models 1 and 2, are 0.7642 and 0.8023,
respectively. The average recognition rates of errors, from Models 1 and 2, are 0.8106 and
0.8215, respectively. The average recognition rates of Models 1 and 2 are 0.7874 and 0.8119,
Figure 6. Mode 2 Bayesian network. The black lines represent the first connection mode, and the colored
lines represent increased connections

M. Y. Ting / Find the Area by Integration
2894
respectively. The results show that the overall recognition rate of the BN (Model 2) is better
than that of Model 1, which has only the multiple choice items.
In the future, teachers may consider using the type of multiple choice items (one out of
many) to replace the traditional the type of multiple choice items (one out of four)in order to
achieve Tarmizi's viewpoint (2010), i.e., to be able to immediately understand the learners
learning situation, to help them continue to learn; and to conform to the opinion of Schroeder
et al. (2010), that is to say, more and more people use software to help teaching and learning
in the process of teaching and learning in higher education, so as to achieve the goal of
improving the quality of teaching and learning by means of the characteristics of computer
multimedia. This research focuses on definite integral diagnostic tests and automated analysis
mechanisms. Future studies may focus on remedial teaching.
ACKNOWLEDGEMENTS
This research was supported by the Ministry of Science and Technology, R.O.C. (Project
Number MOST 104-2511-S-150-001).
REFERENCES
Artigue, M., Batanero, C., & Kent, P. (2007). Mathematics thinking and learning at post-secondary level. In F. Lester (Ed.), Second handbook of research on mathematics teaching and learning (pp. 1011-1049). Greenwich, CT: Information Age Publishing, Inc.
Bunderson, C. V., Inouye, D. K., & Olsen, J. B. (1988). The four generations of computerized educational measurement. In R. L. Linn (Ed.), Educational measurement (pp. 367-407). New York, NY: Macmillan.
Caffrey, E., Fuchs, D., & Fuchs, L. S. (2008). The predictive validity of dynamic assessment: A review. Journal of Special Education, 41(4), 254-270. doi:10.1177/0022466907310366
Chatzopoulou, D. I., & Economides, A. A. (2010). Adaptive assessment of student’s knowledge in programming courses. Journal of Computer Assisted Learning, 26(4), 258-269. doi:10.1111/j.1365-2729.2010.00363.x
de la Torre, J. (2009). DINA model and parameter estimation: A didactic. Journal of Educational and Behavioral Statistics, 34 , 115-130.
Doignon, J. P., & Falmagne, J. C. (1999). Knowledge spaces. Berlin, Germany: Springer-Verlag.
Fernando, B. M., & Aarón, R. R. (2013). Cognitive processes developed by students when solving mathematical problems within technological environments. Mathematics Enthusiast, 10(1/2), 109-136.
Friedman, N., Goldszmidt, M., Heckerman, D., & Russell, S. (1997). Where is the impact of Bayesian Networks in learning? In International Joint Conference on Artificial Intelligence.
Ghazizadeh-Ahsaee, M., Naghibzadeh, M., & Gildeh, B. S. (2014). Learning parameters of fuzzy Bayesian Network based on imprecise observations. International Journal of Knowledge-Based and Intelligent Engineering Systems, 18(3), 167-180. doi:10.3233/KES-140296
Herscovics, N. (1989). Cognitive obstacles encountered in the learning of algebra. In S. Wagner, & C. Kieran (Eds.), Research issues in the learning and teaching of algebra (pp. 60–86). Reston, VA: National Council of Teachers of Mathematics.

EURASIA J Math Sci and Tech Ed
2895
Hiebert, J., & Carpenter, T. P. (1992). Learning and teaching with understanding. In D. A. Grouws (Ed.), Handbook of research on mathematics teaching and learning (pp. 65–97). New York, NY: Macmillan.
Irad, B. G. (2007). Bayesian networks. In F. Ruggeri, F. Faltin, & R. Kenett (Eds.), Encyclopedia of statistics in quality & reliability. Chichester, UK: Wiley & Sons.
Junker, B. W., & Sijtsma, K. (2001). Cognitive assessment models with few assumptions, and connections with nonparametric item response theory. Applied Psychological Measurement, 12, 55-73. doi:10.1177/01466210122032064
Larson, C., Harel, G., Oehrtman, M., Zandieh, M., Rasmussen, C., Speiser, R., & Walter, C. (2010). Modeling perspectives in math education research. In R. Lesh, P. L. Galbraith, C. R. Haines, & A. Hurford (Eds.), Modeling students’ mathematical modeling competencies (pp. 61-71). New York, NY: Springer US.
London Mathematical Society. (1992). The future for honours degree courses in mathematics and statistics: Final report of a group working under the auspices of the London Mathematical Society. London, UK: Council of the London Mathematical Society.
Mallet, D. G. (2013). An example of cognitive obstacles in advanced integration: The case of scalar line integrals. International Journal of Mathematical Education in Science and Technology, 44(1), 152-157. doi:10.1080/0020739X.2012.678897
Marchis, I. (2013). Future primary and preschool pedagogy specialization students’ mathematical problem solving competency. Acta Didactica Napocensia, 6(2), 33-38.
Moise, E. E. (1948). An indecomposable plane continuum which is homeomorphic to each of its nondegenerate subcontinua. Transactions of the American Mathematical Society, 63(3), 581-594. doi:10.1090/S0002-9947-1948-0025733-4
Rosch, E. H. (1975). Cognitive representations of semantic categories. Journal of Experimental Psychology: General, 104, 192-233.
Schroeder, A., Minocha, S., & Schneider, C. (2010). The strengths, weaknesses, opportunities and threats of using social software in higher and further education teaching and learning. Journal of Computer Assisted Learning, 26(3), 159-174. doi:10.1111/j.1365-2729.2010.00347.x
Schwarzenberger, R. L. E. (1984). The importance of mistakes: The 1984 presidential address. Mathematical Gazette, 68(445), 159–172.
Serdina Parrot, M. A., & Eu, L. K. (2014). Teaching and learning calculus in secondary schools with the TI-Nspire. Malaysian Online Journal of Educational Science, 2(1), 27-33.
Tall, D. (1993). Students’ difficulties in calculus. In Proceedings of Working Group 3 on Students’ Difficulties in Calculus, ICME-7 1992 (pp. 13-28). Québec, Canada: ICME.
Tall, D. (2004). “Thinking through three worlds of mathematics.” In Proceedings of the 28th Conference of the International Group for the Psychology of Mathematics Education (Vol. 4; pp. 281–288). Cape Town, South Africa: International Group for the Psychology of Mathematics Education.
Tao, Y. H., Wu, Y. L., & Chang, H. Y. (2008). A practical computer adaptive testing model for small-scale scenarios. Educational Technology & Society, 11(3), 259–274.
Tapare, U. S. (2013). Conceptual understanding of undergraduate students of calculus in cooperative learning using calculus education software (CES). Retrieved from http://linc.mit.edu/linc2013/proceedings/Session5/Session5Tapare.pdf
Tarmizi, R. A. (2010). Visualizing student’s difficulties in learning calculus. Procedia Social and Behavioral Sciences, 8, 377–383. doi:10.1016/j.sbspro.2010.12.053
Tatsuoka, K. (1985). A probabilistic model for diagnosing misconceptions in the pattern classification approach. Journal of Educational Statistics 12, 55–73. doi:10.3102/10769986010001055

M. Y. Ting / Find the Area by Integration
2896
Tatsuoka, K. K. (1995). Structure of knowledge states for NAEP science tasks: An application of the rule model. Paper presented at the Meeting of the National Council of Measurement in Education, San Francisco, CA.
Wauters, K., Desmet, P., & van den Noortgate, W. (2010). Adaptive item-based learning environments based on the item response theory: Possibilities and challenges. Journal of Computer Assisted Learning, 26(3), 549-562. doi:10.1111/j.1365-2729.2010.00368.x
Wu, H.-M., Kuo, B. C., & Yang, J. M. (2012). Evaluating knowledge structure-based adaptive testing algorithms and system development. Educational Technology & Society, 15(2), 73–88.
Zerr, R. J. (2010). Promoting students’ ability to think conceptually in calculus. Primus, 20(1), 1–20. doi:10.1080/10511970701668365
http://iserjournals.com/journals/eurasia