Embed Size (px)
Citation preview

December Quarter 2016 Results
January 24, 2017

Disclaimer
2
This presentation contains forward-looking statements. These statements are made under the “safe harbor” provisions of the U.S. Private Securities Litigation Reform Act of 1995. These forward-looking statements can be identified by terminology such as “will,” “expects,” “anticipates,” “future,” “intends,” “plans,” “believes,” “estimates,” “potential,” “continue,” “ongoing,” “targets,” “guidance” and similar statements. Among other things, statements that are not historical facts, including statements about Alibaba’s strategies and business plans, Alibaba’s beliefs and expectations regarding the growth of its businesses and its revenue for the full fiscal year, the business outlook and quotations from management in this presentation, as well as Alibaba’s strategic and operational plans, are or contain forward-looking statements. Alibaba may also make forward-looking statements in its periodic reports to the U.S. Securities and Exchange Commission (the “SEC”), in press releases and other written materials and in oral statements made by its officers, directors or employees to third parties. Forward-looking statements involve inherent risks and uncertainties. A number of factors could cause actual results to differ materially from those contained in any forward-looking statement, including but not limited to the following: Alibaba’s goals and strategies; Alibaba’s future business development; Alibaba’s ability to maintain the trusted status of its ecosystem, reputation and brand; risks associated with increased investments in Alibaba’s business and new business initiatives; risks associated with strategic acquisitions and investments; Alibaba’s ability to retain or increase engagement of consumers, merchants and other participants in its ecosystem and enable new offerings; Alibaba’s ability to maintain or grow its revenue or business; risks associated with limitation or restriction of services provided by Alipay; changes in laws, regulations and regulatory environment that affect Alibaba’s business operations; privacy and regulatory concerns; competition; security breaches; the continued growth of the e-commerce market in China and globally; risks associated with the performance of our business partners, including but not limited to Ant Financial, and fluctuations in general economic and business conditions in China and globally and assumptions underlying or related to any of the foregoing. Further information regarding these and other risks is included in Alibaba’s filings with the SEC. All information provided in this presentation is as of the date of this presentation and are based on assumptions that we believe to be reasonable as of this date, and Alibaba does not undertake any obligation to update any forward-looking statement, except as required under applicable law. This presentation contains certain financial measures that are not recognized under generally accepted accounting principles in the United States (“GAAP”), including adjusted EBITDA, adjusted EBITA, segmental adjusted EBITA, non-GAAP net income, non-GAAP diluted EPS and free cash flow. For a reconciliation of these non-GAAP financial measures to the most directly comparable GAAP measures, see GAAP to Non-GAAP Reconciliation.
3
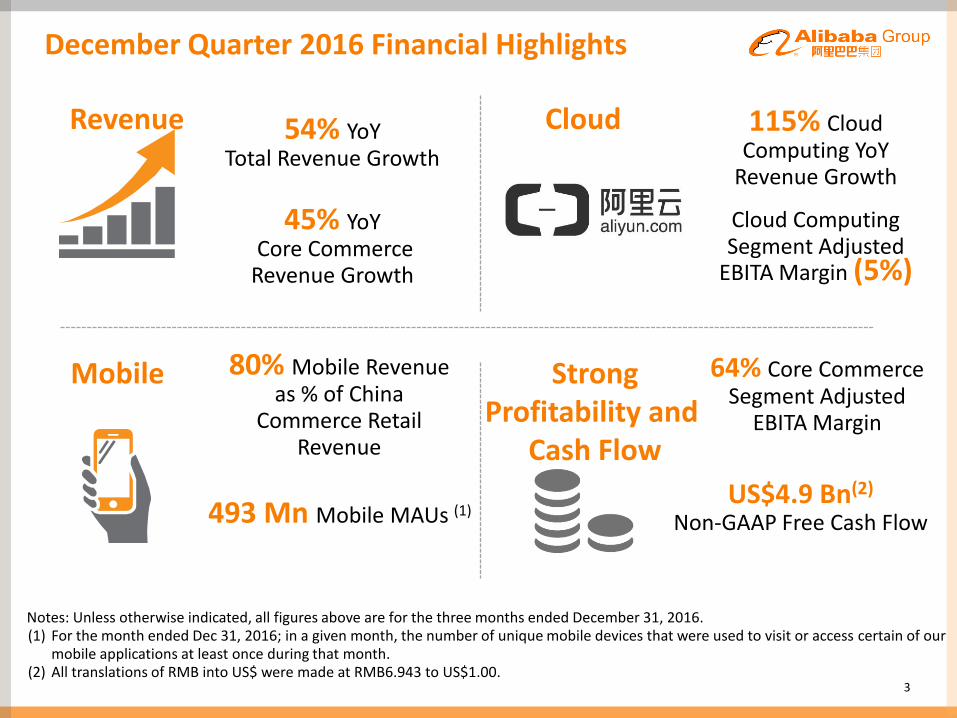
493 Mn Mobile MAUs (1)
Notes: Unless otherwise indicated, all figures above are for the three months ended December 31, 2016. (1) For the month ended Dec 31, 2016; in a given month, the number of unique mobile devices that were used to visit or access certain of our
mobile applications at least once during that month. (2) All translations of RMB into US$ were made at RMB6.943 to US$1.00.
December Quarter 2016 Financial Highlights
54% YoY Total Revenue Growth
80% Mobile Revenue as % of China
Commerce Retail Revenue
115% Cloud Computing YoY
Revenue Growth
45% YoY Core Commerce
Revenue Growth
Cloud Computing Segment Adjusted
EBITA Margin (5%)
64% Core Commerce Segment Adjusted
EBITA Margin
Revenue Cloud
Strong Profitability and
Cash Flow
Mobile
US$4.9 Bn(2)
Non-GAAP Free Cash Flow

Total Revenue
Quarterly Revenue
• Total revenue YoY growth of 54% was mainly driven by the robust revenue growth of our China commerce retail business, Alibaba Cloud as well as the consolidation of newly acquired businesses (mainly Youku Tudou and Lazada).
28.7
18.3 23.4 24.1
40.8
Dec 31, 2015
Mar 31, 2016
Jun 30, 2016
Sep 30, 2016
Dec 31, 2016
China commerce retail revenue Others
45%
28%
32% 32%
39%
59%
55% 54%
39%
24%
35% 35%
41% 49% 40%
42%
MAR Q 2015
JUN Q 2015
SEP Q 2015
DEC Q 2015
MAR Q 2016
JUN Q 2016
SEP Q 2016
DEC Q 2016
Total revenue YoY growth rate (%)
China commerce retail revenue YoY growth rate (%)
(RMB Bn)
4
Total Revenue YoY Growth (%)
34.5 32.2 34.3
53.2
Note: For the three months ended on the respective dates.
24.2

Continued Upward Trend in Monetizing User Base
5
Annual China Retail Revenue / Annual Active Buyer (1) Annual China Retail Mobile Revenue / Mobile MAU (2)
120
140
160
180
200
220
240
260
Dec 31, 2014
Mar 31, 2015
Jun 30, 2015
Sep 30, 2015
Dec 31, 2015
Mar 31, 2016
Jun 30, 2016
Sep 30, 2016
Dec 31, 2016
(RMB)
40
60
80
100
120
140
160
180
Dec 31, 2014
Mar 31, 2015
Jun 30, 2015
Sep 30, 2015
Dec 31, 2015
Mar 31, 2016
Jun 30, 2016
Sep 30, 2016
Dec 31, 2016
(RMB)
Notes: (1) China commerce retail revenue per active buyer for each of the above periods is derived from the China commerce retail revenue
for the last 12-month period, divided by the annual active buyers for the same 12-month period. (2) Annual mobile revenue per mobile MAU from China commerce retail is calculated by dividing mobile revenue from China commerce
retail for the last 12-month period by the mobile MAUs at the end of the same period. (3) All translations of RMB into US$ were made at RMB6.943 to US$1.00.
US$35(3) US$24(3)
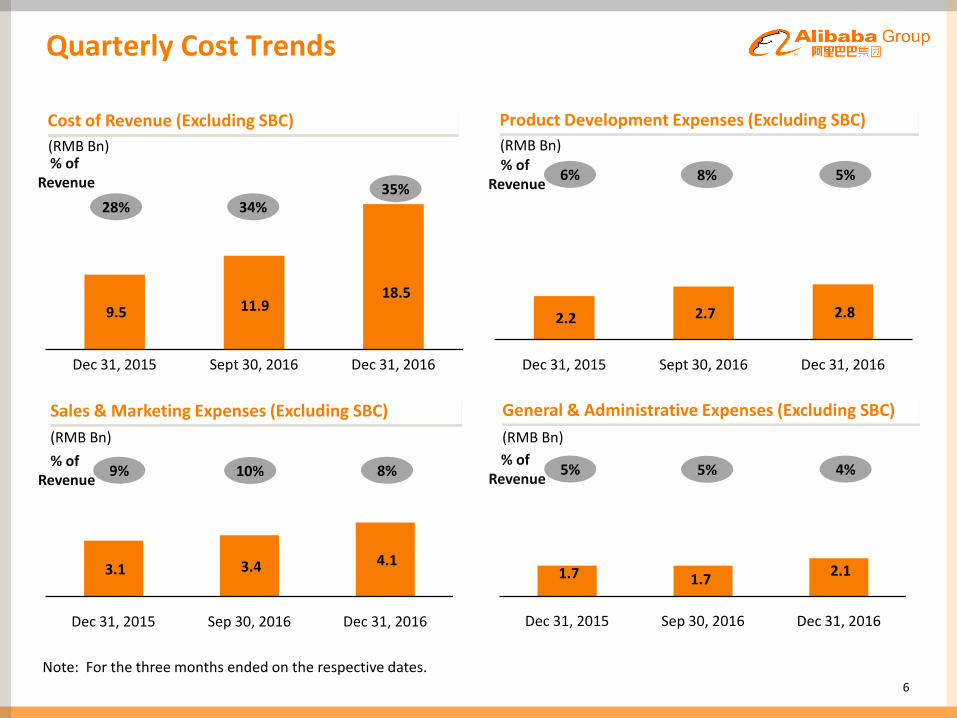
1.7 1.7 2.1
Dec 31, 2015 Sep 30, 2016 Dec 31, 2016
6
Quarterly Cost Trends
Cost of Revenue (Excluding SBC) Product Development Expenses (Excluding SBC)
2.2 2.7 2.8
Dec 31, 2015 Sept 30, 2016 Dec 31, 2016
Sales & Marketing Expenses (Excluding SBC)
3.1 3.4 4.1
Dec 31, 2015 Sep 30, 2016 Dec 31, 2016
General & Administrative Expenses (Excluding SBC)
(RMB Bn) (RMB Bn)
(RMB Bn) (RMB Bn)
9.5 11.9 18.5
Dec 31, 2015 Sept 30, 2016 Dec 31, 2016
Note: For the three months ended on the respective dates.
35% 28%
% of Revenue
34%
5% 6% % of
Revenue 8%
8% 9% % of
Revenue 10% 4% 5%
% of Revenue
5%

Free Cash Flow, Capital Expenditures and Cash
7
Capital Expenditures and Intangible Assets
(RMB Bn)
Cash, Cash Equivalents and Short-term Investments
(RMB Bn)
Non-GAAP Free Cash Flow (1)
(RMB Bn)
Notes: Unless otherwise indicated, all figures in the above charts are for the three months ended on the respective dates. (1) Non-GAAP free cash flow represents net cash provided by operating activities as presented in Alibaba Group’s consolidated cash
flow statement less purchases of property and equipment and intangible assets (excluding acquisition of land use rights and construction in progress) and adjusted for changes in loan receivables relating to micro loans of its SME loan business and others.
(2) All translations of RMB into US$ were made at RMB 6.943 to US$1.00.
6% 7% Non-real
Estate CAPEX as
a % of Revenue
10%
89.4
107.6
138.5
82.2 103.7
134.0
7.2
3.9
4.5
As of Jun 30, 2016
As of Sep 30, 2016
As of Dec 31, 2016
Cash and Cash Equivalents
Short-term Investments
2.4 3.3 3.2
2.5 0.3
4.1
Dec 31, 2015 Sept 30, 2016 Dec 31, 2016
Non-real Estate CAPEX and Intangible Assets Acquisitions of Land Use Rights and Construction in Progress
3.6
4.9
7.3
23.7
13.9
34.1
Dec 31, 2015 Sept 30, 2016 Dec 31, 2016
Non-GAAP Free Cash Flow
US$4.9 Bn(2)

8
Share of Results of Equity Investees
In RMB MM unless otherwise stated Dec Q 2015 Sept Q 2016 Dec Q 2016
Share of results of equity investees:
- Koubei (105) (3)* (237)
- Youku Tudou (81) – –
- Cainiao Network (86) (220) (234)
- Other equity investees 87 (160) (373)
Impairment loss – – (245)
Others** (310) (184) (459)
TOTAL (495) (567) (1,548)
• The increase in share of results of equity investees during the quarter ended December 31, 2016 compared to the previous quarter was primarily due to an impairment loss on an equity investee, an increase in amortization of intangible assets of equity investees and an increase in share of losses of certain equity investees, including Koubei, in the quarter ended December 31, 2016.
Notes: * Koubei recognized a non-recurring income of RMB523 million in the quarter ended September 30, 2016, without recording this non-recurring income, our share of Koubei’s loss would have been RMB262 million in the previous quarter. ** Others mainly include amortization of intangible assets of equity investees and share-based compensation expenses.

Core Commerce Segment
Segment Revenue
28.7
40.8
0.6
2.5
2.8
3.3
Dec 31, 2015
Dec 31, 2016
China commerce retail
International commerce retail
Wholesale + Other
65% 64%
Dec 31, 2015
Dec 31, 2016
(RMB Bn)
9
Segment Adjusted EBITA Margin
46.6
32.1
Note: For the three months ended on the respective dates. Online marketing service revenue grew by 47% YoY and commission revenue (representing 30% of China commerce retail revenue) grew by 32% YoY, in the quarter ended Dec 31, 2016.
• China commerce retail revenue grew 42% primarily due to robust growth of online marketing service revenue, as well as growth in commission revenue.
• Adjusted EBITA margin reflects consolidation of Lazada and investment in Tmall Supermarket, partially offset by operating leverage.
42% YoY
288% YoY

Core Commerce – China Commerce Retail - Active Buyers & Mobile MAUs
407 423 434 439 443
Dec 31, 2015
Mar 31, 2016
Jun 30, 2016
Sep 30, 2016
Dec 31, 2016
(In Millions)
Annual Active Buyers
For 12M ended
Mobile MAUs
393 410 427 450
493
Dec 31, 2015
Mar 31, 2016
Jun 30, 2016
Sep 30, 2016
Dec 31, 2016
(In Millions)
For 1M ended
10

Cloud Computing Segment
Segment Revenue
0.8
1.8
Dec 31, 2015
Dec 31, 2016
(41%)
(5%)
Dec 31, 2015
Dec 31, 2016
(RMB Bn)
11
Segment Adjusted EBITA Margin
Note: For the three months ended on the respective dates.
115%
• Cloud computing paying customers doubled since the year-ago quarter to 765,000.
• Segment adjusted EBITA margin significantly improved YoY. Our cloud computing business’ top priority remains expanding market leadership.

Digital Media & Entertainment Segment
Segment Revenue
1.1
4.1
Dec 31, 2015
Dec 31, 2016
(38%)
(60%)
Dec 31, 2015
Dec 31, 2016
(RMB Bn)
12
Segment Adjusted EBITA Margin
Note: For the three months ended on the respective dates.
• Segment revenue grew 273% YoY primarily due to consolidation of Youku and also to an increase in revenue from mobile value-added services provided by UCWeb.
• Adjusted EBITA margin of this segment was negative 60%, primarily due to Youku content development costs, partially offset by improvement in UCWeb’s margin.
•
273%

Innovation Initiatives & Others Segment
Segment Revenue
0.5
0.8
Dec 31, 2015
Dec 31, 2016
(183%)
(93%)
Dec 31, 2015
Dec 31, 2016
(RMB Bn)
13
Segment Adjusted EBITA Margin
Note: For the three months ended on the respective dates.
61%
• The innovation initiatives and others segment includes businesses such as YunOS, AutoNavi, DingTalk, and others.
• These businesses represent our strategic investments into future growth and are in the initial investment phase.

December Quarter Segment Reporting
14
Core Commerce Cloud Computing
Digital Media Entertainment
Innovation Initiatives & Others
Un-allocated(2)
Consolidated
Dec 16 Revenue (MM)
RMB 46,576 USD 6,708 45% YoY
RMB 1,764 USD 254
115% YoY
RMB 4,063 USD 585
273% YoY
RMB 845
USD 122
61% YoY
-
RMB 53,248
USD 7,669
54% YoY
Dec 16 Adjusted EBITA (MM)
RMB 29,630
USD 4,268
RMB (92) USD (13)
RMB (2,431)
USD (350)
RMB (785)
USD (114)
RMB (653)
USD (94)
RMB 25,669
USD 3,697
Dec 16 Adjusted EBITA Margin (%)
64% (5%) (60%) (93%) 48%
Dec 15 Adjusted EBITA Margin (%)
65% (41%) (38%) (183%) 52%
China Commerce Retail
China Commerce Wholesale
International Commerce Retail
International Commerce Wholesale
Notes: 1. Segmental information is presented after elimination of inter-company transactions. 2. Unallocated expenses are primarily related to corporate administrative costs and other miscellaneous items that are not allocated to individual segments. 3. All translations of RMB into US$ were made at RMB6.943 to US$1.00.
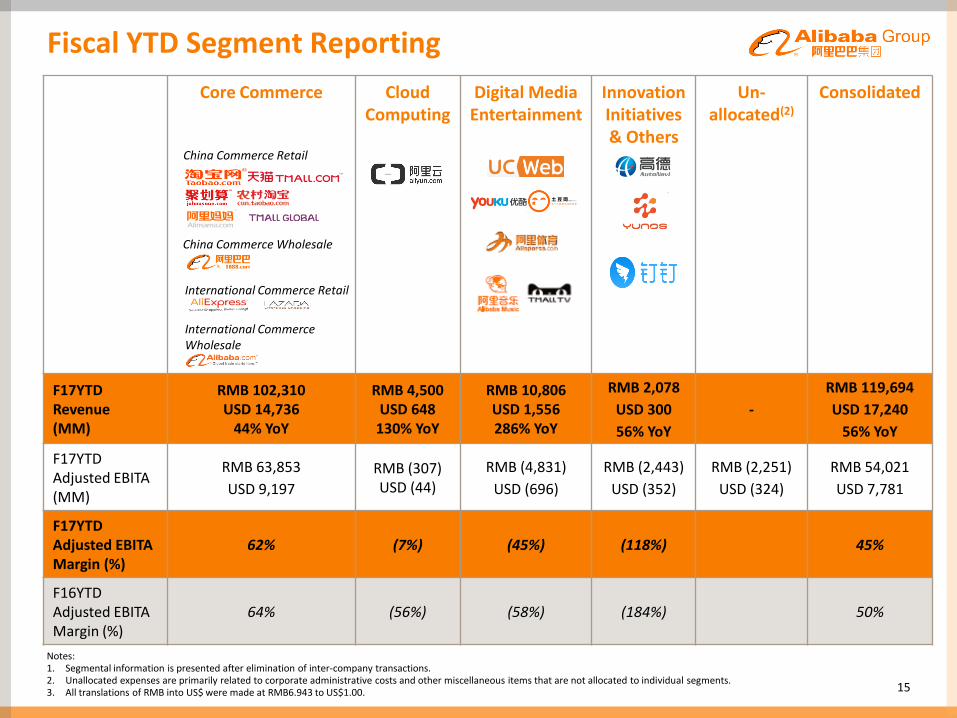
Fiscal YTD Segment Reporting
15
Core Commerce Cloud Computing
Digital Media Entertainment
Innovation Initiatives & Others
Un-allocated(2)
Consolidated
F17YTD Revenue (MM)
RMB 102,310 USD 14,736
44% YoY
RMB 4,500 USD 648
130% YoY
RMB 10,806 USD 1,556 286% YoY
RMB 2,078
USD 300
56% YoY
-
RMB 119,694
USD 17,240
56% YoY
F17YTD Adjusted EBITA (MM)
RMB 63,853
USD 9,197
RMB (307) USD (44)
RMB (4,831)
USD (696)
RMB (2,443)
USD (352)
RMB (2,251)
USD (324)
RMB 54,021
USD 7,781
F17YTD Adjusted EBITA Margin (%)
62% (7%) (45%) (118%) 45%
F16YTD Adjusted EBITA Margin (%)
64% (56%) (58%) (184%) 50%
China Commerce Retail
China Commerce Wholesale
International Commerce Retail
International Commerce Wholesale
Notes: 1. Segmental information is presented after elimination of inter-company transactions. 2. Unallocated expenses are primarily related to corporate administrative costs and other miscellaneous items that are not allocated to individual segments. 3. All translations of RMB into US$ were made at RMB6.943 to US$1.00.
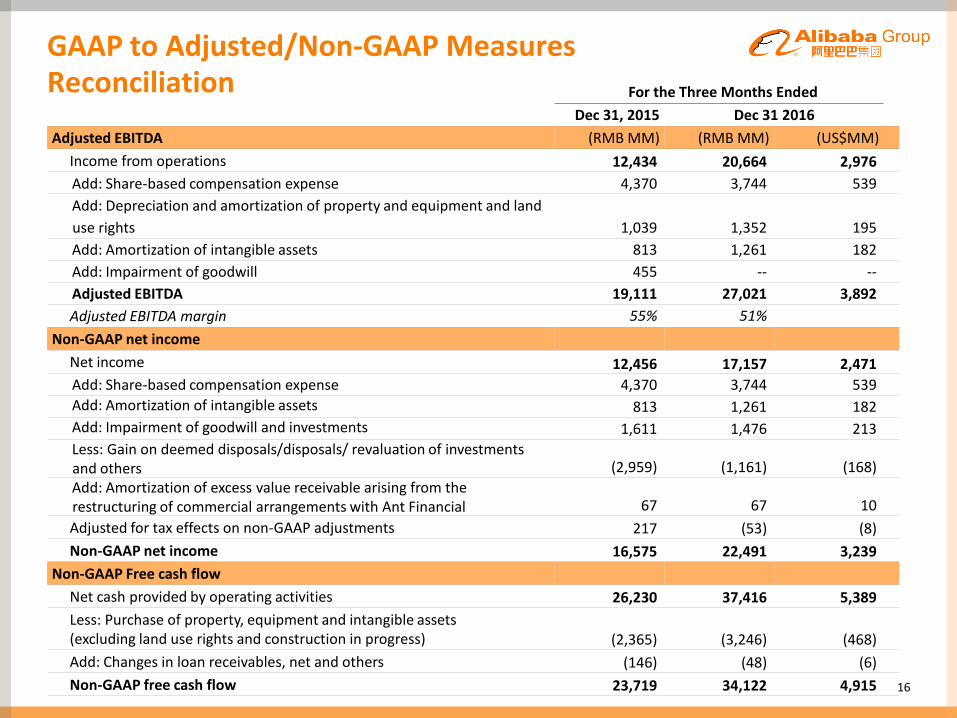
GAAP to Adjusted/Non-GAAP Measures Reconciliation
16
For the Three Months Ended
Dec 31, 2015 Dec 31 2016
Adjusted EBITDA (RMB MM) (RMB MM) (US$MM)
Income from operations 12,434 20,664 2,976
Add: Share-based compensation expense 4,370 3,744 539
Add: Depreciation and amortization of property and equipment and land
use rights 1,039 1,352 195
Add: Amortization of intangible assets 813 1,261 182
Add: Impairment of goodwill 455 -- --
Adjusted EBITDA 19,111 27,021 3,892
Adjusted EBITDA margin 55% 51%
Non-GAAP net income
Net income 12,456 17,157 2,471
Add: Share-based compensation expense 4,370 3,744 539
Add: Amortization of intangible assets 813 1,261 182
Add: Impairment of goodwill and investments 1,611 1,476 213
Less: Gain on deemed disposals/disposals/ revaluation of investments and others (2,959) (1,161) (168)
Add: Amortization of excess value receivable arising from the restructuring of commercial arrangements with Ant Financial 67 67 10
Adjusted for tax effects on non-GAAP adjustments 217 (53) (8)
Non-GAAP net income 16,575 22,491 3,239
Non-GAAP Free cash flow
Net cash provided by operating activities 26,230 37,416 5,389
Less: Purchase of property, equipment and intangible assets (excluding land use rights and construction in progress) (2,365) (3,246) (468)
Add: Changes in loan receivables, net and others (146) (48) (6)
Non-GAAP free cash flow 23,719 34,122 4,915