Embed Size (px)
Citation preview

Elliot Regenstein, Partner, Foresight Law + Policy
Ben Boer, Former Deputy Director, Advance Illinois
Paul Zavitkovsky, Assessment Specialist, Center for Urban Education Leadership
at the University of Illinois at Chicago
Establishing Achievable Goals
RECOMMENDATIONS FOR
IMPROVED GOAL-SETTING
UNDER THE EVERY STUDENT
SUCCEEDS ACT
PREPARED BY:
December 2018

2 Establishing Achievable Goals

DECEMBER 2018 3
INTRODUCTIONSince 2002 the federal government has required states
to have accountability systems that measure the quality
of schools. When the No Child Left Behind (NCLB) Act
ushered in the accountability era nationwide, it did
so with the ambitious goal of ensuring that by 2014
“all children . . . reach, at a minimum, proficiency on
challenging state academic achievement standards
and state academic assessments.” That goal was not
achieved. In 2015 the federal government hit the reset
button on its accountability approach with the passage
of the Every Student Succeeds Act (ESSA). The ESSA
gives states flexibility to set their own goals and gives
states greater flexibility in measuring progress toward
those goals.
Federally-mandated accountability systems provide
the public with important data about school and
district performance, and also require states to support
improvement activities in the lowest-performing
schools. Under NCLB and ESSA the primary metrics of
school performance have been results on standardized
assessments — and in the case of high schools, graduation
rates. ESSA has also opened the possibility of additional
metrics, but assessment results remain the primary
indicators of school performance. The stated goal of
accountability systems is to lead to improved student
outcomes, both in school and beyond.
One underlying assumption of the accountability era is
clearly correct — we need to make dramatic changes in
how students are doing, because too many students are
not graduating from high school prepared to succeed
in college or the workforce. But we also need to be
clear-eyed about how to support those changes. While
states are empowered to set their own goals for student
performance, it is important that they not set aspirational
goals that are unattainable. If they do, they risk
undermining the very improvements they are designed to
stimulate at the school and district levels.
This article examines how the federal ESSA offers new
opportunities to improve teaching and learning in
Illinois. It also examines how current state goals match
up with growth and proficiency rates in the nation’s most
successful schools. Our conclusions:
• Current goals will be impossible for most Illinois
schools and districts to reach because they
require growth rates that far exceed those of the
nation’s most successful districts;
• State goals that are challenging, data-informed,
and attainable offer a better way to inspire local
improvements that will allow Illinois to reach its
90% college and career readiness goal by 2032;
• Available data provide useful insights into the
strategies that are most likely to help us achieve
our goals. These include an increased focus
on the early learning and early elementary
years, and a stronger emphasis on improving
instruction for all learners as a necessary
condition for increasing proficiency, especially
among lower-achieving students.
To reach higher levels of proficiency schools need to
increase annual growth rates well beyond current levels
and at a rate greater than one grade level per year. But
we need to be realistic about what is possible, about
how that success can be achieved, and about what needs
to be done prior to third grade to achieve the levels of
proficiency that all students deserve.
This paper begins by examining the new Illinois
accountability system under ESSA and explains the
rationale for the state’s current approach. It then examines
recent research about how student performance improves,
which is an essential metric in Illinois’ accountability
system. It then evaluates Illinois’ goals in light of current
research to illustrate that those goals are simply not
realistic. The paper concludes with recommendations for
an approach that is realistic and would create the right
incentives for schools and districts.

A New Way of Measuring Quality: Using Both Proficiency and Growth to Assess EffectivenessIllinois’ new ESSA plan measures school quality by looking at both overall proficiency levels of
students at the school and the students’ year-to-year growth on standardized tests1:
• In a “proficiency” model, the state defines a level of achievement that it considers to be
“proficient.” School effectiveness is measured by the percentage of students who achieve that
level of proficiency. This level is intended to capture the knowledge that a student needs to
have in order to be on track to be prepared for college.
• In a “growth” model, the state defines how much achievement is expected to grow across a
year. School effectiveness is measured by the percentage of students who meet or exceed
expected growth levels or the average amount that the achievement of all students in a
school has grown.
There are benefits and drawbacks to each approach. This is why many states — including Illinois —
have chosen to use a combination of both.2 Proficiency is important to measure because achievement
levels influence student admission to college and career preparation programs. Growth is important
because it measures the impact of schools on student learning and demonstrates the extent to which
students who have fallen behind are on track to catch up.
A serious limitation of using proficiency alone to assess school quality is that proficiency is strongly
correlated with socio-economic status (SES). This means that schools with students from wealthier
families often perform better, primarily based on the wider range of social and academic supports
that students experience outside of school.3
Historically, another problem with using proficiency benchmarks is that they encourage schools to
focus on students whose achievement is just below the benchmark score. This incentive to “work the
bubble” trivializes the school improvement process, does little to support improvement of teaching
and learning for all students, and is not aligned with how schools improve (see Appendix B).4
Moreover, proficiency metrics are often misused by looking at the overall proficiency rate of a school,
rather than looking at end-point proficiencies such as 3rd, 5th, 8th and 12th grade.
For their part growth measures provide useful information about how students are improving, but do
not indicate whether students are likely to be successful in later years. Students in schools with strong
growth but lower levels of proficiency often need additional supports — in school, outside of school,
and in the years before formal schooling begins.
For schools to succeed in reaching higher levels of proficiency, all students need to grow at a pace that
will be substantially greater than current year-to-year averages. An accountability approach that assesses
both growth and proficiency accounts for the fact that students come to school with very different levels
1 Advance Illinois, (2017, November 6). Essence of ESSA: Growth versus proficiency. In Advance Illinois. Retrieved from http://www.advanceillinois.org/2017/11/essence-of-essa/
2 Wright, B. L., & Petrilli, M. J. (2017, November 17). Rating the Ratings: An Analysis of the 51 ESSA Accountability Plans. In Thomas B. Fordham Institute. Retrieved May 18, 2018, from https://edexcellence.net/publications/rating-the-ratings
3 Mackey, A. P., Finn, A. S., Leonard, J. A., Jacoby-Senghor, D. S., West, M. R., Gabrieli, C. F., & Gabrieli, J. D. (2015). Neuroanatomical correlates of the income-achievement gap. Psychological science, 26(6), 925-933; Goldfarb, Z. A. (204, March 5). These four charts show how the SAT favors rich, educated families. In Washington Post. Retrieved from https://www.washingtonpost.com/news/wonk/wp/2014/03/05/these-four-charts-show-how-the-sat-favors-the-rich-educated-families/?noredirect=on&utm_term=.a0bfefec7fa0; https://www.the74million.org/article/barnum-the-growth-vs-proficiency-debate-and-why-al-franken-raised-a-boring-but-critical-issue/ Nye, B., Konstantopoulos, S., & Hedges, L. V. (2004). How large are teacher effects? Educational evaluation and policy analysis, 26(3), 237-257.
4 Lauen, D. L., & Gaddis, S. M. (2016). Accountability pressure, academic standards, and educational triage. Educational Evaluation and Policy Analysis, 38(1), 127-147.
4 Establishing Achievable Goals

of preparation. It also offers a more accurate picture of school effectiveness and highlights a relationship
between growth and proficiency that is important, especially for lower-achieving students.
In Illinois’ ESSA plan5 proficiency still counts for 20% of a school’s overall score, but at elementary and
middle schools, growth now counts for 50%. The high school system may include a growth metric
in later years, but currently relies exclusively on proficiency for the assessment-driven portion of
the accountability system. The remaining percentages are accounted for by factors other than test
scores — including high school graduation rates, which have played an important role in high school
accountability for years and continue to under ESSA.
THE USE OF STANDARDIZED ASSESSMENTS FOR ACCOUNTABILITYFederal law mandates the use of assessments in state accountability systems — including
in their goals.6 In the No Child Left Behind era there was extensive debate about the use
of assessments in accountability systems; the passage of the ESSA reaffirmed the federal
government’s commitment to using standardized statewide assessments in accountability7,
while giving states new flexibility in how to use those results.
A standardized assessment-based standard is a useful counterweight to other performance
indicators such as grades, attendance, and high school graduation. If schools are expected
to demonstrate increases in other measures — such as high school graduation — but are not
held to high standards for improving assessment performance, schools will have an incentive
to award diplomas to students who may not really be qualified. In contrast, if schools are
expected to raise test scores but not held accountable for graduation rates, an incentive is
created to “push out” lower achievers. Accountability systems have long acknowledged that
each of these data points has significant value as a complement to the other.8
For this reason and others, civil rights groups have argued that standardized assessments are
needed to make comparisons across communities and expose achievement gaps.9 If we do
not use assessment results in an appropriate and technically sound manner, however, those
results will not necessarily be treated as credible by educators and the public. Our purpose in
this paper is not to opine on the quality of the assessments used as a part of the ESSA plan or
the specific proficiency benchmarks set by the state, but to ensure that the state’s goals for
student performance on these assessments are ambitious, reasonable, and technically sound.
The use of growth measures under ESSA is a significant change, because NCLB focused exclusively
on proficiency.10 Because NCLB also demanded that states achieve 100% proficiency by 2014 most
states — including Illinois — lowered their cut scores to allow more students to be “proficient.” This
effort to game the system undermined public trust. Ironically, even after cut scores were lowered to
two or more years below grade level, no state ever achieved NCLB’s 100% goal.
5 Illinois State Board of Education (2017, 8 29). ESSA State Plan for Illinois. Retrieved from https://www.isbe.net/Documents/ ESSAStatePlanforIllinois.pdf.
6 Section 1111, (c)(4)(A)
7 https://www.edweek.org/ew/articles/2018/07/23/anti-test-movement-slows-to-a-crawl.html
8 Swanson, C. B. (n.d.). Graduation Rates: Real Kids, Real Numbers. Retrieved November 14, 2018, from https://www.urban.org/sites/default/files/publication/57831/311114-Graduation-Rates.PDF
9 EhrenFruend, M. (2015, April 14). Why civil rights groups support standardized tests. Washington Post
10 The Department of Education did allow for the inclusion of growth as a measure through a growth model pilot (https://www2.ed.gov/rschstat/eval/disadv/growth-model-pilot/index.html) and then later through a waiver process (https://www2.ed.gov/policy/elsec/guid/esea-flexibility/index.html).
DECEMBER 2018 5

The failure to set realistic expectations was a significant factor in the collapse of public support for
the law. When even the very best schools in the country could not meet NCLB’s expectations, it was
difficult to take those expectations seriously.11
What Research Tells Us About GrowthThe purpose of goals is to motivate progress. Illinois needs to set goals that push schools and districts
toward high levels of achievement and set ambitious but achievable growth targets.
New research on student performance allows us to define ambitious growth and proficiency
expectations based on what is currently being achieved in the nation’s most effective schools and
districts. This research provides a framework for setting ambitious but achievable growth and
proficiency expectations at different points on the PK-12 continuum.12
Almost all students make progress in school. The challenge is to help all students make enough
progress each year to realize their full potential as learners:
• If students come into a given grade at a less than proficient level and make one year’s
progress that year, they will still be behind, and with less time to make up ground before high
school graduation.
• Students who come to a grade achieving at a proficient level but fail to make a full year of
progress face a different problem. Their achievement declines relative to their peers.
• If students who were on track for college and career readiness in earlier grades make less
than average growth in later grades, they can fall below proficiency benchmarks.
Overall, national data based on growth over time in over 11,000 school districts provides strong
guidance about setting ambitious but realistic goals for growth based on growth trajectories in highly
successful districts.
We define “realistic” growth based on the
upper boundaries of current growth data.
Figure 1 shows 5-year growth rates between
third grade and eighth grade in 2,000 of
the nation’s largest school districts, plotted
against the average socio-economic status of
each district’s students. Figure 1 shows that
the very best school districts in the country
are providing the equivalent of six years of
progress in five years — or about 1.2 grade
equivalents per year.
11 Illinois Report Card.
12 While we believe it may be possible to have greater growth than the most effective districts in the nation, we think it is inappropriate to set goals assuming that such greater growth is immediately possible. Our hope is that with appropriate goals and supports that districts will be able to reach even higher levels of effectiveness. If and when that occurs, goals can be updated to reflect these new norms. Until then, we should set goals for the Illinois system based on the data we currently have.
6 Establishing Achievable Goals
FIGURE 1
Source: https://www.nytimes.com/interactive/2017/12/05/upshot/a-better-
way-to-compare-public-schools.html?hp&action=click&pgtype=Homepage
&clickSource=story-heading&module=second-column-region®ion=top-
news&WT.nav=top-news&_r=0

A key lesson from this chart is that in the near term expecting more than a small percentage of
districts to achieve more than six years of growth in a five-year period is unrealistic.
Another lesson is that most districts, regardless of level of wealth, can realistically improve 5-year
growth rates above their current baseline. For example, there is no reason to believe that students in
Anne Arundel County, MD are any less capable of making 1.1 grade equivalents of progress per year
than students in U-46. Currently, however, the growth rate of students in Anne Arundel County is just
a little over 0.8 grade equivalents per year.
Chicago and U-46 offer good guidance for goal-setting that is both ambitious and realistic. Chicago—
the third largest district in the country—has a growth rate of 1.2 grade equivalents per year between
third grade and eighth grade. Only 3% of all districts in the country grow learning at or above that
rate. U-46—the second largest district in Illinois—has a growth rate of 1.1 grade equivalents per year.
Just 20% of all other districts in the nation can make that claim. Both districts offer clear evidence of
growth rates that are both ambitious and achievable at scale.
ISBE’s Current Goals Are Set Too High Based on Existing DataIllinois needs to set ambitious goals. The most obvious reason is that only 37% of Illinois students in
ninth through twelfth grade currently have literacy skills that put them on track to meet the state’s
college and career readiness standards. In math, the number drops to 34%. While there is still no
clear consensus among test professionals about scoring levels that best predict college and career
readiness, these numbers make it clear that there is certainly room for improvement.
Beyond the immediate needs of students, clear and appropriate goals help schools, districts, and the
state monitor the improvement process and allocate resources more effectively. Goals also provide
a framework for communication with educators, parents, and the public at large about what schools
and districts are trying to accomplish. Finally, monitoring progress toward the state’s goals gives
practitioners and policymakers clear information about the results of improvement efforts — and
whether those results align with expectations.
During the development of Illinois’ ESSA plan, the State Board of Education adopted four ambitious
proficiency goals for all schools and districts to achieve by 2032. These goals call for:
• 90% of all students to meet statewide proficiency standards in reading by the end of third
grade;
• 90% of all students to meet statewide proficiency standards in math by the end of fifth grade;
• 90% of all students to be on track for high school graduation by the end of ninth grade; and
• 90% of all students to be college and career ready by the end of twelfth grade.
Illinois’ goals are well-intentioned in that they represent a commitment to equity and high
achievement. But they are inconsistent with the best information we have about achievement growth
in the nation’s most effective schools.
Expecting Illinois schools to increase proficiency at rates comparable to the highest in the nation is
a bold but empirically defensible alternative. Expecting all or most Illinois districts to dramatically
outperform what are now the highest growth rates in the country sets the stage for the same kind of
political theater and public mistrust that was generated under No Child Left Behind.
DECEMBER 2018 7

ASSESSING THE FEASIBILITY OF ACHIEVING 90% PROFICIENCY
When the State Board of Education approved current ESSA goals in 2016, about 36% of Illinois third
graders met statewide proficiency standards. This measure reflected a statewide distribution of
reading achievement that looked roughly the same as the one shown below in Figure 4. Blue bars
show students who scored at or above the proficiency benchmark of 750. Orange bars show students
who scored below that benchmark. The black line shows the median score for all students tested.
FIGURE 4
Source: ftp://ftp.isbe.net/SchoolReportCard/
8 Establishing Achievable Goals
STATE GOALS DEFINED BY ESSA
0%
1%
2%
3%
4%
5%
6%
650 700 750 800 850
Rela
tive f
req
uen
cy
PARCC Scale Score
At/Above PARCC Proficiency (Level 4+)
36%
90% 3rd Grade students are reading at or above grade level
90% 5th Grade students meet or exceed expectations in math
90% 9th Grade students are on track to graduate with their cohorts
90% Students graduate from high school ready for college & career
100% Kindergartners assessed for readiness
100% Students have highly prepared effective teachers & school leaders
100% Schools have a safe & healthy learning environment for all students

Figure 5 below shows what eighth grade reading achievement would look like if teachers and
parents in a typical Illinois school were able to increase third to eighth grade growth rates by one
full grade equivalent.
FIGURE 5
Source: ftp://ftp.isbe.net/SchoolReportCard/
Figure 5 demonstrates that adding one additional year of learning (6 years of academic growth in
5 years) to the elementary years would raise eighth grade proficiency rates from 36% to 58% in an
average Illinois school district. This proficiency rate falls well short of 90%, but is nine percentage
points higher than the proficiency rate achieved by Massachusetts eighth graders on the 2017 NAEP
reading exam. To put this in context, Massachusetts eighth graders have led the nation in NAEP
reading proficiency for more than a decade. Proficiency benchmarks on the NAEP are roughly
comparable to those that Illinois currently uses to assess proficiency at grades 4 and 8.13
Figure 6 illustrates that, to reach the current Illinois ESSA goal of 90% proficiency, elementary
instruction would need to add close to three full grade equivalents to current learning levels. In short,
achieving ISBE’s stated goal would require a typical Illinois district to generate eight years of learning
in the five years between the end of third and the end of eighth grade.
As discussed earlier, districts that achieve just one additional year of growth in a five-year period are
among the highest performing in the country. Current ISBE goals call for growth in a typical Illinois
district to increase by three times that rate. In lower-achieving districts, growth rates would need to
be five times higher than the nation’s highest growth rates to meet current goals by eighth grade.14
13 In 2017, 37% of Illinois fourth graders scored proficient or higher on the PARCC exam while 35% scored proficient or higher on the NAEP; in eighth grade, 37% Illinois students scored proficient or higher on the PARCC exam in 2017 while 36% scored proficient or higher on the NAEP.
14 Grade equivalents as shown here are defined statistically by movement of the mean by approximately a half a standard deviation of the overall distribution. Half a standard deviation is roughly equivalent to a difference of one full grade level on a normal distribution of student test scores.
DECEMBER 2018 9
0%
1%
2%
3%
4%
5%
6%
650 700 750 800 850
Rela
tive f
req
uen
cy
PARCC Scale Score
At/Above PARCC Proficiency (Level 4+)
36% 58%
0%
1%
2%
3%
4%
5%
6%
650 700 750 800 850
Rela
tive f
req
uen
cy
PARCC Scale Score
At/Above PARCC Proficiency (Level 4+)
CURRENT AVERAGE STATEWIDE RATE ONE EXTRA YEAR OF PROFICIENCY

FIGURE 6
Source: ftp://ftp.isbe.net/SchoolReportCard/
ISSUES WITH GOALS BEYOND REACHING 90% PROFICIENCY
The analysis above demonstrates that setting a 90% proficiency goal for eighth grade is not
reasonable. A variety of other feasibility issues are also worth noting:
• We explore above what it would take to accomplish 90% proficiency by the end of eighth
grade. But current state goals call for 90% proficiency as early as the end of third grade.
Reaching 90% proficiency by the end of third grade is even more ambitious than reaching
that target by the end of eighth or twelfth grade.
• While a 90% target is currently out of reach for third grade, higher levels of achievement in
high school will require improvement in performance prior to third grade. Improving school
effectiveness prior to third grade will be essential to reaching 90% proficiency in later grades.
• It is not clear that 90% proficiency on state assessments is actually an appropriate goal. The
state has invested significant effort to develop a broader definition of college and career
readiness.15 While achievement on standardized assessments is an important component of
readiness, research makes it clear that a wider range of metrics is needed to predict college
and career success. There may be students who are not proficient on standardized assessments
who are positioned for later success in ways that other metrics would capture more fully.
15 https://www.isbe.net/Documents/College-Career-Readiness-Indicator.pdf
10 Establishing Achievable Goals
0%
1%
2%
3%
4%
5%
6%
650 700 750 800 850
Rela
tive f
req
uen
cy
PARCC Scale Score
At/Above PARCC Proficiency (Level 4+)
36%
77%
0%
1%
2%
3%
4%
5%
6%
650 700 750 800 850
Rela
tive f
req
uen
cy
PARCC Scale Score
At/Above PARCC Proficiency (Level 4+)
58%
0%
1%
2%
3%
4%
5%
6%
650 700 750 800 850
Rela
tive f
req
uen
cy
PARCC Scale Score
At/Above PARCC Proficiency (Level 4+)
90%
0%
1%
2%
3%
4%
5%
6%
650 700 750 800 850
Rela
tive f
req
uen
cy
PARCC Scale Score
At/Above PARCC Proficiency (Level 4+)
CURRENT AVERAGE STATEWIDE RATE
TWO EXTRA YEARS OF PROFICIENCY
ONE EXTRA YEAR OF PROFICIENCY
CURRENT ILLINOIS PROFICIENCY GOAL

• Finally, the accountability benchmarks need to be reasonable about the pace of improved
rates of growth. While 1.2 years of growth in a year is possible, schools cannot flip a switch
and produce that level of growth in a year; gradual progress by schools over time toward that
level of performance is the only way to get there. A realistic model for how the state might
improve performance in PK through 3, third through eighth and in high school needs to be
developed to map out appropriate pacing (see Appendix A).
Focusing on the Early Years is EssentialLow achievement in middle school and high school are best addressed before third grade. At
present, an analysis of nationwide data makes it clear that districts only rarely achieve more
than six years of growth in the five years between third and eighth grade. These data also show
that growth in learning slows as children get older. If a cohort is two years behind at the end
of third grade, the likelihood of that cohort catching up by the end of high school is very low.
Indeed, even a cohort that is just one year behind at the end of third grade will only catch up to
expectations in the top three to five percent of American school districts.
There are several complementary strategies available to improve proficiency by the end of third
grade. First, the state can continue to increase its investment in kindergarten readiness. Illinois has
long been a leader nationally for birth-to-five initiatives that focus on getting children ready for
kindergarten. But far too many children still do not have access to high-quality programs, which is
underscored by recent findings that only 24% of Illinois children are on track for school success at
the beginning of kindergarten. 16
There is also much room for progress in what school districts can do to assess and strengthen new
learning from kindergarten through third grade.17 Illinois has committed to using a P-2 indicator as
part of its accountability system to emphasize to district and school leaders the importance of the
early years.18 Although there are no statewide accountability assessments prior to the end of grade
three, there are numerous diagnostic assessments that can be used to assess student needs and
improve instructional effectiveness. In addition, new tools are becoming available to help districts
and schools assess learning needs more successfully. For example, national and international
data on the power of formative assessment at the classroom level point to big opportunities for
improved teaching and learning that remain untapped in most schools and districts.19
As described in the main narrative, improvement efforts that only address the years after third
grade have a very low likelihood of moving schools significantly closer to state proficiency goals.20
Creating conditions that help educators and parents increase new learning from PK through third
grade by an average of one full grade equivalent statewide would propel achievement in Illinois to
first-in the-nation status for primary grades. It would also create a stronger foundation for learning
in later grades, without which we can never hope to achieve 90% college and career readiness.
16 https://www.isbe.net/kids
17 Illinois’ P-20 Council has a Kindergarten Transition Advisory Committee that is developing recommendations regarding the
transition from preschool into kindergarten, and best practices for improving early elementary education. https://www2.illinois.
gov/sites/P20/Pages/Kindergarten-Transition-Advisory.aspx
18 https://www.isbe.net/Documents/17-3249_P-2_Indicator_Working_Group_Report.pdf
19 See, for example, Wiliam (2018) Embedded Formative Assessment, and Goldstein (2017) Restorative Assessment
20 The Illinois Early Learning Council has made a specific set of recommendations on this topic. http://files.constantcontact.com/10769473401/6b4ac107-b08f-4555-83a5-fefcc2e6ff54.pdf. The Illinois P-20 Council later adopted those recommendations.
DECEMBER 2018 11

Recommendations: Creating a System of Ambitious, and Attainable GoalsWe are strong supporters of ambitious goals. But current goals far exceed what the nation’s most
effective districts have been able to achieve. It invites failure and cynicism to expect Illinois school
districts to radically outperform the most successful districts in the country.
Going forward, we recommend the following critical actions:
• Set goals that are ambitious but realistic.
While there is value in having aspirational long-term goals for the system, they are not
useful unless they provide a realistic roadmap for improvement in the short-term. If we want
communities to engage in productive conversations about how to improve their schools,
we need to support that conversation with goals that are both ambitious and achievable.
Appendix A describes one possible approach that meets these criteria.
• Base growth expectations on data from the nation’s most successful schools and districts.
One shortcoming of NCLB was that its high expectations were not modeled on existing data.
We have the opportunity to learn from NCLB and draw upon data to inform goal setting.
State goals will be stronger and more useful if they are reflective of current data and research,
and provide systems of support that give schools and districts a reasonable chance to achieve
those goals.
• Focus improvement efforts in areas where data show that leverage for progress is high.
As Nobel Prize-winning economist James Heckman has said, skills beget skills. Children who
have strong educational experiences early are more likely to have continued success later on.
Illinois has done better than many states at reflecting this value in its ESSA goals. Making this
an even more prominent focus of the state’s school improvement efforts will be essential to
achieving ambitious but achievable goals.
Being realistic about how much growth can be achieved in a given year — and understanding
that growth currently slows as children get older — places a premium on ensuring that
children experience academic success as early as possible.
• Use data to shape the design of future improvement efforts.
A decade and a half of data from the NCLB era offers powerful, sometimes surprising, insights
about scaled improvements in schools and district achievement. For example, meaningful
growth in proficiency at the school, district, and state levels rarely occurred by simply
raising achievement among low-achieving students. Rather, improved achievement among
lower-achieving students typically requires raising the proficiency of students across all
achievement levels. Appendix B explains this phenomenon in greater detail.
12 Establishing Achievable Goals

• Recommend clear mechanisms based on known best practices that describe how ambitious
goals can be achieved incrementally over time.
Schools and districts are accountable for promoting continuous social and academic growth
across the full spectrum of development from birth through twelfth grade. The state and its
partners should map out how ambitious improvements in new learning in earlier years make
it possible for student cohorts to experience equally ambitious learning growth at grades 3-5,
6-8, and 9-12.
Setting ambitious goals for educational outcomes is a good thing. So is the inclusion of growth
measures in the state’s school accountability system. But more work is needed to ensure that growth
and proficiency goals are set and supported in the most effective ways possible.
ESSA offers a once-in-a-generation opportunity to set the right goals and to support the growth
needed to meet or exceed those goals. ISBE’s initial goals are based on a deep belief that all students
should have the opportunity to succeed, but they are not based on realistic data that create the right
incentives for the schools helping those students to succeed. The state does schools and students no
favors when it creates unrealistic expectations; instead, the state should use data to set expectation
levels that represent real progress and that schools have a chance to achieve.
DECEMBER 2018 13

Appendix AIT IS POSSIBLE TO PROJECT AMBITIOUS STATEWIDE GAINS IN GROWTH AND PROFICIENCY
BASED ON THE KNOWN ACCOMPLISHMENTS OF THE NATION’S MOST SUCCESSFUL SCHOOL
DISTRICTS
How long will it take the state to reach the growth rate of districts like CPS or U-46? An optimistic
estimate is that raising statewide growth rates to this level would take at least five to seven years. At
this rate, improved proficiency for each statewide cohort would be small in the beginning but increase
over time as improvement efforts gain traction.
Figure A1 shows the type of proficiency gains that could expected from each successive statewide
cohort over a 10-year period as growth rates increase.21 This represents the increase in percent of
proficiency that could be expected in a given year for each cohort with students in third through
eighth grade.
YearImproved Proficiency per
Cohort per YearYear
Improved Proficiency per
Cohort per Year
2019 0% 2024 3%
2020 1% 2025 3%
2021 1% 2026 4%
2022 2% 2027 4%
2023 2% 2028 5%
FIGURE A1
Based on these assumptions, an ambitious but achievable model of attainment over the next 15 years
would reflect the following statewide expectations:
• Within the next 15 years, new learning during the period between the beginning of PK and
the end of third grade would increase by a full grade equivalent.22
Achieving this goal in all Illinois school districts would increase third grade reading proficiency
to 58% by 2032. This rate of proficiency would match the highest level of third grade reading
yet achieved by any state in the nation once NAEP scores are controlled for differences in
student demographics.
• Within the next 10 years, growth would increase such that learning during the period
between the end of third grade and the end of eighth grade would increase by a full grade
equivalent.
21 The translation of growth rates into proficiency gains is impacted by the distribution of student test scores and could be more or less depending on the starting level of proficiency and variance of test scores. Therefore, this table is an approximate illustration of possible changes in proficiency. A full model would have to be developed to provide more precise estimates.
22 According to the Urban Institute states made average gains of approximately six months learning in 4th grade reading and math between 2003 and 2013 adjusted for demographics, making this an ambitious but achievable goal (https://www.urban.org/research/publication/breaking-curve-promises-and-pitfalls-using-naep-data-assess-state-role-student-achievement/view/full_report)
14 Establishing Achievable Goals
• Long-term proficiency goals for eighth grade would be based on the combined impact of:
• new learning achieved during the five years between PK and the end of third grade
• new learning achieved during the five years between the end of third grade and the end
of eighth grade
• 90% college and career readiness by high school graduation would continue to be set as
the ultimate goal.
Illinois has expanded the definition of college and career readiness (CCR) to include more
than a single test score. Using that expanded definition, CCR includes grade point average,
attendance, post-secondary workforce readiness and other measures in addition to test
scores. The state should continue to aim for 90% college and career readiness by 2032 with
the understanding that this can be achieved even though only 70% of high school graduates
are reaching academic proficiency on state assessments by the end of eleventh grade.23
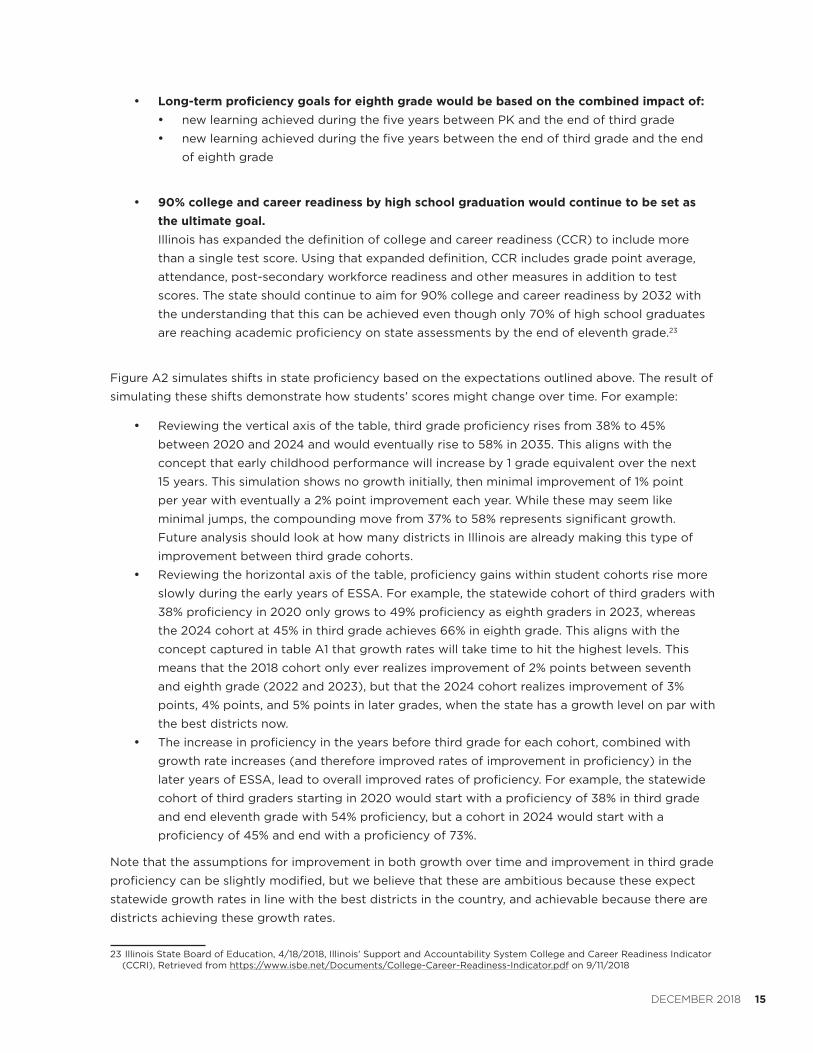
Figure A2 simulates shifts in state proficiency based on the expectations outlined above. The result of
simulating these shifts demonstrate how students’ scores might change over time. For example:
• Reviewing the vertical axis of the table, third grade proficiency rises from 38% to 45%
between 2020 and 2024 and would eventually rise to 58% in 2035. This aligns with the
concept that early childhood performance will increase by 1 grade equivalent over the next
15 years. This simulation shows no growth initially, then minimal improvement of 1% point
per year with eventually a 2% point improvement each year. While these may seem like
minimal jumps, the compounding move from 37% to 58% represents significant growth.
Future analysis should look at how many districts in Illinois are already making this type of
improvement between third grade cohorts.
• Reviewing the horizontal axis of the table, proficiency gains within student cohorts rise more
slowly during the early years of ESSA. For example, the statewide cohort of third graders with
38% proficiency in 2020 only grows to 49% proficiency as eighth graders in 2023, whereas
the 2024 cohort at 45% in third grade achieves 66% in eighth grade. This aligns with the
concept captured in table A1 that growth rates will take time to hit the highest levels. This
means that the 2018 cohort only ever realizes improvement of 2% points between seventh
and eighth grade (2022 and 2023), but that the 2024 cohort realizes improvement of 3%
points, 4% points, and 5% points in later grades, when the state has a growth level on par with
the best districts now.
• The increase in proficiency in the years before third grade for each cohort, combined with
growth rate increases (and therefore improved rates of improvement in proficiency) in the
later years of ESSA, lead to overall improved rates of proficiency. For example, the statewide
cohort of third graders starting in 2020 would start with a proficiency of 38% in third grade
and end eleventh grade with 54% proficiency, but a cohort in 2024 would start with a
proficiency of 45% and end with a proficiency of 73%.
Note that the assumptions for improvement in both growth over time and improvement in third grade
proficiency can be slightly modified, but we believe that these are ambitious because these expect
statewide growth rates in line with the best districts in the country, and achievable because there are
districts achieving these growth rates.
23 Illinois State Board of Education, 4/18/2018, Illinois’ Support and Accountability System College and Career Readiness Indicator (CCRI), Retrieved from https://www.isbe.net/Documents/College-Career-Readiness-Indicator.pdf on 9/11/2018
DECEMBER 2018 15

3rd Grade
Year3rd 4th 5th 6th 7th 8th 11th *
11th Grade
Year
2018 37% 37% 38% 39% 41% 43% 47% 2026
2019 37% 38% 39% 41% 43% 46% 50% 2027
2020 38% 39% 41% 43% 46% 49% 54% 2028
2021 39% 41% 43% 46% 49% 53% 58% 2029
2022 41% 43% 46% 49% 53% 57% 63% 2030
2023 43% 46% 49% 53% 57% 62% 68% 2031
2024 45% 48% 52% 56% 61% 66% 73% 2032
*This column is a 3 year span vs. 1 year span of prior columns
FIGURE A2
It is true that in this table, no group of students reaches 90% proficiency based on current proficiency
benchmarks. But if students were able to attain 70% proficiency in eleventh grade on state
assessments, the state would be well on its way to preparing 90% of all students for post-high school
success. It is also worth noting that the average proficiency rate across the state (or in a similarly
situated school) would be significantly below 90% because this model builds toward a goal of higher
levels of proficiency in later grades.
Concerted efforts to help all schools and districts achieve growth rates comparable to Chicago’s
at all grades from PK through 12 would put Illinois’ goal of 90% college and career readiness within
reach by the end of twelfth grade. This approach would clearly require unprecedented efforts to
revamp conventional approaches to schooling both inside PK-12 classrooms and in early childhood
experiences in students’ homes and communities. To date, these changes in homes and communities
have only been hinted at in ESSA planning and have not yet been acknowledged in ways that could
make 90% college and career proficiency by twelfth grade more than a distant aspiration.
16 Establishing Achievable Goals

Appendix BDISTRICTS THAT IMPROVE ACHIEVEMENT AT SCALE DO NOT JUST FOCUS ON THEIR LOWEST-
ACHIEVING STUDENTS
For many years, it has been an article of faith in the policy community that scaled improvements in
proficiency are mostly driven by remediating low achievement. But recent analyses of proficiency
gains in Illinois and nationwide reveal something surprising: Proficiency gains among lower achievers
rarely occur at scale unless average and higher achievers make equivalent or higher gains.
These findings are important because they illustrate that schools and districts cannot simply
remediate their way to increased proficiency. On the contrary, fifteen years of data from the NCLB era
show that instructional depth and quality need to be increased for all students before supplemental
supports for lower achievers produce sustainable gains. This new evidence helps explain why a half-
century of federal and state education policy targeted exclusively toward support for lower achievers
has not produced stronger results.
Figure B1 shows how fifteen-year proficiency gains in Chicago occurred in roughly equal proportions
across all proficiency levels in third through eighth grade. Color bands in each chart show proficiency
levels in grade-equivalents. Pink and tan bands in charts on the left show that 68% of Chicago
students in third through eighth grade scored below grade level in math in 2001. By 2016, this number
dropped to 49%.
If all or most proficiency gains in Chicago came from remediation alone, the green band (representing
grade-level proficiency) would have expanded by close to 19 percentage points while the blue and
purple bands (representing higher grade equivalents) would have stayed about the same. What
actually happened was that each one of the higher-achieving proficiency bands grew substantially. In
other words, proficiency gains occurred among all students, not just among lower achievers.
FIGURE B1
Source: Zavitkovsky & Tozer (2017) Upstate/Downstate http://urbanedleadership.org/what-we-do/research/upstate-downstate-
report/
DECEMBER 2018 17
MATH READING

National data on proficiency tell the same story. Figure B2 shows the relationship between proficiency,
race, and socio-economic status in all US school districts that have at least 100 black, 100 Latino and
100 white students in each grade three through eight. Like the charts in Figure B1, the two sample
school districts shown in Figure B2 illustrate that higher overall proficiency rates typically reflect
improved achievement among all students, not just improved achievement among lower achievers.
In Charlotte-Mecklenburg, average achievement for all students in third through eighth grade is about
0.4 grade equivalents above grade level. In Simi Valley, average achievement for all students is about
0.6 grade equivalents below grade level, one full grade equivalent lower than Charlotte-Mecklenburg.
In order for average achievement in Simi Valley to mirror average achievement in Charlotte-
Mecklenburg across racial sub-groups, black achievement would need to increase by about 1.6
grade equivalents and Latino achievement would need to increase by about 0.9 grade equivalents.
But the biggest lift would need to happen among white students at the upper end of Simi Valley’s
achievement continuum. Average achievement there would need to increase by a whopping 2.4 grade
equivalents to match white achievement in Charlotte-Mecklenburg.
FIGURE B2
Source: https://www.nytimes.com/interactive/2016/04/29/upshot/money-race-and-success-how-your-school-district-compares.ht
ml?action=click&contentCollection=upshot®ion=rank&module=package&version=highlights&contentPlacement=1&pgtype=secti
onfront&smid=tw-upshotnyt&smtyp=cur&_r=2
SCALED INCREASES IN PROFICIENCY TYPICALLY REQUIRE ACROSS-THE-BOARD GAINS
IN NEW LEARNING
Statewide trends on the National Assessment of Educational Progress (NAEP) also illustrate that
when proficiency among average and higher-achieving students increases, gains among lower
achievers are more likely to happen. When proficiency flattens among average and higher achieving
students, achievement among lower achievers is more likely to decline.
Figure B3 below shows NAEP scoring trends in eighth grade reading in Chicago and the State of
Illinois from 2003 through 2017. Blue lines show trends for Chicago alone. Green lines show statewide
trends that include Chicago. The chart on the left shows scores achieved by students at the lower end
of each scoring distribution. The chart in the middle show scores achieved by students at the mid-
point, or 50th percentile, of each distribution. The chart on the right shows scores achieved at the
18 Establishing Achievable Goals

upper end of each distribution. Dotted blue lines at the top of each chart show the NAEP cut score
for eighth grade reading proficiency. This cut score is roughly equivalent to Illinois’ current standard
for eighth grade reading proficiency.24
.
FIGURE B3
Source: https://www.nationsreportcard.gov/ndecore/xplore/NDE
The scoring trends shown in Figure B3 echo the storyline of Figures B1 and B2:
• Between 2003 and 2013, blue lines show that 12 point gains at the lower end of Chicago
distributions were matched by 13 and 16 point gains in the middle and upper levels of the
distribution. Nine point gains among lower-achieving students statewide (including Chicago)
were matched by statewide gains at the 50th and 75th percentiles of seven and eight points
respectively.
• Between 2013 and 2017, Chicago gains continued to occur across the entire scoring
distribution. During that same period, statewide declines occurred across all three
achievement levels25.
24 In both 2015 and 2017, 32% of Illinois eighth graders scored proficient or higher on both PARCC and NAEP exams
25 Since Chicago accounts for close to 20% of all students tested statewide, achievement gains outside of Chicago between 2003 and 2013 were less pronounced than green lines indicate. For the same reason, achievement declines outside of Chicago between 2013 and 2017 were more pronounced than green lines show.
DECEMBER 2018 19

FOR MORE INFORMATION:
advanceillinois.org
flpadvisors.com
urbanedleadership.org