Embed Size (px)
Citation preview

Data Collection: 2004 Web Site Content Survey
Final report
Period covered: May – December 2004 Contact persons : Andrej Kyselica, project manager, e-mail: [email protected] Hana Karbulová, project executive, e-mail: [email protected] Diana Hutařová, project executive, e-mail: [email protected] 16.12.2004 _________________________________________________________________________________________________ This document has been produced with the financial assistance of the European Commission. The views expressed herein are those of the author and can therefore in no way be taken to reflect the official opinion of the European Commission. Content of the report A. Background information .……………………………………………………………………………. 2
1

B. Project of the survey …..……………………………………………………………………………...3 1. Objectives of the survey …………………………………………………………………………....3 2. Methodology ……………………………………………………………………………………….3 C. Results of the survey …….…………………………………………………………………………...7
1. Text part …………………………………………………………………………………………....7 1.1 e-government ……………………………………………………………………………………...7 1.2. e-health ………………………………………………………………………………………….11 1.3. e-education………………………………………………………………………………………13 1.4. e-culture… ………………………………………………………………………………………14
D. Description and analysis of methodological approach……………..………………..………………17 Table part:
Tab.1.: Sample of the survey …...………………………………………………………………………20 Tab.2.: Number of institutions with a web site …...………………………………………………….…20 Tab.3.: Number of central state administration offices with specific information and on-line services
available on web site……………………………………………………………………………21 Tab.4.: Number of self-government institutions with specific information and on-line services
available on web site ……………………………………………………………………….21 Tab.5.: Number of hospitals with specific information and on-line services available on web site ...…22 Tab.6.: Number of theatres with specific information and on-line services available on web site …….22 Tab.7.: Number of museums with specific information and on-line services available on web site…...22 Tab.8.: Number of galleries with specific information and on-line services available on web site …....23 Tab.9.: Number of historical buildings with specific information and on-line services available on
web site …………………………………………………………………………………………23 Tab.10.: Number of national monuments with specific information and on-line services available on web site ….…………………………………………………………………………………23
Tab.11.: Number of radios with specific information and on-line services available on web site …......24 A. Background information This year (2004) the Czech Statistical Office carried out the first annual questionnaire survey on the ICT usage by public administration. Results of the survey will be available for the public in December 2004. The main objective of the questionnaire survey is to find out basic information about the ICT usage by public administration and provide valuable information about on-line government services for citizens and enterprises. Besides the questionnaire survey we carried out also a web site survey: "2004 Web site content survey”. The content outlines the recent development towards provision of new services through communication networks, primarily via the Internet (web sites). An important aspect is the availability of public access points and the involvement of all stakeholders in the process of building info-structures and provision of high-quality services and content to the general public.
The web site content survey supplements the questionnaire survey to get more specific and in-depth information about the Internet diffusion in society. In the web site content survey we used several new indicators that have never been used in the questionnaire survey, so we got information that we could not get from the questionnaire survey.
2

B. Project I. Objectives of the web site content survey
1. To find out what is the general extent of the web site usage within the public administration, universities, secondary schools, hospitals, museums, and others from the supply side and content provision (information and services available on-line for public) on these web sites = on-line information capital (see further set of indicators).
2. To describe and analyse a web site survey as a method of data collection. II. Methodology Survey technique: Web site content survey Reference period : June and July 2004 Survey period : June and July 2004 Target population :
- E-Government : all central state administration offices - 26 offices self-government administration offices:
all 14 regions all 205 municipalities with extended
competence - E-Education : all universities (51)
all secondary schools (1.463) all elementary school (3.845)
- E-Health : all hospitals – 175 - E-Culture* : museums – 331
galleries (art museums) – 53 theatres - 159 historical buildings – 223 national monuments – 69 * only institutions with an entrance fee for visitors
- Audiovisual sector broadcasting companies (radio) – 62
Sample Size : The survey covered the whole target population with differences in used indicators.
Chart: Basic structure of the 2004 Web Site Content Survey
public administration
e-Government
hospitals
e-Health
universities, etc.
e-Education
museums, theatres, etc
e-culture
radios
e-audio-visual sector
Internet content for society
3

System of the survey : First step of the survey – to find out how many institutions have own web site. Second step of the survey – to collect data focused on the content of web sites and make analysis To be able to analyze web sites, we needed database of all government institutions, health institutions, education institutions and culture institutions that we wanted to include to the survey. When we got the database, we were interested, how many of them had own and web site. Information about the number of health, education and culture institutions with a web site we got from questionnaire surveys realized by other public institutions. (National information and consulting center for culture - NIPOS, Institute of health information and statistics of the Czech Republic - UZIS, Institute for information on education - IIE) From the questionnaire surveys we also had database of URL addresses. All the questionnaire surveys were realized in 2003, with reference period – December 2003. Information about the number of government institutions with own web site we found out by browsing official government portal. The first step of the survey provided us with background information needed for later analysis. The second step of the survey was real web site content survey. Used indicators :
- E-government: Indicators used for all government institutions: number of institutions with own web site, number of institution with e-mail address, number of institutions with a foreign language web site version, number of institutions with job information on web site, number of institutions with information how to ask for information, number of institutions with electronic registry, number of institutions with links to central state administration web sites, number of institutions with information about staff on web site, number of institutions with agenda on web site, number of institutions with on-line contact Indicators used only for self-government institutions: number of institutions with information about departments on web site, number of institutions with information about culture Indicators used only for municipalities with extended competences: number of municipalities with information about history of municipality
- E-education*: number of institutions with own web site, number of
institution with e-mail address * only the first step of the survey was realized (see the system of the survey at the page 4)
- E-health: number of institutions with own web site, number of institution with
e-mail address, number of institutions with a foreign language web site version, number of institutions with contact on web site, number of institutions with information about departments on web site, number of institutions with information about staff on web site, number of institutions with information about opening hours, number of institutions with map of hospital on web site, number of institutions with job information on web site, number of institutions with a posibility to make an appointment on-line with a practitioner or to seek a medical advice on-line from a practitioner
4

- E-culture: Indicators used for theatres: number of institutions with own web site, number of institutions with a telephone ticket reservation system, number of institutions with an on-line ticket reservation system, number of institutions with a fax ticket reservation system, number of institutions with performance available on-line on web site, number of institutions with web/audio presentation available on-line on web site, number of institutions with a chat room on web site, number of institutions monitoring attendance of web sites, number of institutions with links to web sites of other theatres, number of institutions with fulltext Indicator used for museums: number of institutions with – own web site, links to web sites of other museums on web site, bookcase of museum on web site, job information, adverts on web site, fulltext on web site, photo gallery on web site, virtual exposition on web site, phonographic records on web site, web camera on web site, video presentation on web site, public opinion pool on web site, number of institutions with a telephone ticket reservation system, number of institutions with an on-line ticket reservation system, number of institutions with a fax ticket reservation system. Indicators used for galleries: number of institution with – own web site, program of gallery on web site, links to web sites of other galleries, bookcase of gallery on web site, number of visits on web site, on-line photo gallery, on-line catalogue Indicators used for historical buildings: number of institutions with – own web site, bookcase on web site, number of visits on web site, links to web sites of other historical buildings, job information on web site, adverts on web site, photo gallery on web site, virtual sightseeing, digitised collections, web camera, fulltext on web site, public opinion pool on web site, number of institutions with a telephone ticket reservation system, number of institutions with an on-line ticket reservation system, number of institutions with a fax ticket reservation system. Indicators used for national monuments: number of institutions with – own web site, number of visits on web site, bookcase on web site, links to web sites of other monuments, adverts on web site, photo gallery on web site. Indicators used for radios: number of institutions with – own web site, number of visits on web site, links to web sites of other radios, fulltext on web site, on-line broadcast, chat room on web site, web camera on web site
Pre - testing: A special pre-testing was done. The aim of the pre-testing was to verify the selection of indicators. Sample of the pre-testing : e-government: 20 municipalities, 2 regions, 2 ministries and 2 central state administration bodies. e-Culture: 20 museums, 10 theatres, 5 galleries, 20 historical buildings, 4 national monuments Audiovisual sector : 10 radios Results of the pre-testing : Some of the proposed indicators had to be modified. Some of the proposed indicators had to be thrown away. The most of the proposed indicators were used.
5
Timetable Start of the project : May 2004 Project preparation : May 2004 Data collection : June and July 2004 Data processing, outputs : July and August 2004 Preparation of the intermediate report : October 2004 Analysis: November and December 2004 Preparation of the final report : December 2004 End of the project : December 2004 Definitions Web site content survey – method of data collection. Data are collected from web sites. Agenda published on web site – decisions, statements, concepts Public Administration Information System regulation – regulation of the Ministry of Informatics about data mandatory published on web sites of public administration Information about departments – names of departments and responsibility of departments Electronic registry – only electronic registry able to process electronically signed documents On-line contact – contact from web site. A citizen can fill in a web site form and send the filled form from the web site. Important is that there is a form available on-line on a web site. Job information – information about free jobs in given institutions Information about staff – name of persons (at least the most important persons – managers, specialists) working for given institution and contacts for them Contact information – could be at least one of the following : official telephone number, official e-mail address, official fax number, official post address On-line appointment with a practitioner – possibility to make an on-line appointment with a practitioner from web site of hospital Seek a medical advice on-line from a practitioner – possibility to seek a medical advice on-line on a web site of hospital. Patient can write his or her health problem on a web site of a hospital to get an advice how to resolve the problem On-line reservation system – a citizen can make a reservation of a ticket on-line from a web site Video (audio) web presentation – video (audio) of a part of a theatre performance available on web site Number of visits – information about the number of visitors of web site On-line photo gallery – photo gallery available on web site of given institution Public administration offices in the survey- central state administration offices (ministries and central state admistration bodies) and self-government administration offices (regional offices and municipalities with extended competences)
6

Results of the survey
Text part E-GOVERNMENT Background information All central state administration offices and all self-government administration offices had their own web site and e-mail address. Information on web sites The most of the public administration offices publish agenda of the office on their web sites. (see the chart 1) Chart 1: Percentage of the public administration offices with web site, e-mail address and agenda on web site
98%
100%100%
web site e-mail address agenda on web site
Source: Web site content survey, CZSO, 2004 Most public administration offices (97,6%) have published also information about staff of the office. Surprisingly, only 53,9% of public administration offices have published information on web site by Public Administration Information System regulation. From central state administration offices 30,8%, from regional offices 85,7% and from municipalities with extended competences 54,6%. (see the charts 2 and 3) Chart 2: Percentage of the public administration offices with information by PAIS regulation on web site
no information by PAIS regulation
46,1%
information by PAIS regulation
53,9%
Source: Web site content survey, CZSO, 2004
7
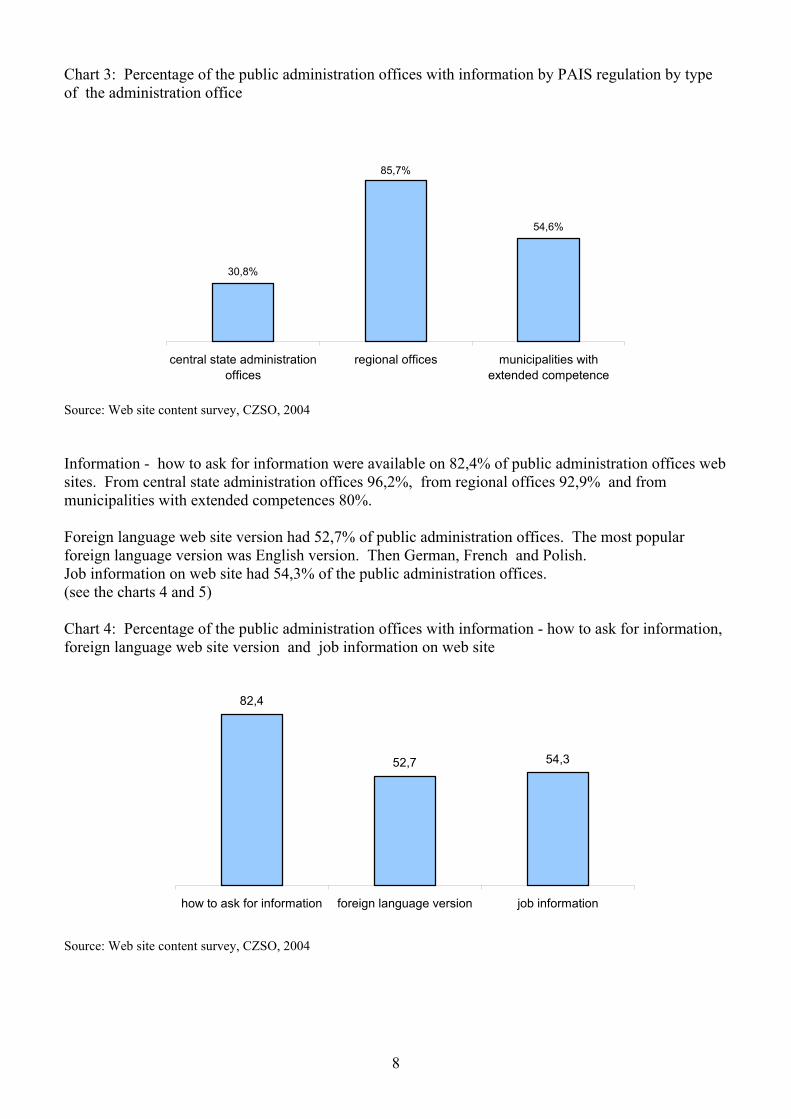
Chart 3: Percentage of the public administration offices with information by PAIS regulation by type of the administration office
30,8%
85,7%
54,6%
central state administrationoffices
regional offices municipalities withextended competence
Source: Web site content survey, CZSO, 2004 Information - how to ask for information were available on 82,4% of public administration offices web sites. From central state administration offices 96,2%, from regional offices 92,9% and from municipalities with extended competences 80%. Foreign language web site version had 52,7% of public administration offices. The most popular foreign language version was English version. Then German, French and Polish. Job information on web site had 54,3% of the public administration offices. (see the charts 4 and 5) Chart 4: Percentage of the public administration offices with information - how to ask for information, foreign language web site version and job information on web site
82,4
52,7 54,3
how to ask for information foreign language version job information
Source: Web site content survey, CZSO, 2004
8

Chart 5: Percentage of the public administration offices with information - how to ask for information, foreign language web site version and job information on web site by type of the administration office
88,5%80,8%
96,2%
78,6%
100%92,9%
46,3%47,8%
80%
how to ask for information job information foreign language version
central state administration offices
regional offices
municipalities with extendedcompetence
Source: Web site content survey, CZSO, 2004 Chart 6: Percentage of English, German and French language version from all web sites with foreign language web site version
98,4%
75,2%
10,9% 14,7%
English German French Others
Source: Web site content survey, CZSO, 2004
Information about departments of office published 78,1% of municipalities with extended competences and 92,9% of regional offices. Information about culture published 85,7% of regional offices and 95,1% of municipalities with extended competences. Information about the history of municipality published on web site 93,7% of municipalities with extended competences.
9

On-line services on web sites Electronic registry had 75,1% of public administration offices. From central state administration offices 84,6%, all regional offices and 72,2% of municipalities with extended competences. (see the charts 7 and 9) Chart 7: Percentage of the public administration offices with electronic registry
electronic registry75%
no electronic registry25%
Source: Web site content survey, CZSO, 2004 42,4% of public administration web sites provided citizens with a posibility to make a contact with their office on-line. 46,1% of public administration offices had web site with links to web sites of state administration (ministris and central state administration bodies) (see the charts 8 and 9) Chart 8: Percentage of the public administration offices with on-line contact and links to web sites of state administration
42,4%
46,1%
on-line contact links to state administration web sites
Source: Web site content survey, CZSO, 2004 Chart 9: Percentage of the public administration offices with electronic registry, on-line contact and links to web sites of state administration on web site by type of the administration office
84,6%
38,5%
69,2%
100%
78,6%71,4%72,2%
40,5% 41,5%
electronic registry on-line contact links to state administrationweb sites
central state administration offices
regional offices
municipalities with extendedcompetence
Source: Web site content survey, CZSO, 2004
10

E-HEALTH Background information The most of hospitals have own e-mail address (97,7%) and web site (80%). (see the chart 10) Chart 10: Percentage of hospitals with web site
hospitals with web site80%
hospitals without web site
20%
Source: UZIS, 2004
There were some regional differences. The best situation was in Liberec region, Olomouc region and Zlín region, where 88,9% of hospitals have own web site. On the other hand, the worst situation was in Plzeň region (60%), Pardubice region (62,5%) and Vysočina region (66,7%). (see chart 11) Chart 11: Percentage of hospitals with a web site by regions
80%88,9% 88,9% 88,9% 86,4% 85,7% 85,7% 80% 80% 78,9% 77,8% 76,2%
66,7% 62,5% 60%
CR
tota
l
Libe
reck
ý
Olo
mou
cký
Zlín
ský
Jiho
mor
avsk
ý
Král
oveh
rade
cký
Úst
ecký
Kar
lova
rský
Mor
avsk
osle
zský
Hl.
měs
to P
raha
Jihoče
ský
Stře
doče
ský
Vys
očin
a
Pard
ubic
ký
Plz
eňsk
ý
Source: UZIS, 2004
11

Information on web sites The most of hospital web sites provided patients with basic information about the hospital. All hospitals with a web site published contact information on web site, 93,6% information about departments, 80,7% information about staff, 76,4% opening hours , 57,1% job information and 45% map of the hospital. Foreign language web site version had 13,6% of hospitals. The most popular foreign language version was English version (95% of hospitals with foreign language version). (see the chart 12) Chart 12: Percentage of hospitals with specific information on web site (from all hospitals with a web site)
13,6
100%93,6%
80,7% 76,4%
57,1%45%
contactinformation
information aboutdepartments
information aboutstaff
information aboutopening hours
job information map of hospital foreign languageversion
Source: Web site content survey, CZSO, 2004 On-line services on web sites 14,3% of hospitals with a web site provided patients with a posibility to make an appointment on-line with a practitioner or to seek a medical advice on-line from a practitioner. (see the chart 13) Chart 13: Percentage of hospitals provided patients with a posibility to make an appointment on-line with a practitioner or to seek a medical advice on-line (from all hospitals with a web site)
no on-line appointment, no on-
line advice85,7%
on-line appointment, on-
line advice14,3%
Source: Web site content survey, CZSO, 2004
12
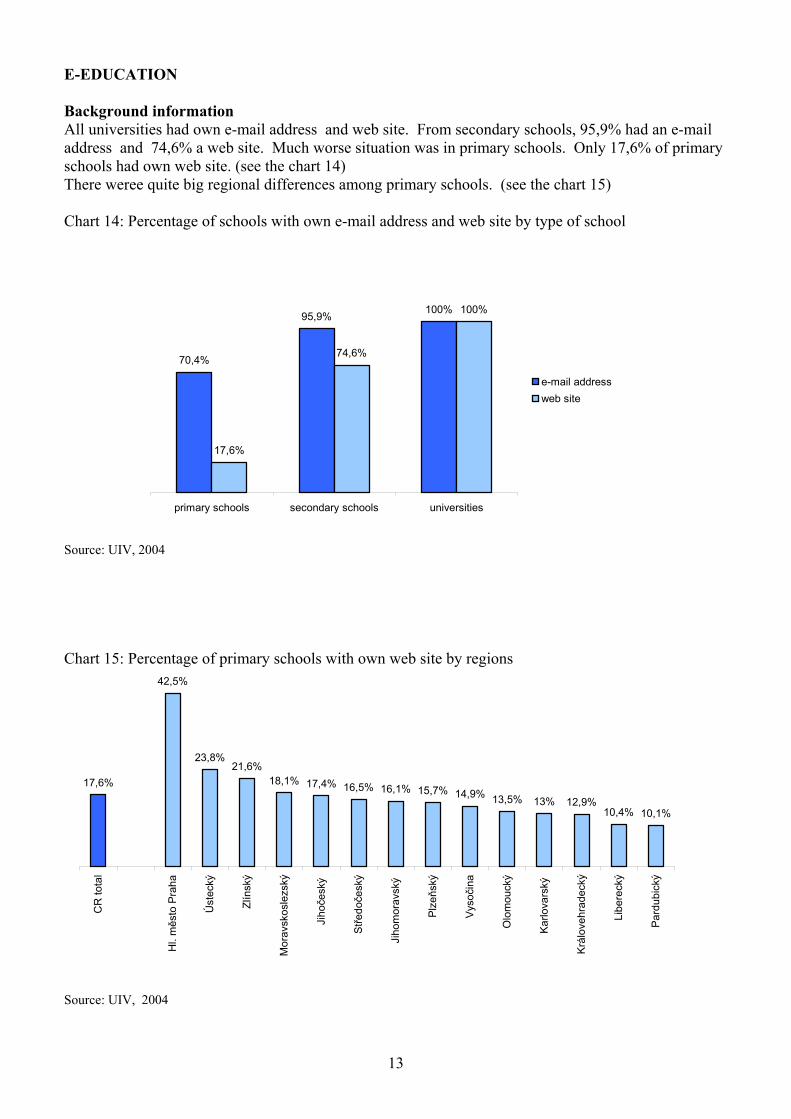
E-EDUCATION Background information All universities had own e-mail address and web site. From secondary schools, 95,9% had an e-mail address and 74,6% a web site. Much worse situation was in primary schools. Only 17,6% of primary schools had own web site. (see the chart 14) There weree quite big regional differences among primary schools. (see the chart 15) Chart 14: Percentage of schools with own e-mail address and web site by type of school
70,4%
95,9% 100%
17,6%
74,6%
100%
primary schools secondary schools universities
e-mail addressweb site
Source: UIV, 2004
Chart 15: Percentage of primary schools with own web site by regions
17,6%
42,5%
23,8%21,6%
18,1% 17,4% 16,5% 16,1% 15,7% 14,9% 13,5% 13% 12,9%10,4% 10,1%
CR
tota
l
Hl.
měs
to P
raha
Úst
ecký
Zlín
ský
Mor
avsk
osle
zský
Jihoče
ský
Stře
doče
ský
Jiho
mor
avsk
ý
Plz
eňsk
ý
Vys
očin
a
Olo
mou
cký
Kar
lova
rský
Král
oveh
rade
cký
Libe
reck
ý
Pard
ubic
ký
Source: UIV, 2004
13

E-CULTURE AND E-AUDIOVISUAL SECTOR Background information From 897 of culture and audiovisual institutions, included in web site content survey, 320 had own web site (35,7%). Chart 16 : Percentage of culture institutions with own web site by type of institution
66%
22,4% 26,4% 26,9%
11,6%
95,2%
theatres muzeums galeries historical buildings nationalmonuments
radios
Source: NIPOS, 2004 Theatres One of the most important indicator in the survey of theatres web sites was – number of institutions allowing on-line reservation system. 48,6 % of theatres with own web site provided citizens with an on-line reservation of tickets. (see the chart 17) Chart 17: Percentage of theatres with telephone, on-line and fax reservation system (from theatres with a web site)
5,7%
48,6%53,3%
telefon reservation system on-line reservation system fax reservation system
Source: Web site content survey, CZSO, 2004 From all theatres with a web site, 2,9 % used audio web presentations of their performance and 1,9% video web presentations. 15,2% offered a chat and 9,5 % fulltext. One of 159 theatres provided citizens with posibility to watch a performance on-line on the internet. (see the chart 18) Chart 18: Percentage of theatres with specific on-line services (from all theatres with a web site)
1,9%2,9%
9,5%
15,2%
chat fulltext audio presentation video presentation
Source: Web site content survey, CZSO, 2004
14

Museums Chart 19: Percentage of museums with specific information on their web site (from museums with a web site)
6 2 , 1 %
3 6 , 5 % 3 5 , 1 %
1 8 , 9 %
2 , 7 %
l in k s t o o t h e r m u s e u m s in f o r m a t io n a b o u tb o o k c a s e o f m u s e u m
n u m b e r o f v i s i t s a d v e r t s o n w e b s i t e jo b in f o r m a t i o n
Source: Web site content survey, CZSO, 2004 31,1% of museums with own web site offered a possibility of phone, fax or on-line ticket reservation. 27% of museums with own web site allowed phone, 17,6% on-line and 2,7% fax reservations. 8,1% offered fulltext and 2,7% opportunity for visitors to write short comments (fill in a web form) and send them to museum on-line. (see the chart 20) Chart 20: Percentage of museums with on-line ticket reservation system, fulltext and opportunity for visitors to write a short on-line comment
2,7%
8,1%
17,6%
on-line reservation system fulltext on-line contact
Source: Web site content survey, CZSO, 2004
Small number of museums offered also other on-line services. An on-line fotogallery was offered by 5,4% of museums with a web site, virtual exposition also by 5,4%, video available on web site by 1,4% and web camera by 1,4%. Radios: Usage of information and communication technologies in the audiovisual sector was much better than in the culture sector. From radios with own web site, nearly 60 % offered on-line broadcast, 37,3 % provided visitors with an on-line form on their web site to write a short comment, 15,3 % had a web camera and 10,2% a chat room on their web site. (see the chart 21)
15

Chart 21: Percentage of radios with specific on-line services (from radios with a web site)
59,3
37,3
25,4
15,310,2
on-line broadcast on-line contact fulltext web camera chat room
Source: Web site content survey, CZSO, 2004
Culture and audio-visual institutions - comparison Chart 22: Percentage of selected institutions by types of ticket reservation system
48,3%
27%
53,3%
38,3%
17,6%
48,6%
20%
2,7%5,7%
theatres museums historical buildings
telephone reservation systemon-line reservation systemfax reservation system
Source: Web site content survey, CZSO, 2004
Chart 23: Percentage of selected institutions with links and number of visits on web site
45,7
62,1
51,757,1
5054,2
23,8
35,1
23,328,6
37,5
16,9
theatres museums historicalbuildings
galleries nationalmonument
radios
linksnumber of visits
Source: Web site content survey, CZSO, 2004
16

DESCRIPTION AND ANALYSIS OF METHODOLOGICAL APPROACH
Web site content survey was quite new data collection method for us. This data collection method gave us new experience from preparation of this specific type of survey and data collection from web sites. 1. Preparation of the survey - this part of the survey was very important for web site content survey. The most important for us was to choose the best indicators .
Choosing the right indicators was the most difficult problem of the survey. We were not able to use the same indicators for all types of institutions. We tried to use at least basic indicators for each institution. In the survey, there were several types of institutions – government institutions, health institutions, education institutions, culture institutions and audio-visual institutions. For each type of institution we were focused on finding out : 1. information published on web site 2. on-line services available on web site Information published on web site – there are different indicators for different types of institutions. We wanted to use only the right indicators for each type of insitution. Services of different types of insitutions to citizens are different. For example – culture institutions will not provide citizens with the same services as government institutions or health institutions. We had to ask a question – what type of services does this type of institution offer to citizens ? And then – what type of information and on-line services could be there on a web site of this institution? After answearing those questions we developed several indicators for each type of institution.
2. Sample of the survey – Another quite big problem. First we wanted to survey approximately 12.000 institutions. In the preparation phase of the survey we realized, that it was not possible. There were 6.676 institutions in the first phase of the survey (to get background information about the numbet of institutions with a web site).
In the second phase of the survey (real content survey) – there were only 1.317 institutions. (see methodology) Reason for including only 1.317 institutions – we chose the most important types of institutions.
Only institutions that provide citizens with the most important types of services – for exaple – municipalities with extended competences are administrative centres for citizens. We wanted to realize in-depth analysis of the content of those insititutions. Better to have in-depth information about the most important types of insitutions than only few information about each single institution. Another reason - no time to survey all 12.000 institutions.
If we had included all institutions, it would have taken too much time to open each web page and analyze its content.
3. Database sources - When we had chosen population and sample we had to find out, how many of
them had own web site. We used also database sources.
4. Pre-testing – pre-testing was another important step in the survey. The aim of the pre-testing was to test proposed indicators. We tested all proposed indicators. Some of the indicators had to be modified and some thrown away. The most of the proposed indicators were accepted and used in the survey.
17
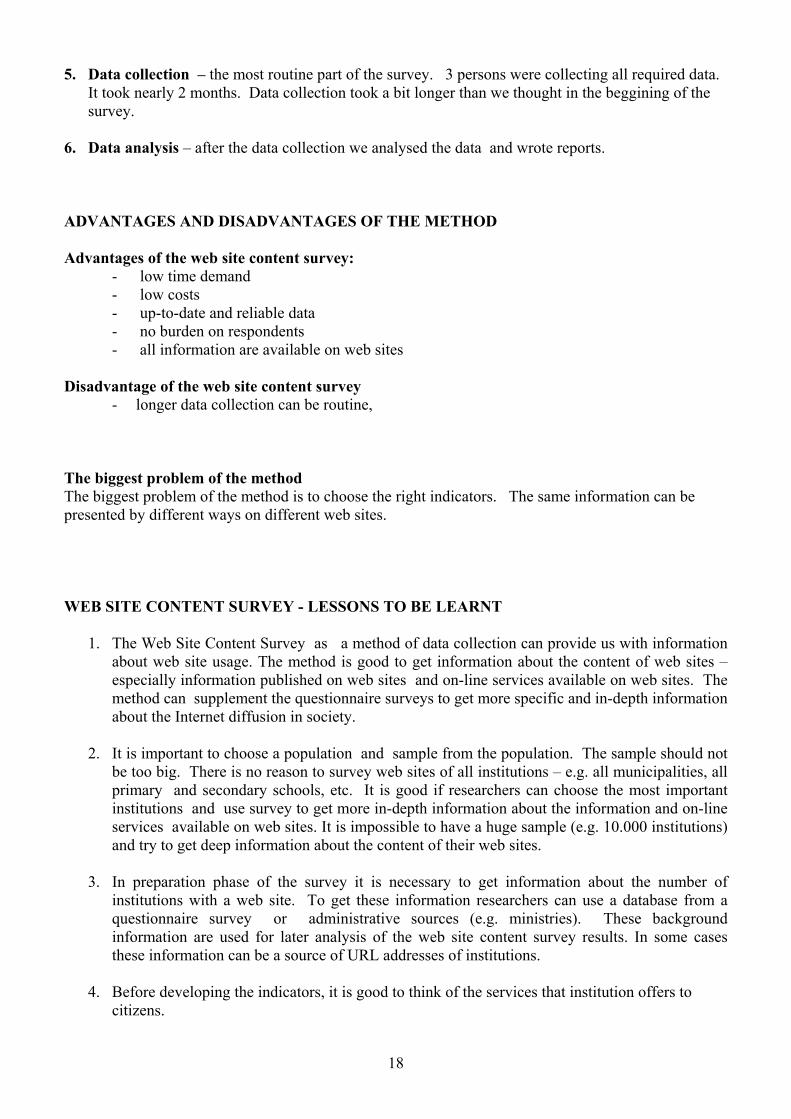
5. Data collection – the most routine part of the survey. 3 persons were collecting all required data.
It took nearly 2 months. Data collection took a bit longer than we thought in the beggining of the survey.
6. Data analysis – after the data collection we analysed the data and wrote reports.
ADVANTAGES AND DISADVANTAGES OF THE METHOD Advantages of the web site content survey:
- low time demand - low costs - up-to-date and reliable data - no burden on respondents - all information are available on web sites
Disadvantage of the web site content survey
- longer data collection can be routine, The biggest problem of the method The biggest problem of the method is to choose the right indicators. The same information can be presented by different ways on different web sites. WEB SITE CONTENT SURVEY - LESSONS TO BE LEARNT
1. The Web Site Content Survey as a method of data collection can provide us with information about web site usage. The method is good to get information about the content of web sites – especially information published on web sites and on-line services available on web sites. The method can supplement the questionnaire surveys to get more specific and in-depth information about the Internet diffusion in society.
2. It is important to choose a population and sample from the population. The sample should not
be too big. There is no reason to survey web sites of all institutions – e.g. all municipalities, all primary and secondary schools, etc. It is good if researchers can choose the most important institutions and use survey to get more in-depth information about the information and on-line services available on web sites. It is impossible to have a huge sample (e.g. 10.000 institutions) and try to get deep information about the content of their web sites.
3. In preparation phase of the survey it is necessary to get information about the number of
institutions with a web site. To get these information researchers can use a database from a questionnaire survey or administrative sources (e.g. ministries). These background information are used for later analysis of the web site content survey results. In some cases these information can be a source of URL addresses of institutions.
4. Before developing the indicators, it is good to think of the services that institution offers to
citizens.
18

5. It is absolutely necessary to realize pre–testing to chose appropriate indicators and thrown away the unappropriate ones.
6. Data collection could take a bit longer than planned. There are a lot of information on web sites
and researchers could be quite tired of browsing the sites and looking for specific data. In a data collection preparation phase it is good to think of several extra days to finish the collection.
FUTURE DIRECTIONS We would like to do this survey again in 2005. The next survey will be a bit different than the survey realized in 2004. There is no reason to survey if an institution with a web site put basic information on the site. From the 2004 survey we know that almost each institution with a web site use the site to provide citizens with basic information. In the future we would like to be more focused on on-line services provided on web sites.
19

Table part Table 1: Sample of the survey
Type of institutions Number of institutions in the survey
Government institutions 245 in which: -central state administration offices 26 ministries 16 central state administration bodies 10 -self-government administration offices 219 regional offices 14 municipalities with extended competences 205 Education institutions 5359 In which: - universities 51 - secondary schools 1463 - primary schools 3845 Health institutions - hospitals 175 Culture institutions 835 in which : - museums 331 - galleries 53 - theatres 159 - historical buildings 223 - national monuments 69 Audio-visual institutions - radios 62 Total number of institutions in the survey 6676
Table 2 : Number of institutions with a web site
Institutions with web site
Total number of institutions total %*
Government institutions 245 245 100 in which: -central state administration offices 26 26 100 ministries 16 16 100 central state administration bodies 10 10 100 -self-government administration offices 219 219 100 regional offices 14 14 100 municipalitie with extended competences 205 205 100 Education institutions 5359 1818 33,9 In which: - universities 51 51 100 - secondary schools 1463 1091 74,6 - primary schools 3845 676 17,6 Health institutions – hospitals 175 140 80 Culture institutions 835 261 31,3 in which : - museums 331 74 22,4 - galleries 53 14 26,4 - theatres 159 105 66,0 - historical buildings 223 60 26,9 - national monuments 69 8 11,6 Audio-visual institutions – radios 62 59 95,2
* from total number of institutions 20

Table 3: Number of central state administration offices with specific information and on-line services available on web site
Central state administration Only ministries Only central state
administration bodies total %* total %* total %* information - how to ask for information 25 96,2 16 100 9 90 information by PAIS regulation 8 30,8 5 31,3 3 30 agenda 26 100 16 100 10 100 information about staff 25 96,2 16 100 9 90 job information 21 80,8 14 87,5 7 70 foreign language version 23 88,5 14 87,5 9 90 links to state administration web sites 18 69,2 14 87,5 4 40 fulltext 20 76,9 14 87,5 6 60 electronic registry 22 84,6 14 87,5 8 80 on-line contact 10 38,5 7 43,8 3 30
* from institutions with a web site Table 4: Number of self government institutions with specific information and on-line services available on web site
Self government institutions
Only regional institutions
Only municipalities with extended competences
total %* total %* total %* information - how to ask for information 177 80,8 13 92,9 164 80 information by PAIS regulation 124 56,6 12 85,7 112 54,6 agenda 214 97,7 14 100 200 97,6 information about staff 214 97,7 14 100 200 97,6 information about departments 173 79,0 13 92,9 160 78,1 job information 112 51,1 14 100 98 47,8 information about culture 207 94,5 12 85,7 195 95,1 information about history - - - - 192 93,7 foreign language version 106 48,4 11 78,6 95 46,3 links to state administration web sites 95 43,4 10 71,4 85 41,5 fulltext 116 53,0 9 64,3 107 52,2 electronic registry 162 74,0 14 100 148 72,2 on-line contact 94 42,9 11 78,6 83 40,5
* from institutions with a web site
21
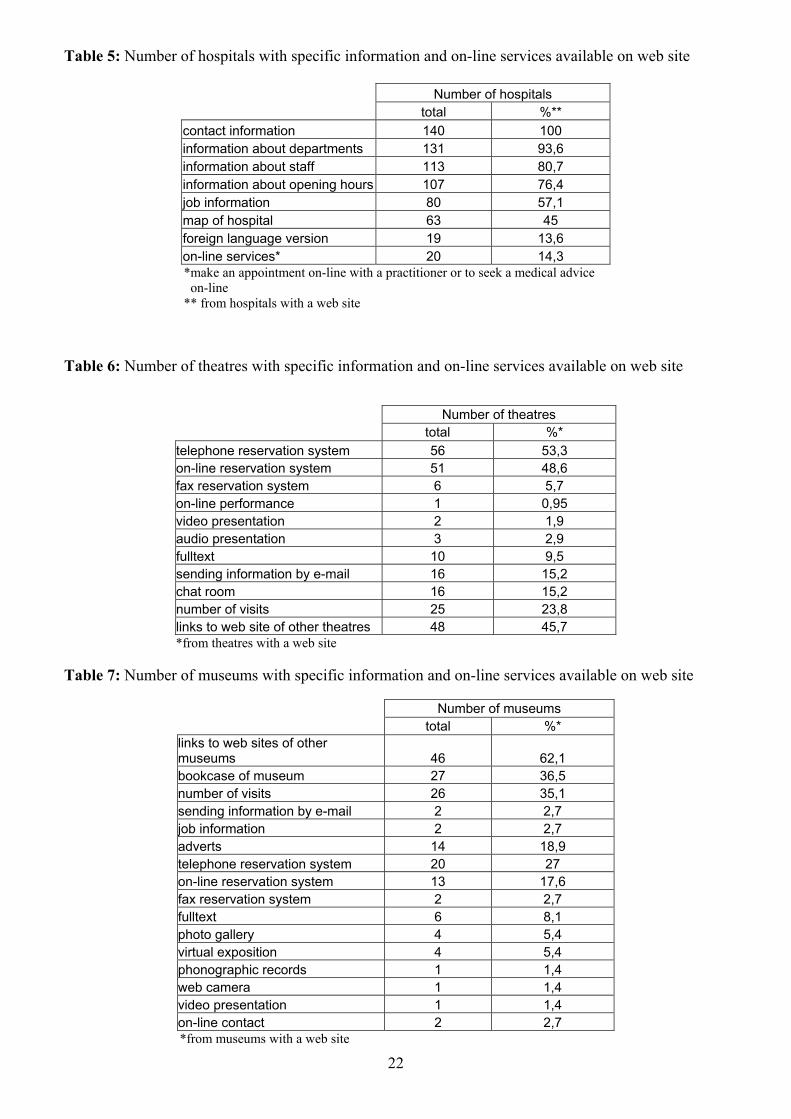
Table 5: Number of hospitals with specific information and on-line services available on web site
Number of hospitals total %** contact information 140 100 information about departments 131 93,6 information about staff 113 80,7 information about opening hours 107 76,4 job information 80 57,1 map of hospital 63 45 foreign language version 19 13,6 on-line services* 20 14,3 *make an appointment on-line with a practitioner or to seek a medical advice on-line ** from hospitals with a web site
Table 6: Number of theatres with specific information and on-line services available on web site
Number of theatres total %* telephone reservation system 56 53,3 on-line reservation system 51 48,6 fax reservation system 6 5,7 on-line performance 1 0,95 video presentation 2 1,9 audio presentation 3 2,9 fulltext 10 9,5 sending information by e-mail 16 15,2 chat room 16 15,2 number of visits 25 23,8 links to web site of other theatres 48 45,7 *from theatres with a web site
Table 7: Number of museums with specific information and on-line services available on web site
Number of museums total %* links to web sites of other museums 46 62,1 bookcase of museum 27 36,5 number of visits 26 35,1 sending information by e-mail 2 2,7 job information 2 2,7 adverts 14 18,9 telephone reservation system 20 27 on-line reservation system 13 17,6 fax reservation system 2 2,7 fulltext 6 8,1 photo gallery 4 5,4 virtual exposition 4 5,4 phonographic records 1 1,4 web camera 1 1,4 video presentation 1 1,4 on-line contact 2 2,7 *from museums with a web site
22

Table 8: Number of galleries with specific information and on-line services available on web site
Number of galleries total %* program of gallery 11 78,6 links to web site of other galleries 8 57,1 bookcase of gallery 6 42,9 number of visits 4 28,6 on-line photo gallery 1 7,1 on-line catalogue 3 21,4 * from galleries with a web site
Table 9: Number of historical buildings with specific information and on-line services available on web site
Number of historical buildings total %* bookcase 5 8,3 number of visits 14 23,3 links to web site of other historical buildings 31 51,7 job information 2 3,3 adverts 12 20 photo gallery 13 21,7 virtual sightseeing 6 10 digitized collections 1 1,7 web camera 1 1,7 telephone ticket reservation 29 48,3 on-line ticket reservation 23 38,3 fax ticket reservation 12 20 on-line contact 2 3,3 fulltext 6 10
* from historical buildings with a web site Table 10: Number of national monuments with specific information and on-line services available on web site
Number of national monuments total % number of visits 3 37,5 bookcase 4 50 links to web sites of other monuments 4 50 adverts 2 25 photo gallery 1 12,5
* from national monuments with a web site 23

24
Table 11: Number of radios with specific information and on-line services available on web site
Number of radios total %* number of visits 10 16,9 links to web sites of other radios 32 54,2 fulltext 15 25,4 on-line broadcast 35 59,3 on-line contact 22 37,3 chat room 6 10,2 web camera 9 15,3
* from radios with a web site