Embed Size (px)
Citation preview
Dairy Report 2015For a betterunderstanding of the dairy world
IFCNThe Dairy Research Network
Extract

1© IFCN Dairy Report 2015
Dear friends,
In this IFCN Dairy Report 2015 you will find a summary of the research highlights and network activities in 2015.
The IFCN Mission and VisionIFCN Mission: We create a better understanding of the dairy world by providing comparable data, knowledge and inspiration.
IFCN Content work 2015
Real time economic analysis: In times of rapid changes of milk and feed prices annual farm economic analyses are outdated too fast. Therefore IFCN was focussing in two areas to have a more real time understanding of the economic on typical farms in the current year 2015. Moreover a concept of monthly real time farm economics has been developed.
Dairy farm structure: Dynamics in farm structure are a key to predict dairy developments. IFCN has collected and standardised farm structure data. Additionally drivers, perspectives and potential future dairy farm types have been discussed.
Milk production by region: This year a key focus was to better un-derstand milk production by region within countries. These are more dynamic than average national statistics show.
Outlook: As each year IFCN was focussing on the perspectives of the dairy world in the short term (1-2 years) and the long run (next 10 years).
Highlights – IFCN events in 2015
IFCN Dairy Conference 2015The focus of this conference was dairy farm structure changes, their drivers and perspectives for the future. GEA hosted this event that took place in Kiel, Germany, in June.
IFCN Supporter Conference 2015The conference was held in September, in Minneapolis, USA. Focus was on the learnings from the US dairy industry and the global dairy developments. Cargill and Elanco hosted this conference. IFCN Regional Workshop 2015During this workshop in India, the participants discussed the question: How to sustainably increase milk production in India at a price consu-mers can afford? YesBank, Cargill, Elanco and Royal Friesland Campina hosted this event.
Status of the research network in 2015 In the dairy sector analysis, 100 countries which represent 98% of the world’s milk production, have been included.
In the farm comparison 170 typical farms from 64 dairy regions in 55 countries were analysed.
IFCN Dairy Report 2015
Chapter 1: Cost comparison: This chapter summarises results on costs, returns, profitability and productivity of dairy farms worldwide.
Chapter 2: Global monitoring: This chapter provides a broad overview on specific dairy issues such as milk prices, feed prices and milk : feed price ratio.
Chapter 3: Dairy sector and chain profile: This profile, prepared for 100 countries, presents a comparable overview related to:
• Regionalaverageannualmilkproductiongrowth
• Farmstructuredataonfarmandherdsizes
• Pricesofcullcowsandpurchaseofland
• Milkandfeedprice
• Monthlyfarmgatemilkprice
Moreover, the key results are summarised at the beginning of the chapter via maps of the world and Europe.
Chapter 4: IFCN Methods & definitions: : IFCN Methods: This chapter is dedicated to explain the methods used for the IFCN analyses.
Acknowledgement We would like to thank all our scientific partners, agribusiness partners, institutional partners and the people working in the IFCN Dairy Research Center during the last year. It was a pleasure to work with you and strengthen the network in 2015. We are looking forward to our activities in 2016.
Torsten Hemme Anders FagerbergManaging Director Chairman of the IFCN Board
Introduction

2 © IFCN Dairy Report 2015
Djellali Abderrazak | Horizons Agro-alimentaires Boufarik, Gouraya, Algeria
Dairy Expert
Hugo Quattrochi | Unión Productores de Leche Cuenca Mar y Sierras, Tandil, Argentina
Anna Yeritsyan, Vardan Urutyan | International Center for Agribusiness Research and Education (ICARE), Yerevan, Armenia
Jon Hauser | Xcheque Pty Ltd, Glen Alvie, Victoria, Australia
Leopold Kirner, Josef Hambrusch, Gerhard Gahleitner | Federal Institute of Agricultural Economics, Vienna, Austria
Mohammad Uddin | Bangladesh Agricultural University, Mymensingh, Bangladesh
Национальной академии наук Беларус
и
Инст
итут системны х исследованийв АПК
Anatoli Takun, Sviatlana Takun | Institute of System Research in Agro-industrial Complex, Minsk, Belarus
Erwin Wauters | Institute for Agricultural and Fisheries Research, Merelbeke, Belgium
Steve Couture | Dairy Farmers of Canada, Ottawa, Canada
Mario E. Olivares |Cooprinsem, Osorno, Chile
Enrique Ortega, René Perez | C.N.L.M (Consejo Nacional de la Calidad de la Leche y Prevención de la Mastitis), Bogotá, Colombia
Iveta Bošková | ÚZEI – Research Institute of Agricultural Economics and Information, Prague, Czech Republic
Adel Khattab | Tanta University, Faculty of Agriculture, Animal production department, Tanta, Egypt
Jean-Luc Reuillon, Benôit Rubin | Institut de l’Èlevage, Département Actions Régionales, Aubière, France
Dorothee Bölling | IFCN Dairy Research Center, Kiel, Germany
Kuldeep Sharma | Suruchi Consultants, Noida, Uttar Pradesh, India
Devi Prasad Rao | Arohana Dairy Private Limited, Vallam, Tamil Nadu, India
Inderpreet K. Kullar | College of Dairy Science & Technology, Guru Angad Dev Veterinary and Animal Sciences University, Ludhiana, Punjab, India
Farhad Mirzaei | Animal Science Research Institute of Iran, Karaj, Iran
Fiona Thorne | Rural Economy Research Centre, Teagasc, Dublin, Ireland
Liron Tamir | Israel Dairy Board, Rishon-Le´Zion, Israel
Alberto Menghi | CRPA – Centro Ricerche Produzioni Animali, Reggio Emilia, Italy
Simone Adam | Ministère de l’Agriculture, Service d’Economie Rurale, Luxembourg, Luxembourg
José Luis Dávalos Flores | UNAM FMVZ CEIEPAA, Tequisquiapan, Mexico
Rigoberto Becerra | Establo Gibraltar, Gomez Palacio, Durango, Mexico
Btissam Kessab | Centrale Laitière, Casablanca, Morocco
Nicola Shadbolt | College of Sciences, Massey University, Palmerston North, New Zealand
Lorildo A. Stock | Embrapa Gado de Leite (Embrapa Dairy Cattle), Juiz de Fora, Minas Gerais, Brazil
Othman Alqaisi | Livestock and Feed Analyst at Noble Group, Geneva, Switzerland, Jordan
Sam Shi | Dairy Consultant, Beijing, China
Dairy Consultant
Dou Ming, Dai Hongqian | Beijing Orient Dairy Consultants Ltd, Beijing, China
Mc Loyd Banda | DARS - Department of Agricultural Research Services, Bunda College, Lilongwe, Malawi
Henri Bayemi, Asaah Ndambi | Institute of Agricultural Research for Development (IRAD), Yaoundé; Interna-tional Livestock Research Institute (ILRI), Nairobi, Kenya, Cameroon
Susanne Clausen | SEGES, Aarhus, Denmark
Asaah Ndambi | International Live-stock Research Institute (ILRI), Nairobi, Kenya, Ethiopia
Sami Ovaska, Olli Niskanen | Natural Resources Institute Finland (LUKE), Helsinki, Finland
Hiromi Hosono | The University of Tokyo, Tokyo, Japan
Ola Flaten, Bjørn Gunnar Hansen | NIBIO – Norwegian Institute of Bioeconomy Research, Ås, Norway
Participating dairy economists / co-editors of the IFCN Dairy Report

3© IFCN Dairy Report 2015
Shakir Ullah Akhtar | Dairy Expert, Afghanistan
Ilir Kapaj | Agricultural University Tirana, Albania
Felix Menzel | Dairy Expert, Mezza Sucre, Bolivia
Konstantin Stankov | Trakia University, Bulgaria
Ying Li | Nestlé Dairy Farming Institute, Shuangcheng, China
Federico Pérez García | DMV U.N., CNLM, Colombia
Francisco José Arias Cordero | Dos Pinos, Costa Rica
Jasmina Havranek, Iva Dolenčić Špehar | Faculty of Agriculture, University of Zagreb, Croatia
Rafael Vizcarra | Centro de la Industria Láctea, Quito, Ecuador
Katri Kall | Estonian University of Life Sciences, Estonia
Melake Assefa | Ministry of Agriculture, Ethiopia
Gerard You | Institut de L‘elevage, France
Lukasz Wyrzykowski | IFCN AG, Kiel, Germany
Arthur Grigorian | European Center for Research and Sustainable Development (ECRSD), Thessaloniki, Greece
Daniel Mándi-Nagy | Research Insti-tute for Agricultural Economics (AKI), Budapest, Hungary
Baldur H. Benjamínsson | Associati-on of Icelandic Dairy and Beef Cattle Farmers, Reykjavik, Iceland
Dr. A. K. Srivastava, Smita Sirohi | National Dairy Research lnstitute, Karnal, India
Emmanuel Kinuthia | International Livestock Research Institute, Kenya
Azat Mukaliev | Kyrgyz State Agricul-tural University, Bishkek, Kyrgyzstan
Agnese Krievina | Latvian State Insti-tute of Agrarian Economics, Riga, Latvia
Deiva Mikelionyte | Lithuanian Institute of Agrarian Economics, Vilnius, Lithuania
Blagica Sekovska | Veterinary Faculty, Institute for Food, Skopje, Macedonia
Zakaria Abd Rahman | Dairy Expert, Redagri Farm Sdn Bhd, Hulu Terengga-nu, Malaysia
Aminu Shittu | Usmanu Danfodiyo University, Sokoto, Nigeria
Euclides Diaz | ANAGAN-Asociación Nacional de Ganaderos de Panamá, Panama
Naomi K. Torreta | National Dairy Authority, Quezon City, Philippines
António Moitinho Rodrigues | School of Agriculture - Polytechic Institute of Castelo Branco, Portugal
Michael Mishchenko | DairyNews.ru, Russian Federation
Christian Corniaux | CIRAD / PPZS, Senegal
Margita Stefanikova | Slovak Associ-ation of Milk Producers (SZPM), Nitra, Slovakia
Ben Moljk | Agricultural Institute of Slovenia, Ljubljana, Slovenia
Hemali Kothalawala | Department of Animal Production and Health, Peradeniya, Sri Lanka
Juliane Liu | Forefront Enterprise Co., Ltd., Taipei, Taiwan
Adul Vangtal | Thai Holstein Friesian Association (T.H.A.), Thailand
Abdulkarim Abdulmageed Amad | Thamar University, Yemen
Rob Jansen-van Vuuren, Addmore Maniwa | Livestock Con-sultant, Department of Livestock & Veterinary Services, Zimbabwe
Researchers participating only in the country profile analysis or in specific country information:
Haroon Lodhi, Waseem Shaukat | Waseem Shaukat, Solve Agri Pak (Private) Limited, Lahore, Pakistan
Carlos A. Gomez | Universidad Nacional Agraria La Molina, Lima, Peru
Michał Switłyk, Ewa Kołoszycz | West Pomeranian University of Technology in Szczecin, Department of Management, Szczecin, Poland
Rade Popovic | University of Novi Sad, Faculty of Economics, Subotica, Serbia
Koos Coetzee | Milk Producers‘ Organisation, Pretoria, South Africa
Christian Gazzarin | Agroscope Research Station, Farm Management Group, Tänikon, Switzerland
Michel de Haan | Animal Sciences Group, Wageningen-UR, Lelystad, The Netherlands
Muhittin Özder, Selçuk Akkaya | Turkish Milk Council, Ankara, Turkey
Olga Kozak | National Scientific Centre, Institute of Agrarian Economics, Kyiv, Ukraine
Mark Topliff, Giles Bladford | Agriculture & Horticulture Development Board, Market Intelligence, Kenilworth, Warwickshire, United Kingdom
Mark Stephenson | University of Wisconsin - Center for Dairy Profitability (CDP), Wisconsin, USA
William Zweigbaum | Farm Credit East, Greenwich, New York , USA
Jorge Artagaveytia, Gabriel Bagnato | Instituto Nacional de la Leche, Montevideo, Uruguay
Steven Aikiriza | Dairy Development Authority, Kampala, Uganda
Agneta Hjellström | LRF Mjölk / LRF Dairy Sweden, Stockholm, Sweden
Nazar Omer Hassan Salih | Al - Neelain University, Khartoum, Sudan
Linda Nielsen | Zimbabwe Association of Dairy Farmers, Harare, Zimbabwe
National Network Team (Jesus Llorente, Ernesto Reyes, Carlos Garcia, Fernando Merelo, Alfredo Garcia) | TRAGSATEC & Ministerio de Agricultura, Alimentación y Medio ambiente, Madrid, Spain
Dhiaeddine M‘Hamed | Dairy Expert, Saliman, Tunisia
Participating dairy economists / co-editors of the IFCN Dairy Report

4 © IFCN Dairy Report 2015
Preface IFCN Dairy Report – Developments 2000 – 2015 6
Regional maps and the typical farms 7
About IFCN 8
IFCN Dairy Research Center and IFCN Board 9
16th IFCN Dairy Conference 2015 10
12th IFCN Supporter Conference 2014 11
3rd IFCN Regional Workshop 2014 12
1. Comparison of the typical farms 20141.1 Summary – Farm comparison 2014 17
1.2 Regional overview on costs and returns
of the dairy enterprise 18
1.3 Milk supply curves 2014 20
1.4 Cost of milk production on
average sized farms 2014 22
1.5 Cost of milk production in larger farms 2014 23
1.6 Description of the dairy farms analysed 24
1.7 Cost of milk production only 26
1.8 Total costs and returns of the dairy enterprise 28
1.9 Returns: Milk price, non-milk returns
and decoupled subsidies 30
1.10 Description of direct subsidies and policies 32
1.11 Dairy enterprise: Profits and return to labour 34
1.12 Asset structure and return on investment 36
1.13 Overview of all typical farms analysed –
costs and returns 38
1.14 Farm level analysis 40
2. Global monitoring dairy economic indicators
2.1 Summary: Monitoring dairy economic indicators 43
2.2 Global trends in oil, milk and feed prices 1981 – 2015 44
2.3 National milk prices in 2014 in US-$ 46
2.4 Monitoring milk prices 1996 – 2014 48
2.5 Monthly milk price transmission and key facts 50
2.6 Monitoring feed prices 1996 – 2014 52
2.7 Monitoring milk : feed price ratio 1996 – 2014 54
Milk production fact sheets
3. Country reports – Milk production fact sheets3.1 Summary – status and development of milk production 62
3.2 Status and development of milk production 64
3.3 Centres of milk production 2014 65
3.4 Percentage change in milk production 2009 – 2014 66
3.5 Volume change in milk production 2009 – 2014 67
3.6 Milk surplus and deficit in 2014 68
3.7 Land and quota prices in selected countries 70
3.8 Farm structure – Dairy farm numbers and IFCN Standard classes 72
3.9 Method explanation of the Country Page 2015 74
3.10 Afghanistan 75
3.11 Albania 76
3.12 Algeria 77
3.13 Argentina 78
3.14 Armenia 79
3.15 Australia 80
3.16 Austria 81
3.17 Azerbaijan 82
3.18 Bangladesh 83
3.19 Belarus 84
3.20 Belgium 85
3.21 Bolivia 86
3.22 Bosnia - Herzegovina 87
3.23 Brazil 88
3.24 Bulgaria 89
3.25 Cameroon 90
3.26 Canada 91
3.27 Chile 92
3.28 China 93
3.29 Colombia 94
3.30 Costa Rica 95
3.31 Croatia 96
3.32 Cuba 97
3.33 Cyprus 98
3.34 Czech Republic 99
3.35 Denmark 100
3.36 Ecuador 101
3.37 Egypt 102
3.38 Estonia 104
3.39 Ethiopia 105
3.40 Finland 106
3.41 France 107
3.42 Germany 108
3.43 Greece 110
3.44 Hungary 111
3.45 Iceland 112
3.46 India 113
3.47 Indonesia 114
3.48 Iran 115
3.49 Ireland 116
3.50 Israel 117
3.51 Italy 118
3.52 Jamaica 119
3.53 Japan 120
3.54 Jordan 121
3.55 Kazakhstan 122
3.56 Kenya 123
3.57 Korea, Republic of 124
3.58 Kyrgyzstan 125
3.59 Latvia 126
3.60 Lithuania 127
3.61 Luxembourg 128
3.62 Macedonia 129
3.63 Malawi 130
3.64 Malaysia 131
3.65 Mexico 132
3.66 Mongolia 134
3.67 Morocco 136
Afghanistan
Dairy Report 2015 – Table of Contents

5© IFCN Dairy Report 2015
4. Methods applied in IFCN analyses4.1 Standardisation used by IFCN 184
4.2 Typical farm approach 185
4.3 Definition of different enterprises 186
4.4 Whole farm calculations 186
4.5 Details on farm economic analysis 187
4.6 Method development: A brief update
of farm data in TIPICAL model 190
4.7 Method development: Real Time Farm
Economics in national and farm level 191
4.8 Glossary 192
4.9 Specifications of world regions 195
Annex A.1 IFCN dairy publications 198
A.2 Typical farm approach and data quality assessment 199
A.3 Description of the typical dairy farms analysed 200
A.4 Exchange rates 1996 – 2014 206
A.5 Abbreviations 207
A.6 Who is who 208
Lichtenstein
3.68 Nepal 1373.69 Netherlands 1383.70 New Zealand 1403.71 Nigeria 1413.72 Norway 1423.73 Pakistan 1433.74 Panama 1443.75 Paraguay 1453.76 Peru 1463.77 Philippines 1473.78 Poland 1483.79 Portugal 1493.80 Romania 1503.81 Russia 1513.82 Saudi Arabia 1523.83 Senegal 1533.84 Serbia 1543.85 Slovakia 1553.86 Slovenia 1563.87 South Africa 1573.88 Spain 158
3.89 Sri Lanka 1593.90 Sudan 1603.91 Sweden 1623.92 Switzerland 1633.93 Taiwan 1643.94 Tajikistan 1653.95 Tanzania 1663.96 Thailand 1673.97 Tunisia 1683.98 Turkey 1693.99 Turkmenistan 1703.100 Uganda 1713.101 Ukraine 1723.102 United Kingdom 1733.103 Uruguay 1743.104 USA 1753.105 Uzbekistan 1763.106 Venezuela 1773.107 Vietnam 1783.108 Yemen 1793.109 Zimbabwe 180
Dairy Report 2015 – Table of Contents
Ecuador
6 © IFCN Dairy Report 2015
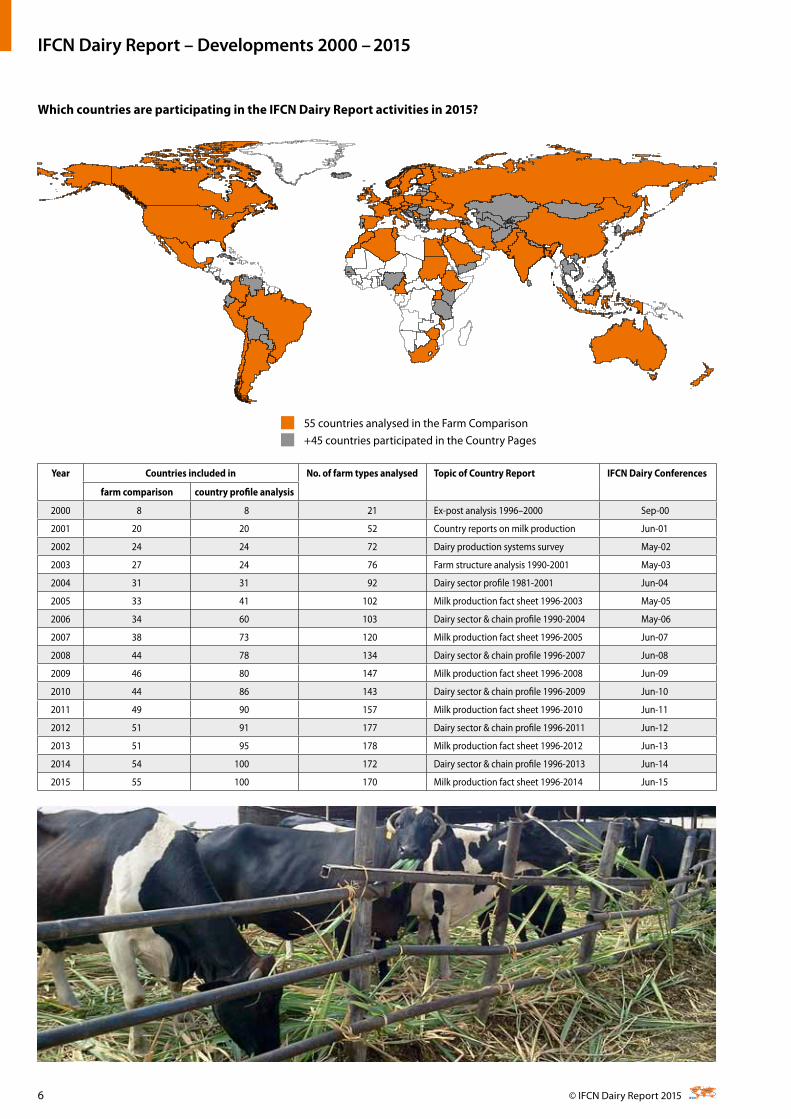
Year Countries included in No. of farm types analysed Topic of Country Report IFCN Dairy Conferences
farm comparison country profile analysis
2000 8 8 21 Ex-post analysis 1996–2000 Sep-00
2001 20 20 52 Country reports on milk production Jun-01
2002 24 24 72 Dairy production systems survey May-02
2003 27 24 76 Farm structure analysis 1990-2001 May-03
2004 31 31 92 Dairy sector profile 1981-2001 Jun-04
2005 33 41 102 Milk production fact sheet 1996-2003 May-05
2006 34 60 103 Dairy sector & chain profile 1990-2004 May-06
2007 38 73 120 Milk production fact sheet 1996-2005 Jun-07
2008 44 78 134 Dairy sector & chain profile 1996-2007 Jun-08
2009 46 80 147 Milk production fact sheet 1996-2008 Jun-09
2010 44 86 143 Dairy sector & chain profile 1996-2009 Jun-10
2011 49 90 157 Milk production fact sheet 1996-2010 Jun-11
2012 51 91 177 Dairy sector & chain profile 1996-2011 Jun-12
2013 51 95 178 Milk production fact sheet 1996-2012 Jun-13
2014 54 100 172 Dairy sector & chain profile 1996-2013 Jun-14
2015 55 100 170 Milk production fact sheet 1996-2014 Jun-15
Which countries are participating in the IFCN Dairy Report activities in 2015?
55 countries analysed in the Farm Comparison
+45 countries participated in the Country Pages
IFCN Dairy Report – Developments 2000 – 2015

7© IFCN Dairy Report 2015
North America
Europe and Middle East
South America
South East Asia and Oceania
Legend: Numbers indicate the number of cows in the typical farms. ++ = future farm, AMS = Automated Milking System (robot), B = Buffalo, BE = Beijing, bio = Organic, C= Central, CA = California, CN = Central North, DP = Dual purpose, E = East, HJ = Heilongjiang, ID= US-Idaho, JA = Jalisco, MC = Massif Central, N = North, NG = Ngantang, NJ = Nongkojaja, NW = North West, NY = New York, PU = Punjab, S = South, SE = South East, SW = South West, TO = Torreon, W = West, WI = Wisconsin
Regional maps and the typical farms
Canada49, 83, 355
Idaho (ID) 1000, 5000
Wisconsin(WI)80, 500
Mexico24 JA40 JA
1000 TO2000 TO
New York (NY) 70, 500, 2000
Colombia6, 100, 100 DP
Peru7, 17
Argentina170400
Chile60
108442
455++1275
Uruguay71
142419
Brazil23 S60 S
180 SE320 SE
Africa
Morocco3N, 8N
Algeria6, 18
Tunisia2, 4, 5, 12, 290
Egypt5B, 5,
10, 20, 190
Sudan20, 117
Ethiopia3, 10, 50
Uganda1, 3, 13
Malawi1, 6Zimbabwe
45, 360
South Africa230, 520, 630
Punjab4N, 20N
Haryana59N, 100N
India
China
Pakistan6, 25, 100
Tamil Nadu2 SE, 4 SE, 23 SE
Bangladesh2, 14
Indonesia3 NG, 10 NG, 2 NJ, 10 NJ
Australia300, 750
New Zealand390, 1194
Japan38, 72
Heilongjiang14 HJ, 520 HJ
Beijing17 BE, 340 BE
Hebei160 N, 210 N,
1689 N
Germany30 S, 79 S, 108 S, 126 N,
240 N, 700 E, 1200 E
Denmark150, 275
Norway20, 35 Sweden
55, 70, 220 Finland 25, 71, 129
Russia650, 1500, 3000, 2000
Belarus1, 660, 1395
Ukraine 200, 731
Poland 16, 25, 65
NL83, 188, 115 AMS
UK150 NW, 246 SW
Ireland70, 121
Belgium40 N, 95 N
Luxembourg62, 140
Spain55 NW, 76 S,
140 NW, 75 CN France
38 MC, 84 C, 66 W
Switzerland18, 23, 64
Italy154, 229
Austria16-bio, 27-bio,
60
Czech Republic
85, 400, 787
Serbia2, 10, 84
Turkey15, 100
Iran90, 120, 276, 458
Saudi Arabia3326
Jordan76, 412
Israel96, 443
Armenia6, 5, 35
Cameroon2, 11, 35, 50

8 © IFCN Dairy Report 2015
The dairy world todayToday the dairy world is serving over 7 billion consumers and pro-viding livelihoods for approximately 1 billion people living on dairy farms. The key challenges for the dairy stakeholders lie in its comple-xity and the high rate of change in a globalised world.
About IFCNIFCN is the global dairy research network. By addressing challenges in the dairy world, IFCN can contribute to a more resilient and more sustainable future for all of us.
What does IFCN do?IFCN provides globally comparable dairy data, outstanding know-ledge and inspiration to widen your imagination.
How does IFCN operate?
IFCN creates a better understanding of the global dairy world. The IFCN – International Farm Comparison Network - started in 2000 with the basics - the cow and the dairy farmer. Step by step we dee-pen and widen the knowledge base every year.
The knowledge is created via a network of dairy researchers from over 90 countries contributing to our annual processes and mana-ged by our 15 dairy researchers at the IFCN Dairy Research Center.
The IFCN economic models and standards ensure comparability between countries and provide a global picture.
More than 100 dairy related companies and organisations support the IFCN and use the knowledge to solve challenges in the dairy world better.
IFCN has innovative ways to share the knowledge with their mem-bers and with the dairy world as a whole. The IFCN events are a key element in developing the network spirit.
IFCN values: Trust – Independence - TruthTrust among the IFCN members is vital for open sharing, coopera-tion and a network that really works. The IFCN is independent from third parties and is committed to truth, science and reliability of re-sults. Truth means that IFCN shows the dairy world as it is and as ac-curately as measurements allow. IFCN describes realities and reports without having any hidden agendas.
IFCN VisionWe are the leading, global knowledge organisation in milk production, milk prices and related dairy economic topics.
IFCN MissionWe create a better understanding of the dairy world by providing comparable data, knowledge and inspiration.
Dairy data: We provide globally comparable dairy economic data and forecasts.
Knowledge: We create knowledge out of our data, models and analysis. Our core competence is in the field of milk production, milk prices and related economic topics.
Inspiration: We inspire people in the dairy world to build a better future. We inspire passionate people to develop a successful career in the dairy world.
What does IFCN offer stakeholders in the dairy chain?
1. Farmers: IFCN gives you a voice to reach other players in the dairy world. Actual global milk price trends and helpful IFCN pu-blications are published on the IFCN website. Farm comparison work allows you to judge the competitive position of milk pro-duction in your region.
2. Researchers and advisors: IFCN makes you part of the lea-ding global dairy network. We support you to serve your dairy stakeholders better and to develop your professional career in the dairy world - to become a leading dairy economist in your country.
3. Companies: IFCN provides dairy related companies such as milk processors and farm input companies a holistic and continuously updated picture of the dairy world. We help you to develop your business.
4. Global and national organisations involved in policy-ma-king for agriculture, environment and food supply: IFCN provides our holistic dairy knowledge to be used for your policy decisions and conferences.
5. Consumers: IFCN illustrates milk-production, its fascinating cul-ture and how this creates value in rural areas.
6. People in the IFCN Center: You are invited to build a life time career in the IFCN center to operate globally and enjoy a stable local life. You are also welcome to use IFCN as the ideal stepping stone for further developments in the dairy world.
For further information please contact: [email protected]
About IFCN

9© IFCN Dairy Report 2015
Organisational setup
The IFCN has a Dairy Research Center (DRC) with 18 employees, coordinating the network process and running dairy research activities.
Dorothee Bölling
Sandra Bornhöft
Amit Saha
Clara Secher
Anke Heyer
Hassan Ajini
Torsten Hemme
Lukasz Wyrzykowski
Rebecca Kühl
Barbara Siwirska
Dorthe Sigel
Malin Boge
Elgin Giffhorn
Karin Wesseling
Marion Carnehl
Maria Schmeer
William Allen
Prashant Tripathi
The IFCN Board has the mandate to support the IFCN management in the strategic development and guarantee transparency in the operation to the members of the network.
The IFCN Board is composed of the following members: Anders Fagerberg (chairman), Luc Morelon (nominated by the supporters), Ernesto Reyes (nominated by the researchers), Uwe Latacz-Lohmann (Kiel University), Olaf Rosenbaum (legal and fiscal expertise).
Anders FagerbergChairman
Ernesto Reyes
Luc Morelon
Uwe Latacz-Lohmann
Olaf Rosenbaum
IFCN Dairy Research Center IFCN Board
IFCN Dairy Research Center and the IFCN Board

16 | Comparison of the typical farms 2014 © IFCN Dairy Report 2015
Chapter 1 – Comparison of the typical farms 2014
Authors: Dorothee Boelling, Maria Schmeer, Amit Saha with the contribution from researchers mentioned on page 2-3 of this report
1.1 Summary – Farm comparison 2014 17
1.2 Regional overview of costs and returns of the dairy enterprise 18
1.3 Milk supply curves 2014 20
1.4 Cost of milk production on average sized farms 2014 22
1.5 Cost of milk production on large typical farms 2014 23
1.6 Description of the dairy farms analysed 24
1.7 Cost of milk production only 26
1.8 Total costs and returns of the dairy enterprise 28
1.9 Returns: Milk price, non-milk returns and decoupled subsidies 30
1.10 Description of direct subsidies and policies 32
1.11 Dairy enterprise: Profits and return to labour 34
1.12 Asset structure and return on investment 36
1.13 Overview of all typical farms analysed – costs and returns 38
1.14 Farm level time series analysis 2000-2014 – Cost of milk production only 40
Spain

44 | Global monitoring dairy economic indicators 1996 – 2014 © IFCN Dairy Report 2015
Chapter 2 – Global monitoring dairy economic indicators 1996 – 2014 Authors: Clara Secher, Łukasz Wyrzykowski, Hassan Aijini, Barbara Siwirska, William Allenwith the contribution from researchers mentioned on page 2 – 3 of this report
2.1 Summary: Monitoring dairy economic indicators 45
2.2 Global trends in oil, milk and feed prices 1981 – 2015 46
2.3 National milk prices in 2014 in US-$c 48
2.4 Monitoring milk prices 1996 – 2014 50
2.5 Monthly milk price transmission and key facts 52
2.6 Monitoring feed prices 1996 – 2014 54
2.7 Monitoring milk : feed price ratio 1996 – 2014 and margin over compound feed costs 56
Combined IFCN world milk price indicator
in U
S-$
/ 1
00
kg
EC
M
Combined IFCN world milk price indicator: weighted average of 3 IFCN world milk price indicators: 1. SMP & butter (35%), 2. Cheese & whey (45%), 3. WMP (20%)
0
10
20
30
40
50
60
70
1996
19
98
2000
20
02
2004
F 06
A
06
J 06
A
06
O 0
6 D
06
J 07
M
07
M 0
7 J
07
S 07
N
07
F 08
A
08
J 08
A
08
O 0
8 D
08
J 09
M
09
M 0
9 J
09
S 09
N
09
F 10
A
10
J 10
A
10
O 1
0 D
10
J 11
M
11
M 1
1 J
11
S 11
N
11
F 12
A
12
J 12
A
12
O 1
2 D
12
J 13
M
13
M 1
3 J
13
S 13
N
13
F 14
A
14
J 14
A
14
O 1
4 D
14
J 15
M
15
M 1
5 J
15
S 15
N
15
F 16
A
16
J 16
A
16
O 1
6 D
16
J 17
M
17
M 1
7 J
17
S 17
N
17
Range of IFCN milk price indicators (SMP & butter, cheese & whey, WMP)
Combined IFCN world milk price indicator
?
?
Iran

108 | Dairy sector and chain profile © IFCN Dairy Report 2015
Farm structure Farm structure Milk and feed price Monthly farm gate milk price% of dairy farms and cows % of cows per herd size EUR / 100 kg EUR / 100 kg ECM
in size classes (2014)
Key variablesAnnual growth rates
1996 1998 2000 2002 2004 2006 2008 2010 2012 2014 '04-'09 '09-'14
Milk production (cows')
Production (mill t ECM) 30.00 29.49 29.36 28.80 29.28 28.76 29.42 30.49 31.45 32.98 0.5% 1.9%
Cows (in 1,000's) 5,195 4,833 4,564 4,373 4,287 4,054 4,229 4,182 4,190 4,296 -0.6% 0.6%
Milk yield (t / cow / year) 5.8 6.1 6.4 6.6 6.8 7.1 7.0 7.3 7.5 7.7 1.0% 1.3%
Farm structure
No. of dairy farms (in 1,000's) 186 164 139 125 114 102 99 92 83 76 -3.3% -4.4%Average farm size (cows / farm) 28 30 33 35 38 40 43 46 51 56 2.9% 5.2%
Prices in national currency
Milk : feed price ratio 1.8 2.1 2.1 2.1 2.0 2.0 1.4 1.9 1.4 1.5 -7.6% 1.8%
Cull cow (EUR / kg live weight) 1.1 1.2 1.2 0.9 1.1 1.3 1.4 1.4 2.0 2.1 5.8% 8.3%
Land - buy (EUR / ha) 10,394 9,500 9,081 9,465 9,233 8,909 9,955 11,854 14,424 18,254 3.4% 10.8%
Quota (EUR / kg milk) 0.82 0.85 0.57 0.72 0.43 0.48 0.34 0.09 0.10 0.10 -16.1% -11.6%
0
5
10
15
20
25
30
35
40
1996
1998
2000
2002
2004
2006
2008
2010
2012
2014
National milk price (ECM)
National feed price
IFCN world feed price indicator
0%
10%
20%
30%
40%
50%
60%
70%
80%
90%
100%
1996
1998
2000
2002
2004
2006
2008
2010
2012
2014
1 - 9 10 - 19 20 - 29
30 - 49 50 - 99 100
0
5
10
15
20
25
30
35
40
45
50
1 -
9
10
- 19
20
- 29
30
- 49
50
- 99
10
0
Cows per size class
Farms per size class
0
5
10
15
20
25
30
35
40
45
2006
2007
2008
2009
2010
2011
2012
2013
2014
2015
National milk price
IFCN world milk price indicator
Top 10 regions - Ø annual milk production growth2009 - 2014 - regions represent 59% of national milk production in 2014
3.3%
2.5%
4.7%
1.6%
1.3%
2.1%
1.2%
1.6%
0.9%
1.4%
1. Weser-Ems
2. Schleswig-Holstein
3. Lüneburg
4. Oberbayern
5. Schwaben
6. Mecklenburg-Vorpommern
7. Sachsen Anhalt
8. Oberpfalz
9. Tübingen
10. Thüringen
3.42 Germany
Status and key developments
Status 2014
• No. 5 in the world milk production: 33.0 mill t ECM
• No. of dairy farms: 76,469
• Milk price: +16% to world market
• Feed price: +19% to world market
Key developments over the past five years
• Milk production growth: +1.9% per year
• Farm numbers: -4.4% per year
• Milk price was on average +12% to world market
• Feed price was on average +4% to world market
Explanations Sources: National statistics, FAO, IMF, Eurostat, AMI. 2014 data preliminary and partly estimated.Regional chart: Ranking according to year 2014 distribution. Milk production in natural fat and protein content.Estimates done for: Land price 2014 following the trend. Cull cow price 2011-2013 based on growth rate for price of cows, 2014 following that trend.Regional data remarks: 2014 data estimated.
Lukasz Wyrzykowski

© IFCN Dairy Report 2015 Methods applied in IFCN analyses | 183
Chapter 4 – Methods applied in IFCN analyses
Authors: IFCN
4.1 Standardisation used by IFCN 184
4.2 Typical farm approach 185
4.3 Definitions of different enterprises 186
4.4 Whole farm calculations 186
4.5 Details on farm economic analysis 187
4.6 Method development: A brief update of farm data in the TIPICAL model 190
4.7 Method development: Real Time Farm Economics at national and farm level 191
4.8 Glossary 192
4.9 Specifications of world regions 195
Italy

© IFCN Dairy Report 2015 annex | 197
Annex
a.1 IFCN Dairy publications 198
a.2 Typical farm approach and data quality assessment 199
a.3 Description of the typical dairy farms analysed 200
a.4 Exchange rates 1996 – 2014 206
a.5 Abbreviations 207
a.6 Who is who 208
IFCN team members in action

Partners of the IFCN
ISSN 1610-434X
Dairy researchers representing 100 countries
Institutional partners
Agribusiness partners
Milking and barn equipment
Health and hygiene
Feed
Farm machinery
Genetics for animal & plants
Other branches of the dairy chain
Peritus Farm DMCC
Milk processing
International Dairy Federation