Embed Size (px)
Citation preview

Sept 2008
DaewooInternationalCorporation
ContentsContentsCOMPANY PROFILEI
CORE COMPETENCIES
FINANCIAL PERFOMANCEII
III
GROWTH STRATEGIESIV
KEY ISSUESV

Part I.Part I. COMPANY PROFILECOMPANY PROFILECHRONOLOGY
ORGANIZATION & PERSONNEL
BUSINESS STRUCTURE
SHAREHOLDERS
CORPORATE GOVERNANCE

4
Chronology
Completed workout program
2003
Sales W5T
Credit rating BBB-
Discovery of Shwe gas field in Myanmar A-1 block
Operator of Myanmar A-3 block
2004
Credit rating BBB+
Discovery of Shwe Phyu gas field in Myanmar A-1 block
2005
Sales W6T
Discovery of Mya gas field in Myanmar A-3 block
Gas reserves certified
2006
Credit Rating A
Sales W7.8T: ranked 41st in sales volume in Korea
Operator of Myanmar AD-7 block
2007
Spun off from Daewoo Corp
Operator of Myanmar A-1 block
2000

5
Trading Overseas Branches
Overseas Subsidiaries DomesticManagement
3 Groups
11 Sales Divisions
48 Sales Teams
54 Branches & Agents
11 Trading Co.
30 Subsidiaries
13 Resource projects
Busan Factory
Daewoo Dept. Store4 Divisions
14 Teams
1 TFT
INTERNATIONALINTERNATIONAL DOMESTICDOMESTICHQ (Seoul)HQ (Seoul)
430 Residents 200 Factory : 646
Dept. Store : 207199
Overseas Employees
(as of end-June 2008)
Employees Employees Employees
Overseas Network : 108
Total Employees : 17,031
Locals 15,349
Organization & Personnel

6
Business Group 1- Steel- Metal
Business Group 2- Machinery & Plant - Automotive &
Component- Media & Electronic
Business Group 3- Commodity &
Natural Resources- Chemical- Textile- Energy Development
Business Group 4- Busan Factory- Daewoo Dept. store
(Wb) Revenue (2007)
▶ Exports 4,218▶ Trilateral 3,286▶ Domestic 312
Business Structure
Revenue (2007) W7,816b Operating Profit (2007) W92b

7
8 Domestic Financial Institutions (Korea EXIM Bank, KDB AM, KDB, Woori Bank, others) 31,571K (33.3%)
Korean Investors21,791K (22.9%)
Daewoo Int’l ESOP790K (0.8%)
Total Shares Outstanding : 94,988,776Total Shares Outstanding : 94,988,776(Paid-in Capital : W474.9b)
Joint Disposal AssociationSignatories : KAMCO and 8 Financial InstitutionsRestriction on independent selling Number of Shares held : 65,316 thousand (68.8%)
(As of end-June 2008)
Shareholders
KAMCO33,745K (35.5%)
Korean Investors18,200K (19.2%)
Foreign Investors10,683K (11.2%)

8
Corporate Governance
ShareholdersShareholders
BOD
CEOCEO
External Auditors
Business Operations Internal ControlInternal Committees
Credit Investment FX & Interest-Rate Brand
Ethics ManagementInternal Account ControllerAudit / Legal AffairsRisk ManagementAsset Management
Audit CommitteeSupervisory
Report majorManagerial issues& Suggest solutions
Transparent and Fair Disclosure
Audit
Executive Committee

Part II.Part II. FINANCIAL FINANCIAL PERFORMANCEPERFORMANCE
FINANCIAL HIGHLIGHTS
FINANCIAL RATIOS
SALES BREAKDOWN
CASH-FLOWS & BORROWINGS
OPERATING RESULTS (Quarterly)

10
OperatingResults
Sales
((WbWb))
5,144.53 6,383.61 7,816.15 3,886.86
20052005 20062006 20072007 1H 20071H 2007 1H 20081H 2008
4,994.38
OperatingProfit (%)
61.47(1.19)
77.70(1.22)
91.88(1.18)
61.52(1.58)
84.31(1.69)
187.63(3.65)
154.35(2.42)
128.88(1.65)
87.27(2.25)
71.93(1.44)
PretaxProfit (%)
Assets(Cash)
1,705.37(277.23)
1,928.79(202.02)
2,164.05(274.10)
2,113.32(119.40)
2,735.96(186.13)
Liabilities(Borrowings)
119.0 127.1 168.3
837.59 909.84 988.30 930.49 1,019.67Equities
103.6 112.0L/E (%)
FinancialPosition
867.78(261.86)
1,018.95(239.12)
1,175.75(289.79)
1,182.83(337.42)
1,716.29(417.61)
Financial Highlights
172.30(3.35)
112.81(1.77)
101.99(1.30)
60.20(1.55)
52.66(1.05)
Net Profit(%)

11
Operating Results (Quarterly)
30.18(1.09)
22.48(1.00)
18.70(0.98)
23.10(1.14)
38.68(1.97)
21.52(1.12)
Net Profit(%)
39.56(1.43)
32.37(1.44)
8.77(0.46)
32.83(1.62)
53.09(2.70)
34.18(1.78)
PretaxProfit(%)
△ 10.20△ 28.88△ 9.03△ 10.463.26△ 5.54G/L on FX(Net)
△ 3.40△ 3.82△ 4.47△ 4.40△ 5.59△ 3.75InterestExpense
45.98(1.67)
38.32(1.71)
2.06(0.11)
28.30(1.40)
28.25(1.44)
33.26(1.73)
OperatingProfit(%)
2,748.582,245.801,901.852,027.441,965.531,921.33SALES
2Q 20081Q 20084Q 20073Q 20072Q 20071Q 2007Wb

12
Sales & Operating ProfitSales & Operating Profit Interest CoverageInterest Coverage
PER & PBRPER & PBRL/E & B/AL/E & B/A
0
2,000
4,000
6,000
8,000
2005 2006 20070
30
60
90
120
150
0%
30%
60%
90%
120%
150%
180%
2005 2006 2007 1H 20080%
5%
10%
15%
20%
25%
30%
L/E(LHS)
B/A(RHS)
Sales (LHS)(CAGR 23% )
Operating Profit (RHS)(CAGR 22% )
21.1X
32.9X36.9X
4.3X4.1X 3.8X
2.3X3.2X
103.6%112.0%
119.0%
15.4%12.4% 13.4%
5,144b6,384b
7,816b
61b78b
92b
15.3%
168.3%
39.8X(E)
4.1X(E)
0
1
2
3
4
5
6
2005 2006 2007 1H 2008
InterestCoverage
0
1
2
3
4
5
2005 2006 2007 1H 2008
PER(X10)
PBR
Financial Ratios
3.1X
6.0X
(Wb) (Wb)

13
Sales Breakdown
20062006 20072007 1H 20081H 2008
6,384 7,816 (22.4% ) 4,994 (28.5% )
SALES SALES TYPETYPE
Export3,851
Trilateral2,279
Domestic254
Export4,218
(10% )
Trilateral3,286
(44% )
Domestic312 (23% )
Export2,615
(27% )
Trilateral2,225
(33% )
Domestic154 (6% )
Steel 1,157
Metal2,102
Commodity771
Chemical1,092
Other1,262
Chemical750.0
Steel 1,365
Metal2,863
Commodity1,034
Chemical1,237
Other1,317
ITEMSITEMS
Steel965.2
Metal1,954.4
Commodity699.3
Other625.5
(Wb)

14
(Wb) 2006 2007
Cash & Cash Equiv.(Beginning of Period)
153 107
CFO 7 214
Net Profit 113 102
Depreciation 15 14
CFI 8 -161
Investment onResource
Development
-68 -100
CFF -61 39
Dividend -24 -28
Cash and Cash Equiv.(End of period)
107 199
90.56
293.73
30.9
230.96
33.4
205.72128.07
161.72244.54
173.07
2004 2005 2006 2007
LT
ST
81.63
302.66
77.93
183.93
73.74
165.38
69.01
220.78
66.41
351.20
InterestBearing
Interest-free
■ LT vs ST
■ Interest Bearing vs Interest Free
(Wb)
(Wb)
Cash Flows & Borrowings
Cash FlowsCash Flows Borrowings BreakdownBorrowings Breakdown
1H2008
2004 2005 2006 2007 1H2008

Part III.Part III. CORE COMPETENCIESCORE COMPETENCIESCORE COMPETENCIES
BUSINESS PORTFOLIO
GLOBAL NETWORK
ENERGY & RESOURCES
ENERGY PROJECTS
MINERAL RESOURCE PROJECTS
ENERGY DIVIDENDS
16
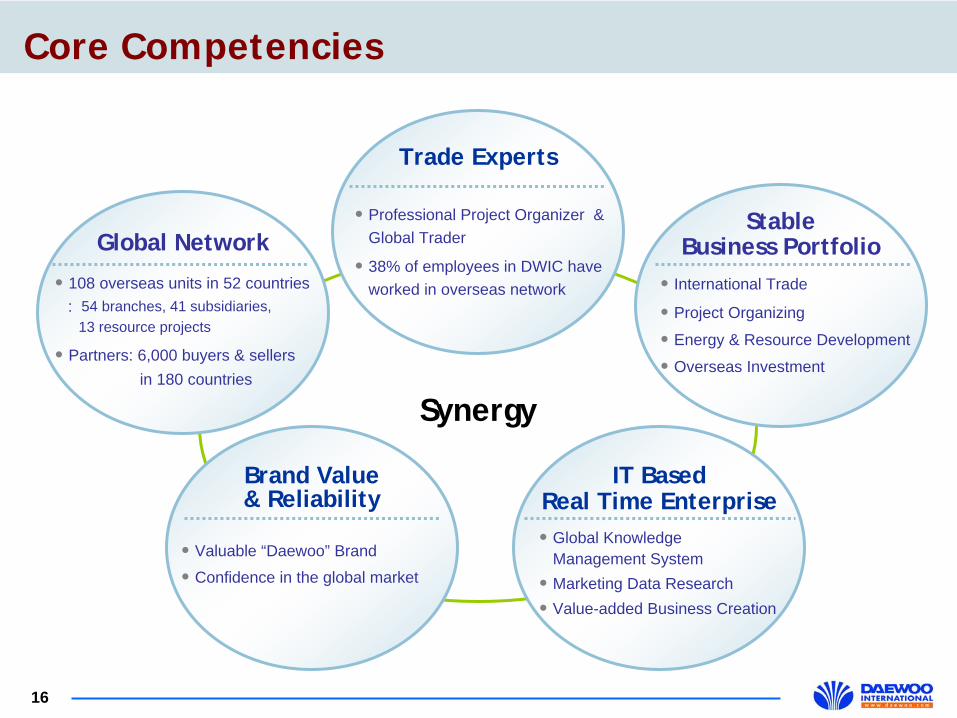
Core Competencies
Trade Experts
Professional Project Organizer & Global Trader
38% of employees in DWIC have worked in overseas network
Synergy
Global Network
108 overseas units in 52 countries: 54 branches, 41 subsidiaries,
13 resource projects
Partners: 6,000 buyers & sellersin 180 countries
Brand Value& Reliability
Valuable “Daewoo” Brand Confidence in the global market
IT BasedReal Time Enterprise
Global Knowledge Management SystemMarketing Data Research Value-added Business Creation
StableBusiness Portfolio
International Trade
Project Organizing
Energy & Resource Development
Overseas Investment

17
Business Portfolio
Creation of the Global Value as a company
specialized ininternational trade
& investment
International Trade
Project Organizing Energy & Resource Development
Overseas Investment
• Creation of new transaction complex
• Upgrade of Export & Import function
• Reinforcing overseas network
• M&A & IB in overseas
• Overseas energy development
• Increasing investment in mineral resource projects
• Turn-key based plant
• Power plant project

18
(as of end-June 2008)
Global Network
54 Branches
200 Residents / 15,349 Locals
30 Production & Service subsidiaries
11 Trading subsidiaries
13 Resource Development

19
10 Energy Projects 3 Mineral Resource Projects
(as of end-June 2008)
UZBEKISTANUZBEKISTAN
JAPADNO (gold)
RUSSIARUSSIA
WEST KAMCHATKA
CANADACANADA
BAKER LAKE (uranium)
PERUPERU
BLOCK 8 (Oil)
MYANMARMYANMARA-1 (gas)
(Operator)
VIETNAMVIETNAM
11-2 (gas)
MYANMARMYANMAR
A-3 (gas)(Operator)
MYANMARMYANMAR
AD-7(Operator)
OMANOMAN
KOLNG
MADAGASCARMADAGASCAR
AMBATOVY (nickel)
AZERBAIJANAZERBAIJAN
INAM
UZBEKISTANUZBEKISTAN
Bock 35 (Operator)
UZBEKISTANUZBEKISTAN
Block 36 (Operator)
Energy & Resources

20
ProjectProject EquityEquity ReserveReserve History & StatusHistory & Status RemarksRemarks
ENER
GY R
ESOU
RC
ES
PRO
DU
CTIO
N
Peru block 8(oil field) 11.7% 45 MM
bbl- 1996: Participation (operator : Pluspetrol)- Production: 18,000 bbbl/day (crude oil)
- Dividend: US$10m in 2007 US$ 7.6m in 2006
Oman KOLNG
(LNG plant)
20%(1% of OLNG)
14 TCF
- 1997: Participation (operator : Shell)- 2000: Production (dividend since 2002)• QLNG (stake of OLNG: 36.8%)
: Production In 2006 (capa: LNG 3.7MT)
- Dividend : US$12.1m in 2007US$13.5m in 2006
Vietnam offshore block 11-2 (gas field)
4.9%(6.5% of KC)
0.9 TCF23 MM
bbl
- 1992: Participation (operator : KNOC)- Gas field + condensate - Dec 2006: commercial gas production
- Dividend : US$ 1.6m in 2007
DEVELO
PMEN
T
Myanmar offshore block A-1(gas field)
51% (*Operator)
3.3 ~ 5.6TCF
- Aug 2000: Signed Production Sharing Contract- Jan 2004: Discovery of Shwe gas field- Mar 2005: Discovery of Shwe Phyu gas field- Aug 2007: Certification of reserves in Shwe &
Shwe-Phyu gas fields (from GCA)
- Sales MOU & GSA in 2008- Gas production in 2012
Myanmar offshore block A-3(gas field)
51% (*Operator)
1.3 ~ 2.2TCF
- Feb 2004: Signed Production Sharing Contract - Jan 2006: Discovery of Mya gas field- Aug 2007: Certification of reserves in Mya
gas field (from GCA)
- Sales MOU & GSA in 2008- Gas production in 2012
EXPLOR
ATIO
N
Myanmar offshore block AD-7
100% (*Operator) n/a
- Feb 2007: Signed Production sharing contract- 2007: 2D seismic acquisition & interpretation- 2008: 3D seismic survey
- Exploration drilling in 2008
Uzbekistanblock 35 & 36
100% (*Operator) n/a - Feb 2008: Signed Exploration Agreement
- 2 onshore blocks - Gravity & Magnetic Survey
in 2008~2009
Russia West Kamchatka
offshore block
4%(10% of KC) n/a
- Dec 2005: SPA (operator: Rosneft (60% stake))- 2005~2007: 2D & 3D seismic acquisition &
interpretation - Exploration drilling in 2008
Azerbaijan Inam block
2% (10% of KC) n/a - 2007: Participation (operator : BP)
Note) “KC” : Korean Consortium / “TCF” : Trillion Cubic Feet / “KNOC” : Korea National Oil Corporation
Energy Projects

21
ProjectProject EquityEquity ReserveReserve RemarksRemarks
MIN
ERA
L RESO
UR
CES
DEVELO
PMEN
T
MadagascarAmbatovy
(Nickel)
2.75% (10% of KC) 125 MM ton
- 2006: Participation - Operator: Sheritte (Canadian)- Parties: Sherritt 40%, Sumitomo 27.5%,
KC27.5% (KORES 21%)- Production in 2010- Production period : 27 years- Capacity (annual): Nickel 60,000 MT
Cobalt 5,600 MT
EXPLOR
ATIO
N
Uzbekistan Japadno
(gold)
10% (20% of KC) 40 ton
- 2005: Participation - Parties: Uzbekistan government 50%,
KC 50% (KORES 20%, DWIC 10%, etc) - 2006~2008 : Exploration
Canada Baker Lake (uranium)
1.7% 104 MM lbs
- 1983: Participation - Parties: AREVA (Canadian), JCU Canada etc- 1997: Completion of pre-feasibility study- 2005: Reorganize project team- 2006~2007: Conduct viability study- 2008~2011 : Environmental assessment study,
Final feasibility study
Note) “KC” : Korean Consortium / “KORES” : Korea Resources Corporation
Mineral Resource Projects

22
Energy Dividends
MyanmarBlock A3
Vietnamblock 11-2
Oman Korea LNG
Peru block 8 field
2004(51.0 %)
1992 (4.9 %)
1997(20.0 %)
1996(11.7 %)
-
1.6
12.1
10.0
20072007
DividendDividend
20042004
-
-
9.0
9.7
20052005
-
-
9.8
10.0
102.4
34.8
1.6
14.8
InvestmentInvestment(June 2008)(June 2008)
Contract Contract YearYear
(Stake)(Stake)ProjectProject
Total - 21.118.7 19.8288.4
Note: 1) Vietnam block 11-2 (PNG): production began in Dec 2006 2) E&P projects have borrowed from Korean government’s special energy fund (up to 60% of investment)
(US$m)
-
-
13.5
7.6
20062006
23.6
-
0.8
12.5
11.4
1H 20081H 2008
24.7
Myanmarblock A-1
2000(51.0 %) -- -134.8 - -

Part IV.Part IV. GROWTH STRATEGYGROWTH STRATEGYVISION
FUTURE GROWTH ENGINE
BUSINESS DEVELOPMENT STRATEGY
LONG-TERM BUSINESS PLAN
24
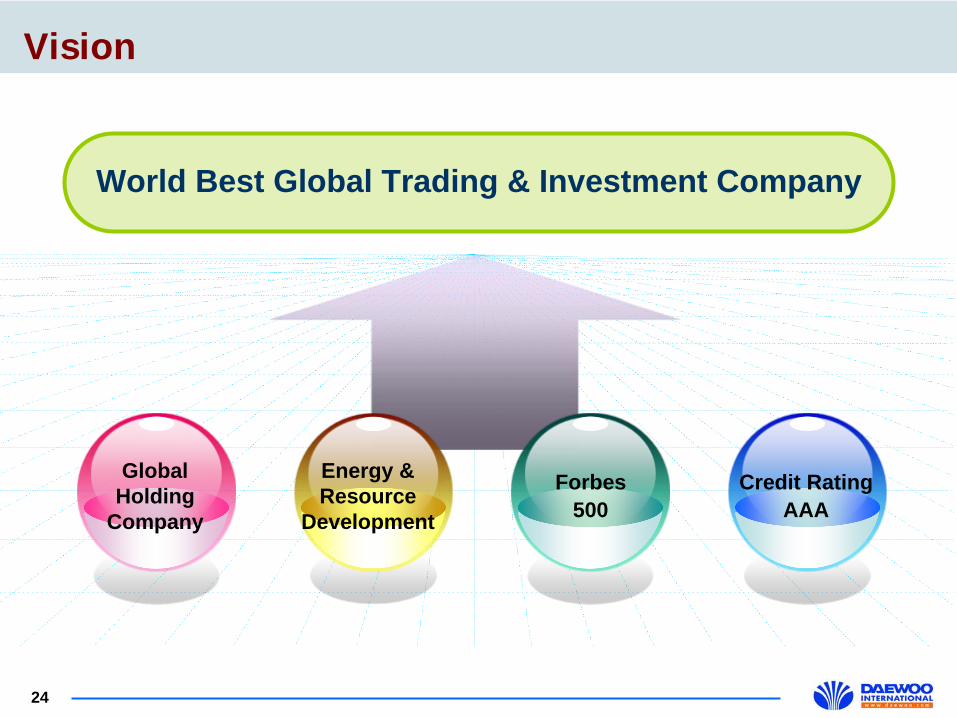
Vision
World Best Global Trading & Investment Company
GlobalHolding
Company
Credit RatingAAA
Energy &Resource
Development
Forbes500

25
Future Growth Engine
Creating new growth engines & profit models
M&A specialization( Building-up
new businesses )
Business diversification
Advancingtrading performance( Global Know-how )
Creation of higher value-added
business
Monetizationenergy & resources
( Investment Source )
Investment source

26
Monetization ofMyanmar Gas
Building-upCore Competencies
Foundation for Growth
Word-Class Company(2012 ~ 2015)
2nd Take-Off(2007 ~ 2011)
Diversification of Business portfolio(Spin-off ~ 2006)
* Strengthening Operation based on IB / M&A
* Raising Revenue fromEnergy & Resource Development
* Top Global Company (Global Holding Company)
* Increasing Investment inenergy & resource development
* Creating higher value-addedbusiness diversification
* Regaining trading power* Building-up integration
of enterprise operation * Building up Integrated
Risk Management System
Business Development Strategy

27
Sales
Salesper employee
Operating Profit
Operating Profitper employee
15,500
16
365
0.4
2012 P2012 P 2015 P2015 P
20,000
20
800
0.8
20072007
7,816
8
92
0.1
(Wb)
Long-term Business Plan

Part V.Part V. KEY ISSUESKEY ISSUESMYANMAR OFFSHORE BLOCKS
GAS FIELDS & PROSPECTS
DIVIDEND PAYOUT & MARKET PERFORMANCE
MILESTONE PLANS
KYOBO LIFE INSURANCE SHARES
GAS RESOURCES CERTIFICATE

29
1. Project : Myanmar block A-1 (since Aug 2000)
ㅇ Area: 2,119 km2
ㅇ Contract Type: Production sharing contractㅇ Ownership: Daewoo Int’l 51% (Operator)
ONGC Videsh 17%, MOGE 15%, KOGAS 8.5%, GAIL 8.5%
2. Project : Myanmar block A-3 (since Feb 2004)
ㅇ Area: 4,907 km2
ㅇ Contract Type: Production sharing contractㅇ Ownership: Daewoo Int’l 51% (Operator)
ONGC Videsh 17%, MOGE 15%, KOGAS 8.5%, GAIL 8.5%
3. Project : Myanmar block AD-7 (Feb 2007)ㅇ Area: 1,684 km2
ㅇ Contract Type: Production sharing contract ㅇ Ownership: Daewoo Int’l 100% (Operator)
Mandalay
Nay Pyi Taw
Yangon
SittweA-1A-1
AD-7AD-7
A-3A-3
YADANAYADANA
YETAGUNYETAGUN
BANKOK
Wang nol
Ratchaburi
Myanmar Offshore Blocks(as of end-June 2008)

30
Gas Fields & Prospects
• Over 50 experts in Daewoo Myanmar E&P office have controlled exploration & development of offshore block A-1, A-3 and AD-7.
• Consortium partners (KOGAS, ONGC, GAIL) have E&P organization.
SHWE
SHWE PHYU
MYA
31
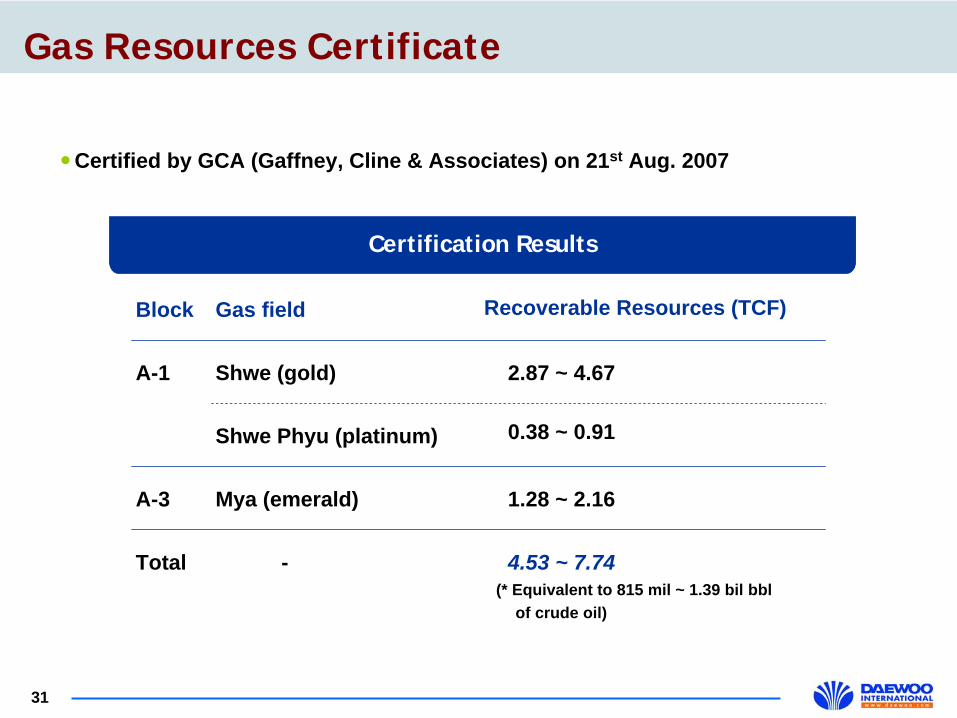
Certified by GCA (Gaffney, Cline & Associates) on 21st Aug. 2007
Gas Resources Certificate
Certification Results
Block Gas field Recoverable Resources (TCF)
A-1 Shwe (gold) 2.87 ~ 4.67
Shwe Phyu (platinum) 0.38 ~ 0.91
A-3 Mya (emerald) 1.28 ~ 2.16
Total - 4.53 ~ 7.74(* Equivalent to 815 mil ~ 1.39 bil bbl
of crude oil)

32
First Gas (Production)
Detail Design, Construction and Commissioning
Tender for FEED & EPC contractor
Government Approval of FDP Declaration of Commerciality
Gas Sales MOU / GSA
Option Selection (PNG/LNG)
20072007 20082008 20092009 20102010 20112011 20122012
Milestone Plans

33
Status of Daewoo’s holdings
Provided as collateral for KAMCO borrowings (W52.6b)
Valuation of Daewoo’s holdings
4.92m shares valued at KRW558.6b (book value) as of June 2008 (calculated at W113,529 per share)
Status of Kyobo Life Insurance
• Founded in 1958 • CEO : C. J. Shin since 2000 (33.6% stake)• Company Credit Rating (Dec.07) : AAA• B/S (Mar.08) : Asset W46.2t, Equity W2.5t• I/S (Apr.07~Mar.08) : Revenue W12.3t,
Net Profit W442b• In Sept.07, Kyobo Life issued 2mil new shares→ Daewoo’s subscription : 480k shares
at W185k / share
(Total 20.5m shares)
Shin Family 40.27%Daewoo Int’l 24.00%KAMCO 9.93%Korean Gov’t 5.85% Others 19.95%------------------------------Total 100.00%
Kyobo Life Insurance Shares
Kyobo Life Insurance Holdings(end-April, 2008)
Kyobo Life Insurance Holdings(end-April, 2008)

34
(Wb) 2005 2006 2007
Net Profit 172 112 102
Dividends 24 28 33
Payout Ratio(%) 13.8 25.3 32.6
Dividend Payout & Market Performance
Dividend PayoutDividend Payout Share Price PerformanceShare Price Performance
Foreign HoldingsForeign Holdings
0
2
4
6
8
10
12
2004 2005 2006 2007 1H 2008
6.7
2.72.1
6.8
11.3(as of year-end)(%)
0
5,000
10,000
15,000
20,000
25,000
30,000
35,000
40,000
45,000
50,000
2004 2005 2006 20070
50
100
150
200
250
300
350
400
Share Price (RHS)Trading Volume (LHS)
10,400
38,250 39,050 39,600
226
282
216
148
(m share)(Won)

Thank you!