Embed Size (px)
Citation preview
This document has been prepared for the European Commission however it reflects the views only of the authors, and the Commission cannot be held
responsible for any use which may be made of the information contained therein.
D5.3: Database of all found
services and business models
COST REDUCTION AND MARKET
ACCELERATION FOR VIABLE
NEARLY ZERO-ENERGY BUILDINGS
Effective processes, robust solutions, new business models and reliable life-cycle costs, supporting user
engagement and investors’ confidence towards net zero balance.
CRAVEzero - Grant Agreement No. 741223
WWW.CRAVEZERO.EU
Co-funded by the Horizon 2020
Framework Programme of the European Union

D5.3: Database of all found
services and business models
Authors (Editors):
Arnulf Dinkel1, Benjamin Köhler1, Fatma Rüveyde Özceylan1
Contributors:
Gerold Köhler2, Thomas Stöcker2, Annalisa Andoloro3, Federico Garzia3, Cristina Foletti4,
Christian de Nacquard5, Åse Togerö6, Mirco Balachia7, Klara Meier8, Tobias Weiss9, Armin Knotzer9
1Fraunhofer Institute for Solar Energy Systems ISE, Heidenhofstraße 2, 79110 Freiburg, Germany
2Köhler&Meinzer GmbH, Junkersring 14, 76344 Eggenstein-Leopoldshafen, Germany 3eurac research, Via A. Volta 13/A, 39100 Bozen/Bolzano, Italy
4Moretti S.p.A., via Gandhi 9, 25030 Erbusco (BS), Italy 5Bouygues Construction, 78061 Saint-Quentin-en-Yvelines France
6Skanska, SE-205 33 Malmö, Sweden 73i efficientamento energetico s.r.l., Via Galimberti 36, 15121 Alessandria, Italy
8ATP Sustain GmbH, Karlstraße 66, 80335 München, Germany 9AEE Intec, Feldgasse 19, 8200 Gleisdorf, Austria
December, 2019
Disclaimer Notice: This document has been prepared for the European Commission however it reflects the views only of the
authors, and the Commission cannot be held responsible for any use which may be made of the information contained therein.

ACKNOWLEDGMENT
Large parts of the report are based on the results of the Master-Thesis of Ms. Fatma Rüveyde Özceylan,
which was conducted in the frame of Work Package 5 nZEB Business Models of the CRAVEzero project.
FOREWORD
This report summarizes the results of deliverable D5.3: Database of all fund services and business models
within the work package ‘WP05 – New business models’, part of the Horizon 2020 - CRAVEzero project.
Figure 1: Screenshot of the CRAVEzero Business Model web tool
The overall aim of this work package is to find
systematically new ways to create new business
models for nearly Zero-Energy Buildings
(nZEBs).
The previous report “D5.2: Existing nZEB Busi-
ness Models” analysed the European markets for
interesting already existing business models
(BMs) for nZEBs and the general market-uptake
potential in the major markets. The report exam-
ined the collected BMs in terms of how they can
be characterised and what makes them successful.
This examination helped building up a reliable
basis to generate new BMs. They have given reli-
able information and profitability for the stake-
holders involved along the life-cycle of a building.
They help making more secure investments by

4
reducing the uncertainties. In deliverable D5.2, 60
business models of European markets were ex-
amined. The entire life-cycle of a building needed
to be analysed to get an overview of the different
BMs that evolve around nZEBs. This includes
the phases of political decision making, urban
design, building planning, construction, opera-
tion, renovation, monitoring and recycling. In
each of these phases various stakeholders take
part in the buildings life-cycle while trying to
capture value with their BM.
For the deliverable at hand, the partners and
stakeholders have been asked to provide ideas to
describe additional new BMs. Therefore, meth-
ods to find new business models were described
to give an idea and a basis to start thinking about
the finding process.
The Osterwalder BM canvas is a useful tool to
describe the elements of a business model as well
as the previous developed descriptive format.
There are also other methods which will be men-
tioned later to find new BMs such as:
Filling the gaps of already existing mod-
els
Upgrading already existing ones by add-
ing something new
Looking at the web and at the competi-
tors of a firm
Choosing a specific stakeholders group
and addressing only them with new BMs
Adjusting BMs to nZEB sector from dif-
ferent sectors
Combination of two different BMs.
The new found BMs are described in the descrip-
tive format and are attached in the appendix.
To give a useful overview of the existing and
newly found BMs, CRAVEzero created a web-
based tool to configure new and own BMs using
also elements of the BM repository:
http://www.cravezero.eu/development-of-new-
business-models/
This deliverable gives indications and informs
about the use of the webtool.
© Copyright by the Horizon 2020 Framework Programme of the European Union
Published by Arnulf Dinkel, Benjamin Köhler, Fatma Rüveyde Özceylan, Fraunhofer Institute for Solar
Energy Systems ISE, Heidenhofstraße 2, 79110 Freiburg, Germany
Disclaimer Notice: This document has been prepared for the European Commission however it reflects
the views only of the authors, and the Commission cannot be held responsible for any use which may
be made of the information contained therein.

5
Contents
1. Introduction ............................................................................................................................................................. 8
2. Objective ................................................................................................................................................................... 8
3. Methods .................................................................................................................................................................... 9
3.1. Advantage Comparison ................................................................................................................................. 9
3.2. Literature Review for Method...................................................................................................................... 9
3.3. Fill the Gaps .................................................................................................................................................... 9
3.4. New Value Proposition ................................................................................................................................. 9
3.5. Better/ New Customer Relation ................................................................................................................. 9
3.6. New Customer................................................................................................................................................ 9
3.7. New Activities ................................................................................................................................................ 9
3.8. Make Key Factors and Strengths Better ..................................................................................................... 9
3.9. NIghtmare Competitor ................................................................................................................................. 9
3.10. Adjust from Different Sectors ..................................................................................................................... 9
3.11. Combination ................................................................................................................................................ 10
4. CRAVEzero BM WebTool ................................................................................................................................ 10
4.1. Business Model Canvas .............................................................................................................................. 10
Limitations ................................................................................................................................................................. 11
5. BM repository ....................................................................................................................................................... 12
6. Handbook to use CRAVEzero BM-creator .................................................................................................... 14
6.1. Strengths and Key Factors ......................................................................................................................... 15
6.2. Activities and Capabilities .......................................................................................................................... 16
6.3. Maturity......................................................................................................................................................... 17
6.4. Value Propositions ...................................................................................................................................... 19
6.5. Customer Relationships ............................................................................................................................. 21
6.6. Channels ....................................................................................................................................................... 22
6.7. Customer Segments .................................................................................................................................... 23
6.8. Costs .............................................................................................................................................................. 25
6.9. Revenues ....................................................................................................................................................... 26
7. Results .................................................................................................................................................................... 28
8. Link to other WPs ................................................................................................................................................ 28
9. Discussion ............................................................................................................................................................. 28
10. Conclusion ........................................................................................................................................................ 30
11. Appendix ........................................................................................................................................................... 32

6
12. References ......................................................................................................................................................... 49
LIST OF FIGURES
Figure 1: Screenshot of the CRAVEzero Business Model web tool ....................................................................... 3
Figure 2: Screenshot BM Canvas and prefilled canvas. Highlighted area shows the two main functionalities
of ‘BM Canvas’ and ‘Create your own BM’. (http://www.cravezero.eu/pinboard/Canvas/BM_Canvas.htm)
.......................................................................................................................................................................................... 15
Figure 3: Strengths and Key Factors (http://www.cravezero.eu/pinboard/Canvas/BM_Canvas.htm) ....... 16
Figure 4: Activities and Capabilities (http://www.cravezero.eu/pinboard/Canvas/BM_Canvas.htm)......... 17
Figure 5: Maturity stages of the implementation of business model concept in companies (following
(PROTEMA Unternehmensberatung GmbH)) ....................................................................................................... 18
Figure 6: Maturity (http://www.cravezero.eu/pinboard/Canvas/BM_Canvas.htm) ....................................... 19
Figure 7: Value Propositions (http://www.cravezero.eu/pinboard/Canvas/BM_Canvas.htm) .................... 20
Figure 8: Customer Relationships (http://www.cravezero.eu/pinboard/Canvas/BM_Canvas.htm) ............ 22
Figure 9: Channels (http://www.cravezero.eu/pinboard/Canvas/BM_Canvas.htm) ...................................... 23
Figure 10: Customer Segments (http://www.cravezero.eu/pinboard/Canvas/BM_Canvas.htm)................. 24
Figure 11: Costs (http://www.cravezero.eu/pinboard/Canvas/BM_Canvas.htm) .......................................... 26
Figure 12: Revenues (http://www.cravezero.eu/pinboard/Canvas/BM_Canvas.htm) ................................... 27
Figure 13: The DENA building report 2016. Statistics and analyzes of energy efficiency in the building
stock. ................................................................................................................................................................................ 29
Figure 14: Segmentation of the commercial real estate market from a climate protection perspective .......... 30
Figure 15: BM 61 - Screenshot: https://bgridsolutions.com/#device ................................................................ 32
Figure 16: BM 61 - Placement of the BM along the lifecycle processes .............................................................. 32
Figure 17: BM 62 - Screenshot: https://kerberos.energy/en/xmonitor .............................................................. 33
Figure 18: BM 62 - Placement of the BM along the life-cycle processes ............................................................. 33
Figure 19: BM 63 - Screenshot: https://www.sunchain.fr/en............................................................................... 34
Figure 20: BM 63 - Placement of the BM along the life-cycle processes ............................................................. 34
Figure 21: BM 64 - Screenshot: ................................................................................................................................... 35
Figure 22: BM 64 - Placement of the BM along the life-cycle processes ............................................................. 35
Figure 23: BM 65 - Screenshot: ................................................................................................................................... 36
Figure 24: BM 65 - Placement of the BM along the life-cycle processes ............................................................. 37
Figure 25: BM 66 - Screenshot: https://www.mdpi.com/2075-5309/7/4/107 ................................................ 37
Figure 26: BM 66 - Placement of the BM along the life-cycle processes ............................................................. 37
Figure 27: BM 67 - Screenshot: ................................................................................................................................... 38
Figure 28: BM 67 - Placement of the BM along the life-cycle processes ............................................................. 38
Figure 29: BM 68 - Screenshot: https://www.goodwillsocal.org/one-stop-shop/ ........................................... 39
Figure 30: BM 68 - Placement of the BM along the life-cycle processes ............................................................. 39
Figure 31: BM 69 - Screenshot: https://www.canstockphoto.com/trust-us-stamp-24416751.html .............. 40
Figure 32: BM 69 - Placement of the BM along the life-cycle processes ............................................................. 40
Figure 33: BM 70 - Screenshot: http://winled.com/en/blog/article/Office-lighting-design.......................... 41
Figure 34: BM 70 - Placement of the BM along the life-cycle processes ............................................................. 41
Figure 35: BM 71 - Screenshot: https://sites.ndtv.com/breathe-clean/how-green-buildings-can-reduce-
your-carbon-footprint-2 ............................................................................................................................................... 42
Figure 36: BM 71 - Placement of the BM along the life-cycle processes ............................................................. 42
Figure 37: BM 72 - Screenshot: www.cravezero.eu ................................................................................................. 43

7
Figure 38: BM 72 - Placement of the BM along the life-cycle processes ............................................................. 43
Figure 39: BM 73 - Screenshot: ................................................................................................................................... 44
Figure 40: BM 73 - Placement of the BM along the life-cycle processes ............................................................. 44
Figure 41: BM 74 - Screenshot: ................................................................................................................................... 45
Figure 42: BM 74 - Placement of the BM along the life-cycle processes ............................................................. 45
Figure 43: BM 75 - Screenshot: ................................................................................................................................... 46
Figure 44: BM 75 - Placement of the BM along the life-cycle processes ............................................................. 46
Figure 45: BM 76 - Screenshot: https://www.eqmagpro.com/japan-will-explore-new-avenues-for-energy-
self-sufficiency/ ............................................................................................................................................................. 47
Figure 46: BM 76 - Placement of the BM along the life-cycle processes ............................................................. 47
Figure 47: BM 77 - Screenshot: http://doppiounostudio.com/ ........................................................................... 48
Figure 48: BM 77 - Placement of the BM along the life-cycle processes ............................................................. 48
LIST OF TABLES
Table 1: Important BM core parameters and short description ............................................................................ 11
Table 2: Analyzed new BMs and their categorization ............................................................................................. 12
Table 3:The matrix of new BM development methods and the new BMs .......................................................... 13
8
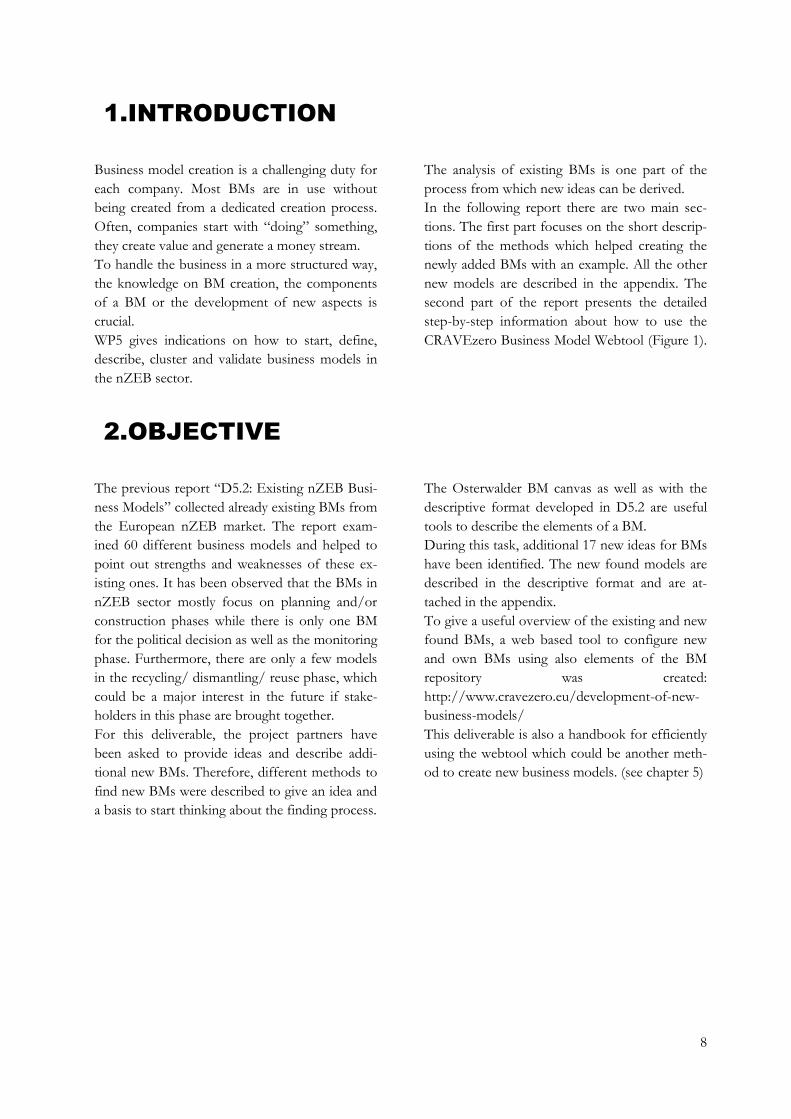
1.INTRODUCTION
Business model creation is a challenging duty for
each company. Most BMs are in use without
being created from a dedicated creation process.
Often, companies start with “doing” something,
they create value and generate a money stream.
To handle the business in a more structured way,
the knowledge on BM creation, the components
of a BM or the development of new aspects is
crucial.
WP5 gives indications on how to start, define,
describe, cluster and validate business models in
the nZEB sector.
The analysis of existing BMs is one part of the
process from which new ideas can be derived.
In the following report there are two main sec-
tions. The first part focuses on the short descrip-
tions of the methods which helped creating the
newly added BMs with an example. All the other
new models are described in the appendix. The
second part of the report presents the detailed
step-by-step information about how to use the
CRAVEzero Business Model Webtool (Figure 1).
2.OBJECTIVE
The previous report “D5.2: Existing nZEB Busi-
ness Models” collected already existing BMs from
the European nZEB market. The report exam-
ined 60 different business models and helped to
point out strengths and weaknesses of these ex-
isting ones. It has been observed that the BMs in
nZEB sector mostly focus on planning and/or
construction phases while there is only one BM
for the political decision as well as the monitoring
phase. Furthermore, there are only a few models
in the recycling/ dismantling/ reuse phase, which
could be a major interest in the future if stake-
holders in this phase are brought together.
For this deliverable, the project partners have
been asked to provide ideas and describe addi-
tional new BMs. Therefore, different methods to
find new BMs were described to give an idea and
a basis to start thinking about the finding process.
The Osterwalder BM canvas as well as with the
descriptive format developed in D5.2 are useful
tools to describe the elements of a BM.
During this task, additional 17 new ideas for BMs
have been identified. The new found models are
described in the descriptive format and are at-
tached in the appendix.
To give a useful overview of the existing and new
found BMs, a web based tool to configure new
and own BMs using also elements of the BM
repository was created:
http://www.cravezero.eu/development-of-new-
business-models/
This deliverable is also a handbook for efficiently
using the webtool which could be another meth-
od to create new business models. (see chapter 5)

9
3.METHODS
The tasks conducted are a core process in the
field of business model creation. In practice it is
helpful to organize a small team within a compa-
ny or institution to discuss all aspects in the
group and to get valuable feedback. Project part-
ners were asked to form small teams and fill re-
spective formats to describe new BMs. There are
several methods and streams to think about new
BMs:
3.1. ADVANTAGE COMPARISON
This method is about analysing existing business
models and working on their advantages and
disadvantages, examining their gaps, and focusing
on making these missing parts better.
3.2. LITERATURE REVIEW FOR
METHOD
Reviewing the literature for methods of creating
new business models could be used to develop a
complete new idea to apply.
3.3. FILL THE GAPS
New business models can be developed by exam-
ining the existing ones, studying them and then
improving their weak points.
3.4. NEW VALUE PROPOSITION
By creating new value propositions and/ or mak-
ing existing value propositions better could be
another method to create new business models.
3.5. BETTER/ NEW CUSTOMER
RELATION
Customer relationship is a very important success
factor. Making it better and/ or easier could be
helpful to create new business models.
3.6. NEW CUSTOMER
This could be a good method for the stakehold-
ers who want to launch a new company or for the
existing companies which would like to extend
their range of customer segments they refer to.
Finding a new customer segment, identifying
them and addressing their needs could be another
method to find new business models in the
nZEB sector.
3.7. NEW ACTIVITIES
Like the method mentioned above finding, iden-
tifying and addressing new activities and capabili-
ties could bring new business model ideas to the
nZEB market.
3.8. MAKE KEY FACTORS AND
STRENGTHS BETTER
Focusing on making the key factors and the
strengths of a company’s business model better
could lead to develop new business models.
3.9. NIGHTMARE COMPETITOR
“Define your nightmare competitor”- is a method
to describe the worst new competitor of your
own company – then learn from that business
model and add/ replace the learnings to your
own BM.
3.10. ADJUST FROM DIFFERENT
SECTORS
Some business models from different sectors
could give an idea for a new business model in
the nZEB sector. Combine the existent BMs with
models outside the building sector e.g. transpor-
tation, energy services, trading sector could be a
different method to create new business models.

10
In the following, an example business model
which is developed with this method will be ex-
plained.
‘BM 67: Easy Communication Online’ (check
Appendix) was inspired by shipment companies
which provide a tracking number for the custom-
ers to make the following process easy both for
the customers and the company itself. By this
way, the customer can track their package when-
ever they want easily and can plan their day ac-
cordingly. It is even possible for some shipment
companies to set an alert via e-mail or text about
the processes which the customer wants to be
warned. When it’s not possible to reach the cus-
tomer, the company can leave them a notice with
the available times for them for the customer to
get back in touch. By this way, both money and
time could be saved for the customer and the
company.
Inspired by this business model, a new BM was
developed for the nZEB sector where the cus-
tomer can follow up the main processes of the
building design, construction, operation, renova-
tion, monitoring phases and etc. The purpose of
this BM is to automate the process of following
an order from a company. Therefore, automated
services (notification, email etc.) can be an option
for customer relationships. Besides that, self-
service of personal assistance would also serve
the purpose.
The benefits of this new BM are:
One hand solution for complex require-
ments
Easy coordination and communication
with the tracking app
Decreasing the staff cost of a company
which would be used for the communi-
cation purposes instead of tracking app
3.11. COMBINATION
It is also possible to develop new BMs with a
combination of two or more different business
models.
4.CRAVEZERO BM WEBTOOL
CRAVEzero Business Model Web Tool
(http://www.cravezero.eu/pinboard/Canvas/B
M_Canvas.htm) is a useful tool to present all the
collected (already existing and newly found) BMs
in one place. On the other hand, this web tool
offers a service to create new business models by
filling the template and printing them out. This
method as well could be used to develop new
BMs. The detailed information about how to use
this web tool will be described in the next chap-
ter. Within this tool one can use the different
methods to create a new model.
The descriptions in Table 1 show an overview of
the core parameters of the methods for business
model developments which are mentioned in this
deliverable. However, this is an indicative table
which still can be extended with different meth-
ods available out there.
4.1. BUSINESS MODEL CANVAS
Filling the Business Model Canvas of choice is
another method to develop a business model.
These canvases are actually not only to develop,
but also to have a deep understanding of the
existing BM of a firm. D5.1 gives more detailed
information about the Osterwalder Business
Model Canvas.
11
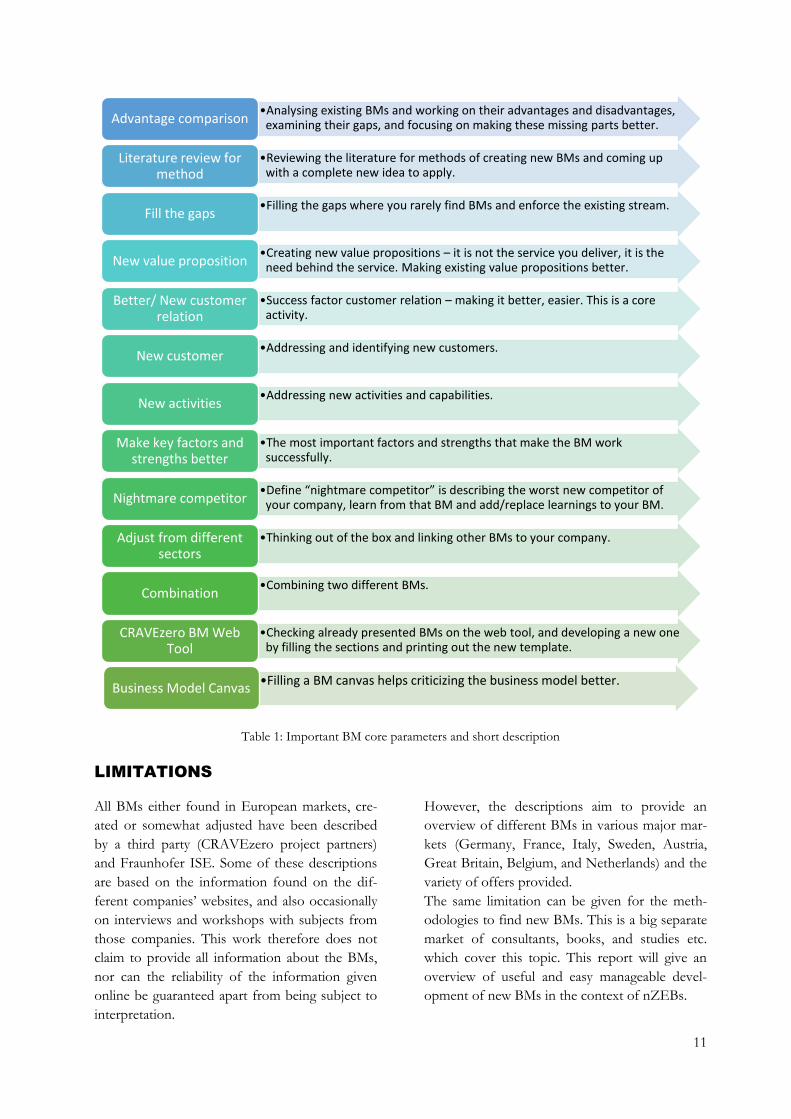
Table 1: Important BM core parameters and short description
LIMITATIONS
All BMs either found in European markets, cre-
ated or somewhat adjusted have been described
by a third party (CRAVEzero project partners)
and Fraunhofer ISE. Some of these descriptions
are based on the information found on the dif-
ferent companies’ websites, and also occasionally
on interviews and workshops with subjects from
those companies. This work therefore does not
claim to provide all information about the BMs,
nor can the reliability of the information given
online be guaranteed apart from being subject to
interpretation.
However, the descriptions aim to provide an
overview of different BMs in various major mar-
kets (Germany, France, Italy, Sweden, Austria,
Great Britain, Belgium, and Netherlands) and the
variety of offers provided.
The same limitation can be given for the meth-
odologies to find new BMs. This is a big separate
market of consultants, books, and studies etc.
which cover this topic. This report will give an
overview of useful and easy manageable devel-
opment of new BMs in the context of nZEBs.
•Analysing existing BMs and working on their advantages and disadvantages, examining their gaps, and focusing on making these missing parts better. Advantage comparison
•Reviewing the literature for methods of creating new BMs and coming up with a complete new idea to apply.
Literature review for method
•Filling the gaps where you rarely find BMs and enforce the existing stream. Fill the gaps
•Creating new value propositions – it is not the service you deliver, it is the need behind the service. Making existing value propositions better. New value proposition
•Success factor customer relation – making it better, easier. This is a core activity.
Better/ New customer relation
•Addressing and identifying new customers. New customer
•Addressing new activities and capabilities. New activities
•The most important factors and strengths that make the BM work successfully.
Make key factors and strengths better
•Define “nightmare competitor” is describing the worst new competitor of your company, learn from that BM and add/replace learnings to your BM. Nightmare competitor
•Thinking out of the box and linking other BMs to your company. Adjust from different sectors
•Combining two different BMs. Combination
•Checking already presented BMs on the web tool, and developing a new one by filling the sections and printing out the new template.
CRAVEzero BM Web Tool
•Filling a BM canvas helps criticizing the business model better. Business Model Canvas
12
5.BM REPOSITORY
In Deliverable 5.1 of CRAVEzero project, 17
BMs have been identified by the project partners.
In addition, for the Deliverable 5.2, the partners
searched for, collected and described more nZEB
BMs in the European markets focusing on their
home countries. More detailed information can
be found in the mentioned deliverables 5.1 and
5.2 on the CRAVEzero website, the websites of
the companies which described the BMs and in
the appendix of this report.The additional created
models are summarized in Table 2 and the de-
scriptive format of all the new business model
could be found in the Appendix.
The new found BMs show manifold ideas for
new BMs. All content of the BMs is structured
according to the Osterwalder BM canvas and the
descriptive approach is used from D5.2 for the
explanation of the new BMs.
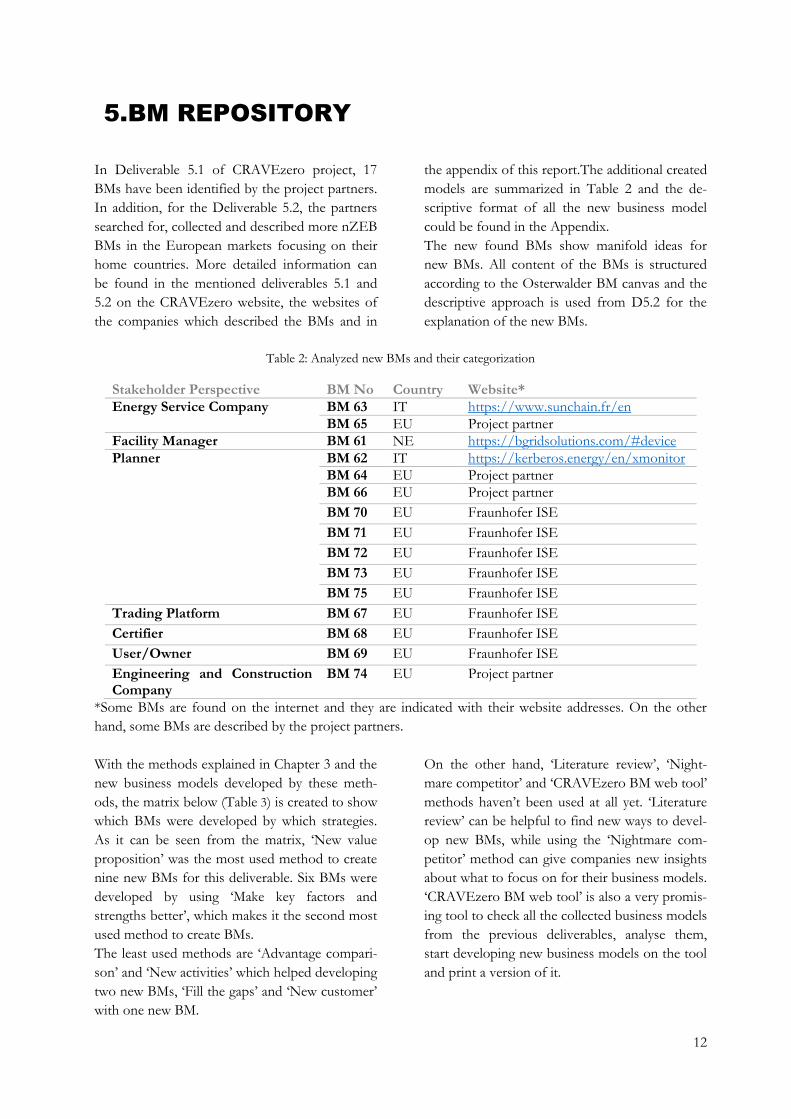
Table 2: Analyzed new BMs and their categorization
Stakeholder Perspective BM No Country Website*
Energy Service Company BM 63 IT https://www.sunchain.fr/en
BM 65 EU Project partner
Facility Manager BM 61 NE https://bgridsolutions.com/#device
Planner BM 62 IT https://kerberos.energy/en/xmonitor
BM 64 EU Project partner
BM 66 EU Project partner
BM 70 EU Fraunhofer ISE
BM 71 EU Fraunhofer ISE
BM 72 EU Fraunhofer ISE
BM 73 EU Fraunhofer ISE
BM 75 EU Fraunhofer ISE
Trading Platform BM 67 EU Fraunhofer ISE
Certifier BM 68 EU Fraunhofer ISE
User/Owner BM 69 EU Fraunhofer ISE
Engineering and Construction Company
BM 74 EU Project partner
*Some BMs are found on the internet and they are indicated with their website addresses. On the other
hand, some BMs are described by the project partners.
With the methods explained in Chapter 3 and the
new business models developed by these meth-
ods, the matrix below (Table 3) is created to show
which BMs were developed by which strategies.
As it can be seen from the matrix, ‘New value
proposition’ was the most used method to create
nine new BMs for this deliverable. Six BMs were
developed by using ‘Make key factors and
strengths better’, which makes it the second most
used method to create BMs.
The least used methods are ‘Advantage compari-
son’ and ‘New activities’ which helped developing
two new BMs, ‘Fill the gaps’ and ‘New customer’
with one new BM.
On the other hand, ‘Literature review’, ‘Night-
mare competitor’ and ‘CRAVEzero BM web tool’
methods haven’t been used at all yet. ‘Literature
review’ can be helpful to find new ways to devel-
op new BMs, while using the ‘Nightmare com-
petitor’ method can give companies new insights
about what to focus on for their business models.
‘CRAVEzero BM web tool’ is also a very promis-
ing tool to check all the collected business models
from the previous deliverables, analyse them,
start developing new business models on the tool
and print a version of it.

13
Table 3:The matrix of new BM development methods and the new BMs
61 62 63 64 65 66 67 68 69 70 71 72 73 74 75
Advantage comparison ✓ ✓
Literature review ✓ ✓ ✓ ✓ ✓
Fill the gaps ✓ ✓ ✓ ✓ ✓ ✓
New value proposition ✓ ✓ ✓ ✓ ✓ ✓ ✓ ✓ ✓
Better/New cust. rel. ✓
New customer ✓
New activities ✓ ✓ ✓ ✓ ✓ ✓ ✓
Key fact./Strengths better ✓ ✓ ✓
Nightmare competitor
Adjust from dif. Sectors ✓ ✓ ✓ ✓
Combination ✓ ✓
CRAVEzero BM web tool
BM Canvas ✓ ✓ ✓ ✓ ✓
14
6.HANDBOOK TO USE CRAVEZERO BM-
CREATOR
Within this chapter, the different possibilities to
use the BM creator to describe BMs and also for
the development of new models are described.
The BM creator can be found on the
CRAVEzero website
(http://www.cravezero.eu/development-of-new-
business-models/). With the following presenta-
tion of screenshots one can follow step by step
the creation of a BM and can understand the
functionalities of the tool. The appearance of the
web interface is based on the Osterwalder BM
canvas with some variations.
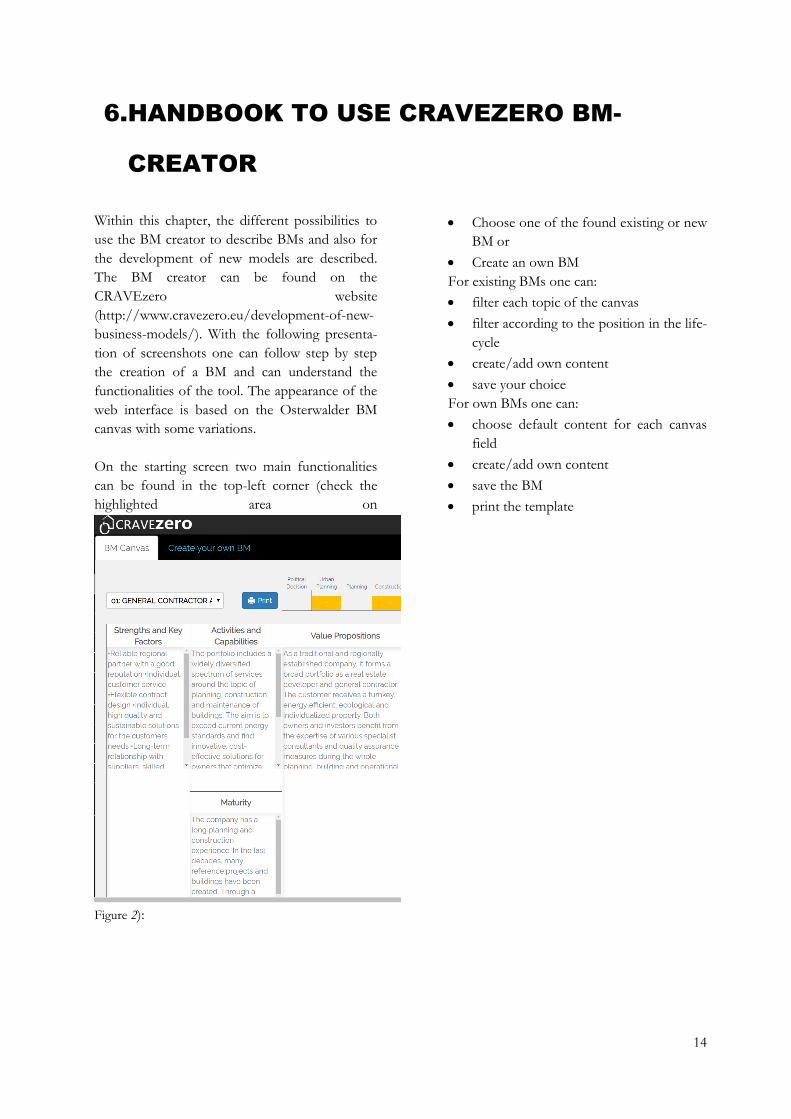
On the starting screen two main functionalities
can be found in the top-left corner (check the
highlighted area on
Figure 2):
Choose one of the found existing or new
BM or
Create an own BM
For existing BMs one can:
filter each topic of the canvas
filter according to the position in the life-
cycle
create/add own content
save your choice
For own BMs one can:
choose default content for each canvas
field
create/add own content
save the BM
print the template

15
Figure 2: Screenshot BM Canvas and prefilled canvas. Highlighted area shows the two main functionalities of ‘BM
Canvas’ and ‘Create your own BM’. (http://www.cravezero.eu/pinboard/Canvas/BM_Canvas.htm)
In the following the separate canvas fields are described with the related content.
6.1. STRENGTHS AND KEY FACTORS
‘Strengths and Key Factors’ (Figure 3) gives in-
formation about the stakeholders’ strengths, key
partners and suppliers, which key resources are
needed, what kinds of activities are carried out
and what the key factors are of a mentioned
company.
Nowadays, one of the key factors that companies
need is partnerships for many reasons. Hence,
partnerships are becoming an essential part of
many BMs. Companies establish alliances to op-
timize the BMs, reduce risk and get resources.
There are four main types of partnerships which
are:
Strategic alliances between non-
competitor partners, cooperation
Strategic alliances between competitors
Joint initiatives to develop new business-
es
Buyer-supplier partnership to guarantee
reliable supplies.
There are three main motivations to create alli-
ances:
Optimization and economy of scale: The
simplest form of partnership (buyer-
supplier relationship) is for optimization
of the allocation of resources and activi-
ties. It is not logical for a business to
have all resources and carry out every ac-
tion by itself. Optimization and economy
of scale partnerships are usually created
to decrease costs, and often involve out-
sourcing or sharing infrastructure.
Reduction of risk and uncertainty: Alli-
ances can help reduce risk in a competi-
tive environment. It is also normal for
partners to form a strategic alliance in
one area while competing in another.

16
Acquisition of particular resources and
activities: Only a few companies have all
the resources or carry out all the activi-
ties described by their BMs. Instead, they
rely on other firms to bring particular re-
sources of perform certain activities.
Such alliances can be motivated by needs
to acquire knowledge, licenses, or reach
to customers.
The questions, which need to be answered, and
the motivations for partnerships for strengths
and key factors of the BM canvas follow as:
Who are our key partners?
Who are our key suppliers?
Which key resources are we acquiring
from partners?
Which key activities do partners per-
form?
What do we do well?
What qualities or aspects persuaded our
customers to choose our product or ser-
vice?
What resources do we have at our dis-
posal?
What do others see as our strengths?
What areas are we seen as being expert
in?
What advantages do we have over our
competition?
Motivations for Partnerships:
Optimization and economy
Reduction of risk and uncertainty
Acquisition of particular resources and
activities
Figure 3: Strengths and Key Factors (http://www.cravezero.eu/pinboard/Canvas/BM_Canvas.htm)
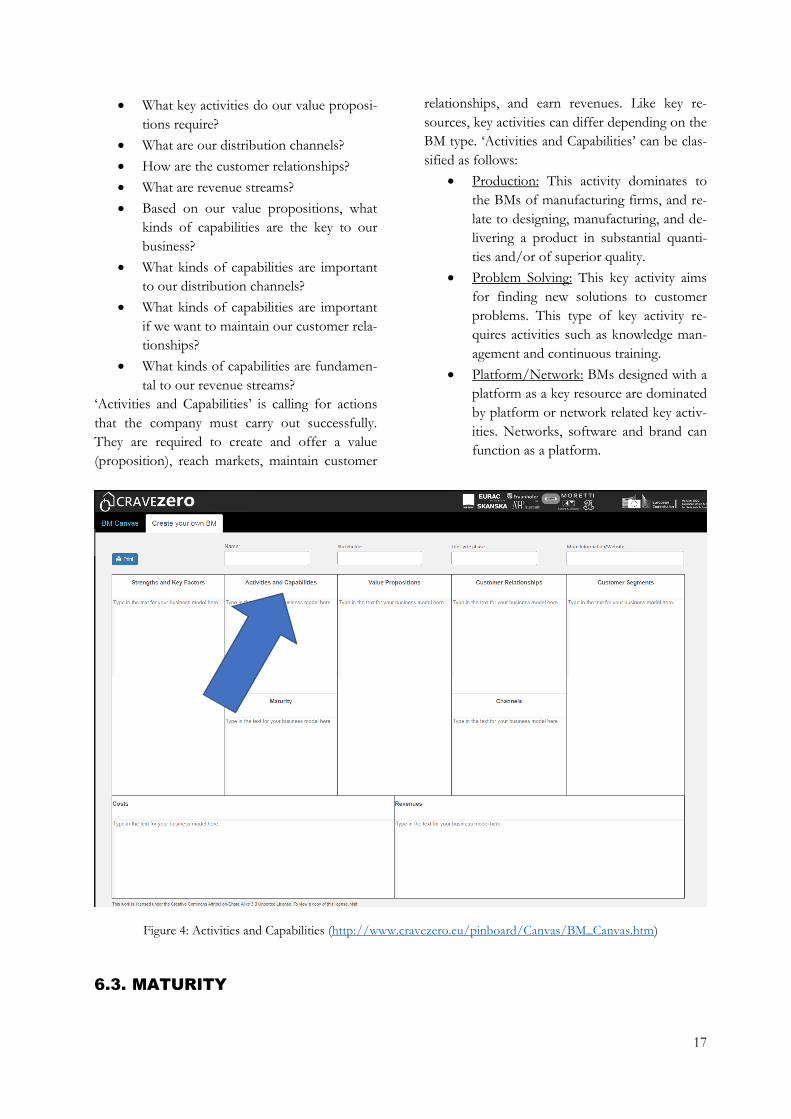
6.2. ACTIVITIES AND CAPABILITIES
‘Activities and Capabilities’ (Figure 4) is the next
module of the BM canvas. This component pro-
vides an overview of the activities and the capa-
bilities that are necessary to ensure that the BM
becomes viable. The user should ask the follow-
ing questions to himselve to fill this section:
17
What key activities do our value proposi-
tions require?
What are our distribution channels?
How are the customer relationships?
What are revenue streams?
Based on our value propositions, what
kinds of capabilities are the key to our
business?
What kinds of capabilities are important
to our distribution channels?
What kinds of capabilities are important
if we want to maintain our customer rela-
tionships?
What kinds of capabilities are fundamen-
tal to our revenue streams?
‘Activities and Capabilities’ is calling for actions
that the company must carry out successfully.
They are required to create and offer a value
(proposition), reach markets, maintain customer
relationships, and earn revenues. Like key re-
sources, key activities can differ depending on the
BM type. ‘Activities and Capabilities’ can be clas-
sified as follows:
Production: This activity dominates to
the BMs of manufacturing firms, and re-
late to designing, manufacturing, and de-
livering a product in substantial quanti-
ties and/or of superior quality.
Problem Solving: This key activity aims
for finding new solutions to customer
problems. This type of key activity re-
quires activities such as knowledge man-
agement and continuous training.
Platform/Network: BMs designed with a
platform as a key resource are dominated
by platform or network related key activ-
ities. Networks, software and brand can
function as a platform.
Figure 4: Activities and Capabilities (http://www.cravezero.eu/pinboard/Canvas/BM_Canvas.htm)
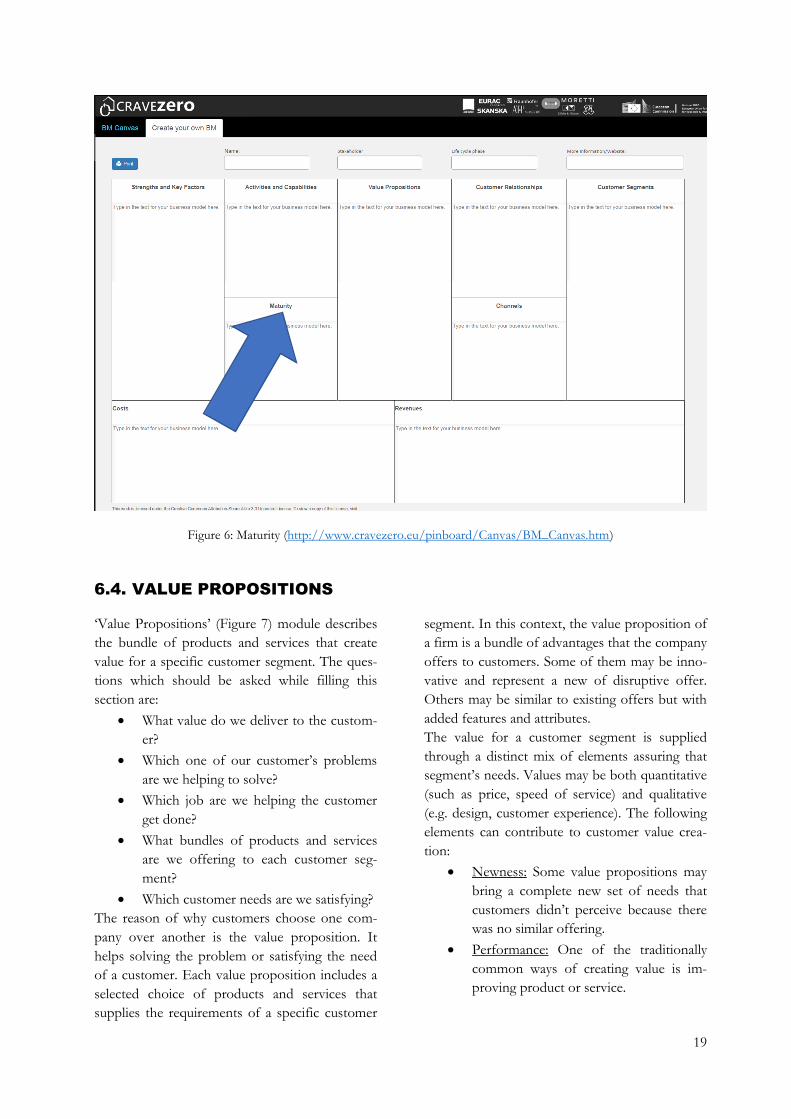
6.3. MATURITY

18
‘Maturity’ is a stage in which a company is situat-
ed with regards to how elaborated and integrated
a business model is. Figure 5 shows the different
maturity stages of business model innovation.
Figure 5: Maturity stages of the implementation of business model concept in companies (following (PROTEMA
Unternehmensberatung GmbH))
The maturity of BM implementation in a compa-
ny can vary from ‘Unknown’ to ‘Established’.
The ‘Unknown’ stage indicates a firm which
doesn’t have a BM for their daily business. In the
‘Aware’ stage a company is aware of the BM con-
cept and prepared and documented its own BM.
The ‘Defined’ stage means that a company incor-
porate Business Model Innovation (BMI) into its
strategic planning process. All the relevant re-
sponsibilities in that regard are fixed and com-
municated internally. Already standardized BMI
processes and specific projects to constantly en-
hance its business models characterize the
‘Proved’ stage. The ‘Established’ stage has BMI
as a central topic within the general innovation
management of the company.
19
Figure 6: Maturity (http://www.cravezero.eu/pinboard/Canvas/BM_Canvas.htm)
6.4. VALUE PROPOSITIONS
‘Value Propositions’ (Figure 7) module describes
the bundle of products and services that create
value for a specific customer segment. The ques-
tions which should be asked while filling this
section are:
What value do we deliver to the custom-
er?
Which one of our customer’s problems
are we helping to solve?
Which job are we helping the customer
get done?
What bundles of products and services
are we offering to each customer seg-
ment?
Which customer needs are we satisfying?
The reason of why customers choose one com-
pany over another is the value proposition. It
helps solving the problem or satisfying the need
of a customer. Each value proposition includes a
selected choice of products and services that
supplies the requirements of a specific customer
segment. In this context, the value proposition of
a firm is a bundle of advantages that the company
offers to customers. Some of them may be inno-
vative and represent a new of disruptive offer.
Others may be similar to existing offers but with
added features and attributes.
The value for a customer segment is supplied
through a distinct mix of elements assuring that
segment’s needs. Values may be both quantitative
(such as price, speed of service) and qualitative
(e.g. design, customer experience). The following
elements can contribute to customer value crea-
tion:
Newness: Some value propositions may
bring a complete new set of needs that
customers didn’t perceive because there
was no similar offering.
Performance: One of the traditionally
common ways of creating value is im-
proving product or service.

20
Customization: Supplying products and
services for the specific needs of individ-
ual customers or customers segments
help creating value. Recently, the concept
of mass customization and customer co-
creation have gained importance. This
approach allows for customers to get
customized products and services, while
the firm still taking advantage of econo-
mies of scale.
“Getting the Job Done”: Helping a cus-
tomer get a certain job done can create
value.
Design: Design can be a particularly im-
portant element for the value proposi-
tion. For example, a product may stand
out because of its superior design. How-
ever, it is significant but difficult to
measure.
Brand/Status: Customers may find value
in the simple act of using and displaying
a specific brand.
Price: Offering a lower price for a similar
value is one of the common ways to sat-
isfy the needs of price-sensitive customer
segments.
Cost Reduction: Another way of creating
value is helping customers reduce their
costs.
Risk Reduction: Customers care about
reducing the risks of the products or ser-
vices they incur when purchasing.
Accessibility: Another way of creating
value is making products and services
available to customers who previously
lacked access to them. BM innovation,
new technologies, or a combination of
both can help build accessibility.
Convenience/Usability: Making things
more convenient or easier to use can cre-
ate a significant value.
Figure 7: Value Propositions (http://www.cravezero.eu/pinboard/Canvas/BM_Canvas.htm)
21
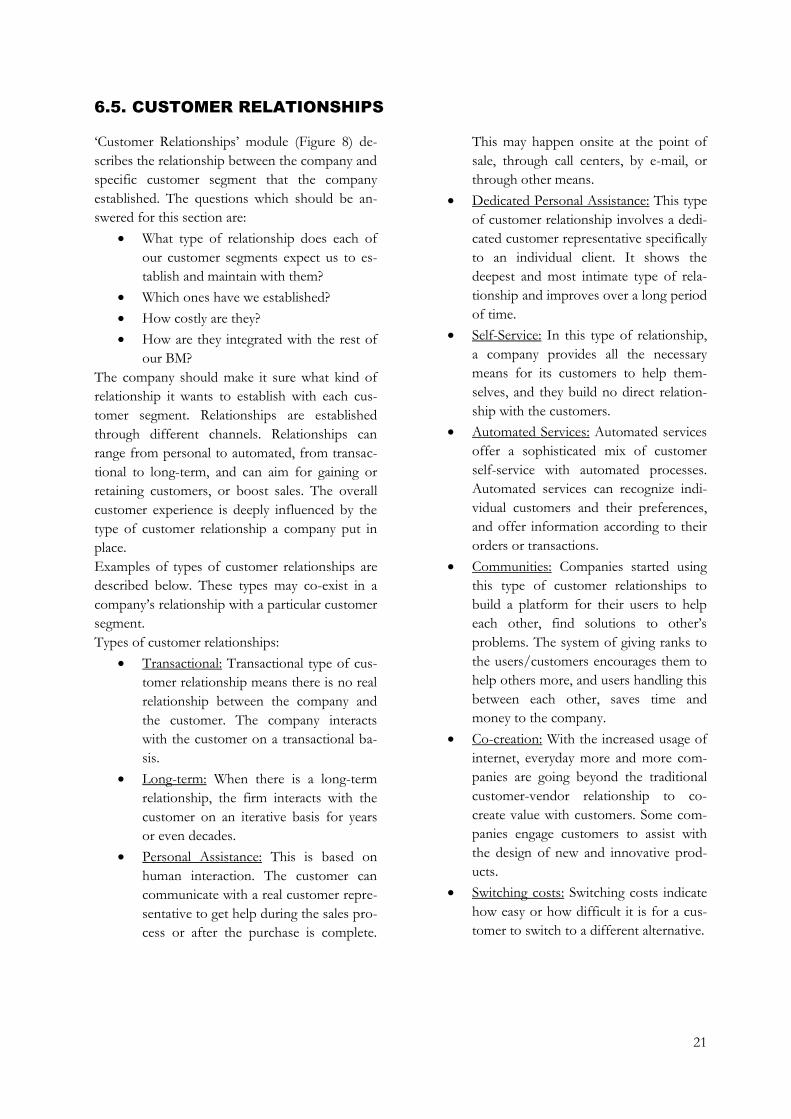
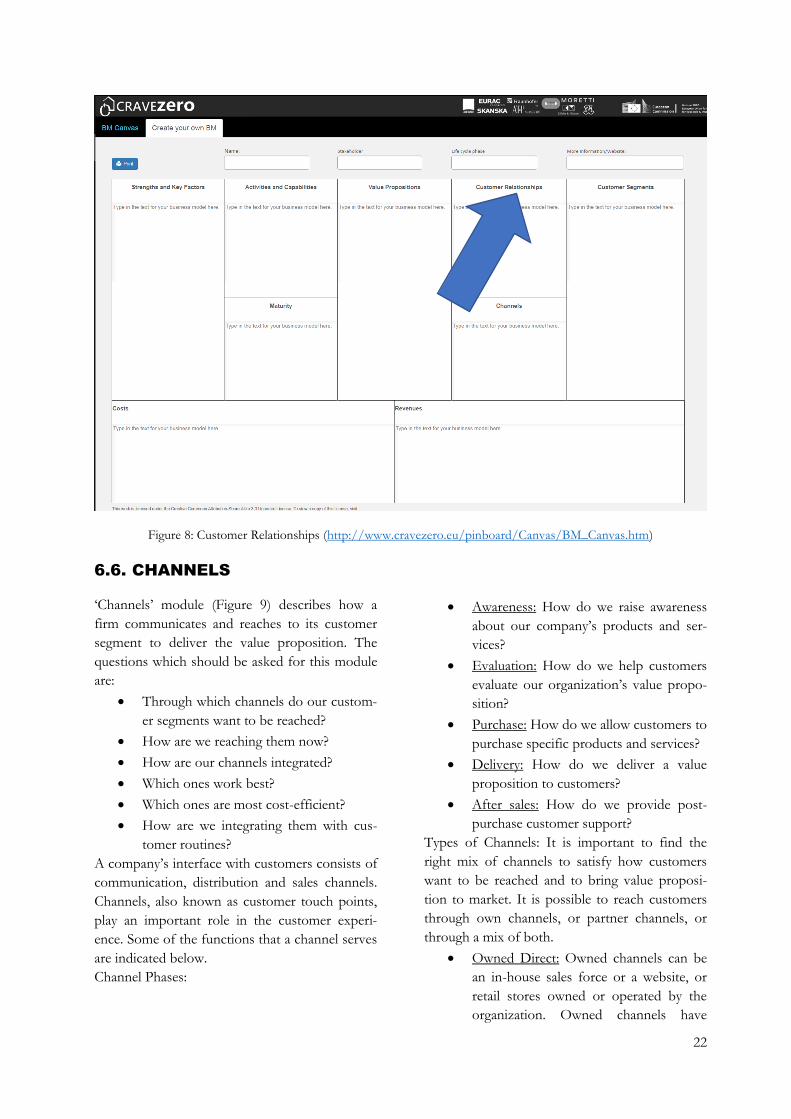
6.5. CUSTOMER RELATIONSHIPS
‘Customer Relationships’ module (Figure 8) de-
scribes the relationship between the company and
specific customer segment that the company
established. The questions which should be an-
swered for this section are:
What type of relationship does each of
our customer segments expect us to es-
tablish and maintain with them?
Which ones have we established?
How costly are they?
How are they integrated with the rest of
our BM?
The company should make it sure what kind of
relationship it wants to establish with each cus-
tomer segment. Relationships are established
through different channels. Relationships can
range from personal to automated, from transac-
tional to long-term, and can aim for gaining or
retaining customers, or boost sales. The overall
customer experience is deeply influenced by the
type of customer relationship a company put in
place.
Examples of types of customer relationships are
described below. These types may co-exist in a
company’s relationship with a particular customer
segment.
Types of customer relationships:
Transactional: Transactional type of cus-
tomer relationship means there is no real
relationship between the company and
the customer. The company interacts
with the customer on a transactional ba-
sis.
Long-term: When there is a long-term
relationship, the firm interacts with the
customer on an iterative basis for years
or even decades.
Personal Assistance: This is based on
human interaction. The customer can
communicate with a real customer repre-
sentative to get help during the sales pro-
cess or after the purchase is complete.
This may happen onsite at the point of
sale, through call centers, by e-mail, or
through other means.
Dedicated Personal Assistance: This type
of customer relationship involves a dedi-
cated customer representative specifically
to an individual client. It shows the
deepest and most intimate type of rela-
tionship and improves over a long period
of time.
Self-Service: In this type of relationship,
a company provides all the necessary
means for its customers to help them-
selves, and they build no direct relation-
ship with the customers.
Automated Services: Automated services
offer a sophisticated mix of customer
self-service with automated processes.
Automated services can recognize indi-
vidual customers and their preferences,
and offer information according to their
orders or transactions.
Communities: Companies started using
this type of customer relationships to
build a platform for their users to help
each other, find solutions to other’s
problems. The system of giving ranks to
the users/customers encourages them to
help others more, and users handling this
between each other, saves time and
money to the company.
Co-creation: With the increased usage of
internet, everyday more and more com-
panies are going beyond the traditional
customer-vendor relationship to co-
create value with customers. Some com-
panies engage customers to assist with
the design of new and innovative prod-
ucts.
Switching costs: Switching costs indicate
how easy or how difficult it is for a cus-
tomer to switch to a different alternative.
22
Figure 8: Customer Relationships (http://www.cravezero.eu/pinboard/Canvas/BM_Canvas.htm)
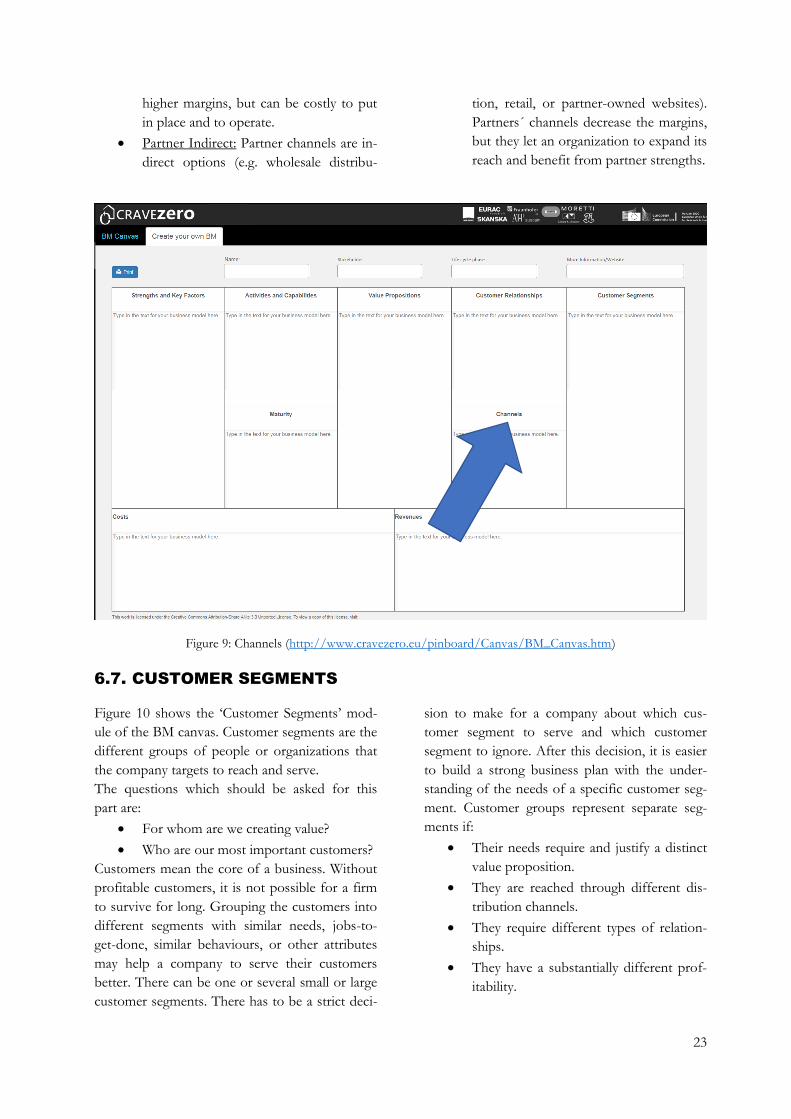
6.6. CHANNELS
‘Channels’ module (Figure 9) describes how a
firm communicates and reaches to its customer
segment to deliver the value proposition. The
questions which should be asked for this module
are:
Through which channels do our custom-
er segments want to be reached?
How are we reaching them now?
How are our channels integrated?
Which ones work best?
Which ones are most cost-efficient?
How are we integrating them with cus-
tomer routines?
A company’s interface with customers consists of
communication, distribution and sales channels.
Channels, also known as customer touch points,
play an important role in the customer experi-
ence. Some of the functions that a channel serves
are indicated below.
Channel Phases:
Awareness: How do we raise awareness
about our company’s products and ser-
vices?
Evaluation: How do we help customers
evaluate our organization’s value propo-
sition?
Purchase: How do we allow customers to
purchase specific products and services?
Delivery: How do we deliver a value
proposition to customers?
After sales: How do we provide post-
purchase customer support?
Types of Channels: It is important to find the
right mix of channels to satisfy how customers
want to be reached and to bring value proposi-
tion to market. It is possible to reach customers
through own channels, or partner channels, or
through a mix of both.
Owned Direct: Owned channels can be
an in-house sales force or a website, or
retail stores owned or operated by the
organization. Owned channels have
23
higher margins, but can be costly to put
in place and to operate.
Partner Indirect: Partner channels are in-
direct options (e.g. wholesale distribu-
tion, retail, or partner-owned websites).
Partners´ channels decrease the margins,
but they let an organization to expand its
reach and benefit from partner strengths.
Figure 9: Channels (http://www.cravezero.eu/pinboard/Canvas/BM_Canvas.htm)
6.7. CUSTOMER SEGMENTS
Figure 10 shows the ‘Customer Segments’ mod-
ule of the BM canvas. Customer segments are the
different groups of people or organizations that
the company targets to reach and serve.
The questions which should be asked for this
part are:
For whom are we creating value?
Who are our most important customers?
Customers mean the core of a business. Without
profitable customers, it is not possible for a firm
to survive for long. Grouping the customers into
different segments with similar needs, jobs-to-
get-done, similar behaviours, or other attributes
may help a company to serve their customers
better. There can be one or several small or large
customer segments. There has to be a strict deci-
sion to make for a company about which cus-
tomer segment to serve and which customer
segment to ignore. After this decision, it is easier
to build a strong business plan with the under-
standing of the needs of a specific customer seg-
ment. Customer groups represent separate seg-
ments if:
Their needs require and justify a distinct
value proposition.
They are reached through different dis-
tribution channels.
They require different types of relation-
ships.
They have a substantially different prof-
itability.

24
They are willing to pay for different as-
pects of the value proposition.
Here are a few examples of different types of
customer segments:
Mass Market: There is no distinction be-
tween different customer segments for
BMs which focus on mass markets. The
value propositions, distribution channels,
and customer relationships all focus on
one large group of customers with simi-
lar needs and problems.
Niche Market: With this market; specific,
specialized customer segments are tar-
geted. The value propositions, distribu-
tion channels, and customer relationships
are all fixed to the specific requirements
of a niche market.
Segmented: Some BMs distinguish be-
tween market segments with slightly dif-
ferent needs and problems. The indicat-
ed customer segments have similar but
varying needs and problems. This may
lead to some implications for the other
modules of the BM, such as the value
proposition, distribution channels, cus-
tomer relationships, and revenue
streams.
Diversified: A company with a diversi-
fied BM has two unrelated customer
segments with different needs and prob-
lems.
Multi-sided Platform: Some companies
serve two or more interdependent cus-
tomer segments. Both segments are nec-
essary to make the BM work.
Figure 10: Customer Segments (http://www.cravezero.eu/pinboard/Canvas/BM_Canvas.htm)

25
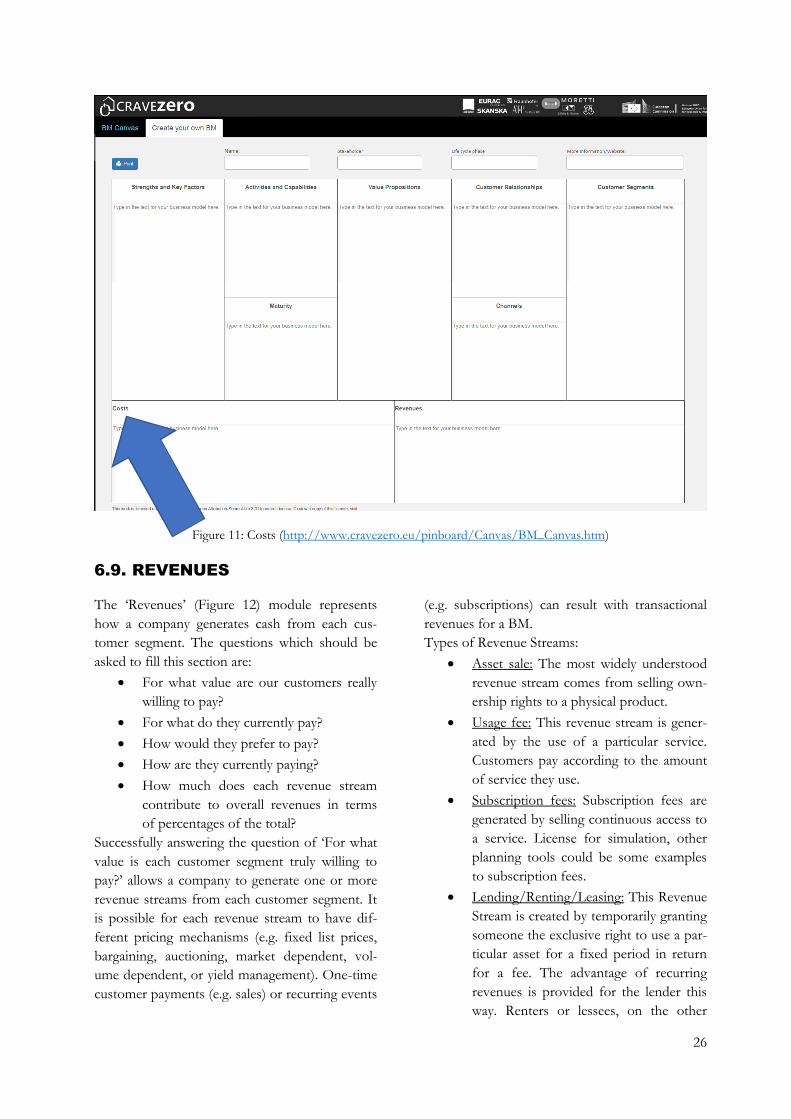
6.8. COSTS
‘Costs’ (Figure 11) module gives information
about all costs incurred to operate the BM of a
firm. The questions which should be asked to fill
this section are:
What are the most important costs in-
herent in our BM?
Which key resources are most expensive?
Which key activities are most expensive?
‘Costs’ describes the most important costs hap-
pening while taking care of a company under a
particular BM. Creating and delivering value,
maintaining customer relationships, and generat-
ing revenue, all cause costs. After defining key
resources, key activities, and key partnerships, it is
relatively easier to calculate these costs. Some
BMs, though, are more cost-driven than others.
Types of Cost Structure:
Costs naturally should be minimized in every BM.
However, some BMs place more emphasis on
cost structures than other BMs. That is why it can
be useful to give more details about two broad
classes of BM cost structures:
Cost-driven: Cost-driven BMs focus on
minimizing costs at every possibility.
This approach targets for leanest cost
structure, low price value proposition,
maximum automation, and extensive
outsourcing.
Value-driven: Some companies focus on
value creation instead of the costs. Pre-
mium value proposition and a high de-
gree of personalized service usually char-
acterize value-driven BMs.
A ‘Cost Structures’ can have the following char-
acteristics:
Economies of scale: Cost advantages that
a business enjoys as its output expands.
For example, bigger companies benefit
from lower bulk purchase rates. This and
other factors cause average cost per unit
to fall as output rises.
Economies of scope: Cost advantages
that a business enjoys due to a larger
scope of operations. For instance, in a
large company, the same marketing activ-
ities or distribution channels may sup-
port multiple products.
Fixed costs: Despite the volume of
goods or services produced, fixed costs
stay the same. Salaries, rents, and physi-
cal manufacturing facilities are some ex-
amples of fixed costs. Some businesses,
such as manufacturing companies, are
characterized by a high proportion of
fixed costs.
Variable costs: Variable costs are the
costs that vary proportionally with the
volume of goods or services produced.
Some businesses are characterized by a
high proportion of variable costs.
26
Figure 11: Costs (http://www.cravezero.eu/pinboard/Canvas/BM_Canvas.htm)
6.9. REVENUES
The ‘Revenues’ (Figure 12) module represents
how a company generates cash from each cus-
tomer segment. The questions which should be
asked to fill this section are:
For what value are our customers really
willing to pay?
For what do they currently pay?
How would they prefer to pay?
How are they currently paying?
How much does each revenue stream
contribute to overall revenues in terms
of percentages of the total?
Successfully answering the question of ‘For what
value is each customer segment truly willing to
pay?’ allows a company to generate one or more
revenue streams from each customer segment. It
is possible for each revenue stream to have dif-
ferent pricing mechanisms (e.g. fixed list prices,
bargaining, auctioning, market dependent, vol-
ume dependent, or yield management). One-time
customer payments (e.g. sales) or recurring events
(e.g. subscriptions) can result with transactional
revenues for a BM.
Types of Revenue Streams:
Asset sale: The most widely understood
revenue stream comes from selling own-
ership rights to a physical product.
Usage fee: This revenue stream is gener-
ated by the use of a particular service.
Customers pay according to the amount
of service they use.
Subscription fees: Subscription fees are
generated by selling continuous access to
a service. License for simulation, other
planning tools could be some examples
to subscription fees.
Lending/Renting/Leasing: This Revenue
Stream is created by temporarily granting
someone the exclusive right to use a par-
ticular asset for a fixed period in return
for a fee. The advantage of recurring
revenues is provided for the lender this
way. Renters or lessees, on the other

27
hand, enjoy the benefits of incurring ex-
penses for only a limited time rather than
bearing the full costs of ownership.
Licensing: This revenue stream is gener-
ated by giving customers permission to
use protected intellectual property in ex-
change for licensing fees. Licensing al-
lows rights holders to generate revenues
from their property without having to
manufacture a product or commercialize
a service. Licensing is common in tech-
nology sectors, such as patent holders
grant other companies the right to use a
patented technology in return for a li-
cense fee.
Brokerage fees: Brokerage fees derive
from intermediation services performed
on behalf of two or more parties. For ex-
ample, brokers and real estate agents
earn a commission each time they suc-
cessfully match a buyer and seller.
Advertising: This Revenue Stream results
from fees for advertising a particular
product, service, or brand.
Fixed Pricing:
List Price
Product feature dependent
Customer segment dependent
Volume dependent
Dynamic Pricing:
Negotiation (bargaining)
Yield Management
Real-time-Market
Figure 12: Revenues (http://www.cravezero.eu/pinboard/Canvas/BM_Canvas.htm)
In addition to the descriptions above, there is a webinar showing the functionalities here:
https://www.youtube.com/watch?v=WEYiwYjN-2I

28
7.RESULTS
The result of the new found business models
show different methods about how to develop
new BMs. All these different methods or combi-
nation of them can be used to create new busi-
ness models. In this deliverable 5.3 the new
found 17 BMs are presented in the Appendix
section.
All content of the BMs is structured according to
the Osterwalder BM canvas and the descriptive
approach is used from the D5.2 for the explana-
tion of the new BMs. In addition this content can
be presented and structured via the developed
BM web tool, which can be found on the
CRAVEzero Pinboard. Finally the tool can help
to analyse and create new BMs.
8.LINK TO OTHER WPS
This WP 5.3 has relations to WP 3 “Cost reduc-
tion potentials in processes”. There, one can
identify new ideas to create better and cost effec-
tive processes in order to implement this new
knowledge into a business model. There is also a
link to cost and actions to make processes less
costly.
The relation to WP4 “Cost reduction potentials
for nZEB technologies” is also relevant to BMs
who base on technologies provided to the cus-
tomers. There future relevant technologies are
identified.
In WP6 “Life-cycle cost reduction of new
nZEBs” the BM is related to the whole life-cycle
and it can be checked whether the new BM has
influence on the overall cost structure.
In WP7 “Prototypical implementation and
CRAVEzero pinboard” there will be a possibility
of performing a validation of one of the new
BMs.
9.DISCUSSION
This report presents an overview of found new
BMs and methods to identify them. However, it
will be discussed during next stakeholder meet-
ings and workshops in which way a validation of
these new BM ideas can be performed. One op-
tion is the prototypical implementation in WP7
”Prototypical implementation and CRAVEzero
pinboard” where the idea can be checked.
Another option is the stakeholders´ opinion and
checks for feasibility and viability.
Third option can be to have company internal
discussion and check for implementation of one
new promising BM and a structured response to
the CRAVEzero partners.
The new BMs described in this report were:
Either found out in the internet,
Described by project partners according
to their needs or gaps in the businesses
or
Implemented to building sector from
other industries.
All these methods at the end agree on that the
customer segment should be taken into account
to bring a solution to their problems and excite
the market with a new business. To monitor the
stakeholders and their needs in the building sec-
tor, the following reports have been inspected.
The DENA building report 2016 Statistics and
analyzes of energy efficiency in the building stock
(Figure 13) shows the distribution of households
in Germany. According to this report, 58.5 % of
40 million housing units are owned by private
individuals. 57.1 % of them are occupied by the
house owners themselves and 38.7 % are rented

29
to tenants while 4.2 % of the units stay unoccu-
pied.
22.1 % of 40 million housing units in Germany
are owned by homeowner association. 41.8 % of
them are occupied by the owners while 55 % are
rented and 3.2 % stay empty.
Private corporations own 7.8 % of the dwellings
in Germany and rent close to 100 % of it to ten-
ants.
Residential building cooperatives hold 5.1 % of
the dwellings in Germany and also rent close to
100 % of it while only 5 % stay unoccupied.
6.4 % of the dwellings are owned by public au-
thorities and almost all the units are occupied by
tenants.
Figure 13: The DENA building report 2016. Statistics and analyzes of energy efficiency in the building stock.
Another idea could be to examine carbon emis-
sions of building types and their users to see who
causes how much emission in which kind of
building type and describe a business model for
this specific type of problem. Figure 14 shows the
segmentation of the commercial real estate mar-
ket from a climate protection perspective. Ac-
cording to the report of ’Finanzforum Energieef-
fizienz (Energy Efficiency Finance Forum)’, own
users are responsible for a total of 72 % of emis-
sions in commercial real estate (owner-occupier
with professional facility management 35 %,
owner-occupier without professional facility
management 37 %). Self-users predominantly
hold real estate in the areas of industry and com-
merce. For investors, yield-oriented investors
account for 13 % of all emissions on behalf of
third parties. The other investor groups hold
between 3 % and 6 % of the emissions. Investors
hold buildings in the areas of office, commerce,
hotel and logistics. About 2 % of the real estate is
held by owners who cannot be assigned to any of
the groups mentioned, eg. small rental.
This study could be helpful to decide whom to
address for a new BM. According to this figure,
the vast majority of emissions are caused by
buildings owned by self-users. At first, a BM
addressing the owners could be useful to decrease
carbon emission.
58,5 % Private Individuals
57,1 % occupied by the owner
38,7 % rented
4,2 % unoccupied
22,1 % Homeowner Association
41,8 % occupied by the owner
55 % rented
3,2 % unoccupied
7,8 % Private Cooperations
0 % occupied by the owner
93,3 % rented
6,7 % unoccupied
5,1 % Residential Building
Cooperatives
0 % occupied by the owner
94,7 % rented
5,3 % unoccupied
6,4 % Public Authorities
0 % occupied by the owner
91,7 % rented
8,3 % unoccupied

30
Figure 14: Segmentation of the commercial real estate market from a climate protection perspective
*The emissions were calculated from the bottom-up and corrected according to the assumptions of the Building Efficiency Strategy (assumption
base year 2008).
**The following breakdown was made for the division of general industrial and commercial buildings: industry: 46%, commerce: 54%; Considera-
tion of emissions directly or indirectly caused during the use phase by consumers and sources inherent in buildings.
Source: BulwienGesa (2010; 2015); dena (2015); bsi (2015); http://www.gdv.de/; statista.de; BaFin (2015); bvi (2015); Roland Berger (2015); ZIA
(2013); www.cash-online.de; manager-magazin.de; BMWi (2015) The CO Firm
However, this deliverable does not discuss about
how to implement a business model to an already
existing environment, working/daily business.
This needs further consideration to achieve a
successful practice. This will be done later in
WP7 “Prototypical implementation and
CRAVEzero pinboard” where the idea can be
checked.
Another discussion topic is that it seems almost
not possible to describe/estimate revenues in a
companyeither with existing BMs or with new
ones. It was observed that with the existing BMs,
revenues are rather difficult to estimate due to the
fact that they are implemented in the overall
business of a company. The same problem con-
tinues with the new BMs and this problem is
almost impossible to solve with the current tech-
niques at the moment. On the other hand, the
costs are easier to describe both for the existing
and the new BMs since the inputs, contracts and
so on can be easily seen from a company’s ex-
penses.
10. CONCLUSION
One of the conclusions of this report is that there
is more than one method to find new BMs. As
needs mostly cause developments, existing gaps
in a business could also cause the need of search-
ing for a new BM to fix failures. The other meth-
ods are advantage comparison, literature review,
new value proposition, better/ new customer
relation, new customer, new activities, making
key factors and strengths better, nightmare com-
petitor, adjusting from different sectors, combi-

31
nation of different business models, using
CRAVEzero BM web tool or any other choice of
business model canvas. Between all these meth-
ods mentioned here, ‘New value proposition’ was
the one which was used the most to develop a
new business model by the project partners with
‘Literature review’, ‘Nightmare competitor’ and
‘CRAVEzero BM web tool’ haven’t been used at
all so far.
Another conclusion is the client should be always
taken into account. It is quite important to know
which customer segment to address during the
preparation of a new BM to bring a solution to
their problems and excite the market with a new
business.
As well as with the existing BMs, estimating rev-
enue still stays as a problem with the new BMs
since revenue is implemented in the overall busi-
ness of a company. On the other hand, estimat-
ing the costs is rather easy comparing to the rev-
enues both for the existing and the new BMs
since expenses, inputs, and contracts etc. can be
seen from a firm’s budget.
Last but not least, the CRAVEzero BM web tool
should be taken into consideration more. The
tool can be very beneficial for the users who
would like to check the business models which
have been collected earlier during the previous
deliverables. Besides this, ‘Create your own BM’
function gives the user the ability to develop new
business models on the website, download and
print them.

32
11. APPENDIX
BM 61: DEEMS bGrid
VALUE PROPOSITION:
-The bGrid® Smart Building Solution is the final smart
building solution you will ever need for your smart
building. A network of bGrid® Nodes senses every-
thing that happens in the building and enables fast
accurate positioning of people and assets. The bGrid®
Smart Building Solution is open enough to connect and
communicate with everything in your building from the
lighting and climate system to the coffee machines and
even people through their smart devices. But bGrid®
does not stop there. It also enables controlling light,
climate, blinds etc. based on the collected and analyzed
data.
-bGrid for Employee (room booking, indoor position-
ing, workplace finder, colleague finder, personal com-
fort that "follows" you, smart parking)
-bGrid for Facility Manager (smart cleaning, predictive
maintenance, smart security, asset tracking)
-bGrid for Real Estate Manager (building analytics,
employee satisfaction, property value, energy efficiency)
CUSTOMER RELATIONSHIP:
Contract with client
CUSTOMER SEGMENT:
Owner-operated office building
ACTIVITIES AND CAPABILITIES:
-TGA Planning
-Ensuring data security
-Workplace concepts
-Interfaces for system control
-Know-how as planner for technical building equipment
-Sensors built into lamps
Key partners are:
-Lighting designers
-Electrical planners
-Planner for technical building services systems
Figure 15: BM 61 - Screenshot: https://bgridsolutions.com/#device
REVENUES:
-Savings building for building installations approximate-
ly 10-20€/m²
-Savings for facility management (10% lower energy
costs, 10% lower maintenance costs, 20% lower clean-
ing costs, 10% more effective use of conference rooms
-Soft revenue streams (>5% more productive work
force, 20% happier work force, 15% less absenteeism,
10% more effectivity of floor space usage)
COSTS:
-to be defined-
STRENGTH AND KEY FACTORS:
Powered by big company
Big data background
Guaranteed savings
MATURITY:
-to be defined-
PLACEMENT ALONG VALUE CHAIN OF nZEBs
Figure 16: BM 61 - Placement of the BM along the lifecycle processes

33
BM 62: MONITORING COMPANY: MONITORING SYSTEM VALUE PROPOSITION:
The company has been designing and manufacturing
integrated wireless solutions for energy efficiency since
2004. It designs, plans, installs and manages the moni-
toring system of the customer. All products are de-
signed by its Research and Development department,
which guarantees high quality and the best control over
the reliability of the product catalogue. The company
has equipped itself with a Quality Management System
according to the UNI EN ISO 9001:2015.
CUSTOMER RELATIONSHIP:
In order to get in touch with customers the company
provides a website, where are shown some customer
success stories and the online catalogue of products.
The client can directly check previous projects and find
one similar case to his need. Personal assistance and a
customer service reachable via telephone hotline as well
as internet help the customer with all problems. The
company organizes some specific events about its prod-
ucts and monitoring issue.
CUSTOMER SEGMENT:
The BM is mainly focused on giving solutions for in-
dustrial and commercial companies. There are also
solutions tailor made for private houses wishing to
control and reduce their energy consumption and build
a smart energy system.
ACTIVITIES AND CAPABILITIES:
The service portfolio includes the inspection and plan-
ning in order to choose the right product and fulfil
possible regulatory requirements. The company offers
installation and testing service, however, thanks to
“Plug & Play” electrical panels, pre-wired and pre-
configured, the customer can choose to follow itself the
installation phase. Finally, an easy online platform per-
mits the acquisition and display of measured data.
Figure 17: BM 62 - Screenshot: https://kerberos.energy/en/xmonitor
REVENUES:
Revenues are made depending on the relevant contract.
The main source of revenue is represented by the sale
of meters, sensors, data centers and actuators. Then
there is an annual fee for the data storage and manage-
ment of the platform.
COSTS:
The most expensive expenditure of the company is the
designing and production of its products, followed by
personnel expenditures for the planning, installation,
consultancy and customer support.
STRENGTHS AND KEY FACTORS:
“Plug & Play” electrical panels, ready to be just
installed
Easy coordination (designers and installers inhouse)
Reduced energy consumption and optimized system
management
Certified data security
MATURITY:
The company, born in 2004, improves continuously its
services and products thanks to the Research and De-
velopment department
Placement along value chain of nZEBs
In the following figure, add arrows to indicate main
(blue) and additional (red) fields of operation.
PLACEMENT ALONG VALUE CHAIN OF nZEBs
Figure 18: BM 62 - Placement of the BM along the life-cycle processes

34
BM 63: COLLECTIVE SELF CONSUMPTION: SUNCHAIN
VALUE PROPOSITION:
Based on blockchain & IoT technologies, Sunchain’s
solution manages the energy exchanges within local
energy communities, gathering producers, consumers
and prosumers.
This solution promotes local green energy cooperative
projects by providing a solution that optimizes self-
consumption rates and lowers electricity bills.
Power production and consumption data are encrypted,
signed and recorded in the blockchain directly from the
smart meters. The energy allocation between all in-
volved participants is securely processed and certified.
CUSTOMER RELATIONSHIP:
The company developed a business to business strategy,
where they contract with firms, local authorities and
communities for the implementation of their innovative
products and solutions.
CUSTOMER SEGMENT:
The offer is dedicated for various type of customers:
social and private landlords and communities, as well as
local authorities and can be implemented for a single
building or for a whole district.
ACTIVITIES AND CAPABILITIES:
Regarding blockchain applications to the energy sector,
Sunchain has been a leader. The company developed its
own blockchain specifically designed for small energy
exchanges.
It’s a consortium blockchain, using no mining process
that benefits from very low electricity consumption.
This 'tokenless' blockchain, not linked to cryptocurren-
cy, meets trust and scalability requirements.
Sunchain also develops its own IoT modules that are
plugged on smart meters and collect electrical data. A
web app enables users to follow their energy consump-
tion, from the traditional retailer and from the local
solar plants.
Figure 19: BM 63 - Screenshot: https://www.sunchain.fr/en
REVENUES:
Revenues of the company are made firstly by selling the
IoT module and by implementing the solution as a
CAPEX investment. Secondly, service operation and
maintenance are assured.
COSTS:
Costs are R&D expenses, mainly composed by internal
workforce. Along with that, electronic components
supply, IoT modules manufacture, and cloud service
build company’s global costs.
STRENGTH AND KEY FACTORS:
The main strengths are as follow:
Collective self-consumption management
Electricity bills reduction,
Dynamic sharing of energy,
Near real-time vizualisation via a web app,
Trust in data, security and certification
MATURITY:
Sunchain has been developing its solution since 2016.
Currently, this solution is implemented on two 30 kWc
collective PV projects: in a social housing building and
in a small district of 7 building, representing 30 users.
In 2019, 4 projects would be set up with a total power
of 425 kWc PV.
PLACEMENT ALONG VALUE CHAIN OF nZEBs
Figure 20: BM 63 - Placement of the BM along the life-cycle processes

35
BM 64: BUILDING COMPANY (REAL ESTATE DEVELOPER): ADVANCED CUSTOMERS COM-
MUNICATION AND INTERNAL SCHEDULING PROJECT AND QUALITY MANAGEMENT
(FICTITIOUS MODEL)
VALUE PROPOSITION:
Real estate developers usually have a very high repeti-
tion rate in project execution with the individual buyers
and partners. Database-based project management in an
IT system, that simultaneously depicts and documents
the process steps and automatically maps the structured
customer communication in each step would represent
a multifactorial improvement of the process. Cloud
exchange of data and online confirmation for the indi-
vidual process steps would be conceivable. The "virtual
accessibility" of the blueprint would be possible. Again,
the online accessibility of the customer makes sense.
Every plan change would be comprehensible for the
customer and the online approval possible.
CUSTOMER RELATIONSHIPS:
In addition to the “normal” communication channels
this part of the customer relationship refers to the
communication after the conclusion of the contract. In
addition to an ordinary information exchange, the indi-
vidual process steps of the contractual relationship are
simultaneously documented
CUSTOMER SEGMENT:
The offer is for the buyers of the apartments and helps
to structure the communication in the whole process:
from the contract to the purchase, the execution plan-
ning and construction, payment and cost monitoring.
ACTIVITIES AND CAPABILITIES:
A wide range of customer relations, project and quality
management could be covered by a database, controlled
by different access rights in an IT system. All recurring
steps are mapped in the system and work like a to-do
list which can be viewed by both the client and the
account manager of the company. The construction
progress and the construction schedule are presented
and useable for all partners. Error minimization and
time savings are possible.
Figure 21: BM 64 - Screenshot:
http://property.sulekha.com/responsibilities-of-real-estate-
developers_624585_blog
REVENUES:
After an introductory phase, the added value comes
from the advantages of improved and structured com-
munication with the customer, the improvement of the
internal processes, the minimization of the possibility of
errors and the automatically accompanying parallel
process documentation
COSTS:
The company would have primarily more personnel
expenses but in the medium and long term, this meas-
ure will have a cost-reducing and efficiency-increasing
effect.
STRENGTHS AND KEY FACTORS:
Database based communication for complex re-
quirements
Better coordination and communication (with the
client and also internal)
Quality and project mangement
MATURITY:
-to be defined-
PLACEMENT ALONG VALUE CHAIN OF nZEBs
Figure 22: BM 64 - Placement of the BM along the life-cycle processes

36
BM 65: REAL ESTATE DEVELOPER BECOMES ENERGY SUPPLIER WITH CHP-PLANTS AND
PV (FICTITIOUS MODEL)
VALUE PROPOSITION:
Real estate developers usually are in the beginning of
the project realization the owner of the property. With
the notarial certification, ownership of the property and
the apartments pass to the buyer. Here both the com-
pany and the buyers can register special rights of use in
the land register. A possible model could be that the
company retains the special use rights as registered
easement at the CHP- plant and the photovoltaic sys-
tem and thus becomes an energy producer. Since the
state feed-in tariff for renewable electricity in Germany
is falling, it would make economic sense to sell the
produced electricity to tenants and buyers. Since the
customer has the free choice of provider, the price of
electricity (to be economically attractive) must be below
that of the public providers. Due to the statutory de-
gressive reduction of the feed-in tariff, this model is still
interesting. The discounted sale nevertheless generates
higher revenues than the feed-in tariff. Customers re-
ceive renewable, sustainable and locally produced ener-
gy.
CUSTOMER RELATIONSHIPS:
The customer relationship already exists through the
entire project period from the purchase, the planning to
the execution of the building. The "green" benefits of
locally produced electricity and heat can be discussed
and explained through direct customer contact.
CUSTOMER SEGMENT:
The offer is for the buyers and tenants of the apart-
ments.
ACTIVITIES AND CAPABILITIES:
Housing companies need the proof of compliance with
the Energy Saving Ordinance for their buildings. In
most cases, the required result is achieved through a
combination of thermal building envelope improve-
ments, energy efficient equipment and a share of locally
produced renewable energy. The Real Estate developer
has the advantage of achieving the required results and
could simultaneously act as an energy producer. Due to
the drop in the price of feed-in tariffs
for electricity, it is becoming increasingly attractive to
offer it for the local consumption. Consumers benefit
from the slightly lower price compared to the public
providers. The company can promote the sustainable
principle and increase the acceptance of renewable
energy through the uncomplicated access for owners
and tenants.
Figure 23: BM 65 - Screenshot:
https://en.wikipedia.org/wiki/Cogeneration
REVENUES:
The revenues are made with the sale of electricity and
heat. The profits may not likely to be very high, but the
Energy Saving Ordinance (ENEV) will be awarded and
investment in the purchase and maintenance of the
facilities will be self-evident. An added value is also
created by the image gain for the company.
COSTS:
The company would have primarily the manageable
investment costs for the plants. Depreciation and
maintenance are covered by the income.
STRENGTHS AND KEY FACTORS:
Companies benefit from the achievement of the
Energy Saving Ordinance (ENEV) for the building and
at the same time have the opportunity to act as an
energy producer
Customers have cheap access to locally and
sustainably produced energy (heat and electricity)
Increase of the acceptance of renewable energy
systems through easier access
MATURITY:
-to be defined-
PLACEMENT ALONG VALUE CHAIN OF nZEBs
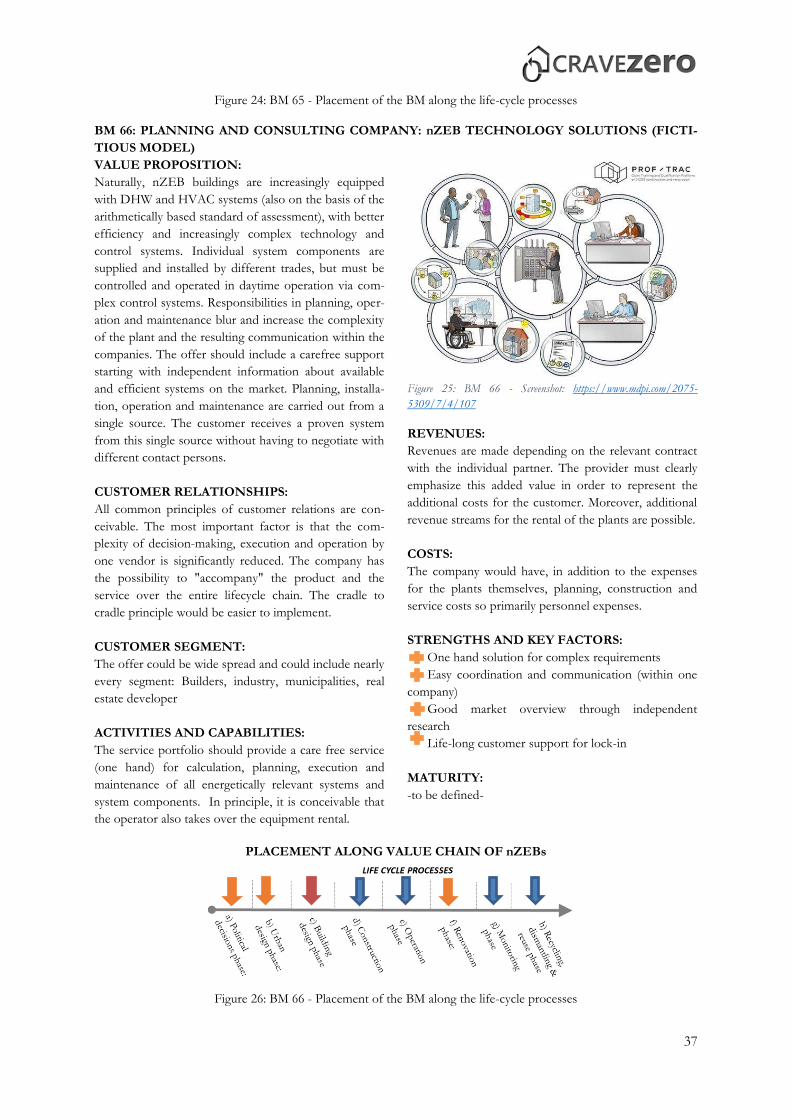
37
Figure 24: BM 65 - Placement of the BM along the life-cycle processes
BM 66: PLANNING AND CONSULTING COMPANY: nZEB TECHNOLOGY SOLUTIONS (FICTI-
TIOUS MODEL)
VALUE PROPOSITION:
Naturally, nZEB buildings are increasingly equipped
with DHW and HVAC systems (also on the basis of the
arithmetically based standard of assessment), with better
efficiency and increasingly complex technology and
control systems. Individual system components are
supplied and installed by different trades, but must be
controlled and operated in daytime operation via com-
plex control systems. Responsibilities in planning, oper-
ation and maintenance blur and increase the complexity
of the plant and the resulting communication within the
companies. The offer should include a carefree support
starting with independent information about available
and efficient systems on the market. Planning, installa-
tion, operation and maintenance are carried out from a
single source. The customer receives a proven system
from this single source without having to negotiate with
different contact persons.
CUSTOMER RELATIONSHIPS:
All common principles of customer relations are con-
ceivable. The most important factor is that the com-
plexity of decision-making, execution and operation by
one vendor is significantly reduced. The company has
the possibility to "accompany" the product and the
service over the entire lifecycle chain. The cradle to
cradle principle would be easier to implement.
CUSTOMER SEGMENT:
The offer could be wide spread and could include nearly
every segment: Builders, industry, municipalities, real
estate developer
ACTIVITIES AND CAPABILITIES:
The service portfolio should provide a care free service
(one hand) for calculation, planning, execution and
maintenance of all energetically relevant systems and
system components. In principle, it is conceivable that
the operator also takes over the equipment rental.
Figure 25: BM 66 - Screenshot: https://www.mdpi.com/2075-
5309/7/4/107
REVENUES:
Revenues are made depending on the relevant contract
with the individual partner. The provider must clearly
emphasize this added value in order to represent the
additional costs for the customer. Moreover, additional
revenue streams for the rental of the plants are possible.
COSTS:
The company would have, in addition to the expenses
for the plants themselves, planning, construction and
service costs so primarily personnel expenses.
STRENGTHS AND KEY FACTORS:
One hand solution for complex requirements
Easy coordination and communication (within one
company)
Good market overview through independent
research
Life-long customer support for lock-in
MATURITY:
-to be defined-
PLACEMENT ALONG VALUE CHAIN OF nZEBs
Figure 26: BM 66 - Placement of the BM along the life-cycle processes

38
BM 67: EASY COMMUNICATION ONLINE
VALUE PROPOSITION:
With this BM, it is aimed to combine the internal work-
flow with customer communication to keep customer
always up to date for main processes. A tracking tool
for processes like shipment tracking can be useful to
ease the process both for the company and the custom-
er.
CUSTOMER RELATIONSHIPS:
The purpose of this BM is to automate the process of
following an order from a company. Ther
efore, automated services (notification, email etc.) can
be an option for customer relationships. Besides that,
self-service of personal assistance would also serve the
purpose.
CUSTOMER SEGMENT:
The offer could be wide spread and could include nearly
every segment: Residential, commercial and industrial
buildings, real estate owners, property administrators,
designers, builders etc.
ACTIVITIES AND CAPABILITIES:
The service portfolio should provide a care free service
for problem solving, networking, communicating
online, and tracking the stages of a project.
REVENUES:
Revenues are made from license, usage and/or sub-
scription fee for the tracking app.
Figure 27: BM 67 - Screenshot:
https://www.greenteksolutionsllc.com/blog/The_new_Information_and
_Communication_Technologies_-ICT-
COSTS:
The company would have, in addition to the expenses
for the plants themselves, tracking system expenses.
STRENGTHS AND KEY FACTORS:
One hand solution for complex requirements
Easy coordination and communication with the
tracking app
Decreasing the staff cost of a company which
would be used for the communication purposes instead
of tracking app.
MATURITY:
-to be defined-
PLACEMENT ALONG VALUE CHAIN OF nZEBs
Figure 28: BM 67 - Placement of the BM along the life-cycle processes
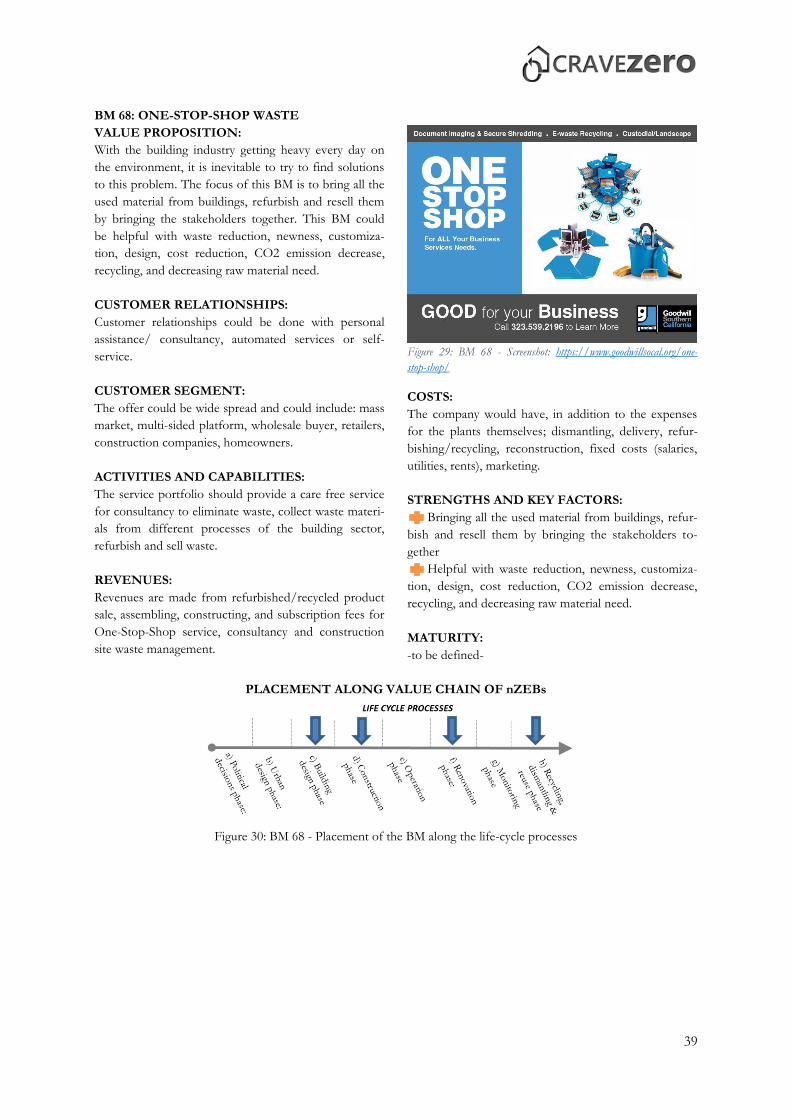
39
BM 68: ONE-STOP-SHOP WASTE
VALUE PROPOSITION:
With the building industry getting heavy every day on
the environment, it is inevitable to try to find solutions
to this problem. The focus of this BM is to bring all the
used material from buildings, refurbish and resell them
by bringing the stakeholders together. This BM could
be helpful with waste reduction, newness, customiza-
tion, design, cost reduction, CO2 emission decrease,
recycling, and decreasing raw material need.
CUSTOMER RELATIONSHIPS:
Customer relationships could be done with personal
assistance/ consultancy, automated services or self-
service.
CUSTOMER SEGMENT:
The offer could be wide spread and could include: mass
market, multi-sided platform, wholesale buyer, retailers,
construction companies, homeowners.
ACTIVITIES AND CAPABILITIES:
The service portfolio should provide a care free service
for consultancy to eliminate waste, collect waste materi-
als from different processes of the building sector,
refurbish and sell waste.
REVENUES:
Revenues are made from refurbished/recycled product
sale, assembling, constructing, and subscription fees for
One-Stop-Shop service, consultancy and construction
site waste management.
Figure 29: BM 68 - Screenshot: https://www.goodwillsocal.org/one-
stop-shop/
COSTS:
The company would have, in addition to the expenses
for the plants themselves; dismantling, delivery, refur-
bishing/recycling, reconstruction, fixed costs (salaries,
utilities, rents), marketing.
STRENGTHS AND KEY FACTORS:
Bringing all the used material from buildings, refur-
bish and resell them by bringing the stakeholders to-
gether
Helpful with waste reduction, newness, customiza-
tion, design, cost reduction, CO2 emission decrease,
recycling, and decreasing raw material need.
MATURITY:
-to be defined-
PLACEMENT ALONG VALUE CHAIN OF nZEBs
Figure 30: BM 68 - Placement of the BM along the life-cycle processes

40
BM 69: TRUST US
VALUE PROPOSITION:
Building a trust mechanism between a company and its
customers is an advantage for the both sides. When the
customers feel safe and satisfied with a company for the
solutions they offer to their customers, customers will
keep going back to the same company. This can work
vice versa. A company will feel motivated when they see
their customers happy and keep choosing them for their
problems. Because of the reasons indicated above, this
BM aims to build trust mechanisms and behaviours for
the each step of a company by independent certifica-
tions, giving services and guarantees, and ranking visible
in the public.
CUSTOMER RELATIONSHIPS:
Customer relationships could be done with personal
assistance/ consultancy, automated services or self-
service.
CUSTOMER SEGMENT:
The offer could be wide spread and could include: Resi-
dential, commercial and industrial buildings, real estate
owners, property administrators, designers, and build-
ers.
ACTIVITIES AND CAPABILITIES:
The service portfolio should provide a care free service
for consultancy for trust actions, self-awareness, re-
sponsiveness, value congruence, and networking
Figure 31: BM 69 - Screenshot: https://www.canstockphoto.com/trust-
us-stamp-24416751.html
REVENUES:
Revenues are made from license fees. The client gives
money, and the firm offers services and money back
guarantees.
COSTS:
The company would have, in addition to the expenses
for the plants themselves; license fees, insurance, and
guarantees.
STRENGTHS AND KEY FACTORS:
MATURITY:
-to be defined-
PLACEMENT ALONG VALUE CHAIN OF nZEBs
Figure 32: BM 69 - Placement of the BM along the life-cycle processes

41
BM 70: RENT INSTEAD OF BUY
VALUE PROPOSITION:
Lighting can create a definitely different atmosphere in
spaces. That is why professional lighting especially in
offices is quite important for the productivity of the
employees. However, the owners may not want to in-
vest huge amounts for it. This is why this ‘Rent Instead
of Buy’ can be advantageous for some businesses. This
business model offers high lighting quality at the work-
place. The owners will have no expenditure for the
maintenance and servicing of the illuminants.
CUSTOMER RELATIONSHIPS:
Customer relationships are carried on with contracts.
CUSTOMER SEGMENT:
The offer could be wide spread and could include: Resi-
dential, commercial and industrial buildings, real estate
owners, owners of halls and shops, property administra-
tors, designers, and builders.
ACTIVITIES AND CAPABILITIES:
The service portfolio should provide a care free service
for consultancy, detailed design, installation, service and
maintenance.
REVENUES:
Revenues are made from renting for the provision of
light sources for a fixed contract period.
Figure 33: BM 70 - Screenshot:
http://winled.com/en/blog/article/Office-lighting-design
COSTS:
-There are no investment costs for the lighting for the
owner
-The company rents out the lighting quality at the
workplace, which means that the owner can plan the
rental costs on an ongoing basis
- No costs for the investment
- No costs for servicing and maintenance
- No rent increase for the duration of the contract
STRENGTHS AND KEY FACTORS:
MATURITY:
-to be defined-
PLACEMENT ALONG VALUE CHAIN OF nZEBs:
Figure 34: BM 70 - Placement of the BM along the life-cycle processes

42
BM 71: CO2 EMISSION DECREASE
VALUE PROPOSITION:
This BM aims to create both operationally and envi-
ronmentally outstanding smart buildings, maximize
sustainability and substitute with renewables and natural
processes.
CUSTOMER RELATIONSHIPS:
Customer relationships could be done with detailed
website to answer all the possible questions, contacting
the customer support, online catalogs and brochures,
calling a consultant and references of previous projects
on the website with description of the problem, solu-
tion adopted, and benefits obtained.
CUSTOMER SEGMENT:
The offer could be wide spread and could include: Resi-
dential, commercial and industrial buildings, real estate
owners, property administrators, designers and builders.
ACTIVITIES AND CAPABILITIES:
The service portfolio should provide a care free service
for consultancy for monitoring and testing, reducing
energy waste, BMS, modeling, simulation and calcula-
tion, moving from non-renewable to renewable energy
sources, solar and wind-power based energy innova-
tions, zero emissions initiative, Blue Economy, the
Natural Step and green chemistry
Figure 35: BM 71 - Screenshot: https://sites.ndtv.com/breathe-
clean/how-green-buildings-can-reduce-your-carbon-footprint-2
REVENUES:
Revenues are made from depending on the relevant
contract and customer made services with different
revenues from consultancy, electric installation, mainte-
nance and renovation.
COSTS:
The company would have, in addition to the expenses
for the plants themselves; producing products for CO2
emission solutions, personnel expenditures for the
installation phase, consultancy and customer support,
communication, infrastructure, marketing and commer-
cial activity.
STRENGTHS AND KEY FACTORS:
MATURITY:
-to be defined-
PLACEMENT ALONG VALUE CHAIN OF nZEBs
Figure 36: BM 71 - Placement of the BM along the life-cycle processes
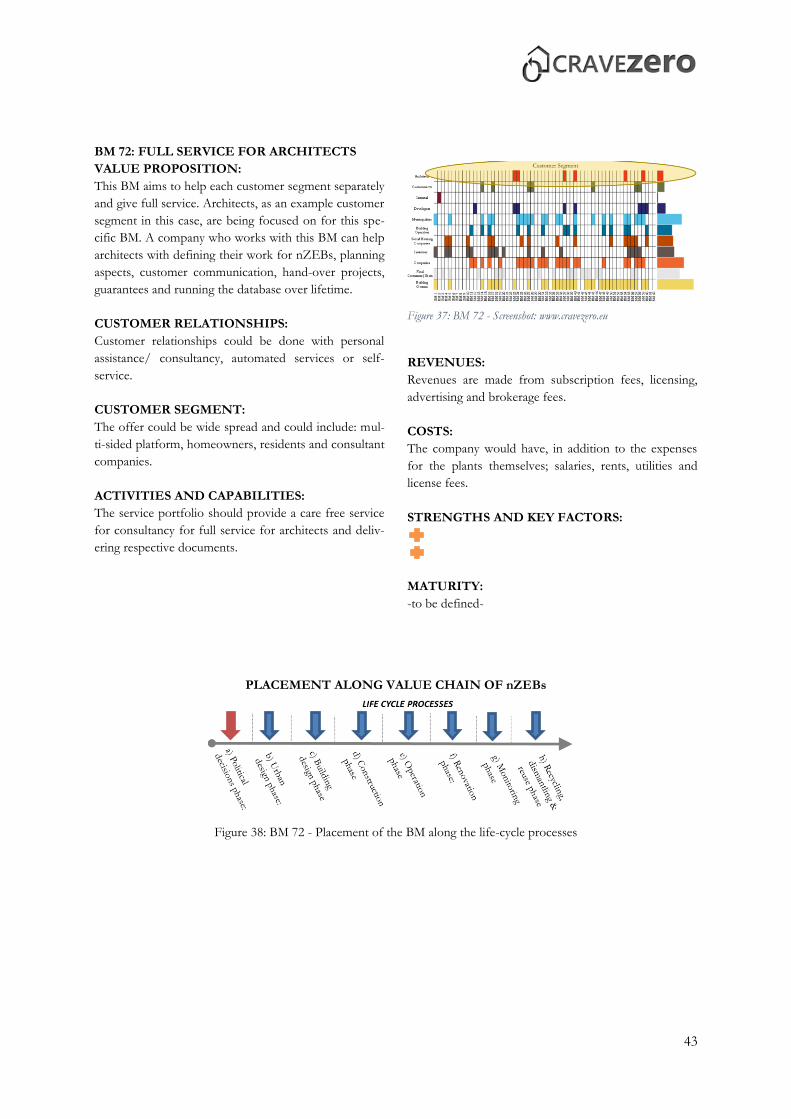
43
BM 72: FULL SERVICE FOR ARCHITECTS
VALUE PROPOSITION:
This BM aims to help each customer segment separately
and give full service. Architects, as an example customer
segment in this case, are being focused on for this spe-
cific BM. A company who works with this BM can help
architects with defining their work for nZEBs, planning
aspects, customer communication, hand-over projects,
guarantees and running the database over lifetime.
CUSTOMER RELATIONSHIPS:
Customer relationships could be done with personal
assistance/ consultancy, automated services or self-
service.
CUSTOMER SEGMENT:
The offer could be wide spread and could include: mul-
ti-sided platform, homeowners, residents and consultant
companies.
ACTIVITIES AND CAPABILITIES:
The service portfolio should provide a care free service
for consultancy for full service for architects and deliv-
ering respective documents.
Figure 37: BM 72 - Screenshot: www.cravezero.eu
REVENUES:
Revenues are made from subscription fees, licensing,
advertising and brokerage fees.
COSTS:
The company would have, in addition to the expenses
for the plants themselves; salaries, rents, utilities and
license fees.
STRENGTHS AND KEY FACTORS:
MATURITY:
-to be defined-
PLACEMENT ALONG VALUE CHAIN OF nZEBs
Figure 38: BM 72 - Placement of the BM along the life-cycle processes

44
BM 73: REPURPOSE FOR SOCIETY/ENVIRONMENT
VALUE PROPOSITION:
With this BM, it is aimed to help clients to optimize
their energy, operate efficiently, maximize energy effi-
ciency and sustainability, find solutions with electrical
distribution system and energy.
CUSTOMER RELATIONSHIPS:
Customer relationships can be handled with detailed
website to answer all the possible questions, contacting
the customer support, online catalogue, brochures,
calling a consultant, references of previous projects on
the website with description of the problem, solution
adopted, and benefits obtained.
CUSTOMER SEGMENT:
The offer could be wide spread and could include: Resi-
dential, commercial and industrial buildings, real estate
owners, property administrators, designers and builders.
ACTIVITIES AND CAPABILITIES:
The service portfolio should provide a care free service
for consultancy for:
-Reducing energy waste
-Not for profit
-Hybrid businesses, Social enterprise (for profit)
-Alternative ownership; cooperative, mutual (farmers)
collectives
-Social and biodiversity regeneration initiatives (‘net
positives’)
-Base of pyramid solutions
-Localization
-Home based, flexible working
Figure 39: BM 73 - Screenshot:
www.cecodoor.com/en/site/cecodoor/products/energy-efficiency/
REVENUES:
Revenues are made from depending on the relevant
contract, hybrid businesses, social enterprise for profit-
ing, customer made services with different revenues
from consultancy.
COSTS:
The company would have, in addition to the expenses
for the plants themselves; personnel expenditures for
consultancy and customer support, communication,
infrastructure, marketing, and commercial activity.
STRENGTHS AND KEY FACTORS:
MATURITY:
-to be defined-
PLACEMENT ALONG VALUE CHAIN OF nZEBs
Figure 40: BM 73 - Placement of the BM along the life-cycle processes

45
BM 74: QUALITY AND COMFORT INCREASE
VALUE PROPOSITION:
With this BM, it is aimed to help clients with optimizing
energy, operating efficiently, maximizing profitability
and energy efficiency, IT infrastructure, control devices,
integrated facility management, and energy solution.
CUSTOMER RELATIONSHIPS:
Customer relationships can be handled with detailed
website to answer all the possible questions, contacting
the customer support, online catalogs and brochures,
calling a consultant if need be, references of previous
projects on the website with description of the problem,
solution adopted and benefits obtained.
CUSTOMER SEGMENT:
The offer could be wide spread and could include: Resi-
dential and commercial buildings, real estate owners and
designers.
ACTIVITIES AND CAPABILITIES:
The service portfolio should provide a care free service
for consultancy for:
-Monitoring/Testing
-Programmable control
-24/7 monitoring of HVAC, lighting and metering
-Increasing comfort
-BMS
-Critical power
-Electrical distribution
-Industrial automation services
-Modelling
-Simulation/Calculation
Figure 41: BM 74 - Screenshot:
https://www.intel.com/content/www/us/en/smart-
buildings/opportunities/occupant-comfort-and-productivity.html
REVENUES:
Revenues are made from depending on the relevant
contract, customer made services with different reve-
nues from consultancy, electric installation, maintenance
and renovation.
COSTS:
The company would have, in addition to the expenses
for the plants themselves; personnel expenditures for
the installation phase, consultancy and customer sup-
port, communication, infrastructure, marketing and
commercial activity.
STRENGTHS AND KEY FACTORS:
MATURITY:
-to be defined-
PLACEMENT ALONG VALUE CHAIN OF nZEBs
Figure 42: BM 74 - Placement of the BM along the life-cycle processes
BM 75: ENERGY EFFICIENCY AND MONEY SAVING

46
VALUE PROPOSITION:
With this BM, it is aimed to help clients with optimizing
energy, operating efficiently, maximizing profitability
and energy efficiency, IT infrastructure, control devices,
integrated facility management, energy solution, maxim-
izing material and energy efficiency and substituting
with renewables and natural processes.
CUSTOMER RELATIONSHIPS:
Customer relationships can be handled with detailed
website to answer all the possible questions, contacting
the customer support, online catalogs and brochures,
calling a consultant, and references of previous projects
on the website with description of the problem, solu-
tion adopted and benefits obtained.
CUSTOMER SEGMENT:
The offer could be wide spread and could include: Resi-
dential, commercial and industrial buildings, real estate
owners and property administrators.
ACTIVITIES AND CAPABILITIES:
The service portfolio should provide a care free service
for consultancy for:
-Monitoring/Testing
-Programmable control
-24/7 monitoring of HVAC, lighting and metering
-BMS
-Modelling
-Simulation/Calculation
-Increased functionality (to reduce total number of
products required)
-Dematerialization (of products/packaging)
-Move from non-renewable to RES
-Solar power-based energy innovations
Figure 43: BM 75 - Screenshot:
https://isoilonline.com/2018/07/us-losing-ground-race-energy-
efficiency/
REVENUES:
Revenues are made from depending on the relevant
contract, and customer made services with different
revenues from consultancy, electric installation, mainte-
nance and renovation.
COSTS:
The company would have, in addition to the expenses
for the plants themselves; producing products for ener-
gy efficient and money saving solutions, personnel
expenditures for the installation phase, consultancy and
customer support, communication, infrastructure, mar-
keting and commercial activity.
STRENGTHS AND KEY FACTORS:
MATURITY:
-to be defined-
PLACEMENT ALONG VALUE CHAIN OF nZEBs
Figure 44: BM 75 - Placement of the BM along the life-cycle processes
BM 76: ENCOURAGE SUFFICIENCY

47
VALUE PROPOSITION:
With this BM, it is aimed to help clients with optimizing
energy, operating efficiently, IT infrastructure, control
devices, integrated facility management, electrical distri-
bution system and energy solution.
The purpose is to create both operationally and envi-
ronmentally outstanding smart buildings, maximize
energy efficiency and sustainability
CUSTOMER RELATIONSHIPS:
Customer relationships can be handled with detailed
website to answer all the possible questions, contacting
the customer support, online catalogs and brochures,
calling a consultant, and references of previous projects
on the website with description of the problem, solu-
tion adopted and benefits obtained
CUSTOMER SEGMENT:
The offer could be wide spread and could include: Resi-
dential, commercial and industrial buildings, real estate
owners, property administrators, designers and builders.
ACTIVITIES AND CAPABILITIES:
The service portfolio should provide a care free service
for consultancy for:
-Consumer education (models); communications and
awareness
-Monitoring/Testing
-Programmable control
-24/7 monitoring of HVAC, lighting and metering
-Reducing energy waste
-BMS
-Critical power
-Electrical distribution
-Industrial automation services
-Simulation/Calculation
-Demand management
-Product longevity
-Premium branding/Limited availability
-Frugal business
-Responsible product distribution/promotion
Figure 45: BM 76 - Screenshot: https://www.eqmagpro.com/japan-
will-explore-new-avenues-for-energy-self-sufficiency/
REVENUES:
Revenues are made from depending on the relevant
contract, and customer made services with different
revenues from consultancy, electric installation, mainte-
nance and renovation.
COSTS:
The company would have, in addition to the expenses
for the plants themselves; producing products for suffi-
cient and long lasting solutions, personnel expenditures
for the installation phase, consultancy and customer
support, communication, infrastructure, marketing and
commercial activity
STRENGTHS AND KEY FACTORS:
MATURITY:
-to be defined-
PLACEMENT ALONG VALUE CHAIN OF nZEBs
Figure 46: BM 76 - Placement of the BM along the life-cycle processes

48
BM 77: CONSTRUCTION COMPANY – DOPPIOUNO START-UP
VALUE PROPOSITION:
Doppiouno combines low cost of the construction
(investment) and affordability for the prospective
users (purchasing power) and build flexible and re-
versible residential towers. Typological study, technol-
ogy and design of the utility installations allow for
conspicuous savings in terms of building costs, energy
consumption, and maintenance. These design and
technological solutions also ensure that the interior
layout of the units is flexible and able to accommodate
different use requirements, and heterogeneous dwell-
ing types.
CUSTOMER RELATIONSHIP:
In order to get in touch with customers the company
provides a detailed website. References of previous
projects and all services offered by the company are
shown on the website. Personal assistance, a customer
service reachable via telephone hotline as well as in-
ternet and the offer of maintenance services helps
building a long-term customer relationship.
CUSTOMER SEGMENT:
The offer is wide spread. Students, city users, single-
income families, young couples, singles, senior citizens
and expatriates represent segments that are not
properly addressed by the current property market,
and this prevents them from finding the right housing
solution. Doppiouno responds well to their needs.
ACTIVITIES AND CAPABILITIES:
The service portfolio includes providing the necessary
information for customers, consultancy, construction
and its supervision as well as optional financing subsi-
dies. Maintenance service and customer support.
Figure 47: BM 77 - Screenshot: http://doppiounostudio.com/
REVENUES:
The company offers dwellings with different layouts,
ranging from the studio flat to the four-room apart-
ment. Moreover, additional revenue streams for finan-
cial consultancy, interior furnishing or maintenance
service.
COSTS:
The most important costs are represented by building
materials, followed by personnel expenditures for the
construction phase, consultancy, maintenance and
customer support.
STRENGTHS AND KEY FACTORS:
Flexibile and customisable dwellings
Low cost of investment and affordability
Environmental, social and economic sustainability
MATURITY:
Start-up
PLACEMENT ALONG VALUE CHAIN OF nZEBs
Figure 48: BM 77 - Placement of the BM along the life-cycle processes

49
12. REFERENCES
1. CRAVEzero (2019): D52_Existing nZEB Business Models. Available online at
http://www.cravezero.eu/wp-
content/uploads/2019/03/CRAVEzero_D52_Existing_nZEB_business%20models.pdf.
2. http://www.free-management-ebooks.com/faqst/swot-03.htm
3. Osterwalder, A.; Pigneur, Y. (2010a): Business Model Generation. Ein Handbuch für Visionäre,
Spielveränderer und Herausforderer. Frankfurt am Main: Campus Verlag GmbH, checked on
2/22/2018.
4. https://strategyzer.uservoice.com
5. https://www.cleverism.com/key-activities-block-business-model-canvas/
6. The DENA building report 2016 Statistics and analyzes of energy efficiency in the building stock
https://www.dena.de/fileadmin/dena/Dokumente/Pdf/9268_dena_concise_2018_building_repor
t.pdf
7. Finanzforum Energieeffizienz https://www.finanzforum-energieeffizienz.de/
8. BulwienGesa (2010; 2015) https://www.bulwiengesa.de/de/publikationen/studien/logistik-und-
immobilien-2015
9. BMWi (2015) The CO Firm http://co-firm.com/publikationen/
10. BaFin (2015) https://www.bafin.de/SharedDocs/Downloads/DE/Jahresbericht/dl_jb_2015.html