Embed Size (px)
Citation preview

Cybersource Global Payments Study 2020Lessons from top performers

AboutCybersource
For over 25 years Cybersource has been putting people at the heart of everything we do. Building flexible, creative commerce solutions that make everyday life easier. Cybersource is a modular, cloud-based payment platform that helps you adapt and grow. We enable customers to reach further, adapt faster and grow stronger.
Disclosure
Comparisons, statistics, research and recommendations are provided “AS IS” and intended for informational purposes only and should not be relied upon for operational, marketing, legal, technical, tax, financial or other advice. Cybersource does not make any warranty or representation as to the completeness or accuracy of the Information within this document, nor assume any liability or responsibility that may result from reliance on such Information. The Information contained herein is not intended as legal advice, and readers are encouraged to seek the advice of a competent legal professional where such advice is required.
2Global Payments Study Report 2020Cybersource

This 2020 Global Payments Study Report highlights the results of an in-depth independent study conducted by Ipsos in January and February of 2020.
This year, 890 payment, fraud and payment analytics specialists in 20 countries completed the payment study, which doubled both the total number of respondents and participating countries compared to the previous study in 2018.
The opt-in sample of payment professionals included a diverse mix of SMB, mid-market and enterprise organizations representing physical goods, digital goods, travel, transportation, entertainment and other types of businesses. The 2020 study was made available in seven languages and included respondents from the North American, Latin American, European, and Asia Pacific regions.
This year’s study focused on understanding how leading businesses are approaching today’s rapidly changing and uncertain payment landscape, what payment approaches and strategies are achieving the best results, and what organizations view as their top payment challenges and priorities for the coming year.The main objective of the 2020 Global Payments
Study Report is to provide you with data, benchmarks and insights you can use to evaluate your current payment priorities and strategy, learn how innovative and forward-looking organizations are staying ahead of changes in the payment landscape, and chart a more confident and informed course into your payment future.
About this report
890Payment, fraud and payment analytics specialists in eCommerce solutions
22Countries, and territories
3Global Payments Study Report 2020Cybersource

When the ipsos team conducted this year’s Global Payments Study Report in January and February, they found that understanding and adapting to rapid change was already a top-of-mind issue for most businesses. In the months since, the definition and scale of that change has obviously taken on new dimensions—in the payment world and everywhere else. During times of major disruption– such as with COVID-19 – businesses require the ability to adapt quickly and can be the difference between thriving and perhaps not surviving. The insights in this study can be used to build a more flexible and resilient business model, as well as to deliver a better experience and get better outcomes in normal times.
In this context, the 2020 Global Payments Study Report provides a valuable benchmark—a “baseline of normal” that payment professionals can use to stay focused and grounded as they navigate a year of unprecedented uncertainty. In fact, as you explore the report, you’ll likely find that many of the things that were “top priorities” a few months ago have become “urgent imperatives” today. And as we move forward together, we will certainly all find ways to adapt, accelerate and re-prioritize the findings and recommendations that follow to meet the unique challenges of the coming year.
Profile of a payment leader (and why it matters)
To provide relevant and actionable insights, this report focuses on identifying and highlighting payment practices that define the highest performing organizations in the study. By analyzing the approaches, strategies and techniques these top performers use—and comparing them to average businesses—we
will provide you with a valuable benchmark for assessing and improving your own payment performance.
Respondents conveyed a strong sense of confidence in their organizations’ ability to protect customers’ payment and loyalty data; the quality of their payment management tools; how well their in-store, in-app and online customer experiences connect and work together; their ability to successfully enter new local and global markets; and the overall efficiency of their payment management solutions.
We hope that gaining a deeper understanding of how top-performing businesses approach payments—and the specific methods they use to achieve success—will guide your organization’s efforts to become (or remain) a payment leader.
Introduction
How did we identify these top performers?
They were the survey respondents with the: Highest conversion rates. Highest payment acceptance rates. Highest levels of internal satisfaction with their organizations’ payment processes and capabilities.
4Global Payments Study Report 2020Cybersource
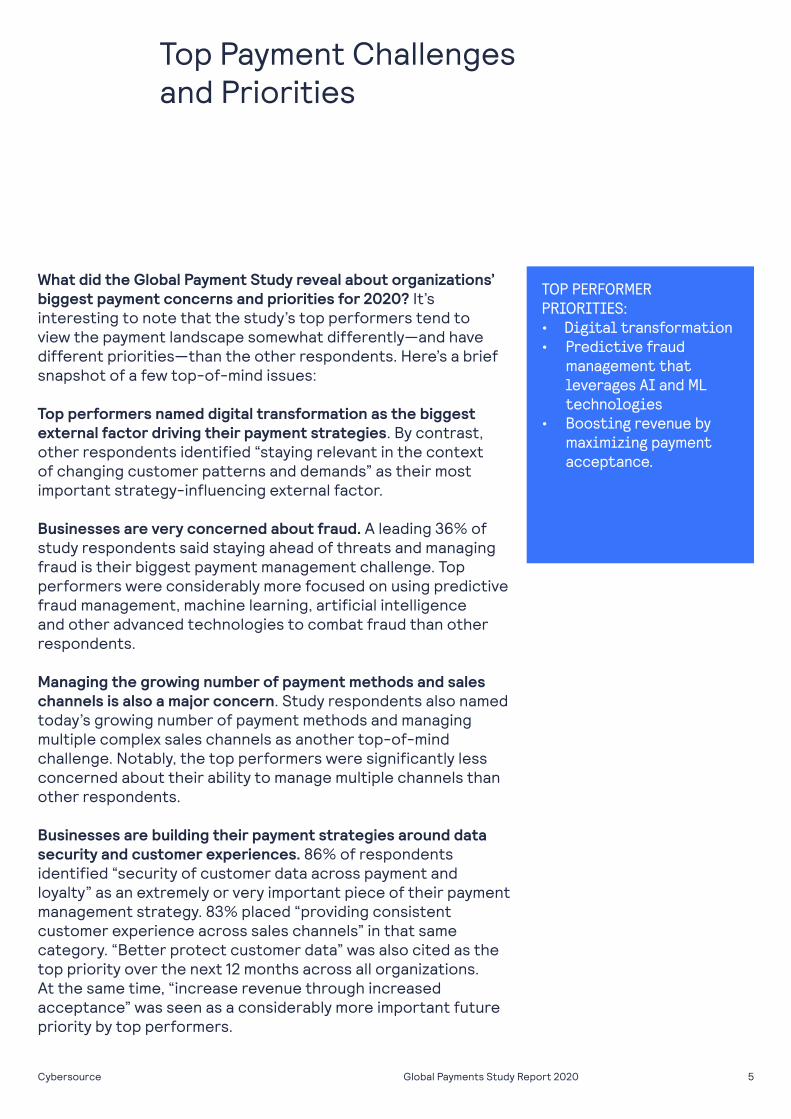
What did the Global Payment Study reveal about organizations’ biggest payment concerns and priorities for 2020? It’s interesting to note that the study’s top performers tend to view the payment landscape somewhat differently—and have different priorities—than the other respondents. Here’s a brief snapshot of a few top-of-mind issues:
Top performers named digital transformation as the biggest external factor driving their payment strategies. By contrast, other respondents identified “staying relevant in the context of changing customer patterns and demands” as their most important strategy-influencing external factor.
Businesses are very concerned about fraud. A leading 36% of study respondents said staying ahead of threats and managing fraud is their biggest payment management challenge. Top performers were considerably more focused on using predictive fraud management, machine learning, artificial intelligence and other advanced technologies to combat fraud than other respondents.
Managing the growing number of payment methods and sales channels is also a major concern. Study respondents also named today’s growing number of payment methods and managing multiple complex sales channels as another top-of-mind challenge. Notably, the top performers were significantly less concerned about their ability to manage multiple channels than other respondents.
Businesses are building their payment strategies around data security and customer experiences. 86% of respondents identified “security of customer data across payment and loyalty” as an extremely or very important piece of their payment management strategy. 83% placed “providing consistent customer experience across sales channels” in that same category. “Better protect customer data” was also cited as the top priority over the next 12 months across all organizations. At the same time, “increase revenue through increased acceptance” was seen as a considerably more important future priority by top performers.
TOP PERFORMER PRIORITIES:• Digital transformation• Predictive fraud
management that leverages AI and ML technologies
• Boosting revenue by maximizing payment acceptance.
Top Payment Challenges and Priorities
5Global Payments Study Report 2020Cybersource

Embracing a growing number of payment methods
Traditional payment cards continue to be the most common and widely accepted payment method among study respondents. But over the past 12 months, payment leaders have pushed to offer their customers a more diverse range of options. By far, the most common reason for adding new payment methods was the desire to improve customer experiences, and payment leaders were also more likely to support all of the different payment methods identified in the study.
Expanding acceptance across multiple channelsThe web continues to be the most popular and widely used sales channel by a significant margin, with brick and mortar, mobile app, mobile web and telephone call centers filling in the next four slots.
However, the top performers in the study were more likely to support most or all of the top four channels on the list—especially web, mobile web and mobile app sales.
How and where businesses accept payments
Mailorderchannel
Kiosk In-the-field(conference shows)
Web MobileApp
Mobileweb
Brick& MortarLocation
Phone/Call center
3rd Partymarketplaces
Currently supported sales channels global totals:
QUESTION ASKED: Which, if any, of the following sales channels does your organization currently support? (Select all that apply.)
QUESTION ASKED: 1. Which, if any, of the following types of payment methods does your organization currently accept in your three largest markets? 2. Which, if any, of the following types of payments methods did your organization add over the past 12 months?
88%
47%
76%
46%
43%
24%
39%
20%
31%
12%
69%
44%
53%
33%
Currently accepted payment methodsPayment methods added in the
past 12 months
Payment methods currently accepted/added in past 12 months:
59%50% 50% 50% 45%
36%27%
21% 21%
Cards eWallets
Bank Transfers/Cash
Third-PartyGift Cards/Vouchers
Digital Wallets mCommerce
6Global Payments Study Report 2020Cybersource

How and where businesses accept payments
QUESTION ASKED: Which, if any, of the following are reasons why your organization added new/local types of payment methods over the past 12 months?
Reasons for adding new/local types of payment methods over the past 12 months:
ImproveCustomerExperience
60%
Adoptmobilepayment methods
44%
Provide accessto new markets
42%
Worktowardmoreintegrated commerce systems
38%
Acceptinstallments
31%
Avoidcheck-outabandonment because ofregional requirements
29%
RegionalRequirements
27%
7Global Payments Study Report 2020Cybersource

The advantages of connecting to multiple payment processors and merchant acquiring banks
On average, organizations have formed connections with more than four different payment processors (gateways) and more than three different merchant acquiring banks. Leaders maintain a far greater number of merchant acquiring relationships, not just for overall flexibility, but to improve geographic coverage, give access to distinctive technology or capabilities, maximize authorizations and maximize uptime.
How and where business accept payments
QUESTION ASKED: How many payment gateway or processor connections does your organization currently support?
QUESTION ASKED: How many merchant acquiring banks does your organization currently use?
Number of connections with payment processors/gateways:
Number of relationships with merchant acquiring banks:
Mean MeanMedian Median
4.0
3.0
22%of organizations use 5 or more merchant acquiring banks
4.4
3.6
8Global Payments Study Report 2020Cybersource
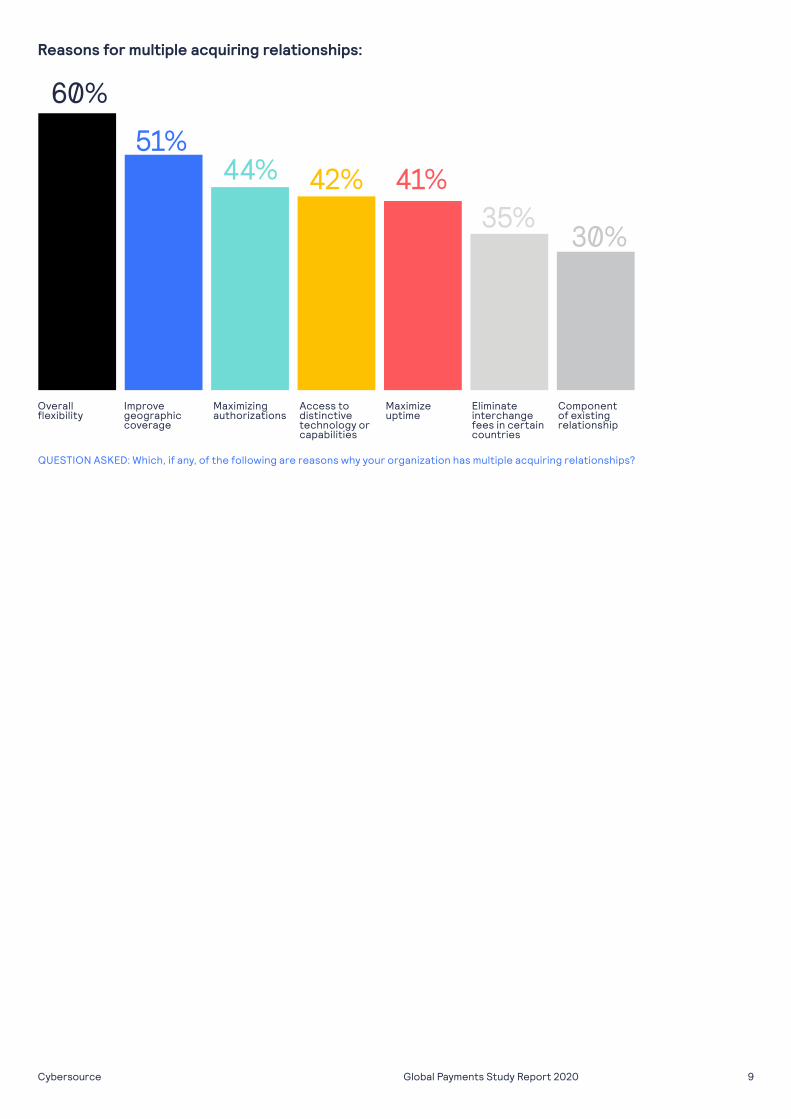
Overallflexibility
Improvegeographiccoverage
Maximizingauthorizations
Access to distinctive technology or capabilities
Maximizeuptime
Eliminate interchangefees in certain countries
Component of existing relationship
Reasons for multiple acquiring relationships:
QUESTION ASKED: Which, if any, of the following are reasons why your organization has multiple acquiring relationships?
60%
51%44% 42% 41%
35%30%
9Global Payments Study Report 2020Cybersource
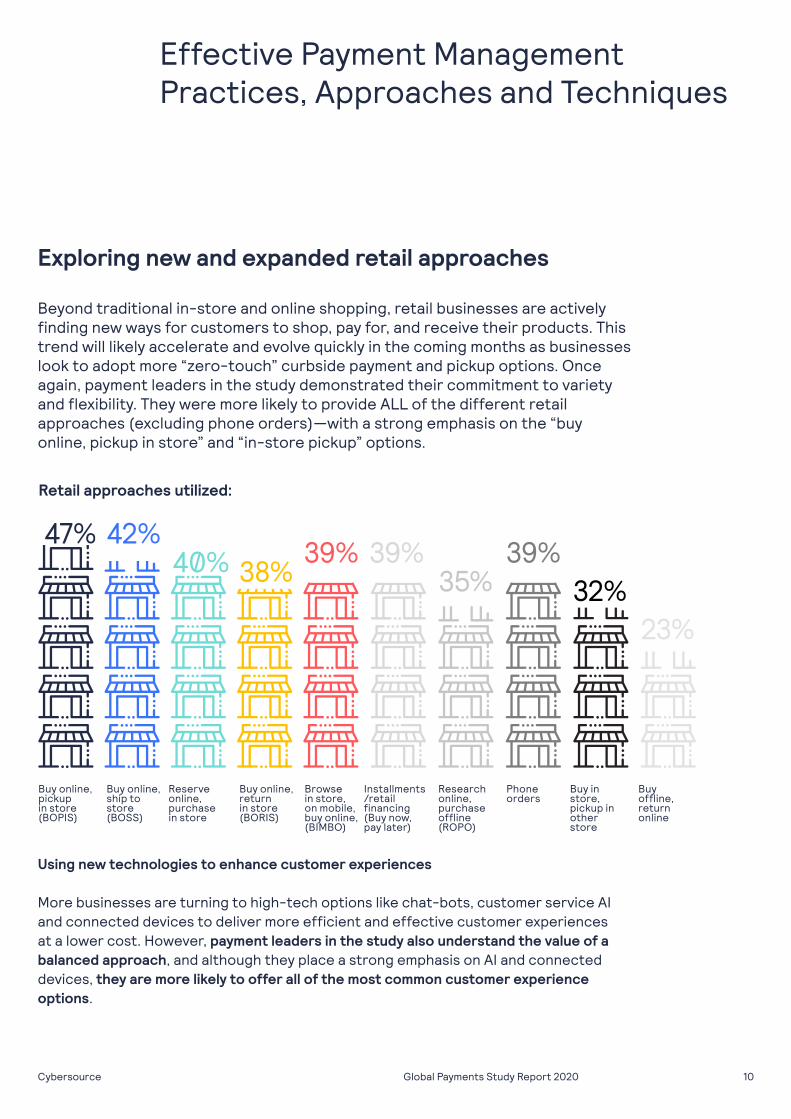
Exploring new and expanded retail approaches Beyond traditional in-store and online shopping, retail businesses are actively finding new ways for customers to shop, pay for, and receive their products. This trend will likely accelerate and evolve quickly in the coming months as businesses look to adopt more “zero-touch” curbside payment and pickup options. Once again, payment leaders in the study demonstrated their commitment to variety and flexibility. They were more likely to provide ALL of the different retail approaches (excluding phone orders)—with a strong emphasis on the “buy online, pickup in store” and “in-store pickup” options.
Using new technologies to enhance customer experiences More businesses are turning to high-tech options like chat-bots, customer service AI and connected devices to deliver more efficient and effective customer experiences at a lower cost. However, payment leaders in the study also understand the value of a balanced approach, and although they place a strong emphasis on AI and connected devices, they are more likely to offer all of the most common customer experience options.
Effective Payment Management Practices, Approaches and Techniques
Buy online,pickupin store(BOPIS)
Buy online,ship tostore(BOSS)
Reserveonline, purchasein store
Buy online, returnin store (BORIS)
Browsein store, on mobile,buy online,(BIMBO)
Installments/retail financing(Buy now, pay later)
Researchonline, purchase offline (ROPO)
Phone orders
Buy in store, pickup in other store
Buy offline,return online
Retail approaches utilized:
47%40% 39% 39%
42%38% 35%
39%32%
23%
10Global Payments Study Report 2020Cybersource
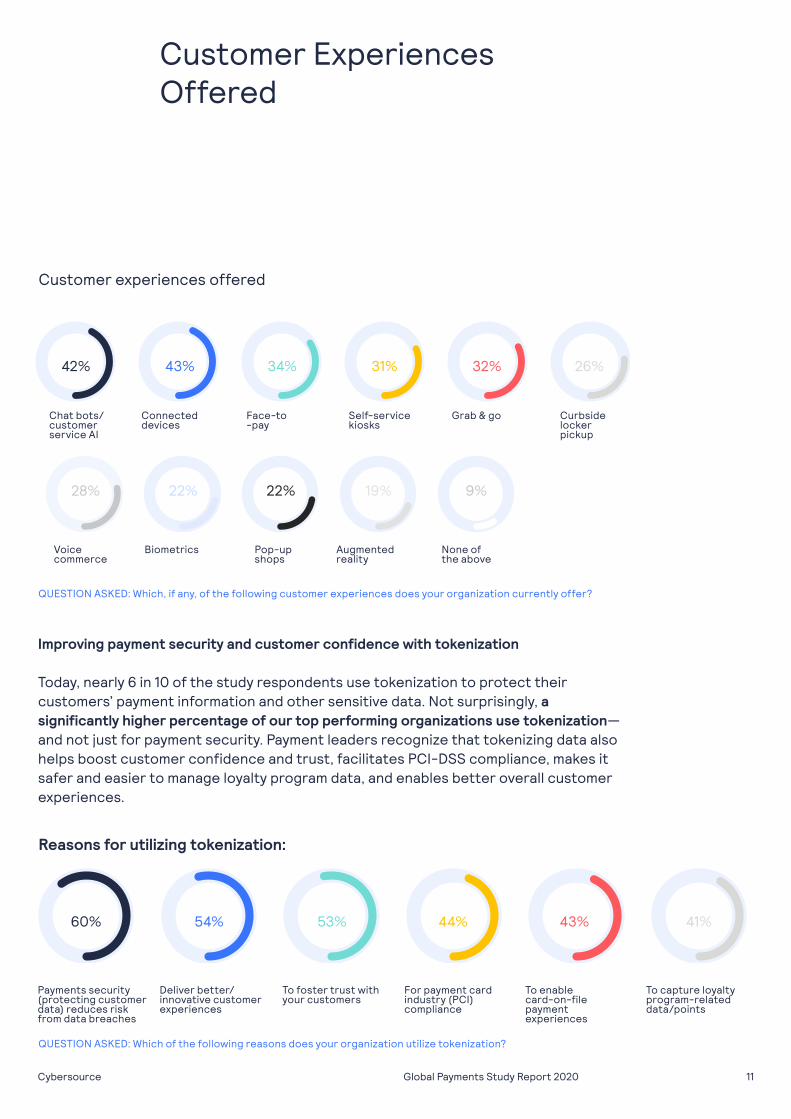
Customer experiences offered
Chat bots/customer service AI
Connecteddevices
Face-to-pay
Self-service kiosks
Grab & go Curbsidelocker pickup
Voice commerce
Biometrics Pop-upshops
Augmentedreality
None ofthe above
QUESTION ASKED: Which, if any, of the following customer experiences does your organization currently offer?
QUESTION ASKED: Which of the following reasons does your organization utilize tokenization?
Improving payment security and customer confidence with tokenization Today, nearly 6 in 10 of the study respondents use tokenization to protect their customers’ payment information and other sensitive data. Not surprisingly, a significantly higher percentage of our top performing organizations use tokenization—and not just for payment security. Payment leaders recognize that tokenizing data also helps boost customer confidence and trust, facilitates PCI-DSS compliance, makes it safer and easier to manage loyalty program data, and enables better overall customer experiences.
Payments security (protecting customerdata) reduces risk from data breaches
Deliver better/innovative customer experiences
To foster trust with your customers
For payment card industry (PCI) compliance
To enablecard-on-file payment experiences
To capture loyalty program-related data/points
Reasons for utilizing tokenization:
34% 32%43%42% 26%31%
22%22% 9%28% 31%28% 22% 22% 19% 9%
42% 43% 34% 31% 32% 26%
34% 32%43%42% 31% 26%60% 54% 53% 44% 43% 41%
Customer Experiences Offered
11Global Payments Study Report 2020Cybersource

Making payment authorizations more efficient, intelligent and secure As payment management processes become more complex, businesses are actively pursuing new approaches and techniques to make payment authorizations safer and more efficient. Nearly 75% of the organizations in the study currently use third-party data to facilitate authorizations. This includes taking advantage of intelligent payment routing among multiple gateway providers (based on authorization rates) or among multiple acquirers (for declined transactions).
Many organizations are also using machine learning to fine-tune their fraud management rules, as well as taking advantage of automated account updaters, tokenized real-time card-on-file updates, and automatic retries on subscriptions to reduce failed transactions. As part of the same familiar pattern, the performance leaders in the study made greater use of all these authorization approaches and techniques, especially machine learning to fine-tune fraud management and intelligent payment routing, and were more likely to use third-party data in conjunction with authorization.
Effective Payment Management Practices, Approaches and Techniques
Intelligent paymentrouting
Using machinelearning tofine-tune fraud management
Reducing failed transactions with Account Updater
Real-timecard-on-file updates using tokenization
Automated retries for subscription payments
Dynamiccurrency conversion
3D Secure2 usageto improve(issuer)approval rate
None of the above
Authorization-related approaches and techniques:
49%41%
37% 35% 34% 33%
25%
9%
QUESTION ASKED: Which, if any, of the following authorization-related approaches and techniques does your organization use?
12Global Payments Study Report 2020Cybersource

Intelligent payment routing
3D Secure 2usage toimprove user (issuer) approval rate
Using machinelearning tofine-tune fraudmanagement
Dynamic currency conversion
Reducing failed transactions with Account Updater
Automated retries for subscription payments
Real-timecard-on-file updates using tokenization
Use of third-party data in payment authorizations:
QUESTION ASKED: Does your organization use any third-party data in association with any of these?
79% 77% 77% 76% 75% 73% 71%
13Global Payments Study Report 2020Cybersource

Encouraging customers to use safer, lower-cost payment methods Not all payment methods are created equal, and eight in ten survey responders indicated their organizations take active measures to encourage customers to select payment methods that are less risky, carry lower processing costs and make funds available more quickly. We found that payment leaders are not only more likely to guide customers to specific payment methods, but do so much more so to lower risk. These leading organizations are also much more likely to utilize incentives (discounts, loyalty points, free shipping, etc.) and pre-select the preferred payment method on checkout pages.
Effective Payment Management Practices, Approaches and Techniques
Lower payment fraud risk
Provide incentives forusing preferred payment method(s)
Faster availability of funds
Promote preferred payment method(s)
Lower paymentprocessing costs
Offer preferred method(s) prior to payment selection page
Higher conversion rate(roll over definition)
Pre-select preferred payment
Reasons for encouraging preferred payment method(s):
Reasons for encouraging preferred payment method(s):
29%
57%
28%
51%
29%
45%
14%
41%
QUESTION ASKED: In what ways do you encourage customers to select one of your preferred types of payment method(s)?
14Global Payments Study Report 2020Cybersource

What are the best, most informative metrics for measuring payment management success and tracking progress and improvements? Overall, the cost of payments, revenue, and payment success rates were considered to be the three most important KPIs. Payment leaders, who tend to track more payment KPIs than others, also identified loss rates (which are tied to chargebacks and fraud), checkout abandonment rates, and order conversion rates as important KPIs—along with retry performance success and customer NPS.
Finding the Right KPIs for Measuring Payment Management Success
Cost of payments
Revenue
Payment success rate
Loss rates- chargeback and fraud rates
Order conversion rate
Refund rate
Authorization rate
Checkout abandonment rate
Authentication rate
Customer Net promoter scores (NPR) based on shopping experience
Average ticket size
Retry performance
Extremely important payment management KPIs:
QUESTION ASKED: Which, if any, of the following payments management key performance indicators (KPIs) are extremely important to your organization?
46%43%41%
31%29%29%27%26%
25%23%22%16%
15Global Payments Study Report 2020Cybersource

There is one central, overarching characteristic that every top performer shares: they all successfully embrace the challenge of thinking beyond and staying ahead of change....The ability to adapt to change has never been more important than it is right now.
The 2020 Global Payment Study Report highlights dozens of specific practices and techniques that payment leaders have used to improve their payment performance.
But there is one central, overarching characteristic that every top performer shares: They all successfully embrace the challenge of thinking beyond and staying ahead of change, rather than simply keeping up with their competitors and peers.
In practical terms, this means proactively investing in processes and strategies that make their organizations more agile, adaptable and responsive to new payment requirements. Payment leaders have a more sophisticated and nuanced view of the total payment landscape. They consistently support more sales channels, payment methods, retail options, and payment connections than other businesses. They actively seek out and adopt the latest, most effective payment approaches and techniques. And they know how to measure their performance and progress more accurately and in greater depth.
Of course, the ability to adapt to change has never been more important than it is right now. So as we move deeper into this period of uncertainty, we hope you can use the insights in this report to guide your payment management efforts, think beyond the barrage of day-to-day challenges you face, stay ahead of the big, inevitable changes that are coming, and move into a bright payment future.
Payment Leadership Means Staying Ahead of Change
16Global Payments Study Report 2020Cybersource
Appendix
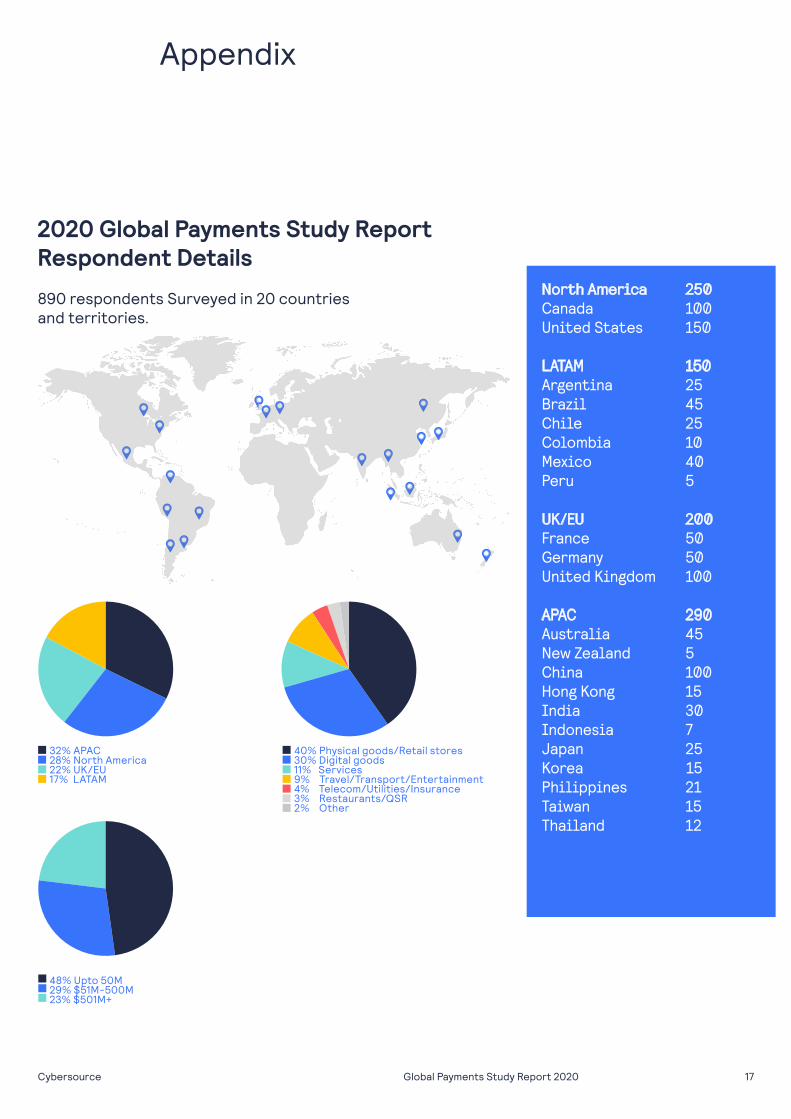
2020 Global Payments Study Report Respondent Details
890 respondents Surveyed in 20 countries and territories.
North America 250Canada 100United States 150
LATAM 150Argentina 25Brazil 45Chile 25Colombia 10Mexico 40Peru 5
UK/EU 200France 50Germany 50United Kingdom 100
APAC 290Australia 45New Zealand 5China 100Hong Kong 15India 30Indonesia 7Japan 25Korea 15Philippines 21Taiwan 15Thailand 12
32% APAC28% North America22% UK/EU17% LATAM
48% Upto 50M29% $51M-500M23% $501M+
40% Physical goods/Retail stores30% Digital goods11% Services9% Travel/Transport/Entertainment4% Telecom/Utilities/Insurance3% Restaurants/QSR2% Other
17Global Payments Study Report 2020Cybersource

Appendix
Respondents percentage of total revenue from eCommerce:
31% 50-74%24% 25-49%21% 75%+12% 1-24%7% Don’t know5% Cannot disclose
Payment types accepted in top 3 markets:
Cards Wallets DigitalWallets
mCommerceMobile
Bank transfers/cash option
ThirdParty
Gift cards/Vouchers
47%46%
44%
33%
24%
20%
12%
18Global Payments Study Report 2020Cybersource

Payment conversion rates by regions and verticals
Mean Conversion Rates:
Median Conversion Rates:
Total N/A LATAM EU APAC Up to $50M
$51-$500M $501M+
Cards 48% 57% 48% 50% 41% 51% 44% 50%
Bank transfers/cash 41% 43% 36% 45% 42% 44% 36% 44%
Digital wallets 38% 45% 29% 42% 35% 35% 36% 43%
mCommerce 36% 45% 28% 40% 32% 32% 34% 43%
eWallets 35% 40% 26% 40% 35% 33% 33% 42%
Gift cards/vouchers 33% 43% 22% 40% 29% 31% 30% 39%
Third-party 32% 36% 20% 35% 34% 29% 30% 38%
Region Revenue Size
Total N/A LATAM EU APAC Up to $50M
$51-$500M $501M+
Cards 45% 65% 50% 50% 30% 50% 35% 44%
Bank transfers/cash 27% 20% 22% 30% 29% 30% 20% 30%
Digital wallets 21% 28% 18% 27% 22% 20% 25% 30%
mCommerce 20% 25% 20% 25% 15% 18% 20% 20%
eWallets 20% 20% 10% 25% 20% 20% 20% 25%
Gift cards/vouchers 15% 20% 10% 20% 10% 10% 15% 15%
Third-party 15% 18% 10% 20% 15% 12% 15% 18%
Region Revenue Size
Appendix
19Global Payments Study Report 2020Cybersource

Appendix
Payment conversion rates by eCommerce revenue categories
Mean Conversion Rates:
Median Conversion Rates:
Total <50% >51% Goods/Retail Digital
Restau-rants/QSR*
Services Tele-com*
NET: Travel/
Transport/Entertain*
Other*
Cards 48% 45% 50% 55% 39% 46% 52% 55% 46% 48%
Bank transfers/cash 41% 41% 40% 47% 34% 36% 50% 38% 35% 63%
Digital wallets 38% 33% 41% 44% 34% 36% 32% 29% 32% 31%
mCommerce 36% 32% 39% 44% 30% 33% 33% 36% 31% 11%
eWallets 35% 30% 39% 40% 32% 32% 39% 24% 29% 30%
Gift cards/vouchers 33% 28% 37% 42% 25% 34% 27% 29% 31% 24%
Third-party 32% 29% 34% 42% 27% 30% 17% 31% 27% 13%
% Revenue is eCommerce
Industry
Total <50% >51% Goods/Retail Digital
Restau-rants/QSR*
Services Tele-com*
NET: Travel/
Transport/Entertain*
Other*
Cards 45% 45% 45% 56% 30% 33% 50% 60% 49% 35%
Bank transfers/cash 27% 30% 25% 35% 20% 20% 50% 26% 15% 57%
Digital wallets 21% 20% 26% 30% 20% 31% 18% 20% 20% 10%
mCommerce 20% 20% 20% 25% 15% 30% 8% 15% 20% 10%
eWallets 20% 15% 25% 25% 20% 25% 20% 14% 15% 15%
Gift cards/vouchers 15% 10% 15% 20% 10% 20% 6% 10% 12% 3%
Third-party 15% 15% 15% 28% 10% 30% 6% 14% 15% 10%
% Revenue is eCommerce
Industry
20Global Payments Study Report 2020Cybersource

Appendix
eCommerce acceptance rates by region and vertical market
Mean Acceptance Rates:
Median Acceptance Rates:
% Revenue is eCommerce
Industry
Industry
Total N/A LATAM EU APAC Up to $50M
$51-$500M
$501M+
Cards 50% 75% 50% 60% 38% 50% 50% 60%
Bank transfers/cash 30% 33% 20% 30% 25% 30% 22% 30%
Digital wallets 25% 32% 20% 30% 20% 20% 30% 25%
mCommerce 20% 20% 18% 27% 13% 16% 20% 22%
eWallets 20% 20% 15% 25% 20% 15% 20% 20%
Gift cards/vouchers 10% 18% 10% 20% 10% 10% 10% 10%
Third-party 10% 20% 10% 15% 15% 10% 10% 20%
Region Revenue Size
Total N/A LATAM EU APAC Up to $50M
$51-$500M $501M+
Cards 53% 61% 50% 57% 45% 53% 51% 55%
Bank transfers/cash 44% 50% 38% 46% 42% 47% 41% 45%
Digital wallets 40% 46% 31% 46% 36% 36% 41% 44%
mCommerce 36% 41% 28% 41% 34% 32% 35% 43%
eWallets 36% 40% 27% 42% 34% 33% 35% 41%
Gift cards/vouchers 32% 43% 19% 40% 26% 29% 30% 39%
Third-party 30% 35% 16% 35% 32% 26% 28% 39%
Region Revenue Size
21Global Payments Study Report 2020Cybersource

Appendix
eCommerce acceptance rates by industry and revenue category
Mean Acceptance Rates:
Median Acceptance Rates:
Total <50% >51% Goods/Retail Digital
Restau-rants/QSR*
Services Tele-com*
NET: Travel/
Transport/Entertain*
Other*
Cards 53% 51% 54% 58% 45% 51% 58% 56% 49% 43%
Bank transfers/cash 44% 44% 43% 48% 37% 43% 60% 38% 39% 55%
Digital wallets 40% 38% 41% 45% 37% 40% 37% 29% 35% 11%
mCommerce 36% 34% 38% 40% 34% 36% 35% 30% 32% 18%
eWallets 36% 32% 38% 41% 33% 36% 37% 22% 29% 24%
Gift cards/vouchers 32% 29% 34% 41% 25% 32% 26% 25% 31% 11%
Third-party 30% 27% 33% 37% 27% 30% 27% 21% 27% 16%
% Revenue is eCommerce
Industry
Total <50% >51% Goods/Retail Digital
Restau-rants/QSR*
Services Tele-com*
NET: Travel/
Transport/Entertain*
Other*
Cards 50% 50% 56% 70% 40% 48% 70% 60% 50% 35%
Bank transfers/cash 30% 30% 25% 30% 20% 34% 90% 22% 25% 52%
Digital wallets 25% 20% 25% 30% 22% 33% 20% 15% 20% 5%
mCommerce 20% 20% 20% 20% 15% 29% 10% 20% 20% 18%
eWallets 20% 20% 20% 20% 18% 30% 20% 10% 20% 10%
Gift cards/vouchers 10% 10% 10% 15% 10% 20% 5% 10% 10% 3%
Third-party 10% 10% 15% 20% 10% 20% 10% 10% 12% 5%
% Revenue is eCommerce Industry
22Global Payments Study Report 2020Cybersource
We helped kick start the eCommerce revolution in 1994 and haven’t looked back since. Through global reach, modern capabilities, and commerce insights, we create flexible, creative commerce solutions for everyday life—experiences that delight your customers and spur growth globally. All through the ease and simplicity of one digital platform to manage all your payment types, fraud strategies, and more. Knowing we are part of Visa and their security-obsessed standards, you can trust that your business is well taken care of—wherever it may go.
For more information, please visit cybersource.com
Flexible Commerce Solutions
Payment security Unified commerce payment solutions
Payment acceptance Risk and fraud management
23Global Payments Study Report 2020Cybersource