Embed Size (px)
Citation preview

See important disclosures, including any required research certifications, beginning on page 73
■ What's new Since September 2012 the government has introduced four key reforms (that aim to address the issues of fuel availability and the weak financials of the state utilities) in an effort to revive the power sector. While it will take time to assess the full implications, it is clear that the early beneficiaries of the reforms will be the asset owners. However, the resolution of the more complex issues faced by the independent power producers (IPP) remains a work in progress, with an uncertain timeline. ■ What's the impact As a result of the ongoing reform process, dispatches from Coal India (CIL) rose by 8% YoY for 9M FY13 (following flat growth over FY10-12), environment and forest approvals have been expedited, and a consensus has been reached between CIL and the power utilities on the signing of fuel-supply agreements (FSA) on the guaranteed levels of coal supplies to power plants. Meanwhile, the improving financial situation at the state utilities as a result of regular tariff hikes, the ability of most state regulators to
pass on fuel and power purchase costs in the form of higher tariffs, and the government’s approval of a restructuring plan, should help resolve the key hurdles faced by the power sector in terms of fuel supply and receivables. In our view, the early beneficiaries of these reforms will be NTPC and CIL. For the IPPs, each asset has a different business model, and each faces issues either with domestic coal availability or the high costs of imported coal that cannot be passed through in tariffs. Until it becomes clear that these areas will be reformed, we are less sanguine on the outlook for the IPPs, such as Adani Power and Reliance Power. The power sector has been a key driver of order flow to the capital goods companies in the past. However, given the cyclical and structural issues faced by the sector at present, we see limited orders from the power sector at this time. With orders under the 12th Five Year Plan (FYP) complete and domestic power-equipment manufacturing capacity due to increase from 10GW in FY08 to 33GW by FY14, we expect competition to remain intense over FY14-15. We forecast annual orders of only 10-12GW over the period, and so are not yet buyers of Bharat Heavy Electricals (BHEL). We expect an upturn in the capex cycle this time to be led by new drivers – such as: 1) surface transport (railways, the dedicated freight corridor [DFC], and the
development of metro lines), 2) the New Urea Investment Policy, which could drive 10m tpa/INR400bn of capex in the fertiliser segment – which are benefitting from positive government policy changes. Well-diversified players such as Larsen & Toubro (L&T) should benefit from a revival in the capex cycle. ■ What we recommend We are upgrading our rating for NTPC to Buy (1) from Outperform (2) as the current FY14E PBR of 1.4x (an eight-year low) looks attractive. CIL is our top pick given the recent share-price underperformance on the back of various concerns, which we believe are overstated. We also upgrade L&T to Buy from Outperform (2) as, following the share-price drop of 8% over the past three months, the stock is trading at a 30% discount to its average PER over the past seven years.
18 March 2013
Cutting through the noise
• Initial reforms in the power sector should benefit asset owners first; resolution of issues faced by private utilities will take time
• Power-equipment players likely to see few orders for next two years; investment cycle should be led by new drivers
• Our top picks: NTPC, Coal India, and L&T, as they should be the early beneficiaries of reforms and a revival in the capex cycle
India Power Utilities & Capital Goods Sectors
Key stock calls
Source: Daiwa forecasts.
Industrials and Utilities / India
Saurabh Mehta(91) 22 6622 1009
New Prev.Coal India (COAL IN)Rating Buy BuyTarget 423.00 423.00Upside 32.2%
NTPC (NTPC IN)Rating Buy OutperformTarget 178.00 178.00Upside 22%
Larsen & Toubro (LT IN)Rating Buy OutperformTarget 1,830.00 1,780.00Upside 21.5%
Bharat Heavy Electricals (BHEL IN)Rating Underperform UnderperformTarget 184.00 192.00Downside 7.1%
India Power Utilities & Capital Goods Sectors 18 March 2013
- 2 -
Source: Daiwa forecasts
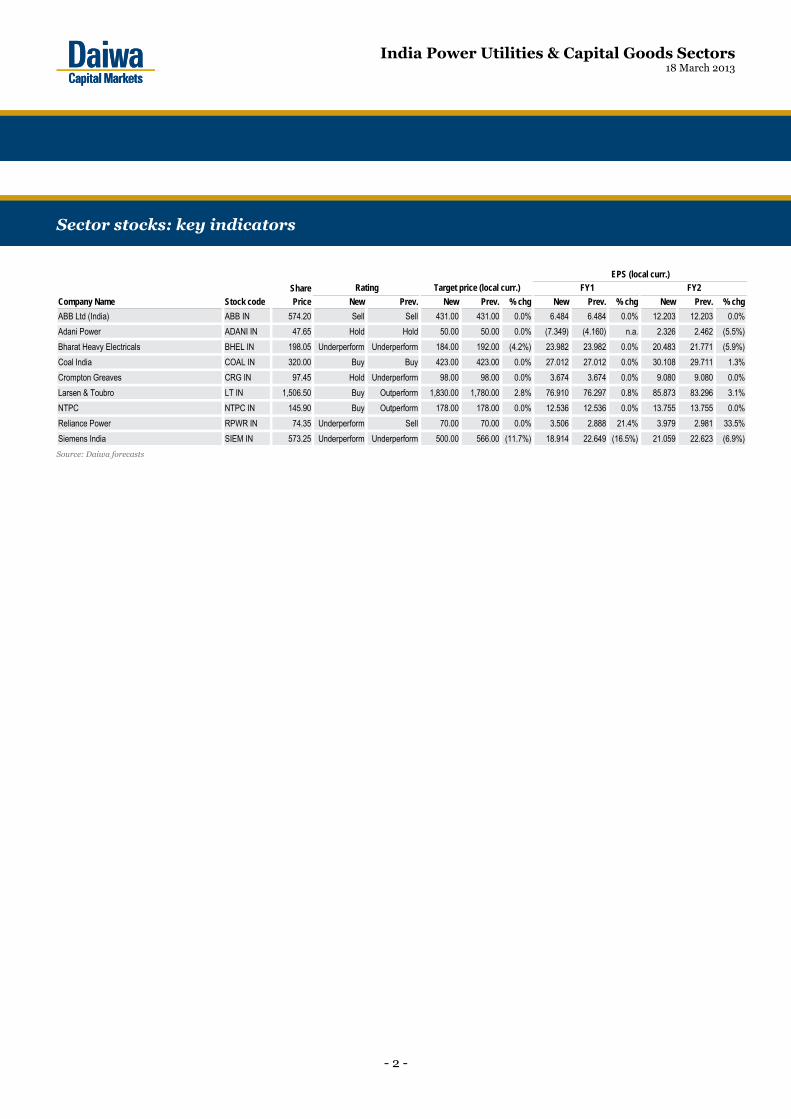
Sector stocks: key indicators
Share
Company Name Stock code Price New Prev. New Prev. % chg New Prev. % chg New Prev. % chg
ABB Ltd (India) ABB IN 574.20 Sell Sell 431.00 431.00 0.0% 6.484 6.484 0.0% 12.203 12.203 0.0%
Adani Power ADANI IN 47.65 Hold Hold 50.00 50.00 0.0% (7.349) (4.160) n.a. 2.326 2.462 (5.5%)
Bharat Heavy Electricals BHEL IN 198.05 Underperform Underperform 184.00 192.00 (4.2%) 23.982 23.982 0.0% 20.483 21.771 (5.9%)
Coal India COAL IN 320.00 Buy Buy 423.00 423.00 0.0% 27.012 27.012 0.0% 30.108 29.711 1.3%
Crompton Greaves CRG IN 97.45 Hold Underperform 98.00 98.00 0.0% 3.674 3.674 0.0% 9.080 9.080 0.0%
Larsen & Toubro LT IN 1,506.50 Buy Outperform 1,830.00 1,780.00 2.8% 76.910 76.297 0.8% 85.873 83.296 3.1%
NTPC NTPC IN 145.90 Buy Outperform 178.00 178.00 0.0% 12.536 12.536 0.0% 13.755 13.755 0.0%
Reliance Power RPWR IN 74.35 Underperform Sell 70.00 70.00 0.0% 3.506 2.888 21.4% 3.979 2.981 33.5%
Siemens India SIEM IN 573.25 Underperform Underperform 500.00 566.00 (11.7%) 18.914 22.649 (16.5%) 21.059 22.623 (6.9%)
Rating Target price (local curr.) FY1
EPS (local curr.)
FY2

India Power Utilities & Capital Goods Sectors 18 March 2013
- 3 -
Cutting through the noise ........................................................................................................... 4
Executive summary .................................................................................................................. 4
Top picks .................................................................................................................................. 6
Least preferred .......................................................................................................................... 7
Partial reforms in 2003 have put power sector in the current difficult situation .................. 9
Reforms to address the fuel shortage ..................................................................................... 10
Reforms to address the weak financials of the SEBs .............................................................. 12
Difficult measures still in progress, with limited clarity on timeline ..................................... 13
Capital goods sector is highly dependent on the power sector for orders ............................. 16
Upturn in investment cycle should be led by new drivers ..................................................... 19
Company Section
Coal India ............................................................................................................................... 29
NTPC ...................................................................................................................................... 32
Larsen & Toubro ..................................................................................................................... 37
Bharat Heavy Electricals ........................................................................................................ 42
Crompton Greaves .................................................................................................................. 47
Adani Power ............................................................................................................................ 52
Reliance Power ........................................................................................................................ 57
Siemens India .......................................................................................................................... 61
ABB Ltd (India) ...................................................................................................................... 66
Contents

India Power Utilities & Capital Goods Sectors 18 March 2013
- 4 -
Cutting through the noise
Reforms have been implemented to resolve the issues in the power sector, but many are still pending, and have uncertain timelines.
Executive summary
Asset owners should benefit first Recent reforms. Over the past six months, the government has taken unprecedented steps to tackle some of the key hurdles faced by the power sector: Fuel supply: 1) introduced initiatives to boost coal volume, which resulted in the supply of coal from CIL rising by 8% YoY for 9M FY13 (following flat growth over FY10-12), and 2) expedited environment and forest approvals, and 3) pushed CIL to sign FSAs with power producers, which should see the guaranteed supply of coal to power plants at 65% for FY13, with this increasing to 80% for FY17. Improving the financial position of the state utilities: 1) the government initiated a financial restructuring plan (FRP) for the state electricity boards (SEB), which involves the restructuring of short-term debt, along with a plan to improve the SEBs’ operational performance, 2) it is encouraging the states to implement regular tariff hikes; since April 2012, 26 states have raised tariffs, and 3) fuel power purchase cost adjustment (FPPCA) mechanisms for tariffs have been introduced by most state regulators, removing the time lag between increases in power purchase and fuel costs and passing the rises through to end users. In our opinion, early beneficiaries of these reforms will be NTPC and CIL, which remain our preferred picks. Many reforms still pending. Despite the issues addressed so far, resolution of the more complex issues faced by the IPPs, such as coal pooling, the revision of tariffs under unviable power-purchasing agreements (PPAs), and the finalisation of standard bidding documents (SBDs), are at various stages of discussion.
For the IPPs, each asset has a different business model, and each faces issues either with domestic coal availability or the high costs of imported coal that cannot be passed through in tariffs. Until it becomes clear that these areas will be reformed, we are less sanguine on the outlook for the private utilities, such as Adani Power and Reliance Power. We see a limited recovery in power-equipment orders Equipment manufacturers. The power sector has been a key driver of India’s capex cycle in the past. However, given the cyclical and structural issues faced by the sector at present, we see limited orders for it at this time. With orders under the 12th FYP complete and a likely increase in domestic power-equipment manufacturing capacity from 10GW in FY08 to 33GW by FY14, we expect competition to remain intense over FY14-15, and forecast annual orders to be only 10-12GW over the period, and so are not yet buyers of BHEL. Early signs of a capex recovery Industrial capex has been affected by the challenging domestic macroeconomic environment. However, recent policy measures taken by the government to revive the investment cycle, such as: 1) encouraging and enabling large cash-rich public-sector utilities (PSUs) to go ahead with planned investments, 2) the setting up of the Cabinet Committee on Investment (CCI) to expedite big infrastructure projects of more than INR10bn, and 3) setting an investment allowance of 15% for capex of more than INR1bn (announced in the recent budget) – together with signs of interest rates peaking (the Reserve Bank of India cut the repo rate by 25bps in January 2013) –provide the environment for a recovery in capex. Our economist, forecasts a further 75bp rate cut for this year. New drivers of capex We expect capex to be driven by new drivers, such as: 1) surface transportation (there is a several-fold increase planned in railway capex in the 12th FYP, DFC, and the planned development of metro lines), and 2) the government’s New Urea Investment Policy (10m tpa/INR400bn of capex in the fertiliser segment) Overall, we expect the capex cycle to pick up over the next 6-12 months, starting with spending by the PSUs, later followed by a revival in capex in the private sector. L&T looks best-positioned to benefit from the upturn in the capex cycles of the railways, fertiliser, and infrastructure sectors.

India Power Utilities & Capital Goods Sectors 18 March 2013
- 5 -
India industrials and utilities: valuation matrix PER (x) EV/EBITDA (x) PBR (x) ROE (%)
Company Share price (INR) Target price (INR) Rating FY14E FY15E FY14E FY15E FY14E FY15E FY14E FY15E Industrials Larsen & Toubro 1,507 1,830 Buy 17.5 15.7 11.8 10.6 2.8 2.4 17.0 16.6 BHEL 198 184 Underperform 9.7 10.4 5.2 5.4 1.5 1.4 16.2 13.8 Crompton Greaves 97 98 Hold 10.7 9.1 6.0 5.0 1.5 1.3 14.7 15.4 Siemens 573 500 Underperform 27.2 21.3 15.2 11.4 4.1 3.6 15.7 17.8 ABB India 574 431 Sell 47.1 33.3 26.2 19.4 4.3 3.8 9.5 12.2 Utilities NTPC 146 178 Buy 10.6 9.8 8.7 7.9 1.4 1.3 13.7 13.6 Adani Power 48 50 Hold 20.5 8.7 9.3 6.3 2.1 1.7 10.9 21.7 Reliance Power 74 70 Underperform 18.7 14.4 20.7 14.3 1.1 1.0 5.8 7.1 Coal India 320 423 Buy 10.6 9.6 6.5 5.4 3.6 3.0 36.8 34.3
Source: Bloomberg, Daiwa forecasts
Note: Share prices as at 15 March 2013
India industrials and utilities: share-price performance
3M average traded Absolute performance (%) Relative performance (%) Mkt. cap (USDm) volume (USDm) 1 month 3 months 6 months 1 year 1 month 3 months 6 months 1 year
Industrials Larsen & Toubro 17,185 47 4 (8) 1 11 5 (9) (4) 1 BHEL 8,976 15 (3) (12) (3) (30) (3) (13) (9) (40) Crompton Greaves 1,159 6 (1) (13) (9) (33) (0) (13) (14) (43) Siemens 3,779 2 1 (16) (15) (29) 1 (16) (20) (38) ABB India 2,256 1 (5) (18) (23) (34) (5) (18) (28) (43) BSE Capital Goods 0 (11) (3) (7) 0 (11) (8) Utilities NTPC 22,284 19 (3) (4) (13) (19) (2) (5) (18) (29) Adani Power 2,107 4 (8) (23) 10 (37) (8) (23) 5 (47) Reliance Power 3,870 12 (5) (26) (9) (44) (5) (26) (14) (54) BSE Power (3) (10) (6) (22) (3) (10) (11) (32) Coal India 37,427 14 (9) (10) (16) (6) (8) (10) (22) (16) SENSEX (0) 1 5 10 - - - -
Source: Bloomberg, Daiwa
Note: Share prices as at 15 March 2013
India industrials and utilities: PER/PBR
PER (x) PBR (x) Company Min Max Average 1-year-forward Min Max Average 1-year-forward Industrials Larsen & Toubro 11.8 54.7 24.1 16.4 2.0 12.1 4.7 2.6 BHEL 8.6 44.9 18.5 9.7 1.5 11.2 4.8 1.5 Crompton Greaves 5.1 51.0 20.8 10.7 1.5 9.5 4.3 1.5 Siemens 9.2 68.0 34.1 25.0 2.0 15.2 7.6 3.7 ABB India 18.8 258.4 72.0 43.7 3.1 16.9 7.4 4.2 Utilities NTPC 10.9 27.4 16.1 11.0 1.4 4.0 2.2 1.4 Adani Power* - - 24.3 37.2 1.9 5.0 3.6 2.3 Reliance Power* 20.0 236.8 54.8 20.0 1.1 4.7 2.1 1.1 Coal India* 10.5 16.8 13.3 10.5 3.6 6.1 4.8 3.6
Source: Bloomberg, Daiwa
Note: *Since listing, others since March 2005

India Power Utilities & Capital Goods Sectors 18 March 2013
- 6 -
Top picks
NTPC
• An early beneficiary of the reforms, NTPC saw coal availability from CIL improve by a significant 16.4% YoY for 9M FY13. In addition, the recent announcement of FRP for SEBs and regular tariff hikes by most of the SEBs over the past year should reduce the risk of delays in receivables.
• We believe NTPC will benefit from the Central Electricity Regulatory Commission’s (CERC) new tariff regulations for 2014-19, which should be finalised soon. Against the backdrop of a shortage of domestic coal availability and the weak financial positions of the SEBs, we expect the regulator to cut the levels of plant availability above which incentives are available (from 85% to 80% or lower to offset the impact of reduced coal availability).
• In addition, unlike under the 10th and 11th FYP Plans, when NTPC missed its capacity-addition targets by 2.2GW and 12.8GW, respectively, for the 12th FYP, its capacity-addition target of 14GW appears achievable, as capacity additions are front-end loaded (7GW over FY13-14).
• Trading currently at an FY14E PBR of 1.4x, an 8-year low, the stock looks attractive. On the back of the 13% fall in the share price over the past six months, we are upgrading our rating to Buy (1) from Outperform (2).
NTPC: one-year forward PBR
Source: Bloomberg, Company, Daiwa forecasts
Coal India
• CIL has also benefited from the recent reforms. The strong push by the government to boost volumes and initiatives put in place by the new chairman resulted in the company’s dispatch volume rising by 7.3% YoY for 11M FY13.
• With recent cost pressures relating to the hike in diesel costs (~INR14.4bn) and wages for contract workers (~INR2.5-3bn), coupled with the expectation of an improvement in the SEBs’ financials (recent tariff hikes and restructuring plan), we believe a price hike is in the offing over the next 3-4 months (there has been no price increase for the power sector for the past three years despite the wage settlement in January 2012).
• Despite being a direct beneficiary of the reforms and having high earnings visibility (with 80% of its sales at notified prices), CIL’s share price has underperformed the SENSEX by 22% over the past six months. We believe this is unjustified and therefore reiterate our Buy (1) rating.
CIL: one-year forward PER
Source: Bloomberg, Company, Daiwa forecasts
Larsen & Toubro
• In the current weak macroeconomic environment, we prefer diversified capital goods players, such as L&T, which would be a primary beneficiary of the likely revival in industrial capex.
• The company appears to us to be best-positioned to capitalise on the upturn in the capex cycle, and we forecast it to see INR893bn worth of new orders in FY14 (up 15% YoY), driven by the railways, power, and oil and gas sectors. Further orders could come from the fertiliser sector, which is benefiting from positive government policy changes. Investment in railways, for example, is set to accelerate, driven by the new DFC and metro rail line opportunities in a number of cities. Also, increased local sourcing in defence contracts could be the next demand driver.
• With the share price having fallen by 8% over the past three months, we upgrade our rating on L&T to Buy (1) from Outperform (2), and raise our SOTP-based six-month target price to INR1,830 (from INR1,780).
1.0
1.5
2.0
2.5
3.0
3.5
4.0
Mar
-05
Sep-
05
Mar
-06
Sep-
06
Mar
-07
Sep-
07
Mar
-08
Sep-
08
Mar
-09
Sep-
09
Mar
-10
Sep-
10
Mar
-11
Sep-
11
Mar
-12
Sep-
12
Mar
-13
2.7x Avg+1SD
1.7x Avg-1SD
2.2x Avg
(PBR)
10
11
12
13
14
15
16
17
18
Dec-
10
Mar
-11
Jun-
11
Sep-
11
Dec-
11
Mar
-12
Jun-
12
Sep-
12
Dec-
12
Mar
-13
14.8x Avg.+ 1 S.D
13.3x Avg.
11.8x Avg -1 S.D.
(PBR)

India Power Utilities & Capital Goods Sectors 18 March 2013
- 7 -
L&T: one-year forward PER
Source: Bloomberg, Company, Daiwa forecasts
Least preferred
Bharat Heavy Electricals
• With the power sector facing structural headwinds, we see a limited order pipeline for BHEL (15GW over the next 12-18 months, from state and central utilities), and expect the competition from domestic suppliers to increase, given that domestic capacity is expected to increase from 10GW in FY08 to 33GW by FY14. A revival in orders from the private sector will take time and depend on the resolution of the issues relating to fuel availability and environmental approvals, and current projects under execution turning profitable.
• In addition, BHEL’s current order backlog of INR1,137bn (down by 22% YoY for 3Q FY13), includes orders (about 12GW) placed by relatively inexperienced private players, and so could face execution delays, or cancellation, given the abovementioned headwinds.
• Further, these structural issues (such as execution delays) have started to be reflected in BHEL’s performance (3Q FY13 revenue fell by 5% YoY and the EBITDA margin dropped by 3.38pp YoY). Also, we expect the EBITDA margin to remain under pressure, due to a decline in the ASPs of recent orders, a rise in fixed costs due to the high level of installed capacity (20GW), and reduced advances due to a fall in order inflows, leading to an increase in the working-capital requirement.
• As a result we maintain our Underperform (4) rating on BHEL.
BHEL: one-year forward PER
Source: Bloomberg, Company, Daiwa forecasts
0
10
20
30
40
50
60
Mar
-05
Sep-
05
Mar
-06
Sep-
06
Mar
-07
Sep-
07
Mar
-08
Sep-
08
Mar
-09
Sep-
09
Mar
-10
Sep-
10
Mar
-11
Sep-
11
Mar
-12
Sep-
12
Mar
13
31.7x Avg+1S.D.
16.5x Avg-1S.D.
24.1x Avg
(PBR)
05
101520253035404550
Mar
-05
Sep-
05
Mar
-06
Sep-
06
Mar
-07
Sep-
07
Mar
-08
Sep-
08
Mar
-09
Sep-
09
Mar
-10
Sep-
10
Mar
-11
Sep-
11
Mar
-12
Sep-
12
Mar
-13
25.5x Avg+1S.D.
18.5x Avg
11.5x Avg-1S.D.
(PBR)

India Power Utilities & Capital Goods Sectors 18 March 2013
- 8 -
India Power Sector: summary of reforms Reforms Steps taken/details of the scheme Impact /hurdles Companies to watch Measures already implemented
Increase supply from CIL
Strong push from the government, greater rake availability, faster environmental approvals, new Resettlement & Rehabilitation (R&R) policy.
Increases in CIL's production and dispatch volumes of 5.8% and 8.0%, respectively, for 9M FY13.
CIL, power companies with Letters of Assurance (LOA)/FSAs with CIL, NTPC a key beneficiary with 16% growth in coal supply for 9M FY13.
Expedite environmental and forest approvals
Scrapping of the no-go area concept; guidelines for environmental clearance (EC) for up to 25% one-time capacity expansion of an existing project.
Coal mines with about 600m tpa were segregated into no-go areas; one-time capacity expansion of up to 25% should aid CIL in increasing volume by 45m tpa.
CIL, all power companies, Reliance Power, Essar, JPVL
FSAs with CIL Presidential directive given to CIL to sign FSAs with 66GW of capacity between FY10 and FY17.
By the end of February, 55 power plants with a capacity of 21.7GW had signed FSAs with CIL. NTPC has still not signed an FSA with CIL.
Power companies with LOA from CIL, NTPC, Lanco, India bulls, Adani, JPVL, Reliance Power
Improve the financial health of the SEBs by way of:
a) Initiating a FRP for the SEBs
Restructuring of short-term debt, along with a plan to improve SEBs’ operational performance.
Improvement in SEBs’ balance sheets and liquidity positions - improve working-capital cycle across value chain, boost transmission & distribution (T&D) spending and revive short-term power demand Improvements in SEBs’ financials will benefit the
whole value chain – power-generation companies, T&D companies
b) Regulating tariff hikes
Since April 2012, 26 states have raised tariffs (all seven loss-making states have raised tariffs).
Regular tariff increases will reduce the gap between the cost of purchase of power and the cost of supply.
c) Introducing the FPPCA
Most states have implemented the pass-through of power and fuel costs in their tariff orders.
Removes the time lag between increase in power purchase and fuel costs, and pass through to end users, helping improve liquidity
Measures that are in the process of being implemented
Coal pooling Plugging the domestic coal shortfall with imports, and averaging prices to all consumers.
Main hurdles: 1) differences between Ministry of Coal (MOC) and Ministry of Power (MOP) on inclusion of pre-2009 FSAs, 2) resistance by SEBs.
For CIL, revenue-neutral, positive for power companies that have FSAs with CIL - Lanco, Indiabulls, Adani, JPVL, Reliance Power, negative for NTPC.
Revision of non-viable PPAs
Power companies with sales under Case I/II bids using imported coal, without a complete/partial pass-through are looking for tariff revisions, post a change in Indonesian law.
CERC is currently hearing Adani Power’s and Tata Power's cases. We believe both cases are weak; also favourable decision for any side would prompt other side to go to higher court; could lead to prolonged litigation.
Adani Power, Tata Power, Reliance Power, JSW Energy
Finalisation of SBDs Removes the risk of fuel-price rises from the project. Consensus on new norms by all stakeholders
Positive for power sector, more beneficial for companies with open capacity with no certain fuel source.
Implementing the FRP for the SEBs
50% of short-term debt has to be taken up by the state government and the other 50% has to be restructured.
Getting all seven loss-making states on board, given state governments are seeing limited support from the central government in the scheme.
Improvement in SEBs’ financials will benefit the whole value chain - power generation companies, T&D companies
Source: Daiwa
India Industrials Sector: summary of outlook for different sub-sectors Sector Ordering opportunity Key drivers Key hurdles Companies to watch Power equipment
10-12GW from central and state utilities over FY13-14
Resolution of fuel shortage (both for coal and gas) and receivables situation.
Structural: fuel and receivables,; cyclical: ordering completed for 12th FYP. L&T and Thermax
Power T&D
Driven by PGCIL and investments by SEBs to reduce aggregate technical & commercial (AT&C) losses (INR1550bn capex for the 12th FYP)
Improvement in balance sheets of SEBs with recently announced FRP. Revival in industrial capex.
Weak financials of SEBs, delays in regular electricity tariff hikes.
Transmission line segment - L&T, Kalpataru, KEC Substation equipment - CRG, Siemens, ABB, and Alstom.
Railways
I) Railways
Indian Railways to more than double its 12th FYP spend (to INR5,192bn compared with INR1,921bn under the 11th FYP).
Very high unmet demand - passenger and freight, improved cash flows following the recent passenger and freight rate hikes.
Availability of funds has been a key issue, delays in decision-making.
Railway lines - L&T and KEC. Electrification - KEC, ABB, Siemens. Rolling stock - BHEL, Titagarh, Texmaco.
II) DFC
Total project cost of Eastern and Western corridor estimated at about INR958bn, near-term award could be about INR90bn
Growing congestion on existing lines and increasing demand for freight. Delays in order decisions.
L&T, KEC could be the biggest beneficiaries initially.
III) Metro Metro rail network in tier-2 cities (about INR1,300bn over 12th FYP).
State government to reduce traffic congestion and develop infrastructure. Slower pace of work at state governments
Civil works - L&T, KEC. Electrification - KEC, ABB, Siemens. Rolling stock: Alstom, Bombardier, Siemens.
Roads 3,000ks to be awarded by NHAI by 1H FY14 (according to Union budget).
Setting up of a road regulator, easier funding and reduced interest rates.
Delays in projects due to environment and land approvals. Issues in getting financial closure.
L&T, IRB, ITNL, GMR and GVK. Competition to decline due to highly leveraged balance sheets of the players.
Airports
Development of non-metro airports (INR149bn in the 12th FYP compared with INR70bn under the 11th FYP).
Steady increase in domestic and international passenger and cargo movements. Delays in approval of investment proposals L&T, GVK, and GMR
Fertiliser About 10mtpa of capacity addition could result in about INR400bn of capex.
Approval to implement New Urea Investment Policy, high dependence on imports, current capacity running at high utilisation rate.
Weak domestic gas-supply situation, lack of regasified liquefied natural gas (RLNG) infrastructure to import liquefied natural gas (LNG ). L&T, Engineers India, and Punj Lloyd.
Oil & Gas - Upstream
Sizeable opportunity remains with ONGC over next 2-3 years).
Planned capex by ONGC as the sole driver. About INR350bn of capex for FY14 according to the Union budget
High level of competition from foreign players, delays in orders. L&T, Punj Lloyd.
Oil & Gas - Downstream
Capacity addition under 12th FYP is over 90m tpa; the majority of that will be brown-field expansion.
Diesel deregulation to decrease under-recovery amounts and encourage capacity expansion plans. Uncertain regulatory environment. EPC – L&T, Punj Lloyd, and BHEL.
Steel 35m tonnes over the 12th FYP (INR1750bn order opportunity) largely back-end loaded.
Removal of mining bans in Karnataka, Goa, and Odisha. Environment, land approvals. ABB, Siemens, L&T, Thermax and BHEL.
Source: Daiwa

India Power Utilities & Capital Goods Sectors 18 March 2013
- 9 -
Partial reforms in 2003 have put power sector in the current difficult situation
The reforms initiated by the government in the power sector during the 10th and 11th Five Year Plans (mainly the liberalisation of electricity generation through The Electricity Act, 2003) resulted in a huge investment in generation capacity from the private sector (mostly for commissioning in the periods of the 11th and 12th Five Year Plans). India: planned power generation capacity additions
Source: BHEL, Planning Commission
FYP= Five Year Plan
India Power Sector: annual power capacity additions
Source: CEA, Daiwa forecasts
Further, most of the investment from the private sector was in thermal coal-based plants. A total of about 41GW coal-based capacity was commissioned in the 11th Five Year Plan and we forecast about 78GW of addition in the 12th Five Year Plan, ie over FY12-17.
India Power Sector: annual power capacity additions by fuel
Source: CEA, Daiwa forecasts
However: 1) there was no planning with respect to providing an adequate fuel supply for the large capacity additions and 2) investments in the transmission & distribution (T&D) sector did not keep pace with the investment in the power-generation sector. Hence, over the past 2-3 years the sector has been facing challenges in these areas. Coal demand-supply scenario Based on our current capacity addition forecast of about 78GW over the 12th Five Year Plan period, about 73GW (including projects that do not have fuel sources) will come from domestic coal. Once operational, we estimate this capacity would require an additional 343m tonnes (75% plant load factor [PLF] and a gross calorific value [GCV] of 3,500kcal/kg) of coal. In addition, we forecast about 5.5GW of projects relying on imported coal to be commissioned by FY17, which we estimate in turn would require an additional 22m tonnes (adjusted for imported coal quality to a GCV of 5,000kcal/kg). On the supply side we forecast total supply to increase by 228m tonnes by FY17 for the power sector, with most of this coming from CIL (128m tonnes) and allocated captive coal blocks (67m tonnes). Hence, based on our coal-based power capacity-addition forecasts, we expect the demand for non-coking (thermal) coal to increase by a 12.3% CAGR over the FY12-17 period (compared with our CAGR forecast for supply of 9.7%), resulting in a deficit of 186m tonnes in FY17.
2 4 7 9 12 20 22
31 40 41
79 89
1 2 5 5 10 14
21 16 19 21
55
92
0102030405060708090
100
1st F
YP
2nd
FYP
3rd
FYP
4th
FYP
5th
FYP
6th
FYP
7th
FYP
8th
FYP
9th
FYP
10th
FYP
11th
FYP
12th
FYP
Target Actual
(GW)
Significant increase in target andactual capacity addition in the 11th and the 12th FYP
7.2 2.8
9.2 11.3
20.2
15.9
26.2
21.9
16.3
11.9
0
5
10
15
20
25
30
FY08 FY09 FY10 FY11 FY12 FY13E FY14E FY15E FY16E FY17E
(GW)
4.91.6
6.59.7
18.113.2
20.3 19.014.6
10.81.00.2
2.20.7
0.7
1.7
1.8 0.6
1.0
0.01.3
1.0
0.40.9
1.4
1.0
4.02.4
0.7
1.0
0
5
10
15
20
25
30
FY08 FY09 FY10 FY11 FY12 FY13E FY14E FY15E FY16E FY17E
Coal Gas Hydro & Nuclear
(GW)

India Power Utilities & Capital Goods Sectors 18 March 2013
- 10 -
India Power Sector: coal demand supply scenario FY11 FY12 FY13E FY14E FY15E FY16E FY17E
Coal demand: CIL/SCCL linkage capacity 361 383 428 466 513 564 603Capacity on captive coal 22 24 31 48 69 80 86Capacity on imported coal 11 20 30 37 40 42 43Capacity on undecided source 4 9 11 18 30 39 48Total demand (A) 397 436 500 569 653 725 779Coal production: CIL 291 312 341 364 388 413 440SCCL 32 34 36 38 40 43 45Captive 17 22 25 43 52 70 89Imported 18 20 30 37 40 42 43Total production (B) 358 388 431 481 521 568 617Gap based on domestic quality (B-A) (39) (48) (68) (88) (132) (157) (162)Adj for imported quality (GCV 5000Kcal/Kg) (22) (27) (39) (50) (75) (90) (93)Total imports (apparent +forced) 40 48 69 87 116 131 135India DD:SS deficit 10% 11% 14% 15% 20% 22% 21%
Source: CEA, MOC, Daiwa forecasts
Reforms to address the fuel shortage
Increase in supply from Coal India Over FY10-12, CIL’s production was flat and dispatch growth was 2.1%, raising concerns amongst investors of CIL’s inability to ramp up its volumes. After a strong push by the government over the past year, CIL’s production and dispatch volumes have risen by 4.3% and 7.3%, respectively, up to February FY13. What has Coal India done? CIL’s R&R policy was revised in March 2012 to facilitate the faster acquisition of land for expansion/ new projects. It provided greater flexibility to the boards of subsidiary companies to determine the rehabilitation package best suited for local needs. It also raised the lump-sum land compensation level from INR0.2m/acre to INR0.5m/acre. This should speed up land acquisition, which has been a bottleneck. 2) Rake availability: better coordination with the railways ensured a significant improvement in the rake availability for 9M FY13, which was up 10.3% YoY. 3) Area-level monitoring: CIL introduced area-level monitoring from February 2012 and has made the individual mines accountable for not achieving output targets. 4) Environmental and forest approvals: regular discussions between the MOC, CIL, and the Secretary, Ministry of Environment and Forests (MOEF) now take place to expedite the approvals process.
CIL: YoY change in the dispatches volume
Source: Company
CIL: annual production volume
Source: Company
Expediting environmental and forest approvals A number of CIL’s projects were stuck over FY10-12 due to delays in land acquisition, the introduction of the no-go area concept by the MOEF and Comprehensive Environmental Pollution Index (CEPI), and general delays in environment and forest approvals. However, following a strong push by the government over the past year, the MOEF has given some leeway by doing away with the no-go areas and relaxing the CEPI, along with making other policy changes to support faster clearances:
• The granting of environmental clearance of up to 25% for one-time capacity expansion of existing projects. As one of the measures to resolve the short-term coal supply shortage, CIL had been seeking permission to produce 25% more capacity than was currently approved for 11 of its projects that had reached their capacity limits. Finally, in December 2012, the MOEF released guidelines for granting environmental clearance for one-time expansion of existing coal mining projects by up to 25% without the need for a public hearing.
• The scrapping of the no-go areas, forest clearance accorded to Mahan, Chhatrasal
8 3 3 6
(10)(13)
(8)
11
(3)
19
13
6 2
10 6 1 8
18 18
6 8
0 1
(15)
(10)
(5)
0
5
10
15
20
Apr-1
1
May
-11
Jun-
11
Jul-1
1
Aug-
11
Sep-
11
Oct
-11
Nov-
11
Dec-
11
Jan-
12
Feb-
12
Mar
-12
Apr-1
2
May
-12
Jun-
12
Jul-1
2
Aug-
12
Sep-
12
Oct
-12
Nov-
12
Dec-
12
Jan-
13
Feb-
13
(% )
Positive impact of Gover nment's policy measur es
High base effec t
Fall in volumes
100
200
300
400
500
600
700
FY04
FY05
FY06
FY07
FY08
FY09
FY10
FY11
FY12
FY13
E
FY14
E
FY15
E
FY16
E
FY17
E
No gr owth(m tonnes)
India Power Utilities & Capital Goods Sectors 18 March 2013
- 11 -
and Amelia North coal mine. These coal blocks were earlier part of the no-go areas; however the MOEF scrapped the no-go system, after which the Group of Ministers (GOM) approved forest clearance for these blocks, following which even MOEF gave forest approvals.
• Setting up an additional Forest Advisory Committee (FAC). At present, there is only one FAC to process forest clearance proposals in the country. To reduce the FAC’s burden of examining all applications in a timely manner, the MOEF wants to set up another FAC to recommend in-principle approval and address environmental and development issues for projects.
• Forest approvals now to be applied to entire lease areas. The MOEF has directed mine developers to apply for forest clearance for their entire lease areas, instead of seeking clearance for a smaller section of the lease area where actual mining is proposed to take place. The companies will only have to apply once to the MOEF for complete forest clearance, instead of seeking forest clearance again and again as production ramps up.
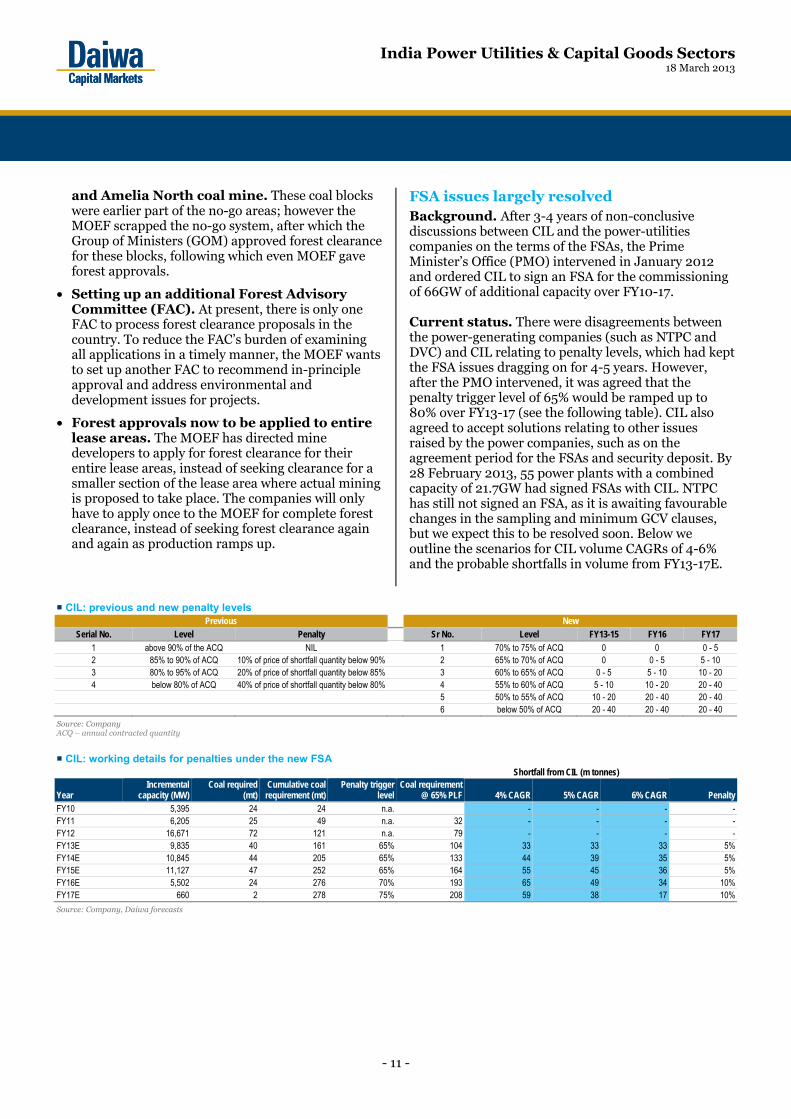
FSA issues largely resolved Background. After 3-4 years of non-conclusive discussions between CIL and the power-utilities companies on the terms of the FSAs, the Prime Minister’s Office (PMO) intervened in January 2012 and ordered CIL to sign an FSA for the commissioning of 66GW of additional capacity over FY10-17. Current status. There were disagreements between the power-generating companies (such as NTPC and DVC) and CIL relating to penalty levels, which had kept the FSA issues dragging on for 4-5 years. However, after the PMO intervened, it was agreed that the penalty trigger level of 65% would be ramped up to 80% over FY13-17 (see the following table). CIL also agreed to accept solutions relating to other issues raised by the power companies, such as on the agreement period for the FSAs and security deposit. By 28 February 2013, 55 power plants with a combined capacity of 21.7GW had signed FSAs with CIL. NTPC has still not signed an FSA, as it is awaiting favourable changes in the sampling and minimum GCV clauses, but we expect this to be resolved soon. Below we outline the scenarios for CIL volume CAGRs of 4-6% and the probable shortfalls in volume from FY13-17E.
CIL: previous and new penalty levels
Previous New Serial No. Level Penalty Sr No. Level FY13-15 FY16 FY17
1 above 90% of the ACQ NIL 1 70% to 75% of ACQ 0 0 0 - 5 2 85% to 90% of ACQ 10% of price of shortfall quantity below 90% 2 65% to 70% of ACQ 0 0 - 5 5 - 10 3 80% to 95% of ACQ 20% of price of shortfall quantity below 85% 3 60% to 65% of ACQ 0 - 5 5 - 10 10 - 20 4 below 80% of ACQ 40% of price of shortfall quantity below 80% 4 55% to 60% of ACQ 5 - 10 10 - 20 20 - 40
5 50% to 55% of ACQ 10 - 20 20 - 40 20 - 40 6 below 50% of ACQ 20 - 40 20 - 40 20 - 40
Source: Company ACQ – annual contracted quantity
CIL: working details for penalties under the new FSA
Shortfall from CIL (m tonnes)
Year Incremental
capacity (MW) Coal required
(mt) Cumulative coal requirement (mt)
Penalty trigger level
Coal requirement @ 65% PLF 4% CAGR 5% CAGR 6% CAGR Penalty
FY10 5,395 24 24 n.a. - - - -FY11 6,205 25 49 n.a. 32 - - - -FY12 16,671 72 121 n.a. 79 - - - -FY13E 9,835 40 161 65% 104 33 33 33 5%FY14E 10,845 44 205 65% 133 44 39 35 5%FY15E 11,127 47 252 65% 164 55 45 36 5%FY16E 5,502 24 276 70% 193 65 49 34 10%FY17E 660 2 278 75% 208 59 38 17 10%
Source: Company, Daiwa forecasts

India Power Utilities & Capital Goods Sectors 18 March 2013
- 12 -
Reforms to address the weak financials of the SEBs
India Cabinet approves SEB restructuring On 24 September 2012, India’s Cabinet Committee on Economic Affairs (CCEA) approved an FRP for the SEBs due to their weakening financial health, given the increase in their accumulated losses over the past few years. We believe the country’s power-distribution sector is in a similar state of flux to the power-generation sector before the Electricity Act 2003 was introduced. Even given the recent tariff hikes taken by 26 states over the past 11 months, an FRP is necessary for the SEBs with strict guidelines so that the sector does not end up in a similar situation again. Key benefits of the scheme
• SEBs’ balance sheets should improve, which would improve the long-term prospects for the power sector in terms of generation and T&D capex.
• The working-capital cycle will improve across the value chain, which has been a cause of concern among investors.
• Concerns about lenders’ non-performing assets (NPAs) will be addressed as part of the restructuring.
• Once their fundamentals have improved, the SEBs should be able to meet their short-term power demand deficits by buying at spot prices, thus reviving the merchant-power market.
Details of the scheme Some 50% of the SEBs’ short-term debt as at 31 March 2012 will be taken over by the state governments. This will first be converted into bonds issued by the SEBs to participating lenders (backed by the state governments). Some 2-5 years after that, the state governments will take over the debt from the SEBs in the form of special securities.
• The repayment of the principal amount and interest is to be undertaken by the state governments until they take over the debt from the SEBs.
• The remaining 50% is to be restructured as a short-term loan by rescheduling loans and providing a moratorium on the principal amount.
• The restructuring/rescheduling of the debt is to be accompanied by concrete and measurable action by the SEBs/states in order to improve the SEBs operating performance.
• Two committees are to be formed, one at the state and the other at the central level to monitor the turnaround plan.
• The central government is to provide incentives by way of: 1) a grant equal to the value of the additional energy saved if the SEBs cut their aggregate technical & commercial (AT&C) losses by more than that specified under the Restructured Accelerated Power Development and Reforms Programme, and 2) capital reimbursement of 25% of the principal repayment by the state governments on the debt taken over by the state governments.
• The following table shows how the state government securities will be issued to the SEBs over the FY13-17 period, as indicated by the MOP.
India Power Sector: Instalments of special securities to be issued by the state government of the 7 focus states to the SEBs
INRbn 50% of
short-term loans FY13 FY14 FY15 FY16 FY17Andhra Pradesh 32 22 9 - - -Haryana 70 25 25 20 - -Madhya Pradesh 6 1 5 - - -Punjab 58 9 10 11 13 15Rajasthan 199 26 35 40 45 52Tamil Nadu 96 9 25 29 33 -Uttar Pradesh 130 19 22 26 29 33Total 590 111 132 126 120 100
Source: Planning Commission
Constant pressure on the SEBs has resulted in tariff hikes Since April 2012, 26 states have raised tariffs (including the seven loss-making states). We do not believe these hikes will be sufficient to cover the SEBs’ losses. Nor do we believe they will help to entirely eliminate the estimated gap between revenue and cost, given the SEBs’ current cost structures. However, these tariff hikes should provide a breather for the India Power Sector overall, as well as for the lenders, with many states having raised tariffs twice over the past 1-2 years. We see this as a step in the right direction, building confidence among lenders, and encouraging them to support the SEBs’ financial turnaround.

India Power Utilities & Capital Goods Sectors 18 March 2013
- 13 -
Tariff hikes taken by the seven focus states
States Last tariff
hike Average tariff
hike (%) Previous tariff hike
Average tariff hike (%) Remarks
Andhra Pradesh Apr-12 20-25 Apr-11 n.a. Hikes in all categories except for domestic consumers using less than 50 units a month Haryana Apr-12 10-15 Jun-11 0.5 Average tariff hike of 10-15% across all consumer categories; agricultural consumers saw no increases Madhya Pradesh Apr-12 7.17 Jun-11 6.1 Average tariff hike of 7% across consumer categories, but no tariff rise for domestic consumers using less than 30 units a
month Punjab Apr-12 12.08 Apr-11 9.2 Hike across all consumer categories Rajasthan Aug-12 18 Apr-11 20.0 Tamil Nadu Apr-12 37.0 Aug-10 n.a. Hikes across all consumer categories after nine years; the August 2010 rise was only for specific consumers such as shops,
cinemas, and malls Uttar Pradesh Oct-12 17.63 Apr-10 13.0 No tariff hike for domestic and rural consumers; hike for heavy industries tariff of 30%, while for small and medium industries
18%. Commercial consumers saw a hike rise of 20%.
Source: Daiwa
Introduction of pass-through of fuel and power purchase costs Most states have implemented FPPCA, ie, the pass-through of power and fuel costs in their tariff orders. This is very positive development for SEBs given: 1) any increase in the cost of fuel is a pass-through for the generator through a fuel surcharge adjustment formula and is payable by the distribution licensees in the subsequent bills, 2) the power purchase cost being uncontrollable is passed through to consumers, but the difference in the actual cost of procurement of power and the estimated cost of the purchase of power gets adjusted by the regulator only after 2 years. The time lag of two years puts an additional burden on consumers by way of carrying cost. Extract from Delhi Electricity Regulatory Commission staff paper: mechanism and frequency of power purchases
Source: Delhi Electricity Regulatory Commission
Difficult measures still in progress, with limited clarity on timeline
Many other measures relating to the resolution of issues faced by the IPPs, like coal pooling, the revision of tariffs for unviable PPAs and the finalisation of bidding documents, are still a work in progress and there is little visibility as to when these issues might be resolved. This is particularly so as each asset of each private-sector developer has a different business model that faces issues of either domestic coal availability or higher costs of imported coal, which cannot be passed on to end users in the form of higher tariffs. Also, we believe many of these issues are difficult to resolve. Coal-pooling could resolve fuel-supply issues in the near term Background: The Ministry of Power (MOP) is working with the Central Electricity Authority (CEA) to come up with a plan to meet the near-term shortfall of domestic coal in the power sector through coal pooling. This scheme involves plugging the domestic coal shortfall with imports, and averaging prices to all consumers, thereby increasing the cost of domestic coal by 10-12%. Latest developments: On 5 February 2013, the CCEA gave ‘in-principle’ approval for the coal-pool-pricing mechanism through CIL, though the key modalities have yet to be finalised. Main hurdles: the main hurdles in the implementation of the pooling scheme would be: 1) Differences in opinion between the Ministry of Coal (MOC) and MOP on the inclusion of pre-2009 FSAs, 2) CIL wants coal pooling only on a trial basis for two years and then to review the system based on the feedback, and 3) Resistance from the SEBs.

India Power Utilities & Capital Goods Sectors 18 March 2013
- 14 -
The way forward: Our interactions with the Planning Commission, MOP and MOC indicate that coal pooling as suggested by the CEA, ie, including all pre-2009 FSAs, has not been accepted by the CCEA, mainly as the inclusion of pre-2009 FSAs would significantly affect the SEBs, which have weak financials. Going forward, MOP and MOC, in consultation with the Finance Ministry, will work on the mechanism of coal pooling, which we expect to happen after the second phase of the budget session of the Parliament (ie, after April-May). Our take: We believe coal price pooling for power customers (once it is agreed upon by all stakeholders), would remain difficult to implement both logistically and technically. 1) For CIL: we would expect it to be a revenue-neutral event for CIL. However, this could increase the intra-year volatility of CIL’s earnings when global coal prices see sharp movements, and CIL might not take simultaneous price hikes/cuts to its coal prices in the domestic market. 2) For the power producers: the primary beneficiaries of the mechanism would be the IPPs that have LOAs with CIL. IPPs that could gain from coal pooling Player Capacity (GW)Lanco 5.0Indiabulls 4.3Adani 2.6Jaiprakash Power 1.8RPWR 1.5CESC 1.5L&T 1.2GMR 1.1Tata Power 1.1KSK 0.5
Source: MOC
Finalising the standard bidding document Background. In order to resolve major issues related to the pass-through of fuel in power tariffs, the MOP published a standard bidding document (SBD) in February 2012. However, while making the changes to the document, the MOP changed the power-generation business model from a build-operate-own (BOO) to design-build-finance-operate-transfer (DBFOT), which none of the private companies, regulator or financial institutions agreed to. This is because the changes make the power-generation companies more inflexible with respect to: 1) plant design, 2) land control, 3) approvals required for each milestone achieved, and 4) the right to terminate a contract with the SEBs.
The way forward. As the IPPs have objected to many of the above-mentioned issues, the MOP has set up an advisory committee to look into the model document. Once the committee submits its recommendations to the MOP, it will submit its revised model PPA to the Cabinet for approval before the PPA is implemented. We expect the revised bidding documents to be finalised in the next 1-2 months. Our take. We believe that as the increase in fuel costs will now be passed on to end users when the bidding document becomes an agreement, IPPs’ expected returns on projects will also be much lower. Revising non-viable PPAs Background. Power companies that have previously participated in a competitive bidding process (Case I and Case II), where there was no complete or partial pass-through of any tariff hikes, have been looking for tariff hikes, following the changes in Indonesia’s coal regulations in September 2011, whereby the Indonesia Government ordered that the pricing of coal exports be benchmarked to global prices. Though the discussions between these power generators and the SEBs did not result in an amicable solution earlier, there was some confusion regarding the appropriate authority to go for arbitration. In August 2012, the Attorney General (AG) opined that the CERC could regulate and revise PPA tariffs irrespective of the contracts signed by power producers with the state distribution companies if it was with more than one state. Post the failed discussions with the SEBs, Tata Power’s plea to revise tariffs at the Mundra Ultra Mega Power Plant (UMPP) got a hearing with the CERC. The CERC had asked IPPs to initiate a consultation process with the state DISCOMs, and some IPPs (Tata Power, Adani) asked the state utilities to revise PPA tariffs upwards. The cash-strapped SEBs, which had entered into long term PPAs, have opposed such a revision. Latest updates. The CERC hearings are under way. During Tata Power’s recent post results conference call, management commented that a few hearings have been conducted by the CERC (starting in December 2012), but did not indicate any expected time frame for a verdict. Our take. We believe that as these projects were won through a competitive bidding process, both cases are on a weak footing; also, a decision on these PPAs going in the favour of any side would probably prompt the other side to go to a higher court to reverse the decision. Also, comparing Tata Power’s and Adani’s

India Power Utilities & Capital Goods Sectors 18 March 2013
- 15 -
case, Tata’s Mundra project was a Case II project which was set up on imported coal, while Adani’s Mundra project was a Case I bid, wherein the project developer is responsible for fuel. Other bidders who lost out in the competitive bids in the past for UMPPs and Case-I projects could oppose such a move and it could lead to prolonged litigation. These cases are being followed by the other IPPs, and any favourable decision to increase tariffs in the abovementioned cases would set a precedence for them to apply for tariff revisions. Finally, we believe that a solution to the above issue needs to be found if further investment in the power sector is to be encouraged. So we conclude that rather than a decision on the above case, the possible solution would be the regulator pushing both sides to come to a negotiated solution to the issue and decide what the possible tariff hike should be. What could go in favour of the project owner is that despite a tariff increase, these projects are significantly cheaper than some of the recent Case I bids (INR4-6/kWh), and with the implementation of FRP, the SEBs’ financials should improve and they would be encouraged to agree to a tariff increase. Implementing the SEB FRP
Approval of the SEB FRP in September 2012 is a positive for the power sector. However, there will be challenges getting the scheme up and running, and we have already seen an extension of the deadline to apply for restructuring from December 2012 to March 2013. Invariably, we might see a further extension given the following:
• According to the scheme, 50% of the short-term debt of the SEBs would have to be taken by the state governments, which will strain the latter’s financial position.
• With state governments seeing limited support from the central government in the scheme, many state governments have stated their reluctance to accept the scheme.
• Continued regular tariff hikes by states will require political will.
India: status of states on SEB FRP
State Agreed to FRP Loan from FIs/ Banks/
Bonds (INRbn for FY11) % of total loansAndhra Pradesh √ 299 10 Haryana √ 261 8 Madhya Pradesh x 162 5 Punjab x 169 5 Rajasthan √ 580 19 Tamil Nadu √ 251 8 Uttar Pradesh √ 325 10 Bihar √ 21 1 Jharkhand √ 8 0 Himachal Pradesh √ 37 1 Karnataka √ 182 6 States agreeing 1,965 63Total 2,297 73 All India 3,133 100
Source: PFC
Note: Highlighted text indicates the 7 major loss-making states

India Power Utilities & Capital Goods Sectors 18 March 2013
- 16 -
Capital goods sector is highly dependent on the power sector for orders
The capex cycle in India in the past has been driven by orders from the power sector. However, given the cyclical and structural issues faced by the power sector currently, we see limited orders being placed with the capital goods companies from there. Over FY08-12, the capital goods companies under our coverage saw both a drop in power sector orders as a percentage of total order inflows and a sharp decline in their order inflows from the power sector. Daiwa India Industrials: order inflow from the power sector (%)
FY08 FY09 FY10 FY11 FY12ABB 66 62 66 54 67CRG* 65 75 74 65 70Siemens 45 53 61 41 26BHEL* 84 82 76 82 64L&T 14 25 33 32 21% of power in total 52 56 54 52 35
Source: Company
Note: *for CRG/BHEL only domestic orders have been considered
Daiwa India Industrials: growth in total orders and orders from the power sector
Source: Company
Power: most ordering is already completed The Power Equipment Sector is facing cyclical and structural issues. In the 11th FYP (2007-12), there was a significant increase in capacity additions (from 21GW in the 10th FYP to 55GW in the 11th FYP); further, in the 12th FYP (2012-17) capacity additions are expected to increase to 89GW. However, ordering for India’s 12th FYP has already been completed, and at the same time, domestic power-equipment manufacturing capacity is expected to increase to 33GW by FY14 from 10GW in FY08. Also, the power sector is facing structural issues, such as coal availability and the SEBs’ still weak financials,
which will continue to pose a risk to the execution of current orders and a recovery in orders. India: targeted and actual power generation capacity additions
Source: BHEL, Planning Commission
FYP= Five Year Plan
India: China players’ market share up from 29% in the 11th Five Year Plan to 34% in the 12th Five Year Plan
Source: BHEL
India power equipment capacity by player
Source: Company, Daiwa
33
17 16 6
(28)
39
25 13
2
(52)(60)
(40)
(20)
0
20
40
60
FY08 FY09 FY10 FY11 FY12
Growth in total orders Growth in orders for power sector
(% )
2 4 7 9 12 20 22
31 40 41
79 89
1 2 5 5 10 14
21 16 19 21
55
92
0102030405060708090
100
1st F
YP
2nd
FYP
3rd
FYP
4th
FYP
5th
FYP
6th
FYP
7th
FYP
8th
FYP
9th
FYP
10th
FYP
11th
FYP
12th
FYP
Target Actual
(GW)
Significant increase in target andactual capacity addition in the 11th and the 12th FYP
49 41
29 34
22 25
0
20
40
60
80
100
11th plan 12th plan
BHEL Chinese Others
(% )
6 610 10 10
15 1520 20 20
4
4 4 42 4
23
0
5
10
15
20
25
30
35
FY05 FY06 FY07 FY08 FY09 FY10 FY11 FY12 FY13E FY14E
BHEL L&T BGR Energy GB-Ansaldo Thermax -B&W
(GW)
6 610 10 10
1519
2426
33

India Power Utilities & Capital Goods Sectors 18 March 2013
- 17 -
India power equipment capacity and orders placed
Source: Company, Daiwa
Recovery in ordering still a long way off. We believe that until all the issues in the power sector are resolved, notwithstanding implementation of various reforms and further various measures under way to resolve issues in the power sector, ordering from the sector will not recover. As the current capacities under execution need to be profitable for companies to gain confidence before investing further in projects, lenders need to have clarity on approvals and fuel security of future projects before they start lending again. We do not see orders from the IPPs recovering over the next two years (FY14-15), and expect annual ordering to remain at the 10-12GW level over the period from the state and central utilities (which are slow in awarding projects). Moreover, we forecast domestic capacity to reach 33GW by FY14, and competition to remain fierce, given that players such as Thermax have no orders and the likes of JSW-Toshiba have low utilisation rates. Near-term order opportunities. The opportunities are limited to new orders from the central and state utilities. For FY13-14, we expect the following orders to be awarded:
India: ordering opportunity over FY14
Project Configuration Total (MW)
Opportunity (INRbn) Remarks
Orders under award stage RVUNL, Suratgarh and Chabra 4x660MW 2640 108 BHEL is L1, L&T is L2Orissa - IB valley 2x660MW 1320 52.8 BHEL is L1, L&T is L2NTPC, Tanda 2x660MW 1320 52.8 L&T is L1
NTPC, Unchahhar 500MW 500 20 To be awarded to BHEL
on nomination basisTotal 5780 233.6
Orders under finalisation NTPC, Khargaon 2x660MW 1320 52.8 MPGENCO, Khandawa 2x660MW 1320 52.8 TANGEDCO, Ennore 1x660MW 660 26.4 TNEB, Udangudi 2x660MW 1320 52.8 MAHAGENCO, Nashik 1x660MW 660 26.4 MAHAGENCO, Bhusawal 1x800MW 800 32 NLC 2x500MW 1000 40 AP 3x500MW 1500 60
Total 8580 343.2
Source: Companies, Daiwa
Key drivers. Resolution to the fuel shortage (both for coal and gas). Finalisation of the bidding documents, and award for UMPPs. A further improvement in the SEBs’ financials would also drive equipment ordering. Key hurdles. Delays in environment and land approvals, and securing fuel in a supply constrained environment. Key players. Diversified players with less exposure to power, as well as limited capacity to fill, namely, L&T and Thermax. Power T&D Total spend potential in the 12th FYP for transmission is pegged at INR1,800bn against INR1,400bn in the 11th FYP. This will be largely led by the central transmission utility, Power Grid Corporation of India (PGCIL) (to contribute over 55% of the total spend). India: investment in the transmission sector
Source: Planning Commission
6 3
10
15 19 20 19
7 10
12
0
5
10
15
20
25
30
35
FY05
FY06
FY07
FY08
FY09
FY10
FY11
FY12
FY13
E
FY14
ETotal Orders placed Total India Capacity
(GW)
185550
1000253
650
550200
250
0
500
1,000
1,500
2,000
10th plan 11th plan 12th plan
Central State Private
(INRbn)
438 1,400 1,800
India Power Utilities & Capital Goods Sectors 18 March 2013
- 18 -
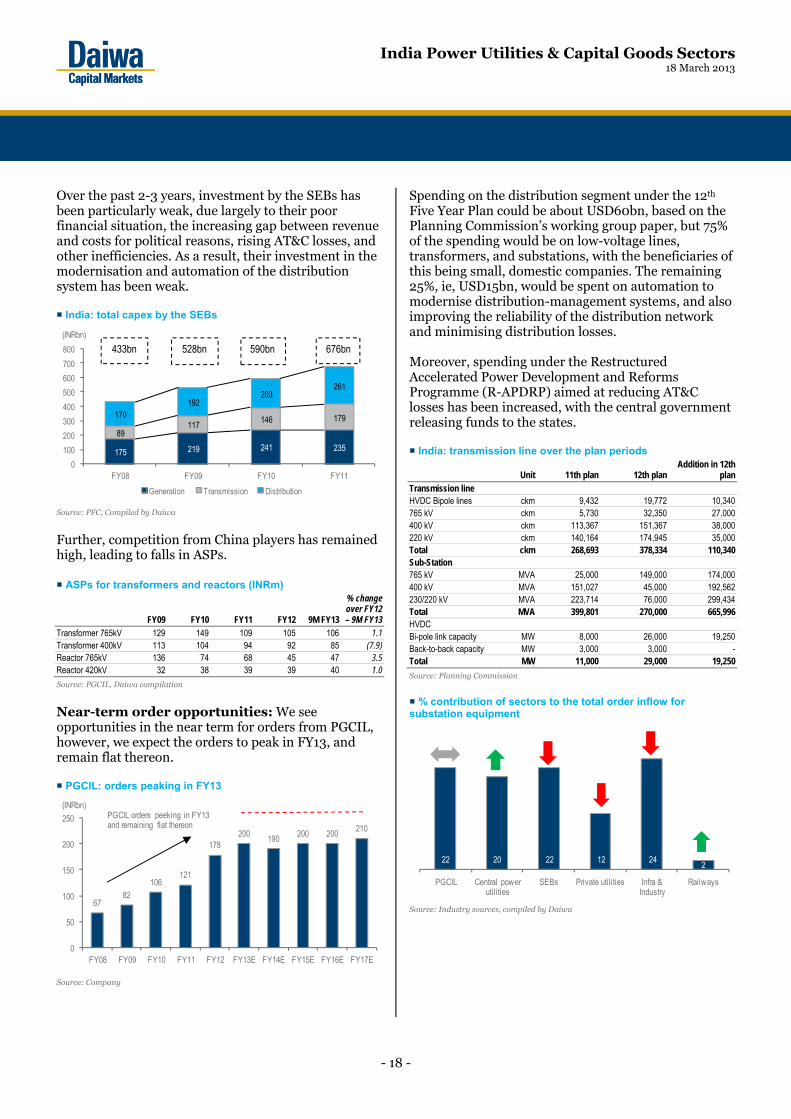
Over the past 2-3 years, investment by the SEBs has been particularly weak, due largely to their poor financial situation, the increasing gap between revenue and costs for political reasons, rising AT&C losses, and other inefficiencies. As a result, their investment in the modernisation and automation of the distribution system has been weak. India: total capex by the SEBs
Source: PFC, Compiled by Daiwa
Further, competition from China players has remained high, leading to falls in ASPs. ASPs for transformers and reactors (INRm)
FY09 FY10 FY11 FY12 9M FY13
% change over FY12 – 9M FY13
Transformer 765kV 129 149 109 105 106 1.1Transformer 400kV 113 104 94 92 85 (7.9)Reactor 765kV 136 74 68 45 47 3.5Reactor 420kV 32 38 39 39 40 1.0
Source: PGCIL, Daiwa compilation
Near-term order opportunities: We see opportunities in the near term for orders from PGCIL, however, we expect the orders to peak in FY13, and remain flat thereon. PGCIL: orders peaking in FY13
Source: Company
Spending on the distribution segment under the 12th Five Year Plan could be about USD60bn, based on the Planning Commission’s working group paper, but 75% of the spending would be on low-voltage lines, transformers, and substations, with the beneficiaries of this being small, domestic companies. The remaining 25%, ie, USD15bn, would be spent on automation to modernise distribution-management systems, and also improving the reliability of the distribution network and minimising distribution losses. Moreover, spending under the Restructured Accelerated Power Development and Reforms Programme (R-APDRP) aimed at reducing AT&C losses has been increased, with the central government releasing funds to the states. India: transmission line over the plan periods
Unit 11th plan 12th planAddition in 12th
planTransmission line HVDC Bipole lines ckm 9,432 19,772 10,340 765 kV ckm 5,730 32,350 27,000 400 kV ckm 113,367 151,367 38,000 220 kV ckm 140,164 174,945 35,000 Total ckm 268,693 378,334 110,340 Sub-Station 765 kV MVA 25,000 149,000 174,000 400 kV MVA 151,027 45,000 192,562 230/220 kV MVA 223,714 76,000 299,434 Total MVA 399,801 270,000 665,996 HVDC Bi-pole link capacity MW 8,000 26,000 19,250 Back-to-back capacity MW 3,000 3,000 -Total MW 11,000 29,000 19,250
Source: Planning Commission
% contribution of sectors to the total order inflow for substation equipment
Source: Industry sources, compiled by Daiwa
175 219 241 235
89 117
146 179 170 192
203 261
0
100
200
300
400
500
600
700
800
FY08 FY09 FY10 FY11
Generation Transmission Distribution
433bn 528bn 590bn 676bn(INRbn)
6782
106121
178200
190200 200
210
0
50
100
150
200
250
FY08 FY09 FY10 FY11 FY12 FY13E FY14E FY15E FY16E FY17E
PGCIL orders peeking in FY13 and remaining flat thereon
(INRbn)
22 20 22 12 24 2
PGCIL Central power utilities
SEBs Private utilities Infra & Industry
Railways

India Power Utilities & Capital Goods Sectors 18 March 2013
- 19 -
India T&D Sector: main sectors ordering substation equipment
Sector Share CY12 (%) Outlook for FY14
PGCIL 20~25 PGCIL orders likely to remain flat Central power utilities
20~25 Could see 10-15% YoY growth in order value with as a result of capacity-addition plans
SEBs 20~25 Slow pace of ordering due to SEBS’ weak financial health; however regular electricity tariff hikes, the introduction of FPPCA, and the SEB FRP may improve the situation in FY14-15
Private utilities 10~15 Facing structural issues, such as the availability of fuel, that could lead to a decline in the value of orders YoY
Infrastructure and industrial companies
20~25 With a revival in capex, ordering could be revived over FY14-15
Railways 2~5 Should continue to see order value growth of 15-20% YoY
Source: Industry sources, compiled by Daiwa
Key drivers: With the recent announcement of an FRP, we believe the balance sheets of the SEBs will improve, which should eventually lead to a rise in T&D capex. However, an immediate improvement seems less likely. Further, a revival in industrial capex would also boost investment in the T&D sector. Key hurdles. Regular and timely increases in electricity tariffs would require continued political will and concerted steps to reduce AT&C losses. India Power Sector: nationwide AT&C losses
Source: PFC
Key players. In the substation equipment space, CRG, Siemens, ABB, and TRIL; in the transmission line segment companies such as L&T, Kalpataru and KEC.
Upturn in investment cycle should be led by new drivers
In the long-cycle industrial-project segments of the capital goods sector, projects have been affected by the challenging domestic macroeconomic environment. The challenges have included high interest rates and constraints on the availability of funds (the credit extended to industry has moderated over the past two years, with bank loans extended to industries rising by 13.8% YoY for December 2012 compared with a CAGR of 23.1% for FY09-12). A recent report by the RBI indicated that more than 50% of central government sector projects worth more than INR1.5bn each in five sectors (roads, power, petroleum, railways and coal), had been delayed and had seen cost overruns. The main reasons for this were delays in acquiring land/receiving environmental approvals/obtaining project financing/finalising engineering designs, a lack of infrastructure support and linkages, changes in scope, and other contractual issues. Among the five sectors, the worst affected were power and roads. However, there have been recent policy measures by the government to resolve many of these issues and to revive the investment cycle. The initiatives have included: 1) encouraging and enabling large cash-rich PSUs to go ahead with planned investments, 2) the setting up of the CCI to expedite big infrastructure projects of more than INR10bn, and 3) the investment allowance of 15% for capex of more than INR1bn (announced in the recent budget), together with signs of interest rates peaking (the Reserve Bank of India cut the repo-rate by 25bps in January 2013) – provide the environment for a recovery in capex. We expect the capex cycle to improve over next 6-12 months, starting with the public sector capex cycle, which should be followed by a revival in the private sector as well over the next 12-18 months. India: projected interest rates (repo rate)
Source: Bloomberg, Daiwa forecasts
Note: CRR=cash reserve ratio
29.45
27.3726.58
26.15
20
22
24
26
28
30
FY08 FY09 FY10 FY11
(% )
0
2
4
6
8
10
Oct
-07
Jan-
08
A pr-0
8
Jul-0
8
Oct
-08
Jan-
09
Apr-0
9
Jul-0
9
Oct
-09
Jan-
10
Apr-1
0
Jul-1
0
Oct
-10
Jan-
11
Apr-1
1
Jul-1
1
Oct
-11
Jan-
12
Apr-1
2
Jul-1
2
Oct
-12
Aug-
13
Repo Rate % CRR %
Three rate cuts of 25 bps each ex pected in remainder of 2013
(% )

India Power Utilities & Capital Goods Sectors 18 March 2013
- 20 -
India: industry capacity-utilisation rate
Source: RBI
India: gross fixed-capital formation
Source: Government of India Economic survey
RBI’s estimate of amount of approved projects
Source: RBI
We believe the current upturn in the capex cycle will be led by new drivers, such as: 1) surface transportation, as a result of a several-fold increase in railway capex in the 12th Five Year Plan, the DFC, and the planned development of metro lines in a number of second-tier cities, 2) the New Urea Investment Policy, which could drive 10mtpa or INR400bn of capex in the fertiliser segment, and continued investments by ONGC.
Railways
In the 12th Five Year Plan, Indian Railways plans to more than double its expenditure, from INR1,921bn under the 11th Five Year Plan to INR5,192bn. Indian Railways: funding of expenditure in the plan period
Source: Planning Commission
To fund this expansion it will rely on the internal generation of funds and investment from the private sector. The internal requirement of funds will be met through a 12% CAGR in passenger receipts and a 9.9% increase in freight receipts (it aims for freight loading to increase by a CAGR of 7.8% to 1,405m tonnes over FY13-17) according to the working group report for the 12th Five Year Plan on the railways sector.
77
7173
72
7981 80
7677
80
83
78 77 7880
7375
646668707274767880828486
2QFY
09
3QFY
09
4QFY
09
1QFY
10
2QFY
10
3QFY
10
4QFY
10
1QFY
11
2QFY
11
3QFY
11
4QFY
11
1QFY
12
2QFY
12
3QFY
12
4QFY
12
1QFY
13
2QFY
13
(%)
05
10152025303540
FY91
FY92
FY93
FY94
FY95
FY96
FY97
FY98
FY99
FY00
FY01
FY02
FY03
FY04
FY05
FY06
FY07
FY08
FY09
FY10
FY11
FY12
Gross Domestic Fix ed Capital Formation (YoY)
Gross Domestic Capital Formation as a % of GDP
(% )
914
1,332
891
437
1,415
1,148
698
521
1,402
872
633
829 875
336
0
300
600
900
1,200
1,500
FY10 FY11 FY12 FY13
Q1 Q2 Q3 Q4
(INRbn)
770 1,942 667
2,250
484
1,000
0
1,000
2,000
3,000
4,000
5,000
6,000
11th Plan 12th Plan
Budgetary support Internal generation Private sector / others
(INRbn)
1,921
5,192

India Power Utilities & Capital Goods Sectors 18 March 2013
- 21 -
Indian Railways: expenditure outlay in the 11th Five Year Plan Indian Railways: expenditure outlay in the 12th Five Year Plan
Source: Planning Commission Source: Planning Commission
Indian Railways: capacity creation in the plan period
km 10th Five Year Plan
11th Five Year Plan
12th Five Year Plan
New lines 920 2,205 4,000Gauge conversion 4,289 5,290 5,500Doubling 1,300 2,756 7,653Railway electrification 1,810 4,501 6,500Eastern and western dedicated freight corridor 3,338
Source: Planning Commission
Indian Railways: capacity creation for rolling stock units 10th Five Year Plan 11th Five Year Plan 12th Five Year Plan
Wagons 36,222 63,481 105,659Coaches 12,202 17,085 24,000Diesel locomotives 622 1,288 2,000Electric locomotives 524 1,218 2,010
Source: Planning Commission
PPP-based railway projects by category in the 12th Five Year Plan
Project Investment expected
(INRbn) Project size (INRbn)High speed corridor Mumbai-Ahmedabad 200 600Elevated Rail corridor in Mumbai 0 200Redevelopment of stations 50 100Freight terminals 50 50Port connectivity 50 50DFC 100 100Loco and coach manufacturing units 50 60Power generation 60 60Total 560 1,220
Source: Planning Commission
Dedicated Freight Corridor This project aims to develop rail routes for the faster and more efficient transportation of raw materials to industries and manufactured goods to ports. The project includes about 2,700km of new freight lines and about 5,000km of feeder lines (new construction and the upgrading of existing lines). The DFC on the western and the eastern routes (see the following chart) involves the construction of about 3,338km of dedicated freight lines to carry predominantly coal and steel on the Eastern Corridor and containers on the Western Corridor. The ports in
Maharashtra and Gujarat would be linked to the northern part of the country and coal from the east of the country would be moved to the power plants in the north. The total cost of the project is estimated by the Planning Commission at about INR958bn. DFC: development programme
Source: Daiwa
New Line6.4%
Gauge Conversion
7.5%
Doubling7.6%
Rolling Stock23.7%
Track Renewals9.2%
Signalling & Telecom Work
4.8%
Investment in PSU's16.3%
Others24.6%
New Line17.1%
Gauge Conversion
2.5%
Doubling4.6%
Rolling Stock22.1%
Track Renewals6.6%
Signalling & Telecom Work
2.7%
Investment in PSU's19.1%
Others25.3%
Ludhiana
Dadri
World Bank FundedPhase 1950 km KhurjaJICA Funded Jaipur APL 1
343 kmWorld Bank Funded
Bhaupur APL 2Ahmedabad 395 km
World Bank FundedVadodara
Phase 2 Allahabad584 km SuratJICA Funded
Mughalsarai122 kmGovt Funded 540 km(IR Equity) Sonnagar PPP funded
JNPT AsansolGaya
JICA- Japan International Co-operation AgencyAPL-Adaptable Program Lending Dankuni
Western CorridorEastern CorridorImportant Stations
Kanpur
Rewari
450 kmAPL 3
Palanpur
India Power Utilities & Capital Goods Sectors 18 March 2013
- 22 -
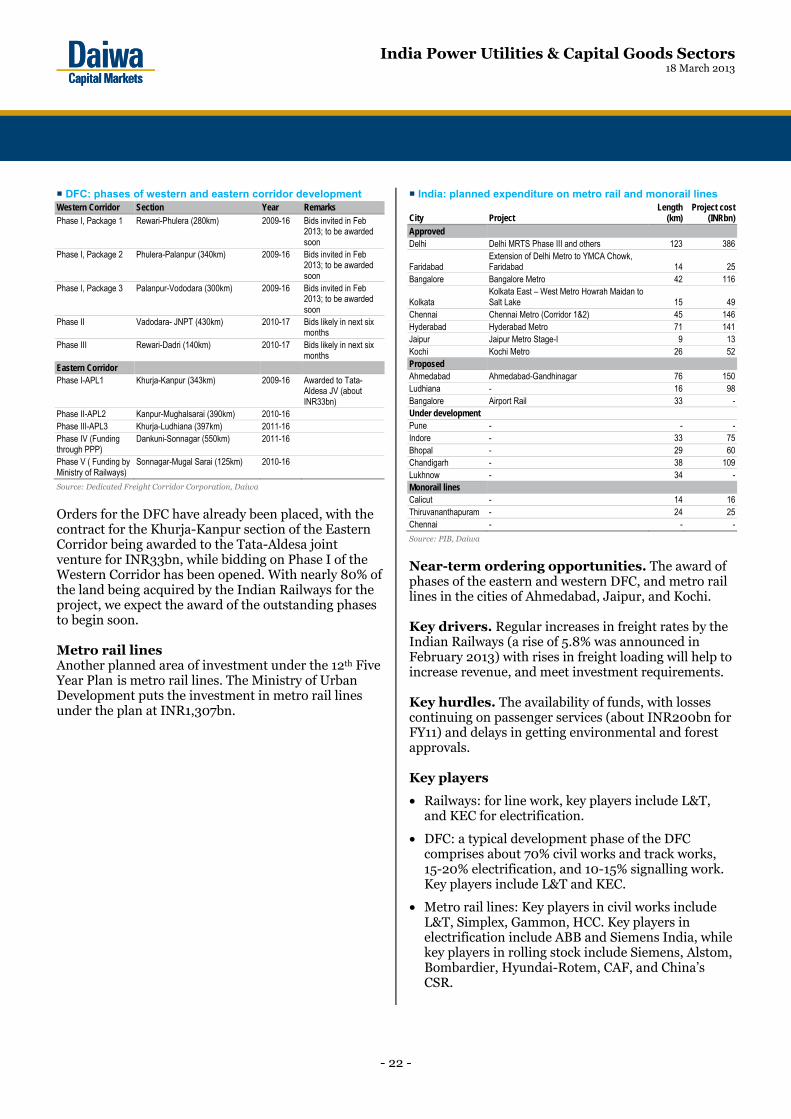
DFC: phases of western and eastern corridor development Western Corridor Section Year Remarks
Phase I, Package 1 Rewari-Phulera (280km) 2009-16 Bids invited in Feb 2013; to be awarded soon
Phase I, Package 2 Phulera-Palanpur (340km) 2009-16 Bids invited in Feb 2013; to be awarded soon
Phase I, Package 3 Palanpur-Vododara (300km) 2009-16 Bids invited in Feb 2013; to be awarded soon
Phase II Vadodara- JNPT (430km) 2010-17 Bids likely in next six months
Phase III Rewari-Dadri (140km) 2010-17 Bids likely in next six months
Eastern Corridor Phase I-APL1 Khurja-Kanpur (343km) 2009-16 Awarded to Tata-
Aldesa JV (about INR33bn)
Phase II-APL2 Kanpur-Mughalsarai (390km) 2010-16 Phase III-APL3 Khurja-Ludhiana (397km) 2011-16 Phase IV (Funding through PPP)
Dankuni-Sonnagar (550km) 2011-16
Phase V ( Funding by Ministry of Railways)
Sonnagar-Mugal Sarai (125km) 2010-16
Source: Dedicated Freight Corridor Corporation, Daiwa
Orders for the DFC have already been placed, with the contract for the Khurja-Kanpur section of the Eastern Corridor being awarded to the Tata-Aldesa joint venture for INR33bn, while bidding on Phase I of the Western Corridor has been opened. With nearly 80% of the land being acquired by the Indian Railways for the project, we expect the award of the outstanding phases to begin soon. Metro rail lines Another planned area of investment under the 12th Five Year Plan is metro rail lines. The Ministry of Urban Development puts the investment in metro rail lines under the plan at INR1,307bn.
India: planned expenditure on metro rail and monorail lines
City Project Length
(km)Project cost
(INRbn)Approved Delhi Delhi MRTS Phase III and others 123 386
Faridabad Extension of Delhi Metro to YMCA Chowk, Faridabad 14 25
Bangalore Bangalore Metro 42 116
Kolkata Kolkata East – West Metro Howrah Maidan to Salt Lake 15 49
Chennai Chennai Metro (Corridor 1&2) 45 146Hyderabad Hyderabad Metro 71 141Jaipur Jaipur Metro Stage-I 9 13Kochi Kochi Metro 26 52Proposed Ahmedabad Ahmedabad-Gandhinagar 76 150Ludhiana - 16 98Bangalore Airport Rail 33 -Under development Pune - - -Indore - 33 75Bhopal - 29 60Chandigarh - 38 109Lukhnow - 34 -Monorail lines Calicut - 14 16Thiruvananthapuram - 24 25Chennai - - -
Source: PIB, Daiwa
Near-term ordering opportunities. The award of phases of the eastern and western DFC, and metro rail lines in the cities of Ahmedabad, Jaipur, and Kochi. Key drivers. Regular increases in freight rates by the Indian Railways (a rise of 5.8% was announced in February 2013) with rises in freight loading will help to increase revenue, and meet investment requirements. Key hurdles. The availability of funds, with losses continuing on passenger services (about INR200bn for FY11) and delays in getting environmental and forest approvals. Key players
• Railways: for line work, key players include L&T, and KEC for electrification.
• DFC: a typical development phase of the DFC comprises about 70% civil works and track works, 15-20% electrification, and 10-15% signalling work. Key players include L&T and KEC.
• Metro rail lines: Key players in civil works include L&T, Simplex, Gammon, HCC. Key players in electrification include ABB and Siemens India, while key players in rolling stock include Siemens, Alstom, Bombardier, Hyundai-Rotem, CAF, and China’s CSR.

India Power Utilities & Capital Goods Sectors 18 March 2013
- 23 -
Roads Orders by the National Highway Authority of India (NHAI) fell significantly in 9M FY13 as it is facing issues with land acquisition, environmental and forestry approvals, and also lacks financing for projects. During the period of the 11th Five Year Plan, it awarded orders in excess of 16,000km. Projects awarded by the NHAI
Source: NHAI
Projects completed by the NHAI
Source: NHAI
In the 11th Five Year Plan, total additions to the national highway network amounted to 10,228km, and the target for the 12th Five Year Plan has been kept largely the same. India: addition to national highways
Source: Planning Commission
India: targets under non-NHDP Km 11th Five Year Plan 12th Five Year Plan
Missing links 55.3Widening to two lanes 5,106 19,200Strengthening 4,622 2,000Improvement in riding quality 11,688 5,000Widening to four lanes 341 200Bypasses 20 5Bridges /railways over bridges (number) 475 250Expressways 1,000
Source: Planning Commission
The total funding required in the 12th Five Year Plan is in excess of INR4,000bn, about 50% of which is due to come from private sector. However, given the issues with environment and land approvals, coupled with a lack of finance for the road sector, there may be only limited interest from the private sector. India roads: funding of central road expenditure INRbn 11th Five Year Plan 12th Five Year PlanBudgetary support 746 1,448 Internal generation 178 648 Private sector 657 2,142 Total 1,581 4,238
Source: Planning Commission
Pradhan Mantri Gram Sadak Yojana (PMGSY) In order to enhance rural connectivity and provide good road connectivity to unconnected villages, the government launched the PMGSY nationwide plan in India in December 2000. A total of INR1,277bn had been sanctioned up until March 2012 under the scheme. A budget of INR1,265bn has been provided under the 12th Five Year Plan. India: progress under PMGSY
Eligible Sanctioned (Mar-12) %Habitations (No.) 158,891 114,963 72 New Connectivity (km) 367,673 279,811 76 Upgrade work (km) 374,844 164,096 44
Source: Planning Commission
State projects India: state-highway targets in the 12th Five Year Plan State Highway km2-laning (ie, upgrading to two lanes) 30,000 4-laning (upgrading to four lanes) 5,000 Strengthening 41,500 Improvement of Riding Quality Programme (IRQP) 50,000 Major districts km2–Laning 20,000 4–Laning 1,000 Strengthening 66,500 IRQP 80,000
Source: Planning Commission
Near-term ordering opportunity. In the budget speech for FY14, the finance minister announced that the NHAI would award road contracts for about 3,000km by 1H FY14.
3,476
671342
1,305
4,663
1,7351,234
643
3,360
5,058
6,491
1,000
0
1,000
2,000
3,000
4,000
5,000
6,000
7,000
FY02
FY03
FY04
FY05
FY06
FY07
FY08
FY09
FY10
FY11
FY12
9M F
Y13
Decrease in orders from NHAI in FY13 due to issues of land and environment approvals
(km)
753 635
1,682
2,205
2,693
1,784
2,248
0
500
1,000
1,500
2,000
2,500
3,000
FY06
FY07
FY08
FY09
FY10
FY11
FY12
(km)
164
3,794
386 -
5,884
10,228 10,000
0
2,000
4,000
6,000
8,000
10,000
12,000
FY08 FY09 FY10 FY11 FY12 Total in 11th Plan
Total in 12th Plan
(km)

India Power Utilities & Capital Goods Sectors 18 March 2013
- 24 -
Key drivers. Setting up of a road regulator, and a low rate of interest would improve the viability and profitability of projects. Key hurdles. Delays in project awards due to issues related to environment and land approvals have led to a few players backing out from the project (GVK from Shivpuri-Dewas project and GMR from Kishangarh Udaipur-Ahmedabad projects, both from the NHAI). Also, there are issues in obtaining financing, with banks wanting companies to provide 100% equity up front. Strict lending conditions have also affected investment in the sector. Key players. GMR, GVK, L&T and IRB and ITNL. We expect competition to decline due to the highly leveraged balance sheets of the players. Airports The 11th Five Year Plan saw huge investments in the airports to increase capacity. Five international airports were completed through the public-private partnership (PPP) model (Hyderabad, Bangalore, Kochi, Delhi, and Mumbai). Further the Airports Authority of India (AAI) is upgrading and developing non-metro airports, and the expenditure on these is expected by the Planning Commission to increase from INR70bn under the 11th Five Year Plan to INR149bn in the 12th Five Year Plan. India: investments in airports Party Category 11th Five Year Plan 12th Five Year PlanAAI Airport projects 130 175 Private investments By airport operator 300 400 Others 11 100 Total 441 675
Source Planning Commission
Investment by AAI increasing in non-metro airports and decreasing in metro airports for the 12th Five Year Plan
Source Planning Commission
Key drivers. The Planning Commission expects domestic passenger traffic to increase by a 12% CAGR over the period of the 12th Five Year Plan, as with domestic cargo traffic. While international passenger traffic is expected to rise by a CAGR of 8% and international cargo traffic by a 10% CAGR over the same period. Key hurdles. Delays in approval of investment proposals. Key players. L&T, GVK and GMR. Fertiliser In December 2012, the CCEA approved the New Urea Investment Policy to set floor and ceiling prices for urea, based on the price of natural gas plus a 12-20% ROE. Although the availability of gas remains a key challenge domestically, if gas is made available (in the form of imports) it could drive up capex in the country’s fertiliser segment. India: proposed fertiliser plants over the period of the 12th Five Year Plan Company Location Capacity (m tonnes)Kribhco Hazira, Gujarat 1.2 Indo Gulf Jagdishpur, Uttar Pradesh 1.2 RCF Thal, Maharashtra 1.2 IFFCO Kalol, Gujarat 1.4 Chambal Fertilizers Gadepan, Rajasthan 1.2 Tata Chemicals Babrala, Uttar Pradesh 1.3 Nagarjuna Fertilizers Kakinada in AP 1.3 Zuari Belgaum, Karnataka 1.3 Total 9.8 Cost of setting up 1m tonne plant USD900m Total anticipated capex (INRbn) 450
Source: Planning Commission, Daiwa
Near-term ordering opportunity. The Department of Fertilizers has already received proposals for setting up about 10m tpa of capacity. Assuming it costs USD900m to set up a 1m tonne greenfield fertiliser plant we estimate capex of about INR450bn will be needed for the planned urea plants under the 12th Five Year Plan (India consumes about 32m tpa but produces 22m tpa). Key drivers. Approval of a New Urea Investment Policy, the country’s high dependence on imports, and plants currently running at high capacity-utilisation rate. Key hurdles. We do not expect the domestic gas-supply situation to improve materially over the medium term, and there is a lack of RLNG infrastructure to import LNG. Key players. L&T, Engineers India, and Punj Lloyd.
70
149
60
21
0
50
100
150
200
11th Plan 12th Plan
Non-Metro airports Metro airports Others
INRbn

India Power Utilities & Capital Goods Sectors 18 March 2013
- 25 -
Metals – steel Land acquisition and environmental approvals have also affected the metals sector, while the bans on iron-ore mining in Karnataka, Goa, and Odisha have impacted capacity expansion plans. As a result, the capex spent by the steel companies has been affected, and we do not expect a revival in the capex spent any time soon. India Steel Sector: capex over the years
Source: Company, Daiwa
Near-term ordering opportunity. However, based on our capacity addition forecast of 35m tonnes over the period of the 12th Five Year Plan, the order opportunity could be INR1750bn (assuming the cost of setting up a 1m tonne steel plant is INR5bn). India: projected steel capacity additions over the period of the 12th Five Year Plan
Company Location State Capacity addition
(m tonnes) Anticipated capex
(INRbn)SAIL Various NA 7.8 388 RINL Vizag Andhra
Pradesh 4.2 209 NMDC Nagarnar Chhattisgarh 2.0 100 Tata Steel Jamshedpur Jharkhand 0.8 39 Tata Steel Kalinganagar Orissa 6.0 300 JSW Vijayanagar Karnataka 2.0 100 ESSAR Steel Gujarat 4.0 200 JSPL Angul Orissa 3.0 150 Bhushan Steel Limited
Angul-Dhenkanal
Orissa 1.7 85
JSW Salem Tamil Nadu 0.9 45 JSW ISPAT Maharashtra 0.7 35 JSPL Pattratu Chhattisgarh 2.0 100 Total 35.0 1,751
Source: Planning Commission, Daiwa
Key driver. The removal of the iron-ore mining bans in Karnataka, Goa, and Odisha could result in plans for capacity expansion. Key hurdles. Non-timely land and environment approvals have delayed many projects (eg, POSCO signed a Memorandum of Understanding with the Odisha State Government in 2005 to set up 8m tonnes
of capacity, but the project has been delayed due to land acquisition issues). Key players. For blast furnace, key player includes L&T, for Coke-Oven/Sinter-plant key players include Siemens and L&T, for oxygen furnace key player includes Siemens, and captive power plant players include Thermax and BHEL. Oil & Gas – upstream The oil and gas sector has seen a steady increase in capacity over the past few years. The expenditure on capital projects in the 12th Five Year Plan is due to reach INR793bn, up from INR469bn in the 11th Five Year Plan. India: development spend by the oil and gas sector
Source: Planning Commission
India Upstream Oil Sector: capex over the years
Source: Company, Daiwa
Key drivers. We see continued planned capex by ONGC as the sole driver. According to the recent Union Budget, the company will spend INR350bn on capex in FY14. Key hurdle. Competition from international players has remained high over the past two years. Key players. L&T and Punj Lloyd.
47 76
117
252 257 299
379 352
409 429
350
(25)
0
25
50
75
100
125
0
100
200
300
400
500
FY05
FY06
FY07
FY08
FY09
FY10
FY11
FY12
FY13
E
FY14
E
FY15
E
Capex (LHS) % change YoY (RHS)
(INRbn) (% )
105 63
314 447
208 265 469
793 110
72
0
500
1,000
1,500
2,000
11th Plan 12th Plan
Seismic surveys Ex ploratory drilling Development drilling
Capital projects & purchases Others
1,206
1,640(INRbn)
162 214 239
400
507 462
495 511 460
531 564
(20)
0
20
40
60
80
100
0
100
200
300
400
500
600
FY05
FY06
FY07
FY08
FY09
FY10
FY11
FY12
FY13
E
FY14
E
FY15
E
Capex (LHS) % change YoY (RHS)
(INRbn) (% )

India Power Utilities & Capital Goods Sectors 18 March 2013
- 26 -
Oil & Gas – downstream We do not envisage any large orders to be finalised over the next few years in the refinery space, as: 1) new projects are still at the planning stage, and 2) large amounts of capacity have recently been commissioned (by Essar Vadinar-Expansion to 18m tpa, by HPCL Bhatinda to 9m tpa, and by BPCL Bina to 6m tpa). India Downstream Oil Sector: capex over the years
Source: Company, Daiwa
The capacity additions planned under the 12th Five Year Plan amount to more than 90m tpa, most of which will be brown-field expansion.
India: increase in refining capacity during 12th Five Year Plan
(m tpa) FY13E FY17E Capacity additions
Anticipated capex (INRbn)
IOC 54.2 77.0 22.8 43.9BPC (Mumbai) 12.0 13.5 1.5 2.9Kochi 9.5 15.5 6.0 11.6BORL–Bina 6.0 9.0 3.0 5.8HPC (MR + VR) 16.5 23.2 6.7 12.9Maharashtra Refinery - 9.0 9.0 17.3HMEL (GGSRL) 9.0 9.0 - -MRPL 15.0 18.0 3.0 5.8ONGC (Tatipaka) 0.1 0.1 - -CPCL 12.1 18.3 6.2 11.9NRL 3.0 8.0 5.0 9.6Sub-total PSU 137.4 200.6 63.2 121.7RIL-DTA and SEZ, Jamnagar 60.0 60.0 - -EOL, Jamnagar 19.0 38.0 19.0 36.6NOCL, Cuddalore 2.0 15.0 13.0 25.0Sub-total private 81.0 113.0 32.0 61.6Total 218.4 313.6 95.2 183.3
Source: Planning Commission
Key driver. Diesel deregulation should decrease the under-recovery amounts for the downstream companies, and encourage capacity-expansion plans. Key hurdle. The uncertain regulatory environment. Key players. For the engineering procurement and construction (EPC) portions of projects, key players include L&T, Punj Lloyd, Afcons, and BHEL.
97 91 103 121
169 198
92
157 141 141
90
(60)
0
60
120
180
240
300
0
50
100
150
200
250
FY05
FY06
FY07
FY08
FY09
FY10
FY11
FY12
FY13
E
FY14
E
FY15
E
Capex (LHS) % change YoY (RHS)
(INRbn) (% )

India Power Utilities & Capital Goods Sectors 18 March 2013
- 27 -
Global power: valuation comparison
Company BBG code Rating Share price
Market cap
Trading volume
PER (x)
PBR (x)
EV/EBITDA (x)
ROE (%)
Div yield (%)
(lcy) USDm USDm FY14E FY15E FY14E FY15E FY14E FY15E FY14E FY15E FY14E FY15EChina Huaneng Power* 902 HK 4 6.1 14,816 16.8 11.7 11.4 1.5 1.4 7.7 7.1 13.1 12.7 4.3 4.4CR Power* 836 HK 1 20.2 12,351 16.3 11.3 10.5 1.6 1.5 7.0 6.5 15.2 14.9 2.7 3.0Datang Power* 991 HK 3 2.8 8,348 6.8 10.7 9.5 0.8 0.8 9.2 8.9 8.2 8.7 2.3 2.6Huadian Power 1071 HK NR 3.5 4,776 3.8 9.7 8.6 1.0 0.9 8.2 7.6 10.3 10.8 2.7 3.1China Power Int'l 2380 HK NR 2.5 1,797 3.8 7.1 6.4 0.7 0.6 8.4 7.7 9.9 10.2 4.7 5.3Simple average 8,418 10.1 9.3 1.1 1.0 8.1 7.6 11.3 11.4 3.4 3.7Weighted average 11.0 10.2 1.3 1.2 7.9 7.4 12.3 12.2 3.3 3.5Hong Kong CLP Holdings* 2 HK 3 66.6 21,556 37.7 14.2 13.5 1.8 1.7 8.4 8.5 12.9 12.8 4.1 4.3Power Assets Holdings* 6 HK 2 70.9 19,400 23.1 14.9 14.6 2.3 2.2 16.2 16.0 15.9 15.3 4.0 4.1Cheung Kong Infra* 1038 HK 2 53.5 17,119 16.3 12.8 12.2 2.0 1.8 54.6 47.3 16.2 15.5 3.5 3.7Simple average 19,358 14.0 13.4 2.0 1.9 26.4 23.9 15.0 14.5 3.9 4.0Weighted average 14.0 13.5 2.0 1.9 24.7 22.5 14.9 14.4 3.9 4.1India NTPC* NTPC IN 1 145.9 22,284 18.9 10.6 9.8 1.4 1.3 8.7 7.9 13.7 13.6 3.3 3.9Adani Power* ADANI IN 3 47.7 2,107 4.1 20.49 8.7 2.1 1.7 9.3 6.3 10.9 21.7 0.0 0.0Reliance Power* RPWR IN 4 74.4 3,870 12.1 18.7 14.4 1.1 1.0 20.7 14.3 5.8 7.1 0.0 0.0JSW Energy JSW IN NR 58.0 2,114 2.9 10.4 8.4 1.5 1.3 6.8 5.8 14.9 16.3 1.5 2.1NHPC NHPC IN NR 20.4 5,576 15.3 9.8 9.0 0.8 0.8 7.7 6.9 8.3 8.7 3.8 4.0Tata Power TPWR IN NR 101.7 5,363 6.4 20.0 17.3 1.9 1.7 8.9 7.4 9.7 10.2 1.1 1.2CESC CESC IN NR 297.2 825 3.0 10.8 8.4 0.7 0.7 7.5 6.0 6.7 7.7 1.7 1.8Lanco Infra LANCI IN NR 12.4 663 5.0 85.5 11.6 0.7 0.6 8.2 7.1 0.3 6.6 0.0 0.0Torrent Power TPW IN NR 166.3 1,746 1.3 13.4 9.1 1.2 1.1 8.4 6.6 9.8 13.2 2.8 3.2Coal India* COAL IN 1 320.0 37,427 14.1 10.6 9.6 3.6 3.0 6.5 5.4 36.8 34.3 4.4 4.4Simple average 8,198 21.0 10.6 1.5 1.3 9.3 7.4 11.7 13.9 1.9 2.1Weighted average 12.5 10.3 2.4 2.1 8.1 6.8 23.0 22.4 3.3 3.5ASEAN Abolitiz Power AP PM NR 36.2 6,144 2.5 13.0 12.9 2.9 2.6 12.1 12.1 23.3 20.3 3.8 3.3First Gen FGEN PM NR 23.5 1,823 2.1 9.2 10.3 1.2 1.2 10.0 9.7 11.7 11.5 1.9 -EDC EDC PM NR 6.7 2,876 4.9 11.1 10.6 2.5 2.3 7.9 8.1 25.9 21.8 2.8 -Manila Electric MER PM NR 330.0 8,578 3.5 20.0 18.6 4.2 3.8 9.8 9.1 23.3 21.5 3.1 -Elec Generation EGCO TB NR 157.5 2,739 2.8 11.9 11.6 1.1 1.1 17.4 26.1 9.7 9.0 3.6 3.6Glow Energy GLOW TB NR 84.0 4,059 2.6 13.8 13.1 2.7 2.4 10.0 9.9 20.3 19.4 3.7 3.8Tenaga TNB MK NR 7.1 13,087 18.4 10.7 9.7 1.0 0.9 5.4 5.2 9.4 9.5 2.6 2.9YTL Power YTLP MK NR 1.5 3,527 1.9 8.7 8.4 1.0 0.9 7.2 6.9 11.7 11.6 3.2 2.8Simple average 5,354 12.3 11.9 2.1 1.9 10.0 10.9 16.9 15.6 3.1 3.3Weighted average 13.0 12.4 2.2 2.0 9.0 9.3 16.6 15.4 3.1 2.2
Source: Bloomberg, *Daiwa forecasts
Note: Prices as of close on 15 March 2013

India Power Utilities & Capital Goods Sectors 18 March 2013
- 28 -
Global power equipment companies: valuation comparison
Company BBG code Rating Share price
Market cap
Trading volume
PER (x)
PBR (x)
EV/EBITDA (x)
ROE (%)
Div yield (%)
(lcy) USDm USDm FY14E FY15E FY14E FY15E FY14E FY15E FY14E FY15E FY14E FY15EChina Shanghai Electric* 2727 HK 1 2.5 7,909 9.9 7.8 6.9 0.9 0.8 2.1 1.7 12.2 12.6 3.9 4.3Dongfang Electric* 1072 HK 3 12.1 4,627 7.3 9.9 9.2 1.6 1.4 4.2 3.6 17.0 15.8 1.1 1.1Harbin Electric* 1133 HK 1 5.2 1,156 4.5 5.1 4.7 0.6 0.5 0.1 -0.6 11.6 11.4 3.5 3.8China High Speed Trans* 658 HK 3 2.8 611 11.9 11.4 9.5 0.5 0.5 5.9 5.8 4.3 5.0 1.8 2.1Xinjiang Goldwind* 2208 HK 3 3.5 2,272 3.6 24.0 18.6 0.7 0.7 17.2 12.8 3.0 3.8 0.9 1.2Simple average 3,315 11.6 9.8 0.8 0.8 5.9 4.6 9.6 9.7 2.2 2.5Weighted average 10.6 9.1 1.0 0.9 4.7 3.7 11.9 11.9 2.6 2.9India BHEL* BHEL IN 4 198.1 8,976 15.3 9.7 10.4 1.5 1.4 5.2 5.4 16.2 13.8 3.3 3.3Larson & Toubro* LT IN 1 1,506.5 17,185 46.7 17.5 15.7 2.8 2.4 11.8 10.6 17.0 16.6 1.0 1.0Crompton Greaves* CRG IN 3 97.5 1,159 6.2 10.7 9.1 1.5 1.3 6.0 5.0 14.7 15.4 2.1 2.1Siemens India* SIEM IN 4 573.3 3,779 2.3 27.2 21.3 4.1 3.6 15.2 11.4 15.7 17.8 1.1 1.1ABB India* ABB IN 5 574.2 2,256 0.8 47.1 33.3 4.3 3.8 26.2 19.4 9.5 12.2 0.2 0.2Thermax TMX IN NR 579.9 1,536 0.9 18.9 16.0 3.3 2.9 11.5 10.0 18.0 18.9 1.4 1.5Suzlon SUEL IN NR 15.0 590 26.1 - 5.7 0.7 1.3 6.7 5.5 -1.2 14.8 0.0 0.0Simple average 5,069 18.7 15.9 2.6 2.4 11.8 9.6 12.9 15.7 1.3 1.3Weighted average 18.0 15.7 2.6 2.3 11.1 9.7 15.9 15.8 1.6 1.6Korea Doosan Hvy* 034020 KS 2 43,100.0 4,217 16.5 11.6 9.0 0.8 0.7 12.6 12.5 8.2 9.9 1.7 1.7Kepco E&C* 051600 KS 2 51,900.0 2,159 6.2 14.6 12.0 3.5 3.1 9.9 8.1 26.2 27.5 4.4 4.8KPS* 052690 KS 3 90,400.0 3,193 6.5 21.7 20.1 7.9 5.9 15.4 13.8 35.7 33.7 3.1 3.3Simple average 3,189 16.0 13.7 4.1 3.2 12.6 11.5 23.3 23.7 3.1 3.3Weighted average 15.7 13.4 3.8 3.0 12.9 11.9 21.4 21.8 2.8 3.0
Source: Bloomberg, *Daiwa forecasts
Note: Prices as of close on 15 March 2013
Other companies mentioned in this report include:
Essar Power (Not listed), Hindalco (HNDL IN, INR95.75, Buy [1]), Jaiprakash Power Ventures Limited (JPVL) (Not rated), Lanco (Not rated), India bulls (Not rated), Tata Power (Not rated), JSW Energy (Not rated), Kalpataru (Not rated), KEC (Not rated), Alstom (Not rated), Titagarh (Not rated), Texmaco (Not rated), Bombardier (Not rated), IRB (Not rated), ITNL (Not rated), GMR (Not rated) and GVK (Not rated), Engineers India (Not rated), Punj Lloyd (Not rated), Simplex (Not rated), Gammon (Not rated), HCC (Not rated), Kribhco (Not listed), Indo Gulf (Not listed), RCF (Not rated), IFFCO (Not listed), Chambal Fertilizers (Not rated), Tata Chemicals (TTCH IN, INR321, Buy[1]), Nagarjuna Fertilizers (Not rated), Zuari (Not rated), SAIL (SAIL IN, INR68.80, Outperform [2]), RINL (Not listed), NMDC (Not rated), Tata Steel (TATA IN, INR354.35, Buy [1]), JSW Steel (JSTL IN, INR700.15, Buy [1]), ESSAR Steel (Not listed), JSPL (JSP IN, INR356.65, Outperform [2]), Bhushan Steel (BHUS IN, INR459.25, Hold[3]), JSW ISPAT (Not rated), Afcons (Not listed), IOCL (IOCL IN, INR316.95, Hold [3]), BPCL (BPCL IN, INR399.95, Buy [1]), Kochi Refinery (Not listed), BORL(Not listed), HPC (HPCL IN, INR305.1, Outperform [2]), Maharashtra Refinery (Not listed), HMEL (Not listed), MRPL (Not rated), ONGC (ONGC IN, INR319.30, Outperform [2]), CPCL (Not rated), NRL (Not listed), DVC (Not rated).

See important disclosures, including any required research certifications, beginning on page 73
■ What’s new Coal India’s (CIL) share price has underperformed the SENSEX by 22% over the past six months on concerns about a few unresolved issues: 1) consistency of volume growth, 2) ability to increase prices, 3) potential falls in e-auction coal volumes and ASPs, 4) the potential negative impact of coal-price pooling, fuel supply agreement (FSA) commitments, the MMDR Bill and Coal Regulatory Bill. We believe these concerns are overstated. This summary is an excerpt from our full report on CIL. ■ What’s the impact Volumes. After a government push and initiatives by the new chairman, CIL’s dispatch volumes rose 7.3% YoY for 11M FY13. CIL is targeting a production CAGR of 7% (FY12-17E), as it is working closely with the Indian railways and Ministry of Environment and Forest (MOEF). We are upbeat on CIL ramping up volumes, and as a result, are raising our volume CAGR assumption for FY13-17 from 4% to
5%. Further, with CIL’s plan to implement contract mining, volumes could surprise us positively. Price increase. With recent cost pressures relating to the hike in diesel costs (~INR14.4bn) and wages for contract workers (~INR2.5-3bn), coupled with the expectation of an improvement in the SEBs’ financials (recent tariff hikes and restructuring plan), we expect a price hike over the next 3-4 months (no price increase for the power sector for the past three years despite the wage settlement in January 2012). ■ What we recommend We reaffirm our Buy (1) rating as we expect: 1) a coal price hike in the next 3-4 months on the back of the recent cost pressures, 2) higher incentive income, with strong dispatches to FSA customers (such as NTPC, up by 16% for 9M FY13). We maintain our DCF-based six-month target price of INR423. Risks include the establishment of a coal regulator with pricing power. Recent media reports indicate that CIL might be a divestment candidate, which could be a near-term share overhang. However, the government could resolve issues at CIL to make a stake sale more attractive, similar to what we saw at NTPC.
■ How we differ Our above-consensus FY13E EPS reflects mainly our lower employee costs assumption.
Energy / IndiaCOAL IN
18 March 2013
Coal India
Pessimism looks overdone
• CIL’s share price has been under pressure on the back of various concerns, which we think are overstate
• Near-term positive catalysts: higher incentive income and possible price hike to offset cost pressures
• Reiterate Buy (1) rating
Source: Daiwa forecasts
Source: FactSet, Daiwa forecasts
Energy / India
Coal IndiaCOAL IN
Target (INR): 423.00 423.00
Upside: 32.2%
15 Mar price (INR): 320.00
Buy (unchanged)
OutperformHoldUnderperformSell
1
2
3
4
5
Forecast revisions (%)Year to 31 Mar 13E 14E 15ERevenue change - 0.8 0.9Net profit change - 1.3 1.0Core EPS (FD) change - 1.3 1.0
80
88
95
103
110
300
321
343
364
385
Mar-12 Jun-12 Sep-12 Dec-12 Mar-13
Share price performance
Coal India (LHS)Relative to SENSEX Index (RHS)
(INR) (%)
12-month range 303.15-383.20Market cap (USDbn) 37.403m avg daily turnover (USDm) 14.08Shares outstanding (m) 6,316Major shareholder President of India (90.0%)
Financial summary (INR)Year to 31 Mar 13E 14E 15ERevenue (m) 668,652 724,535 784,211Operating profit (m) 159,166 177,267 192,249Net profit (m) 170,618 190,175 209,783Core EPS (fully-diluted) 27.012 30.108 33.213EPS change (%) 15.4 11.5 10.3Daiwa vs Cons. EPS (%) 0.6 2.7 1.3PER (x) 11.8 10.6 9.6Dividend yield (%) 4.2 4.4 4.4DPS 13.500 14.000 14.000PBR (x) 4.3 3.6 3.0EV/EBITDA (x) 7.8 6.5 5.4ROE (%) 38.8 36.8 34.3
Saurabh Mehta(91) 22 6622 1009

India Power Utilities & Capital Goods Sectors 18 March 2013
- 30 -
Key assumptions
Profit and loss (INRm)
Cash flow (INRm)
Source: FactSet, Daiwa forecasts
Year to 31 Mar 2008 2009 2010 2011 2012 2013E 2014E 2015ECoal Production (Million tonnes) 379.5 403.7 431.3 431.3 435.8 462.0 485.1 509.3Coal Dispatch (Million tonnes) 375.3 401.4 415.4 423.3 433.0 461.1 484.1 508.4
Coal avg. blended price per tonnes (INR)
869.4 966.3 1,074.1 1,186.6 1,442.8 1,450.1 1,496.5 1,542.6
Year to 31 Mar 2008 2009 2010 2011 2012 2013E 2014E 2015ECoal Revenues 326,339 387,888 446,153 502,293 624,154 668,652 724,535 784,211Other Revenue 0 0 0 0 0 0 0 0Other Revenue 0 0 0 0 0 0 0 0Total Revenue 326,339 387,888 446,153 502,293 624,154 668,652 724,535 784,211Other income 22,187 21,556 27,362 12,150 3,811 0 0 0COGS (239,012) (323,177) (298,739) (312,360) (383,169) (405,105) (432,440) (466,593)SG&A (14,873) (19,285) (19,336) (22,316) (21,966) (23,394) (25,792) (28,436)Other op.expenses (49,989) (59,516) (66,297) (62,813) (86,009) (80,987) (89,036) (96,933)Operating profit 44,651 7,466 89,142 116,954 136,821 159,166 177,267 192,249Net-interest inc./(exp.) 19,456 26,882 25,575 29,074 52,803 57,694 62,768 70,628Assoc/forex/extraord./others 23,071 23,059 24,928 18,604 23,103 30,412 35,581 41,156Pre-tax profit 87,178 57,407 139,646 164,632 212,727 247,272 275,617 304,033Tax (34,745) (36,632) (43,425) (55,959) (64,845) (76,654) (85,441) (94,250)Min. int./pref. div./others 0 0 0 0 0 0 0 0Net profit (reported) 52,433 20,775 96,221 108,674 147,882 170,618 190,175 209,783Net profit (adjusted) 52,433 20,775 96,221 108,674 147,882 170,618 190,175 209,783EPS (reported)(INR) 8.301 3.289 15.234 17.205 23.413 27.012 30.108 33.213EPS (adjusted)(INR) 8.301 3.289 15.234 17.205 23.413 27.012 30.108 33.213EPS (adjusted fully-diluted)(INR) 8.301 3.289 15.234 17.205 23.413 27.012 30.108 33.213DPS (INR) 2.700 2.700 3.499 3.900 10.000 13.500 14.000 14.000EBIT 44,651 7,466 89,142 116,954 136,821 159,166 177,267 192,249EBITDA 59,951 24,095 102,281 134,608 156,513 178,214 198,315 214,547
Year to 31 Mar 2008 2009 2010 2011 2012 2013E 2014E 2015EProfit before tax 87,178 57,407 139,646 164,632 212,727 247,272 275,617 304,033Depreciation and amortisation 13,800 10,630 6,750 17,654 19,692 19,048 21,048 22,298Tax paid (29,297) (27,907) (39,990) (56,228) (67,044) (76,654) (85,441) (94,250)Change in working capital 27,621 56,054 (1,310) (43,284) 35,647 19,506 29,804 31,828Other operational CF items (27,873) (5,853) (24,719) (24,803) (54,946) (57,186) (62,312) (70,199)Cash flow from operations 71,428 90,332 80,377 57,971 146,076 151,986 178,716 193,710Capex (18,350) (18,746) (19,804) (25,682) (34,094) (40,000) (35,000) (35,000)Net (acquisitions)/disposals 0 0 0 0 0 0 0 0Other investing CF items 0 0 0 0 0 0 0 0Cash flow from investing (18,350) (18,746) (19,804) (25,682) (34,094) (40,000) (35,000) (35,000)Change in debt (2,600) 2,646 (616) (5,035) (2,474) (1,500) (1,500) 0Net share issues/(repurchases) 0 0 0 0 0 0 0 0Dividends paid (19,953) (17,054) (22,100) (25,832) (74,291) (101,249) (104,999) (104,999)Other financing CF items 23,490 29,616 28,031 30,346 56,121 57,694 62,768 70,628Cash flow from financing 937 15,208 5,315 (522) (20,644) (45,055) (43,731) (34,370)Forex effect/others 0 0 0 0 0 0 0 0Change in cash 54,016 86,794 65,888 31,767 91,338 66,931 99,985 124,339Free cash flow 53,078 71,586 60,573 32,289 111,981 111,986 143,716 158,710
Financial summary

India Power Utilities & Capital Goods Sectors 18 March 2013
- 31 -
Balance sheet (INRm)
Key ratios (%)
Source: FactSet, Daiwa forecasts
Company profile
Coal India is the largest coal-mining company in the world in terms of raw coal production (436m tonnes for FY12), total coal reserves (18.86bn tonnes), and resources base (64.22bn tonnes).
As at 31 Mar 2008 2009 2010 2011 2012 2013E 2014E 2015ECash & short-term investment 209,615 296,950 390,782 458,064 582,028 648,451 747,979 871,889Inventory 34,074 36,666 44,018 55,856 60,713 66,865 72,453 78,421Accounts receivable 16,572 18,475 21,686 34,187 56,679 50,149 54,340 58,816Other current assets 102,663 117,271 86,778 142,164 174,855 200,596 217,360 235,263Total current assets 362,923 469,362 543,265 690,272 874,275 966,060 1,092,134 1,244,389Fixed assets 120,071 129,283 142,461 149,005 163,437 184,388 198,340 211,042Goodwill & intangibles 0 0 0 0 0 0 0 0Other non-current assets 25,057 24,600 22,425 19,369 31,755 31,755 31,755 31,755Total assets 508,050 623,244 708,151 858,646 1,069,466 1,182,203 1,322,228 1,487,186Short-term debt 16,592 19,680 16,199 15,210 15,274 13,774 12,274 12,274Accounts payable 0 0 0 0 0 0 0 0Other current liabilities 305,945 399,422 415,557 493,429 629,356 674,225 730,573 790,747Total current liabilities 322,537 419,102 431,757 508,638 644,630 687,998 742,847 803,021Long-term debt 2,247 1,805 3,432 326 0 0 0 0Other non-current liabilities 11,259 12,238 14,774 16,214 19,770 19,770 19,770 19,770Total liabilities 336,043 433,146 449,963 525,178 664,400 707,769 762,617 822,791Share capital 63,164 63,164 63,164 63,164 63,164 63,164 63,164 63,164Reserves/R.E./others 108,843 126,916 194,789 269,978 341,367 410,735 495,912 600,696Shareholders' equity 172,007 190,080 257,952 333,142 404,530 473,899 559,075 663,859Minority interests 0 19 236 326 536 536 536 536Total equity & liabilities 508,050 623,244 708,151 858,646 1,069,466 1,182,203 1,322,228 1,487,186EV 1,830,461 1,745,790 1,650,322 1,579,034 1,455,019 1,387,096 1,286,067 1,162,157Net debt/(cash) (190,776) (275,465) (371,151) (442,529) (566,754) (634,677) (735,706) (859,615)BVPS (INR) 27.232 30.093 40.839 52.743 64.045 75.027 88.512 105.101
Year to 31 Mar 2008 2009 2010 2011 2012 2013E 2014E 2015ESales (YoY) 10.2 18.9 15.0 12.6 24.3 7.1 8.4 8.2EBITDA (YoY) (35.4) (59.8) 324.5 31.6 16.3 13.9 11.3 8.2Operating profit (YoY) (43.9) (83.3) 1,094.0 31.2 17.0 16.3 11.4 8.5Net profit (YoY) (36.3) (60.4) 363.2 12.9 36.1 15.4 11.5 10.3Core EPS (fully-diluted) (YoY) (36.3) (60.4) 363.2 12.9 36.1 15.4 11.5 10.3Gross-profit margin 26.8 16.7 33.0 37.8 38.6 39.4 40.3 40.5EBITDA margin 18.4 6.2 22.9 26.8 25.1 26.7 27.4 27.4Operating-profit margin 13.7 1.9 20.0 23.3 21.9 23.8 24.5 24.5Net profit margin 16.1 5.4 21.6 21.6 23.7 25.5 26.2 26.8ROAE 31.4 11.5 43.0 36.8 40.1 38.8 36.8 34.3ROAA 11.2 3.7 14.5 13.9 15.3 15.2 15.2 14.9ROCE 23.9 3.7 36.4 37.3 35.6 35.0 33.4 30.8ROIC 975.0 (5.2) (61.9) (69.5) (70.3) (68.2) (72.7) (71.4)Net debt to equity net cash net cash net cash net cash net cash net cash net cash net cashEffective tax rate 39.9 63.8 31.1 34.0 30.5 31.0 31.0 31.0Accounts receivable (days) 18.7 16.5 16.4 20.3 26.6 29.2 26.3 26.3Current ratio (x) 1.1 1.1 1.3 1.4 1.4 1.4 1.5 1.5Net interest cover (x) n.a. n.a. n.a. n.a. n.a. n.a. n.a. n.a.Net dividend payout 32.5 82.1 23.0 22.7 42.7 50.0 46.5 42.2Free cash flow yield 2.6 3.5 3.0 1.6 5.5 5.5 7.1 7.9
Financial summary continued …

See important disclosures, including any required research certifications, beginning on page 73
■ What's new NTPC has been an early beneficiary of recent policy actions taken by the government to resolve long-standing issues related to fuel security and receivables in the power sector. ■ What's the impact Improving fuel security. 1) Coal availability from Coal India (CIL) improved significantly for 9M FY13, up 16.4% YoY. 2) New fuel supply agreements (FSAs) for capacity added after 2009 (about 6.5GW) should be signed shortly, with CIL agreeing to modifying the FSA terms, 3) the MOC has reversed its decision to de-allocate three mines, which should have a peak capacity of about 20m tonnes a year. Reduced receivables risk. The planned restructuring of the SEBs and the regular tariff hikes most of them have made in the past one year should reduce the risk of delays in receivables.
CERC’s new tariff regulations for 2014-19 are likely to be finalised soon. Given a shortage of domestic coal and weak financials for the SEBs, we expect the regulator to cut the levels of plant availability above which incentives are available (from 85% to 80% or lower to offset the impact of reduced coal availability). This would be positive for NTPC. Increase in capacity additions. Unlike under the 10th and 11th five-year plans (FYP), when NTPC missed its capacity-addition targets by 2.2GW and 12.8GW, respectively, for the 12th FYP, its capacity-addition target of 14GW appears achievable, as capacity additions are front-end loaded (7GW over FY13-14). ■ What we recommend Given the 13% drop in the share price over the past six months, we upgrade our rating to Buy (1) from Outperform (2). Trading currently at an FY14E PBR of 1.4x, an eight-year low, NTPC looks attractive. We maintain our SOTP-based six-month target price of INR178. The implementation of coal pooling (including pre-2009 FSA coal) could be an immediate risk to our call. ■ How we differ Our FY13-15E earnings are 3-6% higher than those of the Bloomberg
consensus, probably because we expect less of a fall in incentive income.
Utilities / IndiaNTPC IN
18 March 2013
NTPC
An early beneficiary of reforms
• Coal availability from CIL increased by 16.4% YoY for 9M FY13 • SEBs’ restructuring should reduce the risk of delays in
receivables • On the back of the 13% fall in the share price over the past six
months, we are upgrading our rating to Buy
Source: Daiwa forecasts
Source: FactSet, Daiwa forecasts
Utilities / India
NTPCNTPC IN
Target (INR): 178.00 178.00Upside: 22.0%15 Mar price (INR): 145.90
Buy (from Outperform)
OutperformHoldUnderperformSell
1
2
3
4
5
Forecast revisions (%)Year to 31 Mar 13E 14E 15ERevenue change - - -Net profit change - - -Core EPS (FD) change - - -
70
78
85
93
100
140
150
160
170
180
Mar-12 Jun-12 Sep-12 Dec-12 Mar-13
Share price performance
NTPC (LHS)Relative to SENSEX Index (RHS)
(INR) (%)
12-month range 141.05-175.25Market cap (USDbn) 22.263m avg daily turnover (USDm) 18.90Shares outstanding (m) 8,245Major shareholder President of India (75.0%)
Financial summary (INR)Year to 31 Mar 13E 14E 15ERevenue (m) 664,571 735,908 797,172Operating profit (m) 130,579 147,283 164,134Net profit (m) 103,363 113,420 122,185Core EPS (fully-diluted) 12.536 13.755 14.818EPS change (%) 19.4 9.7 7.7Daiwa vs Cons. EPS (%) 2.9 3.4 5.5PER (x) 11.6 10.6 9.8Dividend yield (%) 3.0 3.3 3.9DPS 4.387 4.814 5.631PBR (x) 1.5 1.4 1.3EV/EBITDA (x) 9.7 8.7 7.9ROE (%) 13.5 13.7 13.6
Saurabh Mehta(91) 22 6622 1009

India Power Utilities & Capital Goods Sectors 18 March 2013
- 33 -
Key assumptions
Profit and loss (INRm)
Cash flow (INRm)
Source: FactSet, Daiwa forecasts
Year to 31 Mar 2008 2009 2010 2011 2012 2013E 2014E 2015EGross Commercial Generation (Bu's) 200 206 218 220 222 241 259 272Avg. Tariff (Rs/KWh) 1.97 2.16 2.25 2.65 3.04 2.95 3.04 3.14Coal Cost (Rs/KwH) 0.87 1.04 1.17 1.45 1.72 1.60 1.62 1.66PLF-Coal (%) 92.7 91.4 91.2 88.4 86.1 85.2 85.1 85.1PLF-Gas (%) 69.4 68.1 79.6 72.9 66.4 70.0 70.0 70.0PLF-Hydro (%) 0.0 0.0 0.0 0.0 0.0 0.0 0.0 55.0Commercial capacity standalone 25,850 27,850 28,840 29,830 30,990 34,810 36,310 38,280
Year to 31 Mar 2008 2009 2010 2011 2012 2013E 2014E 2015EEnergy Sales Revenues 370,910 419,752 463,777 549,387 612,256 664,571 735,908 797,172n.a. n.a. n.a. n.a. n.a. n.a. n.a. n.a. n.a.Other Revenue n.a. n.a. n.a. n.a. n.a. n.a. n.a. n.a.Total Revenue 370,910 419,752 463,777 549,387 612,256 664,571 735,908 797,172Other income 0 0 0 0 0 0 0 0COGS (239,162) (295,738) (318,751) (381,635) (447,259) (456,341) (497,479) (529,803)SG&A (23,572) (25,025) (27,950) (33,705) (35,912) (44,081) (50,756) (57,353)Other op.expenses (21,385) (23,645) (26,501) (24,857) (27,917) (33,570) (40,390) (45,883)Operating profit 86,791 75,344 90,576 109,190 101,168 130,579 147,283 164,134Net-interest inc./(exp.) 17,079 17,245 13,234 6,814 7,338 (1,260) (6,225) (13,938)Assoc/forex/extraord./others (1,321) 1,006 5,045 4,492 14,756 8,498 10,169 12,717Pre-tax profit 102,549 93,595 108,855 120,496 123,262 137,817 151,227 162,913Tax (28,401) (11,582) (21,573) (29,470) (31,024) (34,454) (37,807) (40,728)Min. int./pref. div./others 0 0 0 0 0 0 0 0Net profit (reported) 74,148 82,013 87,282 91,026 92,237 103,363 113,420 122,185Net profit (adjusted) 76,900 83,172 86,485 90,082 86,595 103,363 113,420 122,185EPS (reported)(INR) 8.993 9.946 10.585 11.040 11.186 12.536 13.755 14.818EPS (adjusted)(INR) 9.326 10.087 10.489 10.925 10.502 12.536 13.755 14.818EPS (adjusted fully-diluted)(INR) 9.326 10.087 10.489 10.925 10.502 12.536 13.755 14.818DPS (INR) 3.500 3.600 3.800 3.800 4.000 4.387 4.814 5.631EBIT 86,791 75,344 90,576 109,190 101,168 130,579 147,283 164,134EBITDA 108,176 98,989 117,076 134,047 129,085 164,149 187,673 210,016
Year to 31 Mar 2008 2009 2010 2011 2012 2013E 2014E 2015EProfit before tax 102,549 93,595 108,855 120,496 123,262 137,817 151,227 162,913Depreciation and amortisation 21,385 23,645 26,501 24,857 27,917 33,570 40,390 45,883Tax paid (28,401) (11,582) (21,573) (29,470) (31,024) (34,454) (37,807) (40,728)Change in working capital (8,439) (12,776) (16,299) (5,373) (7,929) 5,382 (12,598) 2,927Other operational CF items (17,079) (17,245) (13,234) (6,814) (7,338) 1,260 6,225 13,938Cash flow from operations 70,015 75,637 84,250 103,696 104,888 143,575 147,437 184,932Capex (82,232) (131,351) (101,932) (131,066) (151,127) (160,978) (135,594) (162,146)Net (acquisitions)/disposals 8,271 12,837 (8,236) 24,623 11,385 7,039 8,515 9,228Other investing CF items 0 0 0 0 0 0 0 0Cash flow from investing (73,961) (118,514) (110,168) (106,443) (139,743) (153,939) (127,079) (152,918)Change in debt 27,062 73,772 32,292 53,912 70,911 70,253 34,533 52,023Net share issues/(repurchases) 34 2 0 2 13 0 0 0Dividends paid (33,764) (34,718) (36,639) (36,513) (41,146) (37,902) (45,193) (52,221)Other financing CF items 9,721 (40) (1,090) (4,211) (2,653) 0 0 0Cash flow from financing 3,053 39,016 (5,437) 13,191 27,126 32,350 (10,660) (198)Forex effect/others 0 0 0 0 0 0 0 0Change in cash (893) (3,861) (31,355) 10,444 (7,729) 21,987 9,697 31,816Free cash flow (12,217) (55,714) (17,682) (27,370) (46,240) (17,403) 11,843 22,787
Financial summary

India Power Utilities & Capital Goods Sectors 18 March 2013
- 34 -
Balance sheet (INRm)
Key ratios (%)
Source: FactSet, Daiwa forecasts
Company profile
NTPC is India's largest power utility company, with operational capacity of 37GW and targets to add 14GW of capacity in 12th Five Year Plan. The company generates bulk electricity and in turn sells it to state electricity boards. It operates on regulated return business model, with a fixed ROE of 15.5%.
As at 31 Mar 2008 2009 2010 2011 2012 2013E 2014E 2015ECash & short-term investment 149,332 162,716 144,595 161,853 161,461 182,187 185,660 203,538Inventory 26,757 32,434 33,477 36,391 37,029 39,467 47,397 50,521Accounts receivable 29,827 35,842 66,514 79,635 114,486 91,037 100,809 98,282Other current assets 49,572 78,261 63,571 76,404 71,343 76,593 83,925 90,155Total current assets 255,488 309,253 308,157 354,283 384,319 389,284 417,791 442,495Fixed assets 485,720 593,426 668,656 775,066 898,276 1,025,684 1,120,888 1,237,151Goodwill & intangibles 0 0 0 0 0 0 0 0Other non-current assets 152,672 139,835 148,272 123,448 112,064 105,025 96,510 87,283Total assets 893,880 1,042,514 1,125,085 1,252,797 1,394,659 1,519,993 1,635,190 1,766,928Short-term debt 0 0 0 0 0 0 0 0Accounts payable 51,221 68,989 71,779 92,409 98,694 98,667 107,721 114,821Other current liabilities 28,078 37,897 35,802 38,635 51,965 45,678 49,919 54,212Total current liabilities 79,299 106,886 107,581 131,044 150,659 144,345 157,639 169,032Long-term debt 271,906 345,678 377,970 431,882 502,794 573,047 607,580 659,602Other non-current liabilities 16,289 16,249 15,159 10,948 8,295 8,295 8,295 8,295Total liabilities 367,494 468,813 500,710 573,875 661,748 725,686 773,514 836,930Share capital 82,455 82,455 82,455 82,455 82,455 82,455 82,455 82,455Reserves/R.E./others 443,931 491,246 541,920 596,468 650,457 711,852 779,221 847,544Shareholders' equity 526,386 573,701 624,375 678,923 732,912 794,307 861,676 929,999Minority interests 0 0 0 0 0 0 0 0Total equity & liabilities 893,880 1,042,514 1,125,085 1,252,797 1,394,659 1,519,993 1,635,190 1,766,928EV 1,325,587 1,385,975 1,436,388 1,473,043 1,544,346 1,593,872 1,624,933 1,659,078Net debt/(cash) 122,574 182,962 233,375 270,030 341,333 390,859 421,920 456,065BVPS (INR) 63.839 69.578 75.723 82.339 88.887 96.333 104.503 112.789
Year to 31 Mar 2008 2009 2010 2011 2012 2013E 2014E 2015ESales (YoY) 13.7 13.2 10.5 18.5 11.4 8.5 10.7 8.3EBITDA (YoY) 16.1 (8.5) 18.3 14.5 (3.7) 27.2 14.3 11.9Operating profit (YoY) 19.9 (13.2) 20.2 20.6 (7.3) 29.1 12.8 11.4Net profit (YoY) 7.8 8.2 4.0 4.2 (3.9) 19.4 9.7 7.7Core EPS (fully-diluted) (YoY) 7.8 8.2 4.0 4.2 (3.9) 19.4 9.7 7.7Gross-profit margin 35.5 29.5 31.3 30.5 26.9 31.3 32.4 33.5EBITDA margin 29.2 23.6 25.2 24.4 21.1 24.7 25.5 26.3Operating-profit margin 23.4 17.9 19.5 19.9 16.5 19.6 20.0 20.6Net profit margin 20.7 19.8 18.6 16.4 14.1 15.6 15.4 15.3ROAE 15.2 15.1 14.4 13.8 12.3 13.5 13.7 13.6ROAA 9.0 8.6 8.0 7.6 6.5 7.1 7.2 7.2ROCE 11.4 8.8 9.4 10.3 8.6 10.0 10.4 10.7ROIC 10.1 9.4 9.0 9.1 7.5 8.7 8.9 9.2Net debt to equity 23.3 31.9 37.4 39.8 46.6 49.2 49.0 49.0Effective tax rate 27.7 12.4 19.8 24.5 25.2 25.0 25.0 25.0Accounts receivable (days) 20.8 28.6 40.3 48.5 57.9 56.4 47.6 45.6Current ratio (x) 3.2 2.9 2.9 2.7 2.6 2.7 2.7 2.6Net interest cover (x) n.a. n.a. n.a. n.a. n.a. 103.6 23.7 11.8Net dividend payout 38.9 36.2 35.9 34.4 35.8 35.0 35.0 38.0Free cash flow yield n.a. n.a. n.a. n.a. n.a. n.a. 1.0 1.9
Financial summary continued …

India Power Utilities & Capital Goods Sectors 18 March 2013
- 35 -
NTPC: capacity-addition targets and achieved levels NTPC: 12th FYP capacity-addition targets and achieved levels
Source: Company
Note: 11th FYP target was later revised to 9,220MW, 12th FYP achievement is till 5 March 2013
Source: Company
Note: 12th FYP achievement is till 5 March 2013
NTPC: sourcing of fuel requirement (standalone) NTPC: coal mapping for standalone capacity addition
MWFSA
(m tonnes) New FSA
(m tonnes)
Captive coal
(m tonnes) Comment
Capacity till March 2009 (old FSA)
23,895 125 - - 114.7MT with CIL and 10.2MT with SCCL
Capacities between March 2009-March 2013 (with LoA)
6,460 - 28.4 - NTPC receiving coal under MOU route till new FSA is signed
Capacities between March 2013-March 2017 (with LoA)
4,070 - 16.6 -
Capacities between January 2013-March 2017 (without LoA)
2,480 - - 14 Supply expected to be met from ramp-up of captive mines
Total 36,905 125 45 14
Source: Company, Daiwa Source: Company, MOC, LoA
NTPC: status of mines
Mines Reserves
(m tonnes) PRC (m tonnes)
Approval of mining plan
Forest approval
Environmental approval
Land acquisition MDO
Start of production Remarks
Pakri Barwadih 1436 15 √ √ √ Not complete √ 2013 Media reports suggest that work has been stalled at the site since February 2012 due to opposition from local people.
Chatti - Bariatu 243 7 √ √ √ Not complete In principle approved by
board
x The MOC reversed its de-allocation of the mine on 22 January 2013.
Kerandari 229 6 √ √ √ Not complete x x The MOC reversed its de-allocation of the mine on 22 January 2013.
Dulanga 195 7 √ x x Not complete Tendering in process
x In-principle environmental approval given on 22 March 2012 (formal approval post Stage-1 forest approval).
Talaipalli 1267 18 x x √ Not complete √ x Environmental approval given on 2 January 2013. Chatti - Bariatu (South)
354 n.a. x x x x x x The MOC reversed its de-allocation of the mine on 22 January 2013.
Brahmini 1900 n.a. x x x x x x Still under exploration Chichro Patsimal 356 n.a. x x x x x x Still under exploration Total 5980 Source: Company
Note: MDO – mine development operator
9,370
22,430
14,038
7,155 9,610
3,160 0
5,000
10,000
15,000
20,000
25,000
10th FYP 11th FYP 12th FYP
Target Achievement
(MW)
4,170
2,718
3,230 3,120
800
3,160
0500
1,0001,5002,0002,5003,0003,5004,0004,500
FY13E FY14E FY15E FY16E FY17E
FYP target Achievement
(MW)
129 136 148 153 157 158
3 7 12 21
12 15 13 12 11 9
0
50
100
150
200
FY12 FY13E FY14E FY15E FY16E FY17E
Domestic Captive Imported
141 151164 172 180 188(m tonnes)
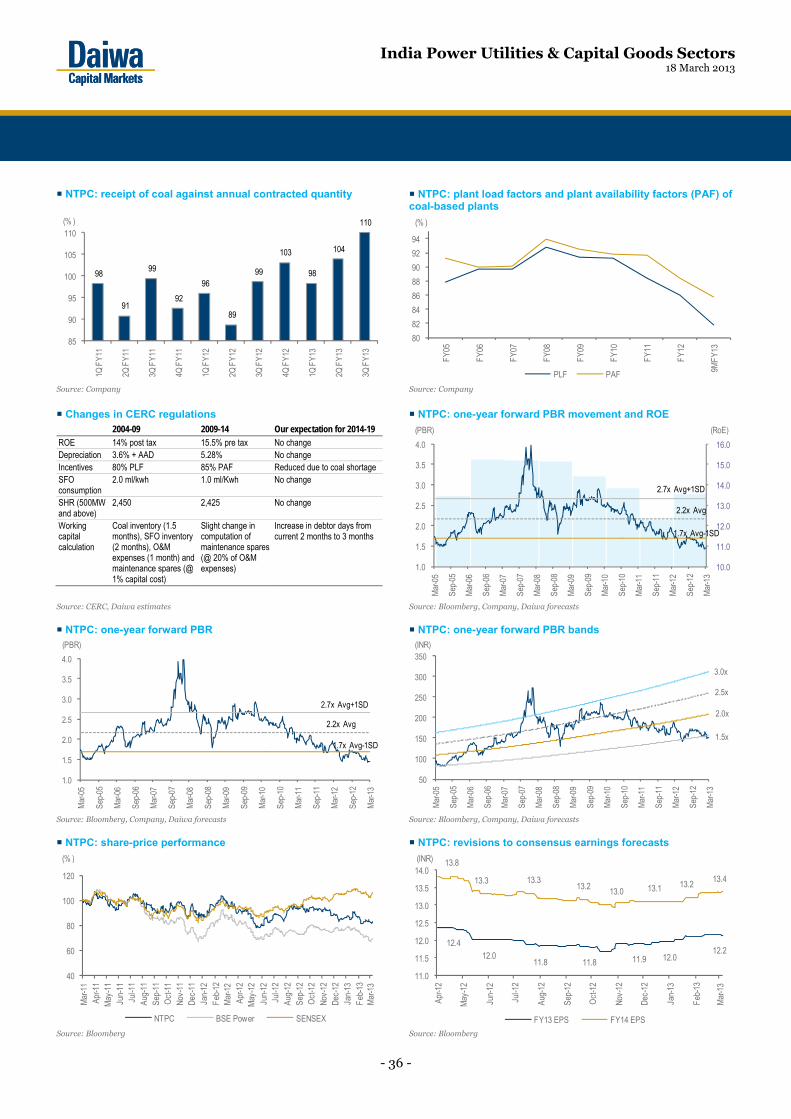
India Power Utilities & Capital Goods Sectors 18 March 2013
- 36 -
NTPC: receipt of coal against annual contracted quantity NTPC: plant load factors and plant availability factors (PAF) of coal-based plants
Source: Company Source: Company
Changes in CERC regulations NTPC: one-year forward PBR movement and ROE 2004-09 2009-14 Our expectation for 2014-19
ROE 14% post tax 15.5% pre tax No change Depreciation 3.6% + AAD 5.28% No change Incentives 80% PLF 85% PAF Reduced due to coal shortage SFO consumption
2.0 ml/kwh 1.0 ml/Kwh No change
SHR (500MW and above)
2,450 2,425 No change
Working capital calculation
Coal inventory (1.5 months), SFO inventory (2 months), O&M expenses (1 month) and maintenance spares (@ 1% capital cost)
Slight change in computation of maintenance spares (@ 20% of O&M expenses)
Increase in debtor days from current 2 months to 3 months
Source: CERC, Daiwa estimates Source: Bloomberg, Company, Daiwa forecasts
NTPC: one-year forward PBR NTPC: one-year forward PBR bands
Source: Bloomberg, Company, Daiwa forecasts Source: Bloomberg, Company, Daiwa forecasts
NTPC: share-price performance NTPC: revisions to consensus earnings forecasts
Source: Bloomberg Source: Bloomberg
98
91
99
92
96
89
99
103
98
104
110
85
90
95
100
105
110
1Q F
Y11
2Q F
Y11
3Q F
Y11
4Q F
Y11
1Q F
Y12
2Q F
Y12
3Q F
Y12
4Q F
Y12
1Q F
Y13
2Q F
Y13
3Q F
Y13
(% )
80
82
84
86
88
90
92
94
FY05
FY06
FY07
FY08
FY09
FY10
FY11
FY12
9MFY
13
PLF PAF
(% )
10.0
11.0
12.0
13.0
14.0
15.0
16.0
1.0
1.5
2.0
2.5
3.0
3.5
4.0M
ar-0
5
Sep-
05
Mar
-06
Sep-
06
Mar
-07
Sep-
07
Mar
-08
Sep-
08
Mar
-09
Sep-
09
Mar
-10
Sep-
10
Mar
-11
Sep-
11
Mar
-12
Sep-
12
Mar
-13
2.7x Avg+1SD
1.7x Avg-1SD
2.2x Avg
(PBR) (RoE)
1.0
1.5
2.0
2.5
3.0
3.5
4.0
Mar
-05
Sep-
05
Mar
-06
Sep-
06
Mar
-07
Sep-
07
Mar
-08
Sep-
08
Mar
-09
Sep-
09
Mar
-10
Sep-
10
Mar
-11
Sep-
11
Mar
-12
Sep-
12
Mar
-13
2.7x Avg+1SD
1.7x Avg-1SD
2.2x Avg
(PBR)
50
100
150
200
250
300
350
Mar
-05
Sep-
05
Mar
-06
Sep-
06
Mar
-07
Sep-
07
Mar
-08
Sep-
08
Mar
-09
Sep-
09
Mar
-10
Sep-
10
Mar
-11
Sep-
11
Mar
-12
Sep-
12
Mar
-13
3.0x
2.0x
2.5x
1.5x
(INR)
40
60
80
100
120
Mar
-11
Apr-1
1M
ay-1
1Ju
n-11
Jul-1
1Au
g-11
Sep-
11O
ct-1
1No
v-11
Dec-
11Ja
n-12
Feb-
12M
ar-1
2Ap
r-12
May
-12
Jun-
12Ju
l-12
Aug-
12Se
p-12
Oct
-12
Nov-
12De
c-12
Jan-
13Fe
b-13
Mar
-13
NTPC BSE Power SENSEX
(% )
12.4 12.0
11.8 11.8 11.9 12.0 12.2
13.8
13.3 13.3 13.2
13.0 13.1 13.2 13.4
11.0
11.5
12.0
12.5
13.0
13.5
14.0
Apr-1
2
May
-12
Jun-
12
Jul-1
2
Aug-
12
Sep-
12
Oct
-12
Nov-
12
Dec-
12
Jan-
13
Feb-
13
Mar
-13
FY13 EPS FY14 EPS
(INR)

See important disclosures, including any required research certifications, beginning on page 73
■ What's new We believe Larsen & Toubro (L&T) appears best-positioned in the capital goods space to capitalise on a likely revival in the industrial capex cycle. L&T posted strong revenue growth of 17% YoY for 9M FY13 and maintained robust order inflow of INR60bn, up 22% YoY, despite the challenging macro climate. ■ What's the impact We forecast the company to see INR893bn worth of new orders in FY14 (up 15% YoY), driven by the railways, power, and oil and gas sectors. Further orders could come from the fertiliser sector, which is benefiting from government policy changes. In addition, increased local sourcing in defence contracts could be the next demand driver. After adjusting up our YoY order-inflow growth assumption for FY14 (to 15% from 10%), we raise our FY14-15 revenue and earnings forecasts. A pick-up in order inflows has in the
past been followed by upward revisions to the Bloomberg-consensus earnings forecasts. L&T is looking to divest its infrastructure assets, which would free up the company’s balance sheet (equity invested at INR49bn and a further equity investment of INR93bn). Also, a few of these assets are loss-making, so selling them would lead to an improvement in the consolidated ROE. ■ What we recommend L&T remains our preferred pick in the capital goods space, as we believe that against the current macroeconomic backdrop, diversified players, such as L&T, will be the primary beneficiaries of a likely revival in industrial capex. With the share price having fallen by 8% over the past three months, the stock is trading at a 30% discount to its average PER over the past seven years. We upgrade our rating to Buy (1) from Outperform (2). We raise our SOTP-based six-month target price to INR1,830 (from INR1,780). We assign a target FY14E PER of 18x to the company’s core business (parent company), a mid-cycle multiple for the stock. A risk would be a further slowdown in capex, prompted by a deterioration in the macroeconomic environment, leading to lower order-inflow growth than we expect.
■ How we differ Our FY15E EPS is 2.7% below the consensus forecast, likely due to our lower EBITDA-margin expectations.
Industrials / IndiaLT IN
18 March 2013
Larsen & Toubro
Remains best positioned
• Best-positioned to benefit from a revival in industrial capex • Over the near term, we expect it to win DFC, metro rail line,
fertiliser, and power orders • Upgrade to Buy following the 8% drop in the share price over
the past three months
Source: Daiwa forecasts
Source: FactSet, Daiwa forecasts
Industrials / India
Larsen & ToubroLT IN
Target (INR): 1,780.00 1,830.00Upside: 21.5%15 Mar price (INR): 1,506.50
Buy (from Outperform)
OutperformHoldUnderperformSell
1
2
3
4
5
Forecast revisions (%)Year to 31 Mar 13E 14E 15ERevenue change - 1.9 2.9Net profit change 0.8 3.1 4.3Core EPS (FD) change 0.8 3.1 4.3
85
94
103
111
120
1,100
1,263
1,425
1,588
1,750
Mar-12 Jun-12 Sep-12 Dec-12 Mar-13
Share price performance
Lars & Tou (LHS)Relative to SENSEX Index (RHS)
(INR) (%)
12-month range 1,134.50-1,712.40Market cap (USDbn) 17.073m avg daily turnover (USDm) 47.10Shares outstanding (m) 612Major shareholder Insurance Corporation of India (19.3%)
Financial summary (INR)Year to 31 Mar 13E 14E 15ERevenue (m) 619,167 709,550 805,958Operating profit (m) 63,583 71,194 78,696Net profit (m) 47,100 52,589 58,786Core EPS (fully-diluted) 76.910 85.873 95.994EPS change (%) 7.0 11.7 11.8Daiwa vs Cons. EPS (%) (1.1) 0.3 (2.7)PER (x) 19.6 17.5 15.7Dividend yield (%) 1.0 1.0 1.0DPS 15.500 15.500 15.500PBR (x) 3.2 2.8 2.4EV/EBITDA (x) 13.4 11.8 10.6ROE (%) 17.4 17.0 16.6
Saurabh Mehta(91) 22 6622 1009

India Power Utilities & Capital Goods Sectors 18 March 2013
- 38 -
Key assumptions
Profit and loss (INRm)
Cash flow (INRm)
Source: FactSet, Daiwa forecasts
Year to 31 Mar 2008 2009 2010 2011 2012 2013E 2014E 2015ENew order growth (YoY%) 37.3 22.9 34.8 14.7 (11.5) 10.0 15.0 10.0Order book growth (YoY%) 42.8 33.4 42.6 29.9 11.9 10.8 11.3 9.7E&C - EBIT Margins (%) 12.2 12.3 12.8 12.6 11.5 11.3 11.0 10.8
Year to 31 Mar 2008 2009 2010 2011 2012 2013E 2014E 2015EE&C Revenues 191,780 282,000 319,884 379,116 467,681 544,470 628,459 717,842EBG Revenues 25,986 26,607 28,293 29,982 32,505 35,830 39,413 43,354Other Revenue 31,012 30,657 22,171 29,961 31,519 38,866 41,678 44,761Total Revenue 248,779 339,264 370,348 439,059 531,705 619,167 709,550 805,958Other income 0 0 0 0 0 0 0 0COGS (191,305) (262,320) (284,536) (334,584) (410,014) (478,616) (549,191) (626,229)SG&A (11,870) (13,870) (11,323) (12,923) (14,198) (17,337) (19,867) (22,567)Other op.expenses (19,361) (27,579) (30,893) (41,149) (51,661) (59,632) (69,296) (78,466)Operating profit 26,244 35,495 43,597 50,404 55,832 63,583 71,194 78,696Net-interest inc./(exp.) (382) (1,784) (3,769) (2,833) (972) (1,553) (1,426) (231)Assoc/forex/extraord./others 5,695 13,417 20,336 11,445 8,243 8,268 8,722 9,276Pre-tax profit 31,557 47,129 60,164 59,015 63,103 70,298 78,491 87,741Tax (9,821) (12,312) (16,409) (19,436) (18,538) (23,198) (25,902) (28,954)Min. int./pref. div./others 0 0 0 0 0 0 0 0Net profit (reported) 21,736 34,817 43,755 39,579 44,565 47,100 52,589 58,786Net profit (adjusted) 21,736 27,092 30,342 36,250 44,015 47,100 52,589 58,786EPS (reported)(INR) 35.494 56.853 71.449 64.629 72.771 76.910 85.873 95.994EPS (adjusted)(INR) 35.494 44.239 49.546 59.193 71.873 76.910 85.873 95.994EPS (adjusted fully-diluted)(INR) 35.494 44.239 49.546 59.193 71.873 76.910 85.873 95.994DPS (INR) 8.088 10.042 12.292 14.416 16.500 15.500 15.500 15.500EBIT 26,244 35,495 43,597 50,404 55,832 63,583 71,194 78,696EBITDA 28,266 38,324 47,394 56,396 62,826 71,204 80,179 88,655
Year to 31 Mar 2008 2009 2010 2011 2012 2013E 2014E 2015EProfit before tax 31,557 47,129 60,164 59,015 63,103 70,298 78,491 87,741Depreciation and amortisation 2,116 3,060 4,146 5,992 6,995 7,622 8,985 9,960Tax paid (9,883) (8,731) (15,193) (20,013) (21,854) (23,198) (25,902) (28,954)Change in working capital (3,767) (20,487) 17,582 (2,602) (35,077) (28,501) (10,626) (24,571)Other operational CF items (2,870) (2,476) (12,214) 340 (452) 1,553 1,426 231Cash flow from operations 17,153 18,495 54,485 42,732 12,715 27,773 52,374 44,406Capex (16,221) (19,798) (15,598) (15,187) (15,971) (20,000) (15,000) (15,000)Net (acquisitions)/disposals (38,326) 822 (40,306) (6,041) (9,799) (6,894) (9,581) (12,490)Other investing CF items 2,129 (14,110) (4,814) (2,872) 6,547 6,162 7,465 9,579Cash flow from investing (52,419) (33,085) (60,717) (24,100) (19,223) (20,732) (17,117) (17,912)Change in debt 16,934 23,565 3,436 (214) 23,869 6,392 10,463 11,161Net share issues/(repurchases) 17,016 230 21,327 3,473 1,926 0 0 0Dividends paid (1,335) (5,054) (7,192) (8,670) (9,996) (11,106) (11,106) (11,106)Other financing CF items (948) (2,333) (5,116) (5,837) (5,644) (7,714) (8,891) (9,810)Cash flow from financing 31,667 16,408 12,455 (11,248) 10,156 (12,429) (9,534) (9,755)Forex effect/others 0 0 0 0 0 0 0 0Change in cash (3,599) 1,818 6,223 7,384 3,649 (5,388) 25,723 16,739Free cash flow 932 (1,303) 38,887 27,545 (3,256) 7,773 37,374 29,406
Financial summary

India Power Utilities & Capital Goods Sectors 18 March 2013
- 39 -
Balance sheet (INRm)
Key ratios (%)
Source: FactSet, Daiwa forecasts
Company profile
L&T is an engineering & construction (E&C) conglomerate. The company has varied interests in the IT-services and financial-services sectors. For FY12, the company recorded revenue of INR532bn and a net profit of INR45bn for the standalone business.
As at 31 Mar 2008 2009 2010 2011 2012 2013E 2014E 2015ECash & short-term investment 54,653 58,537 98,367 88,019 86,740 74,761 94,565 105,977Inventory 12,684 14,705 14,154 15,772 17,766 21,074 21,725 26,924Accounts receivable 73,650 100,555 111,637 124,276 187,298 203,541 223,725 254,303Other current assets 67,157 111,467 123,507 192,745 210,457 239,688 277,204 311,392Total current assets 208,143 285,264 347,664 420,812 502,261 539,065 617,219 698,596Fixed assets 35,534 50,538 62,231 73,173 82,255 94,634 100,649 105,689Goodwill & intangibles 920 1,408 1,427 983 1,381 1,381 1,381 1,381Other non-current assets 26,075 35,723 56,124 78,996 96,136 109,621 125,122 142,940Total assets 270,672 372,933 467,446 573,963 682,034 744,701 844,371 948,606Short-term debt 35,840 54,060 47,528 48,592 71,783 87,174 97,637 108,798Accounts payable 54,611 68,752 95,485 136,675 167,781 187,658 215,538 245,652Other current liabilities 82,228 109,672 116,943 141,716 156,630 157,035 176,879 192,160Total current liabilities 172,678 232,484 259,957 326,984 396,194 431,868 490,054 546,609Long-term debt 0 11,500 20,480 23,019 27,175 18,175 18,175 18,175Other non-current liabilities 2,443 4,352 3,893 5,497 6,435 6,435 6,435 6,435Total liabilities 175,122 248,336 284,330 355,500 429,804 456,477 514,664 571,219Share capital 585 1,171 1,204 1,218 1,225 1,225 1,225 1,225Reserves/R.E./others 94,966 123,426 181,912 217,245 251,005 286,999 328,482 376,163Shareholders' equity 95,551 124,597 183,116 218,463 252,230 288,224 329,707 377,387Minority interests 0 0 0 0 0 0 0 0Total equity & liabilities 270,672 372,933 467,446 573,963 682,034 744,701 844,371 948,606EV 903,766 929,602 892,220 906,172 934,797 953,167 943,826 943,575Net debt/(cash) (18,813) 7,023 (30,359) (16,407) 12,218 30,588 21,247 20,996BVPS (INR) 156.027 203.457 299.015 356.733 411.872 470.647 538.386 616.244
Year to 31 Mar 2008 2009 2010 2011 2012 2013E 2014E 2015ESales (YoY) 41.3 36.4 9.2 18.6 21.1 16.4 14.6 13.6EBITDA (YoY) 58.8 35.6 23.7 19.0 11.4 13.3 12.6 10.6Operating profit (YoY) 62.8 35.3 22.8 15.6 10.8 13.9 12.0 10.5Net profit (YoY) 54.9 24.6 12.0 19.5 21.4 7.0 11.7 11.8Core EPS (fully-diluted) (YoY) 54.9 24.6 12.0 19.5 21.4 7.0 11.7 11.8Gross-profit margin 23.1 22.7 23.2 23.8 22.9 22.7 22.6 22.3EBITDA margin 11.4 11.3 12.8 12.8 11.8 11.5 11.3 11.0Operating-profit margin 10.5 10.5 11.8 11.5 10.5 10.3 10.0 9.8Net profit margin 8.7 8.0 8.2 8.3 8.3 7.6 7.4 7.3ROAE 28.4 24.6 19.7 18.1 18.7 17.4 17.0 16.6ROAA 9.8 8.4 7.2 7.0 7.0 6.6 6.6 6.6ROCE 25.0 22.1 19.8 18.6 17.4 17.1 17.0 16.6ROIC 28.3 25.2 22.3 19.1 16.9 14.6 14.2 14.1Net debt to equity net cash 5.6 net cash net cash 4.8 10.6 6.4 5.6Effective tax rate 31.1 26.1 27.3 32.9 29.4 33.0 33.0 33.0Accounts receivable (days) 94.4 93.7 104.6 98.1 106.9 115.2 109.9 108.2Current ratio (x) 1.2 1.2 1.3 1.3 1.3 1.2 1.3 1.3Net interest cover (x) 68.7 19.9 11.6 17.8 57.5 41.0 49.9 340.5Net dividend payout 22.8 17.7 17.2 22.3 22.7 20.2 18.0 16.1Free cash flow yield 0.1 n.a. 4.2 3.0 n.a. 0.8 4.1 3.2
Financial summary continued …

India Power Utilities & Capital Goods Sectors 18 March 2013
- 40 -
L&T: order inflows L&T: order inflow by sector
Source: Company, Daiwa forecasts
Source: Company
L&T: order book L&T: order-book to bill ratio
Source: Company, Daiwa forecasts
Source: Company, Daiwa forecasts
L&T: order book by sector L&T: revenue mix (products) and growth YoY
Source: Company
Source: Company
149 224
306 420
516
696 798
706 776
893
(20)
(10)
0
10
20
30
40
50
60
0
200
400
600
800
1,000
FY05
FY06
FY07
FY08
FY09
FY10
FY11
FY12
FY13
E
FY14
E
Order inflows (LHS) % growth YoY (RHS)
INRbn %
14 10 14 15 16 13 16 11 4 6
19 26 15 25
12 20 7 11 12 12
15 10 12
14 25
33 32
21 24 23
30 30 42 31 39
27 38
48 52 51
22 24 17 15 8 7 7 9 8 8
0
20
40
60
80
100
FY05
FY06
FY07
FY08
FY09
FY10
FY11
FY12
FY13
E
FY14
E
Process Hydrocarbons Power Infrastructure Others
%
177 246 369
527 703
1,002
1,302 1,457
1,614 1,797
0200400600800
1,0001,2001,4001,6001,8002,000
FY05
FY06
FY07
FY08
FY09
FY10
FY11
FY12
FY13
E
FY14
E
INRbn
177 246 369
527 703
1,002
1,302 1,457
1,614 1,797
0.0
0.5
1.0
1.5
2.0
2.5
3.0
3.5
0
500
1,000
1,500
2,000FY
05
FY06
FY07
FY08
FY09
FY10
FY11
FY12
FY13
E
FY14
E
Order-book (LHS) Book-to-bill ratio (RHS)
INRbn x
14 11 12 14 16 16 16 15
20 25 19 23 14 15 12 10
8 5 16 16 22
30 32 28
35 35 39
36 41 33 36 43
23 24 14 11 7 6 4 4
0
20
40
60
80
100
FY05
FY06
FY07
FY08
FY09
FY10
FY11
FY12
Process Hydrocarbons Power Infrastructure Others
%
86 76 74 76 82 86 86 87 88 89
9 10 11 10 8 8 7 6 6 6 10 10 9 7 6 6 5 5 5 6 4 5 5 3 1 1 2 2 1
0
10
20
30
40
50
0
20
40
60
80
100
FY05
FY06
FY07
FY08
FY09
FY10
FY11
FY12
FY13
E
FY14
E
E&C (LHS) E&E (LHS) MIP (LHS)Others (LHS) % growth YoY (RHS)
% %
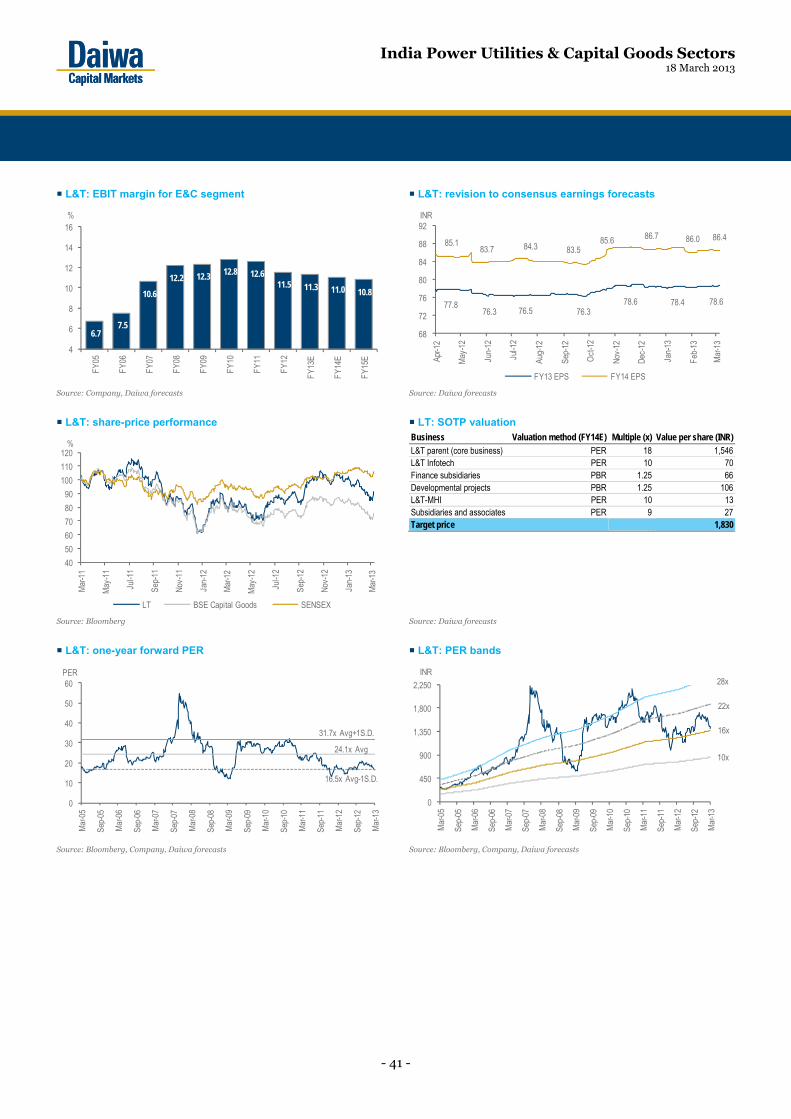
India Power Utilities & Capital Goods Sectors 18 March 2013
- 41 -
L&T: EBIT margin for E&C segment L&T: revision to consensus earnings forecasts
Source: Company, Daiwa forecasts Source: Daiwa forecasts
L&T: share-price performance LT: SOTP valuation
Business Valuation method (FY14E) Multiple (x) Value per share (INR)
L&T parent (core business) PER 18 1,546 L&T Infotech PER 10 70 Finance subsidiaries PBR 1.25 66 Developmental projects PBR 1.25 106 L&T-MHI PER 10 13 Subsidiaries and associates PER 9 27 Target price 1,830
Source: Bloomberg Source: Daiwa forecasts
L&T: one-year forward PER L&T: PER bands
Source: Bloomberg, Company, Daiwa forecasts Source: Bloomberg, Company, Daiwa forecasts
6.7 7.5
10.6
12.2 12.3 12.8 12.6 11.5 11.3 11.0 10.8
4
6
8
10
12
14
16
FY05
FY06
FY07
FY08
FY09
FY10
FY11
FY12
FY13
E
FY14
E
FY15
E
%
77.8 76.3 76.5 76.3
78.6 78.4 78.6
85.1 83.7 84.3 83.5
85.6 86.7 86.0 86.4
68
72
76
80
84
88
92
Apr-1
2
May
-12
Jun-
12
Jul-1
2
Aug-
12
Sep-
12
Oct
-12
Nov-
12
Dec-
12
Jan-
13
Feb-
13
Mar
-13
FY13 EPS FY14 EPS
INR
40
50
60
70
80
90
100
110
120
Mar
-11
May
-11
Jul-1
1
Sep-
11
Nov-
11
Jan-
12
Mar
-12
May
-12
Jul-1
2
Sep-
12
Nov-
12
Jan-
13
Mar
-13
LT BSE Capital Goods SENSEX
%
0
10
20
30
40
50
60
Mar
-05
Sep-
05
Mar
-06
Sep-
06
Mar
-07
Sep-
07
Mar
-08
Sep-
08
Mar
-09
Sep-
09
Mar
-10
Sep-
10
Mar
-11
Sep-
11
Mar
-12
Sep-
12
Mar
-13
PER
31.7x Avg+1S.D.
16.5x Avg-1S.D.
24.1x Avg
0
450
900
1,350
1,800
2,250
Mar
-05
Sep-
05
Mar
-06
Sep-
06
Mar
-07
Sep-
07
Mar
-08
Sep-
08
Mar
-09
Sep-
09
Mar
-10
Sep-
10
Mar
-11
Sep-
11
Mar
-12
Sep-
12
Mar
-13
INR
10x
16x
22x
28x

See important disclosures, including any required research certifications, beginning on page 73
■ What's new We expect delays in the execution of existing projects that affected BHEL’s 3Q FY13 performance, with revenue falling by 5% YoY and the EBITDA margin by 3.38pp YoY, to persist over the next few quarters. ■ What's the impact Weak order pipeline. With orders for the 12th Five Year Plan completed and a limited pipeline of 15GW over the next 12-18 months (and that only from state and central utilities, at which finalising orders often is delayed), competition from domestic suppliers looks set to increase (we forecast domestic capacity to increase from 10GW in FY08 to 33GW by FY14). We do not expect a revival in orders from the private sector until the issues related to fuel and environmental approvals are resolved and the current projects under execution become profitable. Order backlog risk. BHEL’s current order backlog of INR1,137bn
(down by 22% YoY), includes orders (about 12GW) placed by relatively inexperienced private players. These orders might face execution delays or cancellation given the headwinds faced by the power sector. Further, in a recent conference call, management highlighted cases, such as for Visa Power, when BHEL has been forced to suspend work due to mounting dues from the developer. EBITDA margin. We expect the EBITDA margin to remain under pressure, due to a fall in ASPs in recent orders, higher fixed costs due to a high installed capacity (20GW), and lower advances due to a decline in order inflows, leading to a rise in the working-capital requirement. Mainly as a result of revisions to our FY14-15 EBITDA-margin forecasts, we are cutting our net-profit forecasts by 5.9-11.4%. ■ What we recommend We maintain our Underperform (4) rating, as we believe the demand outlook remains weak and there is low visibility on FY13-14 orders, and competition for the limited number of orders is likely to remain fierce. We lower our six-month target price to INR184 (from INR192) based on a PER of 9x now applied to our FY14 (from FY13) EPS forecast. Risks to our view include better-than-expected order inflow over FY13-14.
■ How we differ Our FY13-14E EPS are 4-5% below consensus, due to our lower EBITDA-margin forecasts.
Industrials / IndiaBHEL IN
18 March 2013
Bharat Heavy Electricals
Reality still not fully reflected in the numbers
• Order inflow opportunity limited to about 15GW over the next 12-18 months, compared with its 20GW of installed capacity
• Risk of execution delays and cancellation to order backlog (about 12GW)
• Maintain Underperform (4) rating, lowering target price to INR184
Source: Daiwa forecasts
Source: FactSet, Daiwa forecasts
Industrials / India
Bharat Heavy ElectricalsBHEL IN
Target (INR): 192.00 184.00Downside: 7.1%15 Mar price (INR): 198.05
BuyOutperformHoldUnderperform (unchanged)
Sell
1
2
3
4
5
Forecast revisions (%)Year to 31 Mar 13E 14E 15ERevenue change - (3.8) (3.1)Net profit change - (5.9) (11.4)Core EPS (FD) change - (5.9) (11.4)
60
70
80
90
100
190
214
238
261
285
Mar-12 Jun-12 Sep-12 Dec-12 Mar-13
Share price performance
Brt Heavy (LHS)Relative to SENSEX Index (RHS)
(INR) (%)
12-month range 197.05-273.55Market cap (USDbn) 8.973m avg daily turnover (USDm) 15.05Shares outstanding (m) 2,448Major shareholder President of India (67.7%)
Financial summary (INR)Year to 31 Mar 13E 14E 15ERevenue (m) 488,693 473,397 452,615Operating profit (m) 81,250 68,176 59,697Net profit (m) 58,698 50,135 46,734Core EPS (fully-diluted) 23.982 20.483 19.094EPS change (%) (16.6) (14.6) (6.8)Daiwa vs Cons. EPS (%) (4.5) (4.6) n.a.PER (x) 8.3 9.7 10.4Dividend yield (%) 3.3 3.3 3.3DPS 6.500 6.500 6.500PBR (x) 1.6 1.5 1.4EV/EBITDA (x) 5.0 5.2 5.4ROE (%) 21.4 16.2 13.8
Saurabh Mehta(91) 22 6622 1009

India Power Utilities & Capital Goods Sectors 18 March 2013
- 43 -
Key assumptions
Profit and loss (INRm)
Cash flow (INRm)
Source: FactSet, Daiwa forecasts
Year to 31 Mar 2008 2009 2010 2011 2012 2013E 2014E 2015EValue of new contracts added (%) 43.8 16.5 (1.1) 2.5 (63.5) 66.0 (19.5) 11.7Orderbook (INRm) 822,855 1,138,740 1,387,125 1,556,093 1,281,836 1,145,832 954,723 819,908Book-to-Bill (x) 4.5 5.4 5.1 4.8 3.1 2.3 1.9 1.7Net Working Capital to revenue (%) (2.3) (6.2) 2.1 6.7 22.7 35.9 35.9 37.6
Year to 31 Mar 2008 2009 2010 2011 2012 2013E 2014E 2015EPower revenue 146,075 203,089 261,981 322,990 366,833 379,880 359,073 342,077Industry revenue 51,194 64,179 71,568 99,476 112,956 108,814 114,325 110,538Other Revenue 0 0 0 0 0 0 0 0Total Revenue 197,269 267,268 333,549 422,466 479,789 488,693 473,397 452,615Other income 0 0 0 0 0 0 0 0COGS (109,936) (164,685) (198,857) (230,817) (280,845) (295,659) (292,133) (282,024)SG&A (16,442) (18,358) (21,550) (25,361) (32,228) (36,652) (35,505) (33,946)Other op.expenses (36,448) (45,377) (58,522) (85,874) (75,643) (75,132) (77,583) (76,948)Operating profit 34,442 38,848 54,620 80,413 91,072 81,250 68,176 59,697Net-interest inc./(exp.) 5,159 7,388 7,745 5,721 7,626 2,251 2,858 6,407Assoc/forex/extraord./others 4,703 2,253 3,541 3,920 4,324 4,108 3,795 3,649Pre-tax profit 44,304 48,489 65,907 90,054 103,023 87,609 74,828 69,752Tax (15,711) (17,106) (22,800) (29,942) (32,623) (28,911) (24,693) (23,018)Min. int./pref. div./others 0 0 0 0 0 0 0 0Net profit (reported) 28,593 31,382 43,106 60,112 70,400 58,698 50,135 46,734Net profit (adjusted) 28,593 31,382 43,106 60,112 70,400 58,698 50,135 46,734EPS (reported)(INR) 11.682 12.822 17.612 24.560 28.763 23.982 20.483 19.094EPS (adjusted)(INR) 11.682 12.822 17.612 24.560 28.763 23.982 20.483 19.094EPS (adjusted fully-diluted)(INR) 11.682 12.822 17.612 24.560 28.763 23.982 20.483 19.094DPS (INR) 3.050 3.400 4.660 6.230 6.400 6.500 6.500 6.500EBIT 34,442 38,848 54,620 80,413 91,072 81,250 68,176 59,697EBITDA 37,414 42,190 59,200 85,854 99,072 89,975 78,109 70,150
Year to 31 Mar 2008 2009 2010 2011 2012 2013E 2014E 2015EProfit before tax 44,304 48,489 65,907 90,054 103,023 87,609 74,828 69,752Depreciation and amortisation 2,972 3,343 4,582 5,444 8,027 8,724 9,933 10,453Tax paid (22,733) (23,069) (19,035) (29,328) (31,832) (28,911) (24,693) (23,018)Change in working capital 18,638 11,986 (27,428) (40,247) (85,852) (68,394) 5,718 70Other operational CF items (13,915) (15,532) (16,257) (5,606) (9,640) (9,668) (10,568) (17,520)Cash flow from operations 29,266 25,217 7,769 20,318 (16,274) (10,639) 55,218 39,737Capex (6,976) (13,236) (17,137) (17,238) (12,979) (10,000) (6,500) (6,500)Net (acquisitions)/disposals 6 (434) (267) (3,585) (215) 10 10 10Other investing CF items 6 7 8 9 10 10 10 10Cash flow from investing (6,964) (13,663) (17,396) (20,814) (13,184) (9,980) (6,480) (6,480)Change in debt 51 526 (215) 351 286 0 0 0Net share issues/(repurchases) 0 0 0 0 0 0 0 0Dividends paid (8,589) (8,730) (10,879) (14,563) (17,937) (18,614) (18,614) (18,614)Other financing CF items 0 0 0 0 0 0 0 0Cash flow from financing (8,538) (8,204) (11,093) (14,212) (17,651) (18,614) (18,614) (18,614)Forex effect/others 0 0 0 0 0 0 0 0Change in cash 13,764 3,350 (20,720) (14,708) (47,110) (39,233) 30,124 14,643Free cash flow 22,290 11,981 (9,368) 3,080 (29,254) (20,639) 48,718 33,237
Financial summary

India Power Utilities & Capital Goods Sectors 18 March 2013
- 44 -
Balance sheet (INRm)
Key ratios (%)
Source: FactSet, Daiwa forecasts
Company profile
BHEL is India's largest engineering company in the power-equipment and industrial-systems segments. The company has a total installed capacity of 20GW. It also provides services to the process and hydro-carbon industries, as well as the defence sector and Indian Railways.
As at 31 Mar 2008 2009 2010 2011 2012 2013E 2014E 2015ECash & short-term investment 83,860 103,147 97,901 96,302 66,720 37,135 77,807 109,950Inventory 57,364 78,370 92,355 109,630 135,487 140,458 137,473 132,197Accounts receivable 119,749 159,755 206,888 273,546 357,406 334,721 298,305 285,209Other current assets 18,089 27,739 32,205 35,467 31,407 40,077 38,831 37,155Total current assets 279,062 369,011 429,348 514,945 591,019 552,391 552,416 564,511Fixed assets 16,393 26,274 39,450 51,631 56,662 57,937 54,504 50,551Goodwill & intangibles 0 0 0 0 0 0 0 0Other non-current assets 13,462 18,926 16,071 26,027 20,079 20,079 20,079 20,079Total assets 308,917 414,211 484,868 592,603 667,760 630,407 626,999 635,142Short-term debt 952 1,494 1,278 1,633 1,930 1,930 1,930 1,930Accounts payable 44,240 58,529 75,798 84,366 107,781 97,069 95,925 92,767Other current liabilities 155,983 224,801 248,619 305,065 304,317 237,592 203,807 186,987Total current liabilities 201,175 284,823 325,695 391,065 414,028 336,591 301,662 281,685Long-term debt 0 0 0 0 0 0 0 0Other non-current liabilities 0 0 0 0 0 0 0 0Total liabilities 201,175 284,823 325,695 391,065 414,028 336,591 301,662 281,685Share capital 4,895 4,895 4,895 4,895 4,895 4,895 4,895 4,895Reserves/R.E./others 102,847 124,493 154,278 196,643 248,837 288,921 320,442 348,562Shareholders' equity 107,742 129,388 159,174 201,538 253,732 293,816 325,337 353,457Minority interests 0 0 0 0 0 0 0 0Total equity & liabilities 308,917 414,211 484,868 592,603 667,760 630,407 626,999 635,142EV 401,839 383,094 388,124 390,079 419,957 449,542 408,870 376,727Net debt/(cash) (82,908) (101,653) (96,623) (94,668) (64,790) (35,205) (75,877) (108,020)BVPS (INR) 44.019 52.863 65.033 82.341 103.666 120.043 132.921 144.410
Year to 31 Mar 2008 2009 2010 2011 2012 2013E 2014E 2015ESales (YoY) 12.0 35.5 24.8 26.7 13.6 1.9 (3.1) (4.4)EBITDA (YoY) 3.8 12.8 40.3 45.0 15.4 (9.2) (13.2) (10.2)Operating profit (YoY) 3.4 12.8 40.6 47.2 13.3 (10.8) (16.1) (12.4)Net profit (YoY) 18.4 9.8 37.4 39.5 17.1 (16.6) (14.6) (6.8)Core EPS (fully-diluted) (YoY) 18.4 9.8 37.4 39.5 17.1 (16.6) (14.6) (6.8)Gross-profit margin 44.3 38.4 40.4 45.4 41.5 39.5 38.3 37.7EBITDA margin 19.0 15.8 17.7 20.3 20.6 18.4 16.5 15.5Operating-profit margin 17.5 14.5 16.4 19.0 19.0 16.6 14.4 13.2Net profit margin 14.5 11.7 12.9 14.2 14.7 12.0 10.6 10.3ROAE 29.2 26.5 29.9 33.3 30.9 21.4 16.2 13.8ROAA 10.6 8.7 9.6 11.2 11.2 9.0 8.0 7.4ROCE 34.9 32.4 37.5 44.2 39.7 29.5 21.9 17.5ROIC 80.1 95.7 79.1 63.4 42.1 24.3 18.0 16.2Net debt to equity net cash net cash net cash net cash net cash net cash net cash net cashEffective tax rate 35.5 35.3 34.6 33.2 31.7 33.0 33.0 33.0Accounts receivable (days) 199.7 190.9 200.6 207.5 240.0 258.5 244.0 235.3Current ratio (x) 1.4 1.3 1.3 1.3 1.4 1.6 1.8 2.0Net interest cover (x) n.a. n.a. n.a. n.a. n.a. n.a. n.a. n.a.Net dividend payout 26.1 26.5 26.5 25.4 22.3 27.1 31.7 34.0Free cash flow yield 4.6 2.5 n.a. 0.6 n.a. n.a. 10.1 6.9
Financial summary continued …

India Power Utilities & Capital Goods Sectors 18 March 2013
- 45 -
BHEL: annual order inflow (GW) India power equipment: annual capacity and orders (GW)
Source: Company, Daiwa forecasts Source: Company, Daiwa forecasts
BHEL: order backlog BHEL: revenue and net profit
Source: Company, Daiwa forecasts Source: Company, Daiwa forecasts
BHEL: EBITDA margin BHEL: working-capital requirement
Source: Company, Daiwa forecasts Source: Company, Daiwa forecasts
6
3
10
15
17 16 15
3
9
8 9
0
2
4
6
8
10
12
14
16
18
FY05
FY06
FY07
FY08
FY09
FY10
FY11
FY12
FY13
E
FY14
E
FY15
E
GWDecline in order inflows
6 3 10
15 19
20 19
7 10
12
0
5
10
15
20
25
30
35
FY05
FY06
FY07
FY08
FY09
FY10
FY11
FY12
FY13
E
FY14
E
Total Orders placed Total India Capacity
GW Increase in domestic capacity and decline in order inflows
320 376 550
852
1,170
1,443
1,641
1,353
1,146
955 820
0
200
400
600
800
1,000
1,200
1,400
1,600
1,800
FY05
FY06
FY07
FY08
FY09
FY10
FY11
FY12
FY13
E
FY14
E
FY15
E
INRbnDecline in orderbook
10 17 24
29 31
43
60
70
59 50 47
(10)
0
10
20
30
40
0
10
20
30
40
50
60
70
80FY
05
FY06
FY07
FY08
FY09
FY10
FY11
FY12
FY13
E
FY14
E
FY15
E
Net profit (LHS) Revenue growth YoY (RHS)
INRbnNet profit peaking Decline in revenue
%
16.8
19.0
20.5
19.0
15.8
17.7
20.3 20.6
18.4
16.515.5
10
12
14
16
18
20
22
FY05
FY06
FY07
FY08
FY09
FY10
FY11
FY12
FY13
E
FY14
E
FY15
E
% Decline in EBITDA margins
16.6 12.9
4.5
(2.3) (6.2)
2.1 6.7
22.7
35.9 35.9 37.6
(10)(5)
05
10152025303540
FY05
FY06
FY07
FY08
FY09
FY10
FY11
FY12
FY13
E
FY14
E
FY15
E
%
Negative working capital cycle with advances coming from high order inflow
Increased working capital requirement with low order inflows

India Power Utilities & Capital Goods Sectors 18 March 2013
- 46 -
BHEL: one-year forward PER BHEL: PER bands
Source: Bloomberg, Company, Daiwa forecasts Source: Bloomberg, Company, Daiwa forecasts
BHEL: EV/EBITDA bands BHEL: share-price performance
Source: Bloomberg Source: Bloomberg
Near-term ordering opportunity BHEL: consensus earnings-forecast revisions India: ordering opportunity over FY14
Project Configuration Total (MW)
Opportunity (INRbn) Remarks
Orders under award stage RVUNL, Suratgarh and Chabra 4x660MW 2,640 108 BHEL is L1, L&T is L2Orissa - IB valley 2x660MW 1,320 52.8 BHEL is L1, L&T is L2NTPC, Tanda 2x660MW 1,320 52.8 L&T L1
NTPC, Unchahhar 500MW 500 20 To be awarded to BHEL
on nomination basisTotal 5,780 233.6
Orders under finalisation NTPC, Khargaon 2x660MW 1,320 52.8 MPGENCO, Khandawa 2x660MW 1,320 52.8 TANGEDCO, Ennore 1x660MW 660 26.4 TNEB, Udangudi 2x660MW 1,320 52.8 MAHAGENCO, Nashik 1x660MW 660 26.4 MAHAGENCO, Bhusawal 1x800MW 800 32 NLC 2x500MW 1,000 40 AP 3x500MW 1,500 60
Total 8,580 343.2
Source: Bloomberg Source: Company, Daiwa
05
101520253035404550
Mar
-05
Sep-
05
Mar
-06
Sep-
06
Mar
-07
Sep-
07
Mar
-08
Sep-
08
Mar
-09
Sep-
09
Mar
-10
Sep-
10
Mar
-11
Sep-
11
Mar
-12
Sep-
12
Mar
-13
PER
25.5x Avg+1S.D.
18.5x Avg
11.5x Avg-1S.D.
0
100
200
300
400
500
600
Mar
-05
Sep-
05
Mar
-06
Sep-
06
Mar
-07
Sep-
07
Mar
-08
Sep-
08
Mar
-09
Sep-
09
Mar
-10
Sep-
10
Mar
-11
Sep-
11
Mar
-12
Sep-
12
Mar
-13
INR
10x
15x
20x
0
200
400
600
800
1,000
1,200
1,400
1,600
Mar
-05
Sep-
05
Mar
-06
Sep-
06
Mar
-07
Sep-
07
Mar
-08
Sep-
08
Mar
-09
Sep-
09
Mar
-10
Sep-
10
Mar
-11
Sep-
11
Mar
-12
Sep-
12
Mar
-13
INRbn
14x
11x
8x
5x
40
50
60
70
80
90
100
110
120M
ar-1
1Ap
r-11
May
-11
Jun-
11Ju
l-11
Aug-
11Se
p-11
Oct
-11
Nov-
11De
c-11
Jan-
12Fe
b-12
Mar
-12
A pr-1
2M
ay-1
2Ju
n-12
Jul-1
2Au
g-12
Sep-
12O
ct-1
2No
v-12
Dec-
12Ja
n-13
Feb-
13M
ar-1
3
BHEL BSE Capital Goods SENSEX
%
26.6 26.3 26.2 25.9 26.1 25.1
24.6 23.5 23.3 22.9
21.9 22.0 21.5 20
22
24
26
28
30
Apr-1
2
May
-12
Jun-
12
Jul-1
2
Aug-
12
Sep-
12
Oct
-12
Nov-
12
Dec-
12
Jan-
13
Feb-
13
Mar
-13
FY13 EPS FY14 EPS
INR

See important disclosures, including any required research certifications, beginning on page 73
■ What's new With a large restructuring cost (INR2.3bn for 9M FY13) behind it and the share price falling by 35% over the past year, we believe CRG’s valuations have bottomed out. ■ What's the impact After a dream run from FY04-11 (with a revenue CAGR of 32% and a PAT CAGR of 45% supported by a 5pp improvement in the EBITDA margins), CRG began to see considerable pressure in the domestic power-business margin (it halved from 18% for FY11 to 9% for 9M FY13), as well as losses in the international business (from a PAT of INR2.2bn for FY11 to a loss of INR2.8bn for 9M FY13) due to delays in the delivery of orders by customers, reworking and restructuring costs, which coincided with the change in management. In 4Q FY12, the management guided for a 4.5pp improvement in the EBITDA margin as a result of the
implementation of a three-year strategic plan. In line with that, the company largely completed the restructuring of its Belgium facility (at a cost of INR2.3bn in 9M FY13), shifting its manufacturing base from there to lower-cost Hungary (it also made provisions for EUR4m in liquidity damages as part of the restructuring costs) and reducing the workforce in Belgium. As a result of this, the company expects annual savings of EUR15m from FY14 onwards. Also, as a part of this strategy, CRG set up a low-cost sourcing office in China (fully functional from June 2012). ■ What we recommend With the share price having fallen by 33% over the past one year, the stock trading at 50% discount to its past-seven-year-average PER, and the large restructuring cost behind it, we upgrade our rating to Hold (3) from Underperform (4). However, we maintain our SOTP-based six-month target price of INR98, based on at target PER of 10x (unchanged) on our consolidated FY14 EPS forecast and INR7/share for its 25% stake in Avantha Power (Not listed). The downside risks to our call are continued losses in its international business, while upside catalysts include a recovery in prices and demand in the international power businesses.
■ How we differ We are less optimistic on the EBIT margin for the domestic T&D business for FY13-14 than the market.
Industrials / IndiaCRG IN
18 March 2013
Crompton Greaves
Not completely out of the woods
• Restructuring has been completed, in line with management’s three-year strategic plan to improve the EBITDA margin
• We continue to be concerned about the profitability of the international orders under execution (INR50.5bn)
• With a 33% fall in the share price over the past year, we upgrade our rating to Hold (3) from Underperform (4)
Source: Daiwa forecasts
Source: FactSet, Daiwa forecasts
Industrials / India
Crompton GreavesCRG IN
Target (INR): 98.00 98.00Upside: 0.6%15 Mar price (INR): 97.45
BuyOutperformHold (from Underperform)
UnderperformSell
1
2
3
4
5
Forecast revisions (%)Year to 31 Mar 13E 14E 15ERevenue change - - -Net profit change - - -Core EPS (FD) change - - -
55
68
80
93
105
90
105
120
135
150
Mar-12 Jun-12 Sep-12 Dec-12 Mar-13
Share price performance
Crompton G (LHS)Relative to SENSEX Index (RHS)
(INR) (%)
12-month range 90.75-146.40Market cap (USDbn) 1.163m avg daily turnover (USDm) 6.22Shares outstanding (m) 641Major shareholder Avantha Holdings (39.1%)
Financial summary (INR)Year to 31 Mar 13E 14E 15ERevenue (m) 125,325 141,984 151,969Operating profit (m) 3,136 8,430 9,736Net profit (m) 2,357 5,825 6,857Core EPS (fully-diluted) 3.674 9.080 10.690EPS change (%) (36.9) 147.1 17.7Daiwa vs Cons. EPS (%) n.a. n.a. n.a.PER (x) 26.5 10.7 9.1Dividend yield (%) 1.4 2.1 2.1DPS 1.400 2.000 2.000PBR (x) 1.7 1.5 1.3EV/EBITDA (x) 12.2 6.0 5.0ROE (%) 6.4 14.7 15.4
Saurabh Mehta(91) 22 6622 1009

India Power Utilities & Capital Goods Sectors 18 March 2013
- 48 -
Key assumptions
Profit and loss (INRm)
Cash flow (INRm)
Source: FactSet, Daiwa forecasts
Year to 31 Mar 2008 2009 2010 2011 2012 2013E 2014E 2015EOrderbook (INRm) 50,036 61,630 59,870 65,650 78,320 89,327 89,963 90,303Order inflows (INRm) 56,003 73,338 60,284 72,120 84,710 88,946 93,393 98,062Growth in order inflows YoY (%) 5.4 31.0 (17.8) 19.6 17.5 5.0 5.0 5.0Growth in orderbook YoY (%) 23.0 23.2 (2.9) 9.7 19.3 14.1 0.7 0.4
Year to 31 Mar 2008 2009 2010 2011 2012 2013E 2014E 2015EPower systems Revenues 46,661 61,744 62,044 65,027 73,035 77,938 92,757 97,722Industrial systems Revenues 9,398 11,188 12,212 14,501 17,871 19,052 21,260 23,494Other Revenue 12,264 14,441 17,153 20,523 21,579 28,335 27,967 30,753Total Revenue 68,323 87,373 91,409 100,051 112,486 125,325 141,984 151,969Other income 0 0 0 0 0 0 0 0COGS (53,615) (67,565) (69,097) (76,791) (93,702) (106,972) (116,244) (123,734)SG&A (7,249) (9,852) (9,542) (9,822) (10,747) (12,334) (14,027) (14,998)Other op.expenses (1,263) (1,216) (1,551) (1,936) (2,600) (2,884) (3,283) (3,502)Operating profit 6,197 8,740 11,219 11,502 5,437 3,136 8,430 9,736Net-interest inc./(exp.) (697) (641) (263) (208) (472) (617) (872) (781)Assoc/forex/extraord./others 653 573 1,287 617 533 (490) 780 832Pre-tax profit 6,152 8,672 12,243 11,910 5,497 2,028 8,338 9,788Tax (2,054) (3,047) (3,650) (3,100) (1,821) (878) (2,513) (2,930)Min. int./pref. div./others (31) (26) 6 77 60 0 0 0Net profit (reported) 4,067 5,599 8,599 8,887 3,736 1,150 5,825 6,857Net profit (adjusted) 4,067 5,599 8,599 8,887 3,736 2,357 5,825 6,857EPS (reported)(INR) 6.340 8.728 13.404 13.853 5.824 1.792 9.080 10.690EPS (adjusted)(INR) 6.340 8.728 13.404 13.853 5.824 3.674 9.080 10.690EPS (adjusted fully-diluted)(INR) 6.340 8.728 13.404 13.853 5.824 3.674 9.080 10.690DPS (INR) 0.914 1.143 1.257 2.200 1.400 1.400 2.000 2.000EBIT 6,197 8,740 11,219 11,502 5,437 3,136 8,430 9,736EBITDA 7,460 9,956 12,770 13,438 8,036 6,020 11,713 13,237
Year to 31 Mar 2008 2009 2010 2011 2012 2013E 2014E 2015EProfit before tax 6,152 8,672 12,243 11,910 5,497 2,028 8,338 9,788Depreciation and amortisation 1,263 1,216 1,551 1,936 2,600 2,884 3,283 3,502Tax paid (1,868) (2,165) (2,920) (3,343) (2,436) (878) (2,513) (2,930)Change in working capital (842) 59 543 (5,133) (2,277) (1,734) (711) (442)Other operational CF items 1,081 1,649 (505) (148) 749 1,824 872 781Cash flow from operations 5,786 9,430 10,911 5,222 4,133 4,125 9,269 10,698Capex (2,525) (1,977) (2,070) (6,259) (455) (12,616) (4,150) (4,142)Net (acquisitions)/disposals (257) (714) (2,025) (852) (830) 1,500 1,000 1,000Other investing CF items (687) (652) (1,656) (271) (3,338) 0 0 0Cash flow from investing (3,469) (3,343) (5,751) (7,382) (4,623) (11,116) (3,150) (3,142)Change in debt (908) (1,374) (2,169) (379) 4,227 6,012 (677) (1,268)Net share issues/(repurchases) 0 0 0 0 0 0 0 0Dividends paid (696) (814) (1,159) (1,195) (1,193) (1,044) (1,491) (1,491)Other financing CF items (684) (702) (451) (354) (553) (768) (961) (900)Cash flow from financing (2,289) (2,890) (3,778) (1,927) 2,482 4,200 (3,129) (3,659)Forex effect/others 0 0 0 0 0 0 0 0Change in cash 28 3,197 1,382 (4,087) 1,991 (2,791) 2,990 3,897Free cash flow 3,261 7,453 8,841 (1,037) 3,678 (8,491) 5,119 6,556
Financial summary

India Power Utilities & Capital Goods Sectors 18 March 2013
- 49 -
Balance sheet (INRm)
Key ratios (%)
Source: FactSet, Daiwa forecasts
Company profile
Crompton Greaves (CRG) is part of the Avantha Group. The company manufactures products for the Power T&D Sector, as well as industrial systems and consumer products. Through a series of acquisitions abroad and in India, CRG has built its product range across business segments. In FY12, it recorded revenue of INR112bn and a net profit of INR3.7bn.
As at 31 Mar 2008 2009 2010 2011 2012 2013E 2014E 2015ECash & short-term investment 3,107 7,051 9,741 7,057 10,033 5,893 7,972 10,988Inventory 10,664 10,949 10,412 11,893 12,233 14,662 15,392 16,397Accounts receivable 17,204 20,556 21,463 25,427 31,433 35,022 39,678 42,468Other current assets 3,704 4,537 2,455 5,192 6,703 7,375 8,105 8,543Total current assets 34,679 43,094 44,071 49,569 60,401 62,953 71,146 78,396Fixed assets 12,444 13,785 13,760 19,417 22,575 32,307 33,174 33,814Goodwill & intangibles 0 0 0 0 0 0 0 0Other non-current assets 860 759 2,433 2,514 3,320 3,320 3,320 3,320Total assets 47,983 57,639 60,265 71,500 86,296 98,579 107,640 115,529Short-term debt 8,420 7,182 5,010 4,703 10,440 16,453 15,775 14,507Accounts payable 12,229 15,884 14,865 17,457 19,143 21,981 24,204 25,764Other current liabilities 14,195 16,124 15,305 16,436 20,446 22,567 25,748 27,980Total current liabilities 34,843 39,190 35,179 38,596 50,030 61,000 65,727 68,251Long-term debt 0 0 0 0 0 0 0 0Other non-current liabilities 0 0 0 0 0 0 0 0Total liabilities 34,843 39,190 35,179 38,596 50,030 61,000 65,727 68,251Share capital 733 733 1,283 1,283 1,283 1,283 1,283 1,283Reserves/R.E./others 12,285 17,577 23,760 31,464 34,826 36,139 40,473 45,839Shareholders' equity 13,018 18,311 25,043 32,747 36,109 37,422 41,756 47,122Minority interests 123 139 43 157 157 157 157 157Total equity & liabilities 47,983 57,639 60,265 71,500 86,296 98,579 107,640 115,529EV 67,948 62,782 57,825 60,317 63,077 73,230 70,474 66,190Net debt/(cash) 5,312 131 (4,732) (2,354) 407 10,560 7,804 3,520BVPS (INR) 20.293 28.544 39.038 51.048 56.290 58.337 65.092 73.457
Year to 31 Mar 2008 2009 2010 2011 2012 2013E 2014E 2015ESales (YoY) 21.2 27.9 4.6 9.5 12.4 11.4 13.3 7.0EBITDA (YoY) 54.5 33.5 28.3 5.2 (40.2) (25.1) 94.6 13.0Operating profit (YoY) 60.0 41.0 28.4 2.5 (52.7) (42.3) 168.8 15.5Net profit (YoY) 44.4 37.7 53.6 3.3 (58.0) (36.9) 147.1 17.7Core EPS (fully-diluted) (YoY) 44.4 37.7 53.6 3.3 (58.0) (36.9) 147.1 17.7Gross-profit margin 21.5 22.7 24.4 23.2 16.7 14.6 18.1 18.6EBITDA margin 10.9 11.4 14.0 13.4 7.1 4.8 8.2 8.7Operating-profit margin 9.1 10.0 12.3 11.5 4.8 2.5 5.9 6.4Net profit margin 6.0 6.4 9.4 8.9 3.3 1.9 4.1 4.5ROAE 35.8 35.7 39.7 30.8 10.9 6.4 14.7 15.4ROAA 9.1 10.6 14.6 13.5 4.7 2.5 5.6 6.1ROCE 30.5 37.0 40.3 34.0 12.9 6.2 15.1 16.3ROIC 23.8 30.6 40.4 33.4 10.8 4.2 12.0 13.6Net debt to equity 40.8 0.7 net cash net cash 1.1 28.2 18.7 7.5Effective tax rate 33.4 35.1 29.8 26.0 33.1 43.3 30.1 29.9Accounts receivable (days) 83.9 78.9 83.9 85.5 92.3 96.8 96.0 98.6Current ratio (x) 1.0 1.1 1.3 1.3 1.2 1.0 1.1 1.1Net interest cover (x) 8.9 13.6 42.6 55.3 11.5 5.1 9.7 12.5Net dividend payout 14.4 13.1 9.4 15.9 24.0 78.1 22.0 18.7Free cash flow yield 5.2 11.9 14.1 n.a. 5.9 n.a. 8.2 10.5
Financial summary continued …

India Power Utilities & Capital Goods Sectors 18 March 2013
- 50 -
CRG: revenue mix and growth CRG: order-inflow mix and growth
Source: Company, Daiwa forecasts Source: Company, Daiwa forecasts
CRG: domestic power-business revenue and EBIT margin CRG: international power-business revenue and EBIT margin
Source: Company, Daiwa forecasts Source: Company, Daiwa forecasts
CRG: industrial-business revenue and EBIT margin CRG: consumer-business revenue and EBIT margin
Source: Company, Daiwa forecasts Source: Company, Daiwa forecasts
CRG: domestic business revenue and EBIT margin CRG: international business revenue and EBIT margin
Source: Company, Daiwa forecasts Source: Company, Daiwa forecasts
67 68 71 68 65 65 62 65 64
17 16 15 18 20 19 20 19 20
15 14 13 13 14 16 15 15 15 1 2 1 1 0 0 3 0 0
0
10
20
30
40
0
20
40
60
80
100
FY07
FY08
FY09
FY10
FY11
FY12
FY13
E
FY14
E
FY15
EPower systems (LHS) Consumer products (LHS)
Industrial systems (LHS) Others (LHS)% growth YoY (RHS)
(% ) (% )
49 58 53 41 49 52 52 51 51
36 28 35 44 33 34 33 33 33
15 15 12 16 18 14 15 16 17
(20)
20
60
100
140
180
0
20
40
60
80
100
FY07
FY08
FY09
FY10
FY11
FY12
FY13
E
FY14
E
FY15
E
International power systems (LHS) Domestic power systems (LHS)
Domestic industrial systems (LHS) % growth YoY (RHS)
(% ) (% )
18 18 22
25 26 29 29
35 36
-
5.0
10.0
15.0
20.0
05
10152025303540
FY07
FY08
FY09
FY10
FY11
FY12
FY13
E
FY14
E
FY15
E
Revenue (LHS) EBIT margin (RHS)
(INRbn) (% )
22 29
40 37 39 44 45
53 56
(8.0)(6.0)(4.0)(2.0)-2.0 4.0 6.0 8.0 10.0
0
10
20
30
40
50
60FY
07
FY08
FY09
FY10
FY11
FY12
FY13
E
FY14
E
FY15
E
Revenue (LHS) EBIT margin (RHS)
(INRbn) (% )
9 9 11 12
15
18 19 21
23
-
5.0
10.0
15.0
20.0
25.0
0
5
10
15
20
25
FY07
FY08
FY09
FY10
FY11
FY12
FY13
E
FY14
E
FY15
E
Revenue (LHS) EBIT margin (RHS)
(INRbn) (% )
10 11 13
16 20 21
25 28 30
-
2.0
4.0
6.0
8.0
10.0
12.0
14.0
16.0
0
5
10
15
20
25
30
35
FY07
FY08
FY09
FY10
FY11
FY12
FY13
E
FY14
E
FY15
E
Revenue (LHS) EBIT margin (RHS)
(INRbn) (% )
34 39
46 53
60 65
73 80 86
-2.0 4.0 6.0 8.0 10.0 12.0 14.0 16.0 18.0
0
20
40
60
80
100
FY07
FY08
FY09
FY10
FY11
FY12
FY13
E
FY14
E
FY15
E
Revenue (LHS) EBITDA margin (RHS)
(INRbn) (% )
23 30
41 39 41 48
53
62 66
(2.0)
-
2.0
4.0
6.0
8.0
10.0
12.0
0
10
20
30
40
50
60
70
FY07
FY08
FY09
FY10
FY11
FY12
FY13
E
FY14
E
FY15
E
Revenue (LHS) EBITDA margin (RHS)
(INRbn) (% )

India Power Utilities & Capital Goods Sectors 18 March 2013
- 51 -
CRG: net working capital as a % of revenue CRG: one-year forward PER
Source: Company, Daiwa forecasts Source: Bloomberg, Company, Daiwa forecasts
CRG: PER bands CRG: EV/EBITDA bands
Source: Bloomberg, Company, Daiwa forecasts Source: Bloomberg, Company, Daiwa forecasts
CRG: share-price performance CRG: revisions to consensus earnings
Source: Bloomberg Source: Bloomberg
56 68
87 91 100
112 125
142 152
-
2
4
6
8
10
12
0
20
40
60
80
100
120
140
160
FY07
FY08
FY09
FY10
FY11
FY12
FY13
E
FY14
E
FY15
E
Revenue (LHS) Working capital as a % of revenue (RHS)
(INRbn) (% )
0
10
20
30
40
50
60
Mar
-05
Sep-
05
Mar
-06
Sep-
06
Mar
-07
Sep-
07
Mar
-08
Sep-
08
Mar
-09
Sep-
09
Mar
-10
Sep-
10
Mar
-11
Sep-
11
Mar
-12
Sep-
12
Mar
-13
(PER)
20.8x Avg
31.0x Avg+1S.D.
10.5x Avg-1S.D.
10x
15x
20x
0
50
100
150
200
250
300
350
Mar
-05
Sep-
05
Mar
-06
Sep-
06
Mar
-07
Sep-
07
Mar
-08
Sep-
08
Mar
-09
Sep-
09
Mar
-10
Sep-
10
Mar
-11
Sep-
11
Mar
-12
Sep-
12
Mar
-13
(INR)
0
25,000
50,000
75,000
100,000
125,000
150,000
175,000
200,000
225,000M
ar-0
5
Sep-
05
Mar
-06
Sep-
06
Mar
-07
Sep-
07
Mar
-08
Sep-
08
Mar
-09
Sep-
09
Mar
-10
Sep-
10
Mar
-11
Sep-
11
Mar
-12
Sep-
12
Mar
-13
(INRm)
5x
8x
11x
14x
20
40
60
80
100
120
140
Mar
-11
Apr-1
1M
ay-1
1Ju
n-11
Jul-1
1Au
g-11
Sep-
11O
ct-1
1No
v-11
Dec-
11Ja
n-12
Feb-
12M
ar-1
2Ap
r-12
May
-12
Jun-
12Ju
l-12
Aug-
12Se
p-12
Oct
-12
Nov-
12De
c-12
Jan-
13Fe
b-13
Mar
-13
CRG BSE Capital Goods SENSEX
(% )
10.3 9.0 8.3
4.8 4.6 3.0
12.5
10.7 10.6
8.8 8.5 7.7
0
2
4
6
8
10
12
14
Apr-1
2
May
-12
Jun-
12
Jul-1
2
Aug-
12
Sep-
12
Oct
-12
Nov-
12
Dec-
12
Jan-
13
Feb-
13
Mar
-13
FY13 EPS FY14 EPS
(INR)

See important disclosures, including any required research certifications, beginning on page 73
■ What's new We expect Adani to be a beneficiary of the recent reforms in the power sector, such as coal pooling and the possible resolution of non-viable PPAs, and believe progress in these areas will drive the share price. ■ What's the impact A favourable decision on the company’s non-viable PPAs (with Gujarat [1,000MW] and Haryana –[1,424MW]) could boost Adani’s profitability. In the ongoing petition with the CERC, we estimate that a INR0.10 rise in tariffs would raise the company’s FY14 and FY15 net profit by 24% and 11%, respectively. Once coal pooling is implemented Adani’s Mundra-4 (about 6.4m tonnes) and Tiroda 1&2 (2.3m tonnes, another 2-3m tonnes likely soon) plants would benefit from the FSAs signed with CIL. Also, the coal supply from CIL would rise (we assume only 70% of the ACQ for FY14). We estimate that a 10%
increase in supply from CIL would raise Adani’s FY14 and FY15 net profit by 31% and 9%, respectively. However, the company’s high dependence on imported coal, due to delays in ramp-up of supply from Bunyu project has affected its profitability over the past few quarters. For 9M FY13, it received only 2.1m tonnes, while we forecast 4.5m tonnes for FY14 and 7m tonnes for FY15. We estimate that a 1m tonne increase in supply from Bunyu would result in net profit rising by 21% for FY14 and 4% for FY15. After adjusting up our fuel-cost assumptions, we cut our FY14-15 earnings forecasts by 5.5-10%. ■ What we recommend Despite the 23% fall in the share price over the past three months, we maintain our Hold (3) rating and DCF-derived six-month target price of INR50. Upside catalysts would be the resolution of the tariff-revision petition for 2,424MW, the ramp-up of volume at the Bunyu mines, and fuel security for the Tiroda 3 and Kawai plants. Over-dependence on coal linkages and delays in the ramp-up of coal from the Bunyu mines are the key downside risks. ■ How we differ Our FY14-15 EPS forecasts are 12-17% lower than those of the
Bloomberg consensus as we assume a higher mix of imported spot coal.
Utilities / IndiaADANI IN
18 March 2013
Adani Power
Regulatory risks remain
• Adani should benefit from the reforms that are under way, such as coal pooling and the resolution of non-viable PPAs
• Over the past five quarters, profitability has been affected by the company’s large dependence on imported coal
• Development on regulatory issues likely to drive share price; maintain Hold rating
Source: Daiwa forecasts
Source: FactSet, Daiwa forecasts
Utilities / India
Adani PowerADANI IN
Target (INR): 50.00 50.00Upside: 4.9%15 Mar price (INR): 47.65
BuyOutperformHold (unchanged)
UnderperformSell
1
2
3
4
5
Forecast revisions (%)Year to 31 Mar 13E 14E 15ERevenue change (1.8) (1.9) 0.9Net profit change n.a. (5.5) (10.0)Core EPS (FD) change n.a. (5.5) (10.0)
50
63
75
88
100
35
46
58
69
80
Mar-12 Jun-12 Sep-12 Dec-12 Mar-13
Share price performance
Adani Pow (LHS)Relative to SENSEX Index (RHS)
(INR) (%)
12-month range 37.70-73.00Market cap (USDbn) 1.923m avg daily turnover (USDm) 4.04Shares outstanding (m) 2,180Major shareholder Adani Enterprises Ltd (64.0%)
Financial summary (INR)Year to 31 Mar 13E 14E 15ERevenue (m) 71,523 140,495 178,812Operating profit (m) 614 34,246 48,860Net profit (m) (16,021) 5,070 11,922Core EPS (fully-diluted) (7.349) 2.326 5.469EPS change (%) n.a. n.a. 135.2Daiwa vs Cons. EPS (%) (61.5) (17.2) (11.8)PER (x) n.a. 20.5 8.7Dividend yield (%) 0.0 0.0 0.0DPS 0.000 0.000 0.000PBR (x) 2.4 2.1 1.7EV/EBITDA (x) 41.8 9.3 6.3ROE (%) n.a. 10.9 21.7
Saurabh Mehta(91) 22 6622 1009
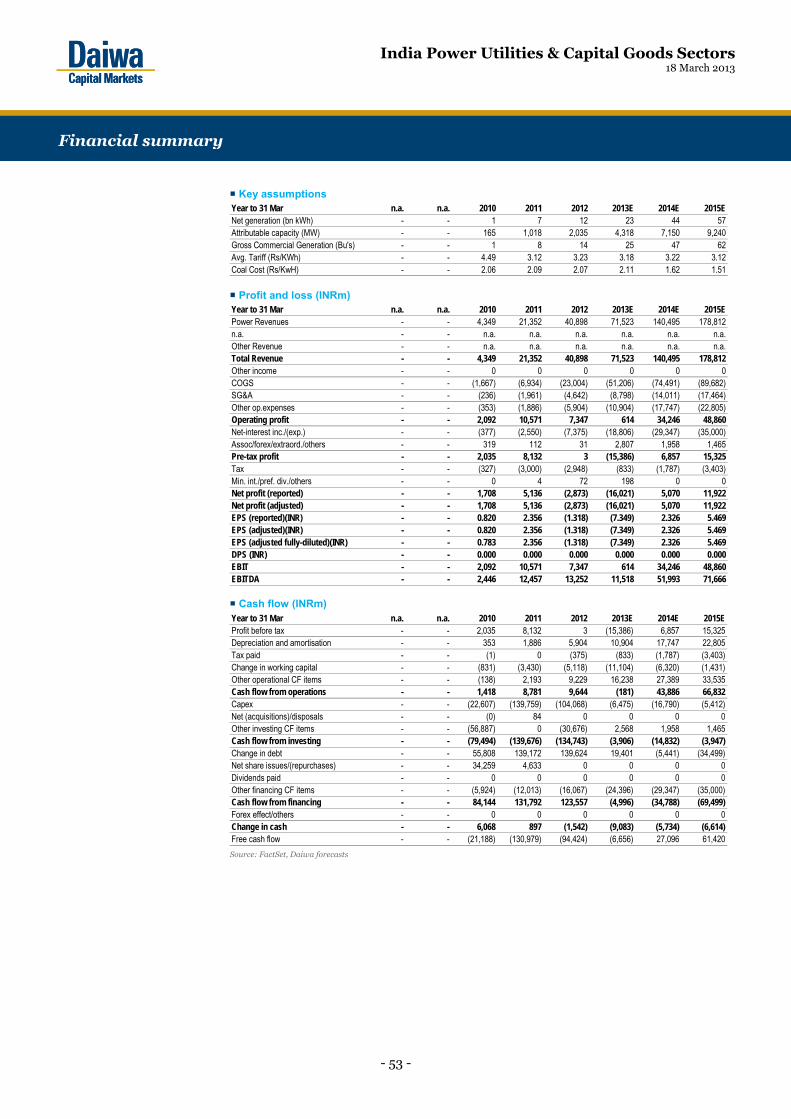
India Power Utilities & Capital Goods Sectors 18 March 2013
- 53 -
Key assumptions
Profit and loss (INRm)
Cash flow (INRm)
Source: FactSet, Daiwa forecasts
Year to 31 Mar n.a. n.a. 2010 2011 2012 2013E 2014E 2015ENet generation (bn kWh) - - 1 7 12 23 44 57Attributable capacity (MW) - - 165 1,018 2,035 4,318 7,150 9,240Gross Commercial Generation (Bu's) - - 1 8 14 25 47 62Avg. Tariff (Rs/KWh) - - 4.49 3.12 3.23 3.18 3.22 3.12Coal Cost (Rs/KwH) - - 2.06 2.09 2.07 2.11 1.62 1.51
Year to 31 Mar n.a. n.a. 2010 2011 2012 2013E 2014E 2015EPower Revenues - - 4,349 21,352 40,898 71,523 140,495 178,812n.a. - - n.a. n.a. n.a. n.a. n.a. n.a.Other Revenue - - n.a. n.a. n.a. n.a. n.a. n.a.Total Revenue - - 4,349 21,352 40,898 71,523 140,495 178,812Other income - - 0 0 0 0 0 0COGS - - (1,667) (6,934) (23,004) (51,206) (74,491) (89,682)SG&A - - (236) (1,961) (4,642) (8,798) (14,011) (17,464)Other op.expenses - - (353) (1,886) (5,904) (10,904) (17,747) (22,805)Operating profit - - 2,092 10,571 7,347 614 34,246 48,860Net-interest inc./(exp.) - - (377) (2,550) (7,375) (18,806) (29,347) (35,000)Assoc/forex/extraord./others - - 319 112 31 2,807 1,958 1,465Pre-tax profit - - 2,035 8,132 3 (15,386) 6,857 15,325Tax - - (327) (3,000) (2,948) (833) (1,787) (3,403)Min. int./pref. div./others - - 0 4 72 198 0 0Net profit (reported) - - 1,708 5,136 (2,873) (16,021) 5,070 11,922Net profit (adjusted) - - 1,708 5,136 (2,873) (16,021) 5,070 11,922EPS (reported)(INR) - - 0.820 2.356 (1.318) (7.349) 2.326 5.469EPS (adjusted)(INR) - - 0.820 2.356 (1.318) (7.349) 2.326 5.469EPS (adjusted fully-diluted)(INR) - - 0.783 2.356 (1.318) (7.349) 2.326 5.469DPS (INR) - - 0.000 0.000 0.000 0.000 0.000 0.000EBIT - - 2,092 10,571 7,347 614 34,246 48,860EBITDA - - 2,446 12,457 13,252 11,518 51,993 71,666
Year to 31 Mar n.a. n.a. 2010 2011 2012 2013E 2014E 2015EProfit before tax - - 2,035 8,132 3 (15,386) 6,857 15,325Depreciation and amortisation - - 353 1,886 5,904 10,904 17,747 22,805Tax paid - - (1) 0 (375) (833) (1,787) (3,403)Change in working capital - - (831) (3,430) (5,118) (11,104) (6,320) (1,431)Other operational CF items - - (138) 2,193 9,229 16,238 27,389 33,535Cash flow from operations - - 1,418 8,781 9,644 (181) 43,886 66,832Capex - - (22,607) (139,759) (104,068) (6,475) (16,790) (5,412)Net (acquisitions)/disposals - - (0) 84 0 0 0 0Other investing CF items - - (56,887) 0 (30,676) 2,568 1,958 1,465Cash flow from investing - - (79,494) (139,676) (134,743) (3,906) (14,832) (3,947)Change in debt - - 55,808 139,172 139,624 19,401 (5,441) (34,499)Net share issues/(repurchases) - - 34,259 4,633 0 0 0 0Dividends paid - - 0 0 0 0 0 0Other financing CF items - - (5,924) (12,013) (16,067) (24,396) (29,347) (35,000)Cash flow from financing - - 84,144 131,792 123,557 (4,996) (34,788) (69,499)Forex effect/others - - 0 0 0 0 0 0Change in cash - - 6,068 897 (1,542) (9,083) (5,734) (6,614)Free cash flow - - (21,188) (130,979) (94,424) (6,656) 27,096 61,420
Financial summary

India Power Utilities & Capital Goods Sectors 18 March 2013
- 54 -
Balance sheet (INRm)
Key ratios (%)
Source: FactSet, Daiwa forecasts
Company profile
Adani Power is part of the Adani Group. It is an emerging private sector power producer, with 5280MW of operational capacity and 3960MW under construction.
As at 31 Mar n.a. n.a. 2010 2011 2012 2013E 2014E 2015ECash & short-term investment - - 11,654 12,551 36,669 27,348 21,614 15,000Inventory - - 95 2,836 8,268 5,879 11,548 14,697Accounts receivable - - 2,563 4,174 9,462 16,656 32,718 41,641Other current assets - - 9,406 5,844 16,993 17,042 22,711 25,861Total current assets - - 23,718 25,405 71,391 66,925 88,590 97,198Fixed assets - - 155,562 324,381 442,256 437,827 436,870 419,477Goodwill & intangibles - - 0 0 0 0 0 0Other non-current assets - - 0 100 190 190 190 190Total assets - - 179,280 349,886 513,837 504,942 525,651 516,865Short-term debt - - 0 0 0 0 0 0Accounts payable - - 13,595 30,361 5,608 24,660 36,371 44,033Other current liabilities - - 1,057 2,842 50,199 24,899 34,268 40,398Total current liabilities - - 14,652 33,203 55,808 49,559 70,639 84,430Long-term debt - - 105,705 245,027 386,003 405,404 399,963 365,464Other non-current liabilities - - 120 3,120 6,023 6,023 6,023 6,023Total liabilities - - 120,477 281,350 447,834 460,986 476,625 455,917Share capital - - 21,800 21,800 21,800 21,800 21,800 21,800Reserves/R.E./others - - 35,980 41,073 38,613 22,155 27,225 39,147Shareholders' equity - - 57,780 62,873 60,413 43,956 49,026 60,948Minority interests - - 1,023 5,663 5,590 0 0 0Total equity & liabilities - - 179,280 349,886 513,837 504,942 525,651 516,865EV - - 198,953 342,018 458,803 481,935 482,228 454,343Net debt/(cash) - - 94,051 232,477 349,334 378,056 378,349 350,464BVPS (INR) - - 27.740 28.840 27.712 20.163 22.488 27.957
Year to 31 Mar n.a. n.a. 2010 2011 2012 2013E 2014E 2015ESales (YoY) - - n.a. 391.0 91.5 74.9 96.4 27.3EBITDA (YoY) - - n.a. 409.3 6.4 (13.1) 351.4 37.8Operating profit (YoY) - - n.a. 405.2 (30.5) (91.6) 5,478.0 42.7Net profit (YoY) - - n.a. 200.7 n.a. n.a. n.a. 135.2Core EPS (fully-diluted) (YoY) - - n.a. 200.7 n.a. n.a. n.a. 135.2Gross-profit margin - - 61.7 67.5 43.8 28.4 47.0 49.8EBITDA margin - - 56.2 58.3 32.4 16.1 37.0 40.1Operating-profit margin - - 48.1 49.5 18.0 0.9 24.4 27.3Net profit margin - - 39.3 24.1 (7.0) (22.4) 3.6 6.7ROAE - - n.a. 8.5 n.a. n.a. 10.9 21.7ROAA - - n.a. 1.9 n.a. n.a. 1.0 2.3ROCE - - n.a. 4.4 1.9 0.1 7.6 11.2ROIC - - 1.1 2.9 (1,776.8) 0.1 6.0 9.1Net debt to equity - - 162.8 369.8 578.2 860.1 771.7 575.0Effective tax rate - - 16.1 36.9 86,717.6 n.a. 26.1 22.2Accounts receivable (days) - - n.a. 57.6 60.8 66.6 64.1 75.9Current ratio (x) - - 1.6 0.8 1.3 1.4 1.3 1.2Net interest cover (x) - - 5.6 4.1 1.0 0.0 1.2 1.4Net dividend payout - - 0.0 0.0 n.a. n.a. 0.0 0.0Free cash flow yield - - n.a. n.a. n.a. n.a. 26.1 59.1
Financial summary continued …

India Power Utilities & Capital Goods Sectors 18 March 2013
- 55 -
Adani: capacity additions Adani: fuel security for projects
Plants Capacity (MW) DRHP Present status
Mundra 1&2 1320 30% MCL; 70% Indonesia 100% Indonesia and spotMundra 3 1320 30% MCL; 70% Indonesia 100% Indonesia and spot
Mundra 4 1980 70% MCL; 30% Indonesia 70% MCL; 30% Indonesia and spot
Tiroda 1&2 1980
4.7MT from SECL & WCL (1,180MW); Tapering linkage for 800MW in lieu of Lohara coal block taken (170mt reserves)
5.4m tonnes from SECL and WCL (1,180MW); balance spot
Tiroda 3 1320 - 100% spot Kawai 1320 - 100% spot
Source: Company, Daiwa forecasts Source: Company, Daiwa forecasts
Adani: long-term coal sourcing assumptions Adani: management expectations of coal requirement and
sourcing
Source: Daiwa forecasts Source: Company, Note:*=total requirement
Adani: sourcing of fuel Adani: plant wise PPA arrangement
Plant Capacity
(MW) PPA start datePPA
(MW) Agency Levelised tariff (INR) Mundra 1&2 1320 Feb-10/Jun-10 1000 GUVNL 2.89 Mundra 3 1320 Feb-12 1000 GUVNL 2.35 Mundra 4 1980 Aug-12/Feb-13 1424 DHBVNL/UHBVNL 2.94
Tiroda 1&2 1980 Aug-12 1445 MSEDCL 1320MW @ 2.64, and 125MW @ 3.28
Tiroda 3 1320 Apr-14 1200 MSEDCL 3.28 Kawai 1320 Aug-13 1200 RRVPNL 3.24
Source: Daiwa forecasts Source: Company
660 1,320 1,320 1,320 1,320 1,320 660 660 1,320 1,320 1,320 660
1,980 1,980 1,980
660 1,980 1,980
1,320 1,320
1,320 1,320
0
2,000
4,000
6,000
8,000
10,000
FY10 FY11 FY12 FY13E FY14E FY15E
Mundra 1&2 Mundra 3 Mundra 4 Tiroda 1&2 Tiroda 3 Kawai
1980 2640
5940
9240 9240
660
(MW)
4.0 4.0
- - - -
- -
5.1 4.3
- -
- -
-0.7
0.5 0.5
0.4 0.0
1.4 1.5
3.5 3.5
0
1
2
3
4
5
6
7
Mundra 1&2 Mundra 3 Mundra 4 Tiroda 1&2 Tiroda 3 Kawai
Bunyu CIL e-auction Spot
4.4 4.0
6.5 6.5
4.0 4.0
(MT)
10.27.0 7.0
6.4
8.0
0
4
8
12
16
20
Mundra Tiroda Kawai
Bunyu Linkage awaited MCL SECL+WCL
16.6 13.8 5.8(MT)
3.0 4.5 7.0 8.0 2.3
8.3 9.4 9.4
0.1
0.9
1.7 1.7
6.7
9.7
12.0 11.1
0
5
10
15
20
25
30
35
FY13E FY14E FY15E FY16E
Bunyu CIL e-auction Spot
12.0
23.4
30.1 30.2(MT)

India Power Utilities & Capital Goods Sectors 18 March 2013
- 56 -
Adani: power off-take mix Adani: sensitivity analysis Net profit (% change) Target price
FY14E FY15E % change1m tonne increase from Bunyu 21 4 2 10% increase in ACQ by CIL 31 9 3UDS1/tonne increase in spot coal (8) (4) (3)INR0.1 increase in non-viable PPAs 24 11 8 INR0.1 increase in merchant tariff 8 3 41% increase in PLF 8 6 5
Source: Daiwa forecasts Source: Daiwa forecasts
Adani: key assumptions
Mundra 1&2 Mundra 3 Mundra 4 Tiroda 1&2 Tiroda 3 KawaiCapacity (MW) 1,320 1,320 1,980 1,980 1,320 1,320PPA capacity (MW) (net) 1,000 1,000 1,424 1,445 1,200 1,200PPA ASPs (INR/KWh) 2.89 2.35 2.94 1320MW @ 2.64, and 125MW @ 3.28 3.28 3.24Merchant/mid-term (MW) 150 150 300 300 0 0Full plant COD Dec-10 Dec-12 Sep-12 Jun-13 Mar-14 Mar-14PPA start Feb-10/Jun-10 Feb-12 Aug-12/Feb-13 Aug-12 Apr-14 Aug-13Cost (INRbn) 44 76 132 93 66 69 Cost (INRm/MW) 33.0 57.6 66.9 46.8 50.0 52.5 Gearing (x) 4.6 3.3 4.0 4.0 4.0 4.0 SHR (Kcal/kWh) 2,300 2,100 2,100 2,100 2,100 2,100Coal Source Bunyu/spot Bunyu/spot Linkage/ spot Linkage/ spot Applied AppliedPLF (%) 75 75 75 75 80 80AUC (%) 9.0 7.5 7.5 7.5 7.5 7.5O&M (INRm/MW) 1.20 1.20 1.20 1.20 1.20 1.20
Source: Company, Daiwa
69 77 85 85
31 23 15 15
0
20
40
60
80
100
FY13E FY14E FY15E FY16E
PPA units Merchant
(%)

See important disclosures, including any required research certifications, beginning on page 73
■ What's new We do not expect Reliance Power to be a direct beneficiary of the recent reforms by the government, as we believe its projects were relatively better planned than those of other IPPs in terms of fuel sourcing. Like the whole value chain, however, it should benefit from faster approvals by the MOEF, better coal supply from Coal India, and the improved receivables situation from the SEBs. ■ What's the impact With all four units at the company’s Rosa plant commissioned over the past two years and construction now at advanced stages at the Butibori and Sasan projects, we are no longer concerned about Reliance Power’s execution ability. Further, its operational and financial performance has been strong at Rosa, with an average PLF of 80% and an ROE of over 30% for FY12. However, we remain concerned about the outcomes of two events: 1) the availability of gas for the Samalkot project (2.4GW), as
we believe the gas market will be severely constrained in terms of domestic gas supply over the coming years, and 2) the use of surplus coal from mines allocated to the UMPP. Our forecasts for Reliance Power build in the benefits from the use of surplus coal from the Sasan plant’s captive mines for its Chitrangi plant. However, we do not factor in such benefits from Tilaya’s captive mines, as we believe the surplus coal usage will be in line with the new coal policy of the UMPPs as outlined by the MOC. Positive developments on these issues would make us more upbeat on the prospects for the share price. However, due to a better-than-expected operational performance at Rosa for 9M FY13, we raise our net-profit forecasts for FY13 and FY14 by 21% and 34%, respectively. ■ What we recommend With a share-price correction of 26% over the past three months, we upgrade our rating to Underperform (4) from Sell (5), but keep our SOTP-based six-month target price of INR70. The stock trades at PERs of 21x for FY13E and 19x for FY14E, which we still see as expensive and as factoring in positive outcomes for the two events mentioned earlier. Upside potential would come from clarity over the use of surplus coal from the mines allocated to the company’s Sasan and Tilaya UMPPs.
■ How we differ Our capacity-addition assumptions for FY14-15 are below the levels guided by the company.
Utilities / IndiaRPWR IN
18 March 2013
Reliance Power
A back-ended story
• Company unlikely to benefit directly from the recent reforms in the power sector
• Our concerns remain gas availability for Samalkot and use of surplus coal from mines allocated to Sasan and Tilaya UMPPs
• Valuations appear to factor in positive developments from the concerns; upgrade to Underperform post recent correction
Source: Daiwa forecasts
Source: FactSet, Daiwa forecasts
Utilities / India
Reliance PowerRPWR IN
Target (INR): 70.00 70.00Downside: 5.9%15 Mar price (INR): 74.35
BuyOutperformHoldUnderperform (from Sell)
Sell
1
2
3
4
5
Forecast revisions (%)Year to 31 Mar 13E 14E 15ERevenue change 2.2 - -Net profit change 21.4 33.5 1.1Core EPS (FD) change 21.4 33.5 1.1
50
63
75
88
100
70
86
103
119
135
Mar-12 Jun-12 Sep-12 Dec-12 Mar-13
Share price performance
Reliance P (LHS)Relative to SENSEX Index (RHS)
(INR) (%)
12-month range 71.15-130.50Market cap (USDbn) 3.863m avg daily turnover (USDm) 12.07Shares outstanding (m) 2,805Major shareholder Promoter (75.0%)
Financial summary (INR)Year to 31 Mar 13E 14E 15ERevenue (m) 45,612 60,942 89,935Operating profit (m) 15,090 19,366 32,939Net profit (m) 9,835 11,163 14,526Core EPS (fully-diluted) 3.506 3.979 5.178EPS change (%) 13.5 13.5 30.1Daiwa vs Cons. EPS (%) n.a. n.a. n.a.PER (x) 21.2 18.7 14.4Dividend yield (%) 0.0 0.0 0.0DPS 0.000 0.000 0.000PBR (x) 1.1 1.1 1.0EV/EBITDA (x) 23.6 20.7 14.3ROE (%) 5.4 5.8 7.1
Saurabh Mehta(91) 22 6622 1009

India Power Utilities & Capital Goods Sectors 18 March 2013
- 58 -
Key assumptions
Profit and loss (INRm)
Cash flow (INRm)
Source: FactSet, Daiwa forecasts
Year to 31 Mar n.a. 2009 2010 2011 2012 2013E 2014E 2015EGross Commercial Generation (BU's) - 0 0 4 5 10 22 41Avg. Tariff (INR/KWh) - 0.00 0.00 2.87 4.27 4.45 2.75 2.18Coal Cost (INR/KwH) - 0.00 0.00 1.52 2.39 2.31 1.34 0.84PLF-Coal (%) - 0.0 0.0 60.0 80.5 85.0 85.0 85.0Commercial capacity consolidated - 0 0 600 900 1,840 3,820 6,460
Year to 31 Mar n.a. 2009 2010 2011 2012 2013E 2014E 2015EEnergy Sales Revenues - 0 207 10,237 19,584 45,612 60,942 89,935n.a. - n.a. n.a. n.a. n.a. n.a. n.a. n.a.Other Revenue - n.a. n.a. n.a. n.a. n.a. n.a. n.a.Total Revenue - 0 207 10,548 20,192 45,612 60,942 89,935Other income - 0 0 0 0 0 0 0COGS - 0 (221) (5,597) (11,285) (23,693) (29,701) (34,726)SG&A - (1,190) (1,059) (2,661) (2,668) (3,610) (5,695) (8,050)Other op.expenses - (2) (57) (1,009) (1,215) (3,219) (6,179) (14,221)Operating profit - (1,193) (1,130) 1,281 5,024 15,090 19,366 32,939Net-interest inc./(exp.) - (18) (70) (2,195) (2,976) (6,797) (10,730) (18,388)Assoc/forex/extraord./others - 3,604 8,227 8,633 7,476 4,355 5,763 4,033Pre-tax profit - 2,393 7,026 7,719 9,524 12,649 14,399 18,583Tax - (125) (187) (115) (856) (2,814) (3,236) (4,058)Min. int./pref. div./others - 0 0 0 0 0 0 0Net profit (reported) - 2,268 6,839 7,604 8,668 9,835 11,163 14,526Net profit (adjusted) - 2,268 6,839 7,604 8,668 9,835 11,163 14,526EPS (reported)(INR) - 0.946 2.853 2.942 3.090 3.506 3.979 5.178EPS (adjusted)(INR) - 0.946 2.853 2.942 3.090 3.506 3.979 5.178EPS (adjusted fully-diluted)(INR) - 0.946 2.438 2.711 3.090 3.506 3.979 5.178DPS (INR) - 0.000 0.000 0.000 0.000 0.000 0.000 0.000EBIT - (1,193) (1,130) 1,281 5,024 15,090 19,366 32,939EBITDA - (1,190) (1,073) 2,290 6,239 18,310 25,545 47,160
Year to 31 Mar n.a. 2009 2010 2011 2012 2013E 2014E 2015EProfit before tax - 2,393 7,026 7,719 9,524 12,649 14,399 18,583Depreciation and amortisation - 2 57 1,009 1,215 3,219 6,179 14,221Tax paid - 0 (41) (345) (873) (2,814) (3,236) (4,058)Change in working capital - (892) (1,011) (2,720) (4,198) (59,652) 12,051 (8)Other operational CF items - (3,328) (8,142) (6,026) (4,044) 2,441 4,967 14,356Cash flow from operations - (1,825) (2,110) (363) 1,623 (44,157) 34,360 43,094Capex - (37,273) (35,613) (62,523) (107,647) (51,624) (125,500) (175,035)Net (acquisitions)/disposals - 28,671 29,749 42,774 46,223 12,731 0 0Other investing CF items - 2,657 3,261 (1,037) (3,203) 4,355 5,763 4,033Cash flow from investing - (5,946) (2,604) (20,786) (64,627) (34,538) (119,738) (171,002)Change in debt - 8,505 9,238 37,854 72,622 123,699 81,882 119,533Net share issues/(repurchases) - 10 0 0 0 0 0 0Dividends paid - 0 0 0 0 0 0 0Other financing CF items - (4,798) (3,403) (4,275) (12,001) (6,797) (10,730) (18,388)Cash flow from financing - 3,717 5,835 33,579 60,621 116,902 71,152 101,145Forex effect/others - 0 0 0 0 0 0 0Change in cash - (4,054) 1,121 12,430 (2,383) 38,208 (14,225) (26,763)Free cash flow - (39,098) (37,724) (62,886) (106,024) (95,781) (91,141) (131,941)
Financial summary

India Power Utilities & Capital Goods Sectors 18 March 2013
- 59 -
Balance sheet (INRm)
Key ratios (%)
Source: FactSet, Daiwa forecasts
Company profile
Reliance Power (RPWR) is the power-generation arm of Anil Dhirubhai Ambani Group and currently has 1.24GW of operational capacity. RPWR has ambitious plans to set up an additional 24GW of greenfield power-generation projects. These include 16GW of coal-based projects, 2.4GW of gas-based projects, and 5.3GW of hydro-electric power projects.
As at 31 Mar n.a. 2009 2010 2011 2012 2013E 2014E 2015ECash & short-term investment - 103,389 80,490 71,929 26,914 52,390 38,165 11,402Inventory - 0 487 537 1,607 3,895 4,882 5,708Accounts receivable - 0 288 3,471 6,552 14,996 20,036 29,568Other current assets - 1,996 1,264 20,381 29,101 30,265 28,554 29,952Total current assets - 105,385 82,529 96,318 64,173 101,545 91,637 76,630Fixed assets - 49,659 91,436 162,595 328,416 376,821 496,142 656,956Goodwill & intangibles - 0 0 0 0 0 0 0Other non-current assets - 0 0 0 0 0 0 0Total assets - 155,043 173,966 258,914 392,589 478,366 587,780 733,586Short-term debt - 0 250 16,785 4,537 4,537 4,537 4,537Accounts payable - 0 0 0 0 0 0 0Other current liabilities - 3,927 6,929 17,231 65,313 17,556 33,925 45,672Total current liabilities - 3,927 7,179 34,015 69,850 22,094 38,462 50,209Long-term debt - 13,325 22,156 56,564 147,028 270,727 352,609 472,142Other non-current liabilities - 0 0 0 0 0 0 0Total liabilities - 17,252 29,335 90,579 216,878 292,820 391,071 522,352Share capital - 23,968 23,968 28,051 28,051 28,051 28,051 28,051Reserves/R.E./others - 113,824 120,662 140,283 147,645 157,480 168,642 183,168Shareholders' equity - 137,792 144,630 168,334 175,696 185,531 196,694 211,219Minority interests - 0 0 0 15 15 15 15Total equity & liabilities - 155,043 173,966 258,914 392,589 478,366 587,780 733,586EV - 118,497 150,477 209,980 333,228 431,450 527,557 673,854Net debt/(cash) - (90,064) (58,084) 1,419 124,652 222,874 318,981 465,278BVPS (INR) - 57.490 60.343 65.127 62.634 66.140 70.119 75.298
Year to 31 Mar n.a. 2009 2010 2011 2012 2013E 2014E 2015ESales (YoY) - n.a. n.a. 4,989.7 91.4 125.9 33.6 47.6EBITDA (YoY) - n.a. n.a. n.a. 172.4 193.5 39.5 84.6Operating profit (YoY) - n.a. n.a. n.a. 292.1 200.3 28.3 70.1Net profit (YoY) - n.a. 201.5 11.2 14.0 13.5 13.5 30.1Core EPS (fully-diluted) (YoY) - n.a. 157.6 11.2 14.0 13.5 13.5 30.1Gross-profit margin - n.a. n.a. 46.9 44.1 48.1 51.3 61.4EBITDA margin - n.a. n.a. 21.7 30.9 40.1 41.9 52.4Operating-profit margin - n.a. n.a. 12.1 24.9 33.1 31.8 36.6Net profit margin - n.a. 3,300.1 72.1 42.9 21.6 18.3 16.2ROAE - n.a. 4.8 4.9 5.0 5.4 5.8 7.1ROAA - n.a. 4.2 3.5 2.7 2.3 2.1 2.2ROCE - n.a. n.a. 0.6 1.8 3.8 3.8 5.3ROIC - (2.4) (1.6) 1.0 1.9 3.3 3.2 4.3Net debt to equity - net cash net cash 0.8 70.9 120.1 162.2 220.3Effective tax rate - 5.2 2.7 1.5 9.0 22.2 22.5 21.8Accounts receivable (days) - n.a. 253.7 65.0 90.6 86.2 104.9 100.7Current ratio (x) - 26.8 11.5 2.8 0.9 4.6 2.4 1.5Net interest cover (x) - n.a. n.a. 0.6 1.7 2.2 1.8 1.8Net dividend payout - 0.0 0.0 0.0 0.0 0.0 0.0 0.0Free cash flow yield - n.a. n.a. n.a. n.a. n.a. n.a. n.a.
Financial summary continued …

India Power Utilities & Capital Goods Sectors 18 March 2013
- 60 -
RPWR: project update
Project Fuel Configuration
(units) Capacity
(MW) State Land
acquisition Water source
Fuel supply
Environmental approval
EPC/BTG contract award
Financing confirmed COD Unit I Project update
Rosa I Coal 2 x 300 600 Uttar Pradesh √ √ √ √ √ √ Mar-10 Both units fully commissioned Rosa II Coal 2 x 300 600 Uttar Pradesh √ √ √ √ √ √ Jan-12 Both units fully commissioned Butibori Coal 2 x 300 600 Maharashtra √ √ √ √ √ √ Mar-13 Unit-1 achieved full load in Aug-12, Unit-2
synchronised in Jan-13 Sasan Coal 6 x 660 3,960 Madhya
Pradesh √ √ √ √ √ √ Mar-13 Unit 1 synchronised in Mar-13
Krishnapatnam Imported Coal
6 x 660 3,960 Andhra Pradesh
√* √ √ √ √ √ - Filed a petition for arbitration. We believe that the project has been deferred until the PPA is adjusted to pass on the higher costs of Indonesian coal
Chitrangi Coal 6 x 660 3,960 Madhya Pradesh
√ √ √ √ √ X Jan-15 Advanced stages of development, to start construction after stage-2 forest clearance is received for Chhatrasal coal block
Tilaya Coal 6 x 660 3,960 Jharkhand X √ √ √ X X Jun-15 Advanced stages of development Total coal 17,640 Samalkot Gas 3 x 800 2,400 Andhra
Pradesh √ √ X^ √ √ X - 2 gas turbines synchronised
Hydro-Electric Hydro n.a. 5,292 Uttarakhand, Arunachal Pradesh, Himachal Pradesh
X n.a. n.a. X X X n.a. Early stages of development
Others Wind/ Solar
n.a. 185 √* n.a. n.a. n.a. X X n.a. 40MW of Solar PV commissioned in March 2012, rest in advanced stages of development
Total 25,517 Source: Company, Daiwa forecasts
Note: *Significant portion under possession, ^under consideration, X=not complete
RPWR: PAF/ PLF and net profit for Rosa plant RPWR: allocation of coal (yearly)
Source: Company Source: Company
RPWR: assumptions for projects RPWR: valuation summary
Project Cost
(INRbn) Debt-
Equity mix
Station heat rate
(kcal/kWh)GCV coal -
kcal/kg PLF (%) Aux (%)Rosa I 31.1 70:30 2,350 4,020 80.0 9.0 Rosa II 31.0 75:25 2,350 4,020 80.0 9.0 Butibori 36.3 75:25 2,350 4,350 90.0 9.0 Sasan 200.0 75:25 2,150 4,600 90.0 6.5 Chitrangi 210.0 75:25 2,150 4,600 90.0 6.5 Tilaya 250.0 75:25 2,150 4,300 90.0 6.5
Project Equity value
(INRbn) Value per share (INR) RemarksRosa I 18.7 7 PBR 2.5xRosa II 18.6 7 PBR 2.5xButibori 13.0 5 FCFE @ COE of 12%Sasan 18.1 6 FCFE @ COE of 12%Samalkot - - Not consideredChitrangi 126.2 45 FCFE @ COE of 18%Tilaya 4.0 1 FCFE @ COE of 15%Krishnapatnam - - Not consideredIndonesian coal mine - - Not consideredTotal 70
Source: Company, Daiwa forecasts Source: Daiwa estimates
97
79 79
92
81 78
103
91
76 75
81 78
63
91
0
500
1,000
1,500
2,000
2,500
60
70
80
90
100
110
1Q FY12 2Q FY12 3Q FY12 4Q FY12 1Q FY13* 2Q FY13* 3Q FY13*
PAF (LHS) PLF (LHS) PAT (RHS)
(%) (INRm)
20 14
5 11
40
15
25
0
10
20
30
40
50
60
70
Total coal available
Sasan Chitrangi Tilaya Balance available
Moher & Moher Amlohri Chhatrasal Kerandari
(m tonnes)

See important disclosures, including any required research certifications, beginning on page 73
■ What's new We see limited growth in total order inflow for Siemens’ energy segment, with no visibility on large orders in this segment, and a high base for orders for its industrial business. ■ What's the impact Siemens’ overall performance over the past few quarters has been affected by lower orders, delays in execution due to environmental and land issues, and increased project costs. For FY12, the company did not receive any large orders, and as a result, its total order inflow was down 17% YoY to INR102bn. Further, in 1Q FY13, the order inflow fell by 30% YoY to INR20bn. Energy segment. With a lack of visibility on any large orders from overseas and no order pipeline from domestic gas-based utilities (given the shortage of domestic gas), the order inflow for the energy segment is expected to remain flat YoY for FY13. In FY12, orders for the energy
segment fell by 46% YoY to INR27bn and the EBIT margin dropped from 12.2% in FY11 to 4.1% in FY12. Industrial segment. Given the delay in a revival in industrial capex and high base of order inflow for FY12 (increase by 35% over FY11) we expect order inflow to remain flat YoY for FY13. In line with our weak outlook for the energy and industrial segments, we cut our net profit forecasts by 16.5% for FY13 and 6.9% for FY14, and now forecast a net profit CAGR of 2.1% over FY11-15. As a result, we look for ROE to decline to 15.7% for FY14, from 25% over FY07-11. ■ What we recommend We expect greater pressure on the EBIT margin for the energy segment due to fierce competition in T&D. Our rating remains Underperform (4), and we are lowering our six-month target price to INR500 (from INR566), now based on a target PER of 25x on the average of our FY13-14E EPS (earlier FY13 EPS). Risks: higher-than-expected order-inflow growth due to a possible revival of industrial capex and a higher share of orders from the railway sector. ■ How we differ Our order-inflow assumptions are lower than consensus due to our
negative outlook for the energy segment.
Industrials / IndiaSIEM IN
18 March 2013
Siemens India
Lacks order visibility
• Fresh order visibility affected by slowdown in energy and industrial segment
• Overall performance affected by delays in execution due to environmental and land issues, increased project costs
• Maintain Underperform rating, lowering target price to INR500
Source: Daiwa forecasts
Source: FactSet, Daiwa forecasts
Industrials / India
Siemens IndiaSIEM IN
Target (INR): 566.00 500.00Downside: 12.8%15 Mar price (INR): 573.25
BuyOutperformHoldUnderperform (unchanged)
Sell
1
2
3
4
5
Forecast revisions (%)Year to 30 Sep 13E 14E 15ERevenue change 0.5 (0.9) n.a.Net profit change (16.5) (6.9) n.a.Core EPS (FD) change (16.5) (6.9) n.a.
50
65
80
95
110
450
550
650
750
850
Mar-12 Jun-12 Sep-12 Dec-12 Mar-13
Share price performance
Siemens (LHS)Relative to SENSEX Index (RHS)
(INR) (%)
12-month range 489.80-830.35Market cap (USDbn) 3.613m avg daily turnover (USDm) 2.41Shares outstanding (m) 340Major shareholder Siemens AG (73.8%)
Financial summary (INR)Year to 30 Sep 13E 14E 15ERevenue (m) 125,684 124,865 153,369Operating profit (m) 7,210 8,092 11,014Net profit (m) 6,436 7,166 9,155Core EPS (fully-diluted) 18.914 21.059 26.903EPS change (%) 18.5 11.3 27.8Daiwa vs Cons. EPS (%) n.a. n.a. n.a.PER (x) 30.3 27.2 21.3Dividend yield (%) 1.1 1.1 1.1DPS 6.500 6.500 6.500PBR (x) 4.5 4.1 3.6EV/EBITDA (x) 17.7 15.2 11.4ROE (%) 15.5 15.7 17.8
Saurabh Mehta(91) 22 6622 1009

India Power Utilities & Capital Goods Sectors 18 March 2013
- 62 -
Key assumptions
Profit and loss (INRm)
Cash flow (INRm)
Source: FactSet, Daiwa forecasts
Year to 30 Sep 2008 2009 2010 2011 2012 2013E 2014E 2015EOrder-book (INRm) 98,338 102,918 135,839 139,213 136,600 110,395 100,334 84,492Order-inflow (INRm) 87,722 87,964 124,304 122,886 102,351 102,351 117,636 141,073
Year to 30 Sep 2008 2009 2010 2011 2012 2013E 2014E 2015EEnergy Revenues 41,890 41,233 43,239 53,400 52,500 55,125 57,881 60,775Industry Revenues 34,136 36,570 41,840 35,500 42,700 44,835 47,077 49,431Other Revenue 6,930 6,084 8,073 29,283 31,881 25,724 19,907 43,163Total Revenue 82,955 83,888 93,152 118,183 127,081 125,684 124,865 153,369Other income 0 0 0 0 0 0 0 0COGS (75,013) (71,736) (77,454) (102,754) (114,786) (111,230) (109,256) (133,431)SG&A (753) (2,618) (3,615) (4,184) (5,500) (5,027) (4,995) (6,135)Other op.expenses (637) (778) (1,015) (1,522) (2,010) (2,217) (2,521) (2,790)Operating profit 6,551 8,756 11,069 9,723 4,785 7,210 8,092 11,014Net-interest inc./(exp.) 431 464 670 755 305 424 648 740Assoc/forex/extraord./others 1,935 5,098 848 2,271 119 2,118 2,118 2,118Pre-tax profit 8,918 14,319 12,587 12,749 5,209 9,752 10,858 13,871Tax (2,984) (3,870) (4,315) (4,295) (1,777) (3,316) (3,692) (4,716)Min. int./pref. div./others 0 0 0 0 0 0 0 0Net profit (reported) 5,933 10,449 8,272 8,454 3,432 6,436 7,166 9,155Net profit (adjusted) 4,687 6,160 8,272 8,433 5,431 6,436 7,166 9,155EPS (reported)(INR) 17.598 30.990 24.535 24.842 10.085 18.914 21.059 26.903EPS (adjusted)(INR) 13.903 18.269 24.535 24.781 15.959 18.914 21.059 26.903EPS (adjusted fully-diluted)(INR) 13.903 18.269 24.535 24.781 15.959 18.914 21.059 26.903DPS (INR) 3.000 5.000 5.000 6.001 6.206 6.500 6.500 6.500EBIT 6,551 8,756 11,069 9,723 4,785 7,210 8,092 11,014EBITDA 7,189 9,534 12,084 11,245 6,795 9,426 10,613 13,803
Year to 30 Sep 2008 2009 2010 2011 2012 2013E 2014E 2015EProfit before tax 8,918 14,319 12,587 12,749 5,209 9,752 10,858 13,871Depreciation and amortisation 637 778 1,015 1,522 2,010 2,217 2,521 2,790Tax paid (3,970) (5,631) (4,812) (5,319) (3,557) (3,316) (3,692) (4,716)Change in working capital 1,243 9 1,570 (7,707) (4,020) 15,231 1,376 (1,891)Other operational CF items (1,952) (6,065) (455) (1,265) 521 0 0 0Cash flow from operations 4,876 3,410 9,906 (20) 163 23,884 11,064 10,053Capex (1,657) (1,451) (2,577) (3,983) (3,785) (3,000) (3,250) (3,250)Net (acquisitions)/disposals (467) 2,526 (703) 0 0 0 0 0Other investing CF items 1,825 1,064 (1,134) (791) 2,370 0 0 0Cash flow from investing (299) 2,140 (4,413) (4,774) (1,415) (3,000) (3,250) (3,250)Change in debt (5) (5) (3) (2) 0 0 0 0Net share issues/(repurchases) 0 0 0 0 0 0 0 0Dividends paid (946) (1,181) (1,967) (1,961) (2,368) (2,588) (2,588) (2,588)Other financing CF items (21) (2) (37) 0 (226) (300) (300) (300)Cash flow from financing (971) (1,187) (2,007) (1,963) (2,594) (2,888) (2,888) (2,888)Forex effect/others 0 0 0 0 0 0 0 0Change in cash 3,606 4,362 3,486 (6,757) (3,846) 17,996 4,926 3,915Free cash flow 3,220 1,959 7,329 (4,003) (3,622) 20,884 7,814 6,803
Financial summary

India Power Utilities & Capital Goods Sectors 18 March 2013
- 63 -
Balance sheet (INRm)
Key ratios (%)
Source: FactSet, Daiwa forecasts
Company profile
Siemens India is an industrial-solutions company with a presence in three major sectors: energy, industry, infrastructure & cities and healthcare.
As at 30 Sep 2008 2009 2010 2011 2012 2013E 2014E 2015ECash & short-term investment 9,131 14,449 18,534 12,750 9,768 28,064 33,290 37,505Inventory 7,621 9,722 15,335 16,961 19,614 12,190 11,973 14,623Accounts receivable 34,328 34,583 33,023 41,759 46,844 38,743 38,484 47,289Other current assets 6,313 10,458 12,449 14,189 11,377 18,081 18,009 20,490Total current assets 57,393 69,212 79,342 85,659 87,603 97,078 101,756 119,907Fixed assets 6,442 7,352 9,805 14,185 15,668 16,451 17,180 17,640Goodwill & intangibles 0 0 0 0 0 0 0 0Other non-current assets 6,147 5,889 5,198 1,889 3,176 3,176 3,176 3,176Total assets 69,981 82,453 94,345 101,733 106,447 116,706 122,112 140,724Short-term debt 11 6 2 0 0 0 0 0Accounts payable 21,659 24,456 29,189 23,529 27,407 36,569 35,920 43,868Other current liabilities 27,620 28,824 30,376 40,042 39,414 36,662 38,139 42,236Total current liabilities 49,290 53,286 59,567 63,571 66,821 73,231 74,059 86,104Long-term debt 0 0 0 0 0 0 0 0Other non-current liabilities 0 0 0 0 0 0 0 0Total liabilities 49,290 53,286 59,567 63,571 66,821 73,231 74,059 86,104Share capital 674 674 674 681 704 704 704 704Reserves/R.E./others 20,017 28,492 34,103 37,481 38,922 42,770 47,349 53,916Shareholders' equity 20,691 29,166 34,778 38,162 39,626 43,474 48,053 54,620Minority interests 0 0 0 0 0 0 0 0Total equity & liabilities 69,981 82,453 94,345 101,733 106,447 116,706 122,112 140,724EV 185,954 180,631 176,542 182,324 185,306 167,010 161,784 157,569Net debt/(cash) (9,120) (14,443) (18,532) (12,750) (9,768) (28,064) (33,290) (37,505)BVPS (INR) 61.368 86.506 103.149 112.144 116.446 127.755 141.208 160.507
Year to 30 Sep 2008 2009 2010 2011 2012 2013E 2014E 2015ESales (YoY) 7.4 1.1 11.0 26.9 7.5 (1.1) (0.7) 22.8EBITDA (YoY) 2.4 32.6 26.7 (6.9) (39.6) 38.7 12.6 30.1Operating profit (YoY) 0.3 33.7 26.4 (12.2) (50.8) 50.7 12.2 36.1Net profit (YoY) (9.5) 31.4 34.3 1.9 (35.6) 18.5 11.3 27.8Core EPS (fully-diluted) (YoY) (9.5) 31.4 34.3 1.0 (35.6) 18.5 11.3 27.8Gross-profit margin 9.6 14.5 16.9 13.1 9.7 11.5 12.5 13.0EBITDA margin 8.7 11.4 13.0 9.5 5.3 7.5 8.5 9.0Operating-profit margin 7.9 10.4 11.9 8.2 3.8 5.7 6.5 7.2Net profit margin 5.7 7.3 8.9 7.1 4.3 5.1 5.7 6.0ROAE 25.6 24.7 25.9 23.1 14.0 15.5 15.7 17.8ROAA 7.7 8.1 9.4 8.6 5.2 5.8 6.0 7.0ROCE 35.8 35.1 34.6 26.7 12.3 17.4 17.7 21.5ROIC 38.1 48.6 47.0 31.0 11.4 21.0 35.4 45.6Net debt to equity net cash net cash net cash net cash net cash net cash net cash net cashEffective tax rate 33.5 27.0 34.3 33.7 34.1 34.0 34.0 34.0Accounts receivable (days) 124.5 149.9 132.5 115.5 127.2 124.3 112.9 102.1Current ratio (x) 1.2 1.3 1.3 1.3 1.3 1.3 1.4 1.4Net interest cover (x) n.a. n.a. n.a. n.a. n.a. n.a. n.a. n.a.Net dividend payout 17.0 16.1 20.4 24.2 61.5 34.4 30.9 24.2Free cash flow yield 1.7 1.0 3.8 n.a. n.a. 10.7 4.0 3.5
Financial summary continued …

India Power Utilities & Capital Goods Sectors 18 March 2013
- 64 -
Siemens: revenue and growth YoY Siemens: segmental order inflow and growth YoY
Source: Company, Daiwa forecasts Source: Company, Daiwa forecasts
Siemens: EBITDA margins Siemens: segmental EBIT margins
Source: Company, Daiwa forecasts Source: Company, Daiwa forecasts
Siemens: order book-to-bill Siemens: net profit growth
Source: Company, Daiwa forecasts Source: Company, Daiwa forecasts
83 84 93
118 127 126 125
153
(5)
0
5
10
15
20
25
30
020406080
100120140160180
FY08
FY09
FY10
FY11
FY12
FY13
E
FY14
E
FY15
E
Revenue (LHS) YoY growth (RHS)
INRbn %
45 53 61 41
26 26 26 26
47 39 32
20 33 33 33 33
7 7 6
9 10 10 10 10
30 30 30 30 30
1 1 1 0 0 0 0 0
(20)(10)0102030405060
0
20
40
60
80
100
FY08
FY09
FY10
FY11
FY12
FY13
E
FY14
E
FY15
E
Energy IndustryHealthcare I&COthers % growth in orders YoY
% %
9.1 8.7
11.4
13.0
9.5
5.3
7.5 8.5 9.0
0
2
4
6
8
10
12
14
FY07
FY08
FY09
FY10
FY11
FY12
FY13
E
FY14
E
FY15
E
%
02468
1012141618
FY08
FY09
FY10
FY11
FY12
Energy Industry Healthcare
%
98 103
136 139 137
110 100
84
0.0
0.4
0.8
1.2
1.6
2.0
60
80
100
120
140
160
FY08
FY09
FY10
FY11
FY12
FY13
E
FY14
E
FY15
E
Orderbook (LHS) Book-to-bill ratio (RHS)
xINRbn
4,687
6,160
8,272 8,433
5,431
6,436 7,166
9,155
2,000
3,000
4,000
5,000
6,000
7,000
8,000
9,000
10,000
FY08
FY09
FY10
FY11
FY12
FY13
E
FY14
E
FY15
E
INRm

India Power Utilities & Capital Goods Sectors 18 March 2013
- 65 -
Siemens: GFA turnover Siemens: ROE
Source: Company, Daiwa forecasts Source: Company, Daiwa forecasts
Siemens: PER bands Siemens: EV/EBITDA bands
Source: Bloomberg Source: Bloomberg
Siemens: share-price performance Siemens: revisions to consensus earnings
Source: Bloomberg Source: Bloomberg
5.1
7.7
10.2
8.97.9 7.5 7.0
5.74.7
4.1 4.5
0
2
4
6
8
10
12
FY05
FY06
FY07
FY08
FY09
FY10
FY11
FY12
FY13
E
FY14
E
FY15
E
x
25.624.7
25.9
23.1
14.015.5 15.7
17.8
10
15
20
25
30
FY08
FY09
FY10
FY11
FY12
FY13
E
FY14
E
FY15
E
%
0
200
400
600
800
1,000
Mar
-05
Sep-
05
Mar
-06
Sep-
06
Mar
-07
Sep-
07
Mar
-08
Sep-
08
Mar
-09
Sep-
09
Mar
-10
Sep-
10
Mar
-11
Sep-
11
Mar
-12
Sep-
12
Mar
-13
40x
20x
30x
INR
0
50,000
100,000
150,000
200,000
250,000
300,000
350,000M
ar-0
5
Sep-
05
Mar
-06
Sep-
06
Mar
-07
Sep-
07
Mar
-08
Sep-
08
Mar
-09
Sep-
09
Mar
-10
Sep-
10
Mar
-11
Sep-
11
Mar
-12
Sep-
12
Mar
-13
INRm
10x
15x
20x
40
50
60
70
80
90
100
110
120
Mar
-11
Apr-1
1M
ay-1
1Ju
n-11
Jul-1
1Au
g-11
Sep-
11O
ct-1
1No
v-11
Dec-
11Ja
n-12
Feb-
12M
ar-1
2Ap
r-12
May
-12
Jun-
12Ju
l-12
Aug-
12Se
p-12
Oct
-12
Nov-
12De
c-12
Jan-
13Fe
b-13
Mar
-13
SIEM BSE Capital Goods SENSEX
%
28.4 27.4 27.4
26.3 25.3
19.4 17.9
33.2 31.7
29.4 30.1 30.6
23.4 22.4
15
20
25
30
35
Apr-1
2
May
-12
Jun-
12
Jul-1
2
Aug-
12
Sep-
12
Oct
-12
Nov-
12
Dec-
12
Jan-
13
Feb-
13
Mar
-13
FY13 EPS FY14 EPS
INR
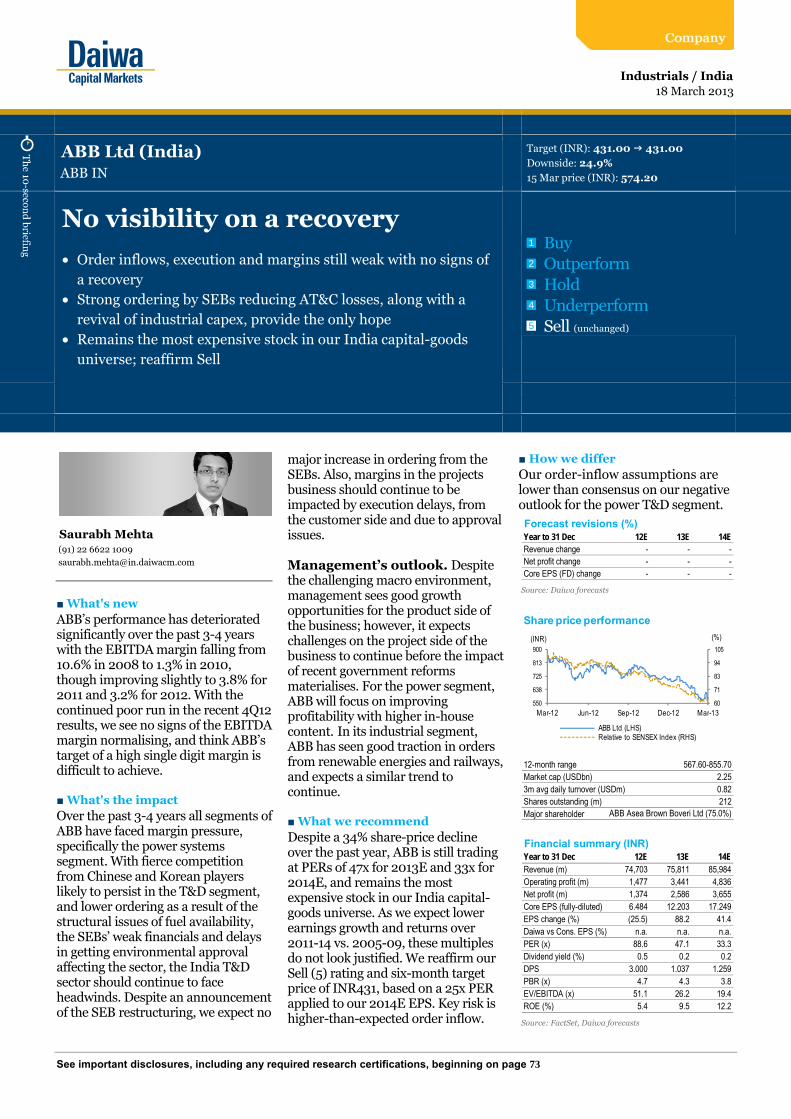
See important disclosures, including any required research certifications, beginning on page 73
■ What's new ABB’s performance has deteriorated significantly over the past 3-4 years with the EBITDA margin falling from 10.6% in 2008 to 1.3% in 2010, though improving slightly to 3.8% for 2011 and 3.2% for 2012. With the continued poor run in the recent 4Q12 results, we see no signs of the EBITDA margin normalising, and think ABB’s target of a high single digit margin is difficult to achieve. ■ What's the impact Over the past 3-4 years all segments of ABB have faced margin pressure, specifically the power systems segment. With fierce competition from Chinese and Korean players likely to persist in the T&D segment, and lower ordering as a result of the structural issues of fuel availability, the SEBs’ weak financials and delays in getting environmental approval affecting the sector, the India T&D sector should continue to face headwinds. Despite an announcement of the SEB restructuring, we expect no
major increase in ordering from the SEBs. Also, margins in the projects business should continue to be impacted by execution delays, from the customer side and due to approval issues. Management’s outlook. Despite the challenging macro environment, management sees good growth opportunities for the product side of the business; however, it expects challenges on the project side of the business to continue before the impact of recent government reforms materialises. For the power segment, ABB will focus on improving profitability with higher in-house content. In its industrial segment, ABB has seen good traction in orders from renewable energies and railways, and expects a similar trend to continue. ■ What we recommend Despite a 34% share-price decline over the past year, ABB is still trading at PERs of 47x for 2013E and 33x for 2014E, and remains the most expensive stock in our India capital-goods universe. As we expect lower earnings growth and returns over 2011-14 vs. 2005-09, these multiples do not look justified. We reaffirm our Sell (5) rating and six-month target price of INR431, based on a 25x PER applied to our 2014E EPS. Key risk is higher-than-expected order inflow.
■ How we differ Our order-inflow assumptions are lower than consensus on our negative outlook for the power T&D segment.
Industrials / IndiaABB IN
18 March 2013
ABB Ltd (India)
No visibility on a recovery
• Order inflows, execution and margins still weak with no signs of a recovery
• Strong ordering by SEBs reducing AT&C losses, along with a revival of industrial capex, provide the only hope
• Remains the most expensive stock in our India capital-goods
universe; reaffirm Sell
Source: Daiwa forecasts
Source: FactSet, Daiwa forecasts
Industrials / India
ABB Ltd (India)ABB IN
Target (INR): 431.00 431.00Downside: 24.9%15 Mar price (INR): 574.20
BuyOutperformHoldUnderperformSell (unchanged)
1
2
3
4
5
Forecast revisions (%)Year to 31 Dec 12E 13E 14ERevenue change - - -Net profit change - - -Core EPS (FD) change - - -
60
71
83
94
105
550
638
725
813
900
Mar-12 Jun-12 Sep-12 Dec-12 Mar-13
Share price performance
ABB Ltd (LHS)Relative to SENSEX Index (RHS)
(INR) (%)
12-month range 567.60-855.70Market cap (USDbn) 2.253m avg daily turnover (USDm) 0.82Shares outstanding (m) 212Major shareholder ABB Asea Brown Boveri Ltd (75.0%)
Financial summary (INR)Year to 31 Dec 12E 13E 14ERevenue (m) 74,703 75,811 85,984Operating profit (m) 1,477 3,441 4,836Net profit (m) 1,374 2,586 3,655Core EPS (fully-diluted) 6.484 12.203 17.249EPS change (%) (25.5) 88.2 41.4Daiwa vs Cons. EPS (%) n.a. n.a. n.a.PER (x) 88.6 47.1 33.3Dividend yield (%) 0.5 0.2 0.2DPS 3.000 1.037 1.259PBR (x) 4.7 4.3 3.8EV/EBITDA (x) 51.1 26.2 19.4ROE (%) 5.4 9.5 12.2
Saurabh Mehta(91) 22 6622 1009

India Power Utilities & Capital Goods Sectors 18 March 2013
- 67 -
Key assumptions
Profit and loss (INRm)
Cash flow (INRm)
Source: FactSet, Daiwa forecasts
Year to 31 Dec 2007 2008 2009 2010 2011 2012E 2013E 2014EOrderbook (INRm) 50,260 61,618 84,787 84,362 91,288 86,720 98,748 100,055Net Working Capital to Revenues (%) 7.3 14.0 16.8 15.0 12.3 17.3 13.2 13.7
Year to 31 Dec 2007 2008 2009 2010 2011 2012E 2013E 2014EPower Systems Revenues 22,176 22,371 20,877 18,267 23,624 21,296 20,499 25,219Power Products Revenues 14,138 17,147 18,501 18,155 20,008 19,722 18,300 19,661Other Revenue 22,990 28,853 22,994 26,449 30,071 33,685 37,011 41,103Total Revenue 59,303 68,370 62,372 62,871 73,703 74,703 75,811 85,984Other income 0 0 0 0 0 0 0 0COGS (48,173) (56,322) (52,093) (55,832) (64,333) (65,636) (64,818) (72,656)SG&A (3,835) (4,825) (5,005) (6,202) (6,539) (6,649) (6,444) (7,309)Other op.expenses (324) (367) (485) (517) (795) (941) (1,108) (1,183)Operating profit 6,971 6,856 4,789 321 2,035 1,477 3,441 4,836Net-interest inc./(exp.) (117) (347) (241) (174) (307) (432) (361) (231)Assoc/forex/extraord./others 710 830 726 855 949 1,017 838 933Pre-tax profit 7,565 7,339 5,274 1,002 2,677 2,062 3,918 5,538Tax (2,648) (2,858) (1,728) (370) (832) (688) (1,332) (1,883)Min. int./pref. div./others 0 0 0 0 0 0 0 0Net profit (reported) 4,917 4,481 3,546 632 1,845 1,374 2,586 3,655Net profit (adjusted) 4,917 4,481 3,546 632 1,845 1,374 2,586 3,655EPS (reported)(INR) 23.202 21.146 16.735 2.984 8.708 6.484 12.203 17.249EPS (adjusted)(INR) 23.202 21.146 16.735 2.984 8.708 6.484 12.203 17.249EPS (adjusted fully-diluted)(INR) 23.202 21.146 16.735 2.984 8.708 6.484 12.203 17.249DPS (INR) 2.200 2.200 2.000 2.000 3.000 3.000 1.037 1.259EBIT 6,971 6,856 4,789 321 2,035 1,477 3,441 4,836EBITDA 7,295 7,223 5,274 838 2,831 2,418 4,549 6,019
Year to 31 Dec 2007 2008 2009 2010 2011 2012E 2013E 2014EProfit before tax 7,565 7,339 5,274 1,002 2,677 2,062 3,918 5,538Depreciation and amortisation 324 367 485 517 795 941 1,108 1,183Tax paid (2,759) (2,378) (2,687) (582) (643) (688) (1,332) (1,883)Change in working capital (2,245) (6,484) 403 785 (1,788) (4,090) 3,025 (1,833)Other operational CF items (160) 360 54 485 139 355 315 98Cash flow from operations 2,725 (796) 3,529 2,207 1,181 (1,420) 7,033 3,103Capex (1,470) (2,639) (1,619) (1,044) (1,551) (2,000) (2,000) (500)Net (acquisitions)/disposals 69 117 439 (17) (2,224) 0 0 0Other investing CF items 262 275 194 132 163 77 46 133Cash flow from investing (1,139) (2,247) (986) (929) (3,612) (1,923) (1,954) (367)Change in debt (10) (5) (0) 0 0 3,279 (1,000) (1,000)Net share issues/(repurchases) 0 0 0 0 0 0 0 0Dividends paid (495) (544) (544) (495) (493) (737) (255) (309)Other financing CF items (117) (347) (256) (174) (307) 0 0 0Cash flow from financing (622) (896) (800) (669) (799) 2,542 (1,255) (1,309)Forex effect/others 0 0 0 0 0 0 0 0Change in cash 964 (3,939) 1,744 609 (3,230) (801) 3,824 1,426Free cash flow 1,255 (3,435) 1,910 1,162 (370) (3,420) 5,033 2,603
Financial summary

India Power Utilities & Capital Goods Sectors 18 March 2013
- 68 -
Balance sheet (INRm)
Key ratios (%)
Source: FactSet, Daiwa forecasts
Company profile
ABB's businesses include power products, power systems, automation products, process automation and robotics. It manufactures a wide range of electrical, mechanical and electronic equipment and executes projects for power generation, transmission and electrification.
As at 31 Dec 2007 2008 2009 2010 2011 2012E 2013E 2014ECash & short-term investment 6,429 3,482 5,241 5,871 2,644 1,410 4,873 6,069Inventory 4,887 6,427 7,294 6,979 9,255 9,171 7,103 7,962Accounts receivable 24,236 29,759 28,577 29,260 30,825 31,037 31,536 35,767Other current assets 5,556 7,331 6,380 7,153 6,876 7,493 6,526 7,402Total current assets 41,107 46,998 47,493 49,262 49,600 49,112 50,039 57,200Fixed assets 4,579 6,833 7,895 8,238 12,523 13,582 14,475 13,792Goodwill & intangibles 0 0 0 0 0 0 0 0Other non-current assets 705 611 169 214 731 731 731 731Total assets 46,390 54,443 55,556 57,714 62,855 63,425 65,245 71,724Short-term debt 0 0 0 0 0 0 0 0Accounts payable 14,714 16,501 14,784 16,402 18,649 18,702 18,469 20,702Other current liabilities 15,279 16,715 16,535 17,075 18,861 15,462 16,184 18,084Total current liabilities 29,993 33,215 31,319 33,477 37,509 34,164 34,653 38,786Long-term debt 6 0 0 0 0 3,279 2,279 1,279Other non-current liabilities 128 38 0 0 0 0 0 0Total liabilities 30,127 33,253 31,319 33,477 37,509 37,443 36,932 40,065Share capital 424 424 424 424 424 424 424 424Reserves/R.E./others 15,840 20,766 23,814 23,813 24,921 25,558 27,889 31,235Shareholders' equity 16,263 21,190 24,237 24,237 25,345 25,982 28,313 31,659Minority interests 0 0 0 0 0 0 0 0Total equity & liabilities 46,390 54,443 55,556 57,714 62,855 63,425 65,245 71,724EV 115,255 118,196 116,436 115,807 119,034 123,546 119,083 116,888Net debt/(cash) (6,423) (3,482) (5,241) (5,871) (2,644) 1,868 (2,595) (4,790)BVPS (INR) 76.747 99.994 114.376 114.375 119.604 122.610 133.610 149.398
Year to 31 Dec 2007 2008 2009 2010 2011 2012E 2013E 2014ESales (YoY) 38.8 15.3 (8.8) 0.8 17.2 1.4 1.5 13.4EBITDA (YoY) 53.0 (1.0) (27.0) (84.1) 238.0 (14.6) 88.1 32.3Operating profit (YoY) 54.8 (1.6) (30.2) (93.3) 534.1 (27.4) 133.0 40.5Net profit (YoY) 44.5 (8.9) (20.9) (82.2) 191.8 (25.5) 88.2 41.4Core EPS (fully-diluted) (YoY) 44.5 (8.9) (20.9) (82.2) 191.8 (25.5) 88.2 41.4Gross-profit margin 18.8 17.6 16.5 11.2 12.7 12.1 14.5 15.5EBITDA margin 12.3 10.6 8.5 1.3 3.8 3.2 6.0 7.0Operating-profit margin 11.8 10.0 7.7 0.5 2.8 2.0 4.5 5.6Net profit margin 8.3 6.6 5.7 1.0 2.5 1.8 3.4 4.3ROAE 34.8 23.9 15.6 2.6 7.4 5.4 9.5 12.2ROAA 12.5 8.9 6.4 1.1 3.1 2.2 4.0 5.3ROCE 49.4 36.6 21.1 1.3 8.2 5.4 11.5 15.2ROIC 55.4 30.4 17.5 1.1 6.8 3.9 8.5 12.1Net debt to equity net cash net cash net cash net cash net cash 7.2 net cash net cashEffective tax rate 35.0 38.9 32.8 36.9 31.1 33.4 34.0 34.0Accounts receivable (days) 122.9 144.1 170.7 167.9 148.8 151.1 150.6 142.9Current ratio (x) 1.4 1.4 1.5 1.5 1.3 1.4 1.4 1.5Net interest cover (x) 59.5 19.8 19.9 1.8 6.6 3.4 9.5 20.9Net dividend payout 9.5 10.4 12.0 67.0 34.5 46.3 8.5 7.3Free cash flow yield 1.0 n.a. 1.6 1.0 n.a. n.a. 4.1 2.1
Financial summary continued …

India Power Utilities & Capital Goods Sectors 18 March 2013
- 69 -
ABB: segmental revenue and growth YoY ABB: segmental order inflow and growth YoY
Source: Company, Daiwa forecasts Source: Company, Daiwa forecasts
ABB: EBITDA margins ABB: segmental EBIT margins
Source: Company, Daiwa forecasts Source: Company, Daiwa forecasts
ABB: order book to bill ABB: net profit growth
Source: Company, Daiwa forecasts Source: Company, Daiwa forecasts
39 38 33 25 27 29 28 27 29
25 24 25 29 26 25 26 24 23
17 18 20 19 17 16 17 18 18
20 21 22 21 23 22 22 23 22
- - - 6 7 7 8 8 8
(10)
0
10
20
30
40
50
0
20
40
60
80
100
CY06
CY07
CY08
CY09
CY10
CY11
CY12
E
CY13
E
CY14
E
Power Systems (LHS) Power Products (LHS)Process Automation (LHS) Discrete Automation (LHS)Low Voltage Products (LHS) % growth in revenue YoY (RHS)
% %
38 37 30 36 26 35 28 28 28
26 25 28 25
23 25
24 24 24
19 18 18 14 22
13 17 17 17
17 19 24 20 22 21 22 22 22
5 7 6 8 8 8
(30)(20)(10)0102030405060
0
20
40
60
80
100
CY06
CY07
CY08
CY09
CY10
CY11
CY12
E
CY13
E
CY14
E
Power Systems (LHS) Power Products (LHS)Process Automation (LHS) Discrete Automation (LHS)Low Voltage Products (LHS) % growth in total ordersYoY (RHS)
% %
11.2 12.3
10.6
8.5
1.3
3.8 3.2
6.0 7.0
0
2
4
6
8
10
12
14
CY06
CY07
CY08
CY09
CY10
CY11
CY12
E
CY13
E
CY14
E
%
(10)
(5)
0
5
10
15CY
06
CY07
CY08
CY09
CY10
CY11
CY12
E
Power Systems Power ProductsProcess Automation Discrete AutomationLow Voltage Products
%
14 2134
5062
85 8491 87
99 100
0.0
0.3
0.6
0.9
1.2
1.5
0
20
40
60
80
100
120
CY04
CY05
CY06
CY07
CY08
CY09
CY10
CY11
CY12
E
CY13
E
CY14
E
Orderbook (LHS) Book-to-bill ratio
INRbn x
1,543
2,187
3,403
4,917 4,481
3,546
632
1,845 1,374
2,586
3,655
0
1,000
2,000
3,000
4,000
5,000
6,000
CY04
CY05
CY06
CY07
CY08
CY09
CY10
CY11
CY12
E
CY13
E
CY14
E
INRm Decline in earnings

India Power Utilities & Capital Goods Sectors 18 March 2013
- 70 -
ABB: GFA turnover ABB: RoE
Source: Company, Daiwa forecasts Source: Company, Daiwa forecasts
ABB: stock price performance ABB: Revision to consensus earnings
Source: Bloomberg Source: Bloomberg
ABB: PER bands ABB: EV/EBITDA bands
Source: Company, Bloomberg, Daiwa Source: Company, Bloomberg, Daiwa
6.77.7
9.2
10.910.2
7.66.7
6.0
4.74.1 4.4
0
2
4
6
8
10
12
CY04
CY05
CY06
CY07
CY08
CY09
CY10
CY11
CY12
E
CY13
E
CY14
E
x
23.226.9
32.434.8
23.9
15.6
2.6 7.4 5.49.5
12.2
0
5
10
15
20
25
30
35
40
CY04
CY05
CY06
CY07
CY08
CY09
CY10
CY11
CY12
E
CY13
E
CY14
E
%
40
60
80
100
120
140
Mar
-11
May
-11
Jul-1
1
Sep-
11
Nov-
11
Jan-
12
Mar
-12
May
-12
Jul-1
2
Sep-
12
Nov-
12
Jan-
13
Mar
-13
ABB BSE Capital Goods BSE Power
%
22.2 21.9 21.3 20.7
18.1 16.6
13.6
25.4 24.7 25.2 24.8 23.5
22.0
18.6
12
15
18
21
24
27
30
Apr-1
2
May
-12
Jun-
12
Jul-1
2
Aug-
12
Sep-
12
Oct
-12
Nov-
12
Dec-
12
Jan-
13
Feb-
13
Mar
-13
FY13 EPS FY14 EPS
INR
0
300
600
900
1,200
1,500
1,800
Mar
-05
Sep-
05
Mar
-06
Sep-
06
Mar
-07
Sep-
07
Mar
-08
Sep-
08
Mar
-09
Sep-
09
Mar
-10
Sep-
10
Mar
-11
Sep-
11
Mar
-12
Sep-
12
Mar
-13
50x
30x20x
40x
INR
0
50,000
100,000
150,000
200,000
250,000
300,000
350,000
Mar
-05
Sep-
05
Mar
-06
Sep-
06
Mar
-07
Sep-
07
Mar
-08
Sep-
08
Mar
-09
Sep-
09
Mar
-10
Sep-
10
Mar
-11
Sep-
11
Mar
-12
Sep-
12
Mar
-13
INRm
45x
35x
25x
15x

India Power Utilities & Capital Goods Sectors 18 March 2013
- 71 -
Daiwa’s Asia Pacific Research Directory
HONG KONG
Nagahisa MIYABE (852) 2848 4971 [email protected] Regional Research Head
Hiroaki KATO (852) 2532 4121 [email protected] Regional Research Co-head
John HETHERINGTON (852) 2773 8787 [email protected] Regional Deputy Head of Asia Pacific Research; Regional Head of Product Management
Pranab Kumar SARMAH (852) 2848 4441 [email protected] Regional Head of Research Promotion
Mingchun SUN (852) 2773 8751 [email protected] Head of China Research; Chief Economist (Regional)
Dave DAI (852) 2848 4068 [email protected] Deputy Head of Hong Kong and China Research; Pan-Asia/Regional Head of Clean Energy and Utilities; Utilities; Power Equipment; Renewables (Hong Kong, China)
Kevin LAI (852) 2848 4926 [email protected] Deputy Head of Regional Economics; Macro Economics (Regional)
Chi SUN (852) 2848 4427 [email protected] Macro Economics (China)
Christie CHIEN (852) 2848 4482 [email protected] Macro Economics (Taiwan)
Jonas KAN (852) 2848 4439 [email protected] Head of Hong Kong Research; Head of Hong Kong and China Property; Regional Property Coordinator; Property Developers (Hong Kong)
Jeff CHUNG (852) 2773 8783 [email protected] Automobiles and Components (China)
Grace WU (852) 2532 4383 [email protected] Head of Greater China FIG; Banking (Hong Kong, China)
Jerry YANG (852) 2773 8842 [email protected] Banking (Taiwan)/Diversified Financials (Taiwan and China)
Leon QI (852) 2532 4381 [email protected] Banking (Hong Kong, China)
Joseph HO (852) 2848 4443 [email protected] Head of Industrials and Machineries (Hong Kong, China); Capital Goods –Electronics Equipments and Machinery (Hong Kong, China)
Winston CAO (852) 2848 4469 [email protected] Capital Goods – Machinery (China)
Bing ZHOU (852) 2773 8782 [email protected] Consumer/Retail (Hong Kong, China); Hotels, Restaurants and Leisure - Casinos and Gaming (Hong Kong, Macau)
Cris XU (852) 2773 8736 [email protected] Household & Personal Products (China)
Eric CHEN (852) 2773 8702 [email protected] Pan-Asia/Regional Head of IT/Electronics; Semiconductor/IC Design (Regional)
Felix LAM (852) 2532 4341 [email protected] Head of Materials (Hong Kong, China); Cement and Building Materials (China, Taiwan); Property (China)
John CHOI (852) 2773 8730 [email protected] Head of Multi-Industries (Hong Kong, China); Small/Mid Cap (Regional); Internet (China)
Joey CHEN (852) 2848 4483 [email protected] Steel (China)
Kelvin LAU (852) 2848 4467 [email protected] Head of Transportation (Hong Kong, China); Hong Kong and China Research Coordinator; Transportation (Regional)
Jibo MA (852) 2848 4489 [email protected] Head of Custom Products Group; Custom Products Group
Thomas HO (852) 2773 8716 [email protected] Custom Products Group
PHILIPPINES
Rommel RODRIGO (63) 2 813 7344 ext 302
Head of Philippines Research; Strategy; Capital Goods; Materials
SOUTH KOREA
Chang H LEE (82) 2 787 9177 [email protected] Head of Korea Research; Strategy; Banking/Finance
Sung Yop CHUNG (82) 2 787 9157 [email protected] Pan-Asia Co-head/Regional Head of Automobiles and Components; Automobiles; Shipbuilding; Steel
Jun Yong BANG (82) 2 787 9168 [email protected] Automobiles and Components; Chemical
Anderson CHA (82) 2 787 9185 [email protected] Banking/Finance
Mike OH (82) 2 787 9179 [email protected] Capital Goods (Construction and Machinery)
Sang Hee PARK (82) 2 787 9165 [email protected] Consumer/Retail
Jae H LEE (82) 2 787 9173 [email protected] IT/Electronics (Tech Hardware and Memory Chips)
Joshua OH (82) 2 787 9176 [email protected] IT/Electronics (Handset Components)
Thomas Y KWON (82) 2 787 9181 [email protected] Pan-Asia Head of Internet & Telecommunications; Software (Korea) – Internet/On-line Game
TAIWAN
Mark CHANG (886) 2 8758 6245 [email protected] Head of Research; Regional Head of Small/Medium Cap; Small/Medium Cap (Regional)
Birdy LU (886) 2 8758 6248 [email protected]
IT/Technology Hardware (Handsets and Components)
Steven TSENG (886) 2 8758 6252 [email protected]
IT/Technology Hardware (PC Hardware)
Christine WANG (886) 2 8758 6249 [email protected] IT/Technology Hardware (Automation); Cement
Lynn CHENG (886) 2 8758 6253 [email protected] IT/Electronics (Semiconductor)
Rita HSU (886) 2 8758 6254 [email protected] Small/Mid Cap
INDIA
Punit SRIVASTAVA (91) 22 6622 1013 [email protected] Head of Research; Strategy; Banking/Finance
Navin MATTA (91) 22 6622 8411 [email protected] Automobiles and Components
Saurabh MEHTA (91) 22 6622 1009 [email protected] Capital Goods; Utilities
Mihir SHAH (91) 22 6622 1020 [email protected] FMCG/Consumer
Deepak PODDAR (91) 22 6622 1016 [email protected]
Materials
Nirmal RAGHAVAN (91) 22 6622 1018 [email protected] Oil and Gas; Utilities
SINGAPORE
Adrian LOH (65) 6499 6548 [email protected] Head of Singapore Research, Regional Head of Oil and Gas; Oil and Gas (ASEAN and China); Capital Goods (Singapore)
Srikanth VADLAMANI (65) 6499 6570 [email protected] Banking (ASEAN)
David LUM (65) 6329 2102 [email protected] Property and REITs
Ramakrishna MARUVADA (65) 6499 6543 [email protected] Head of ASEAN & India Telecommunications; Telecommunications (ASEAN & India)

India Power Utilities & Capital Goods Sectors 18 March 2013
- 72 -
Daiwa’s Offices
Office / Branch / Affiliate Address Tel Fax
DAIWA SECURITIES GROUP INC
HEAD OFFICE Gran Tokyo North Tower, 1-9-1, Marunouchi, Chiyoda-ku, Tokyo, 100-6753 (81) 3 5555 3111 (81) 3 5555 0661
Daiwa Securities Trust Company One Evertrust Plaza, Jersey City, NJ 07302, U.S.A. (1) 201 333 7300 (1) 201 333 7726
Daiwa Securities Trust and Banking (Europe) PLC (Head Office) 5 King William Street, London EC4N 7JB, United Kingdom (44) 207 320 8000 (44) 207 410 0129
Daiwa Europe Trustees (Ireland) Ltd Level 3, Block 5, Harcourt Centre, Harcourt Road, Dublin 2, Ireland (353) 1 603 9900 (353) 1 478 3469
Daiwa Capital Markets America Inc Financial Square, 32 Old Slip, New York, NY10005, U.S.A. (1) 212 612 7000 (1) 212 612 7100
Daiwa Capital Markets America Inc. San Francisco Branch 555 California Street, Suite 3360, San Francisco, CA 94104, U.S.A. (1) 415 955 8100 (1) 415 956 1935
Daiwa Capital Markets Europe Limited 5 King William Street, London EC4N 7AX, United Kingdom (44) 20 7597 8000 (44) 20 7597 8600
Daiwa Capital Markets Europe Limited, Frankfurt Branch Trianon Building, Mainzer Landstrasse 16, 60325 Frankfurt am Main, Federal Republic of Germany
(49) 69 717 080 (49) 69 723 340
Daiwa Capital Markets Europe Limited, Paris Representative Office 36, rue de Naples, 75008 Paris, France (33) 1 56 262 200 (33) 1 47 550 808
Daiwa Capital Markets Europe Limited, London, Geneva Branch 50 rue du Rhône, P.O.Box 3198, 1211 Geneva 3, Switzerland (41) 22 818 7400 (41) 22 818 7441
Daiwa Capital Markets Europe Limited, Moscow Representative Office
Midland Plaza 7th Floor, 10 Arbat Street, Moscow 119002, Russian Federation
(7) 495 641 3416 (7) 495 775 6238
Daiwa Capital Markets Europe Limited, Bahrain Branch 7th Floor, The Tower, Bahrain Commercial Complex, P.O. Box 30069, Manama, Bahrain
(973) 17 534 452 (973) 17 535 113
Daiwa Capital Markets Hong Kong Limited Level 28, One Pacific Place, 88 Queensway, Hong Kong (852) 2525 0121 (852) 2845 1621
Daiwa Capital Markets Singapore Limited 6 Shenton Way #26-08, DBS Building Tower Two, Singapore 068809, Republic of Singapore
(65) 6220 3666 (65) 6223 6198
Daiwa Capital Markets Australia Limited Level 34, Rialto North Tower, 525 Collins Street, Melbourne, Victoria 3000, Australia
(61) 3 9916 1300 (61) 3 9916 1330
DBP-Daiwa Capital Markets Philippines, Inc 18th Floor, Citibank Tower, 8741 Paseo de Roxas, Salcedo Village, Makati City, Republic of the Philippines
(632) 813 7344 (632) 848 0105
Daiwa-Cathay Capital Markets Co Ltd 14/F, 200, Keelung Road, Sec 1, Taipei, Taiwan, R.O.C. (886) 2 2723 9698 (886) 2 2345 3638
Daiwa Securities Capital Markets Korea Co., Ltd. One IFC, 10 Gukjegeumyung-Ro, Yeouido-dong, Yeongdeungpo-gu, Seoul, 150-876, Korea
(82) 2 787 9100 (82) 2 787 9191
Daiwa Securities Capital Markets Co Ltd, Beijing Representative Office
Room 3503/3504, SK Tower, No.6 Jia Jianguomen Wai Avenue, Chaoyang District, Beijing 100022, People’s Republic of China
(86) 10 6500 6688 (86) 10 6500 3594
Daiwa SSC Securities Co Ltd 45/F, Hang Seng Tower, 1000 Lujiazui Ring Road, Pudong, Shanghai 200120, People’s Republic of China
(86) 21 3858 2000 (86) 21 3858 2111
Daiwa Securities Capital Markets Co. Ltd, Bangkok Representative Office
18th Floor, M Thai Tower, All Seasons Place, 87 Wireless Road, Lumpini, Pathumwan, Bangkok 10330, Thailand
(66) 2 252 5650 (66) 2 252 5665
Daiwa Capital Markets India Private Ltd 10th Floor, 3 North Avenue, Maker Maxity, Bandra Kurla Complex, Bandra East, Mumbai – 400051, India
(91) 22 6622 1000 (91) 22 6622 1019
Daiwa Securities Capital Markets Co. Ltd, Hanoi Representative Office
Suite 405, Pacific Palace Building, 83B, Ly Thuong Kiet Street, Hoan Kiem Dist. Hanoi, Vietnam
(84) 4 3946 0460 (84) 4 3946 0461
DAIWA INSTITUTE OF RESEARCH LTD
HEAD OFFICE 15-6, Fuyuki, Koto-ku, Tokyo, 135-8460, Japan (81) 3 5620 5100 (81) 3 5620 5603
MARUNOUCHI OFFICE Gran Tokyo North Tower, 1-9-1, Marunouchi, Chiyoda-ku, Tokyo, 100-6756 (81) 3 5555 7011 (81) 3 5202 2021
New York Research Center 11th Floor, Financial Square, 32 Old Slip, NY, NY 10005-3504, U.S.A. (1) 212 612 6100 (1) 212 612 8417
London Research Centre 3/F, 5 King William Street, London, EC4N 7AX, United Kingdom (44) 207 597 8000 (44) 207 597 8550

India Power Utilities & Capital Goods Sectors 18 March 2013
- 73 -
Disclaimer
This publication is produced by Daiwa Securities Group Inc. and/or its non-U.S. affiliates, and distributed by Daiwa Securities Group Inc. and/or its non-U.S. affiliates, except to the extent expressly provided herein. This publication and the contents hereof are intended for information purposes only, and may be subject to change without further notice. Any use, disclosure, distribution, dissemination, copying, printing or reliance on this publication for any other purpose without our prior consent or approval is strictly prohibited. Neither Daiwa Securities Group Inc. nor any of its respective parent, holding, subsidiaries or affiliates, nor any of its respective directors, officers, servants and employees, represent nor warrant the accuracy or completeness of the information contained herein or as to the existence of other facts which might be significant, and will not accept any responsibility or liability whatsoever for any use of or reliance upon this publication or any of the contents hereof. Neither this publication, nor any content hereof, constitute, or are to be construed as, an offer or solicitation of an offer to buy or sell any of the securities or investments mentioned herein in any country or jurisdiction nor, unless expressly provided, any recommendation or investment opinion or advice. Any view, recommendation, opinion or advice expressed in this publication may not necessarily reflect those of Daiwa Securities Capital Markets Co. Ltd., and/or its affiliates nor any of its respective directors, officers, servants and employees except where the publication states otherwise. This research report is not to be relied upon by any person in making any investment decision or otherwise advising with respect to, or dealing in, the securities mentioned, as it does not take into account the specific investment objectives, financial situation and particular needs of any person. Daiwa Securities Group Inc., its subsidiaries or affiliates, or its or their respective directors, officers and employees from time to time have trades as principals, or have positions in, or have other interests in the securities of the company under research including derivatives in respect of such securities or may have also performed investment banking and other services for the issuer of such securities. The following are additional disclosures. Japan Daiwa Securities Co. Ltd. and Daiwa Securities Group Inc. Daiwa Securities Co. Ltd. is a subsidiary of Daiwa Securities Group Inc. Investment Banking Relationship
Within the preceding 12 months, The subsidiaries and/or affiliates of Daiwa Securities Group Inc. * has lead-managed public offerings and/or secondary offerings (excluding straight bonds) of the securities of the following companies: Rexlot Holdings Limited (555 HK); China Outfitters Holdings Limited (1146 HK); Beijing Jingneng Clean Energy Co. Limited (579 HK); Infraware Inc. (041020 KS); Jiangnan Group Limited (1366 HK); Huadian Fuxin Energy Corporation Limited (816 HK).
*Subsidiaries of Daiwa Securities Group Inc. for the purposes of this section shall mean any one or more of: Daiwa Capital Markets Hong Kong Limited, Daiwa Capital Markets Singapore Limited, Daiwa Capital Markets Australia Limited, Daiwa Capital Markets India Private Limited, Daiwa-Cathay Capital Markets Co., Ltd., Daiwa Securities Capital Markets Korea Co., Ltd. Hong Kong This research is distributed in Hong Kong by Daiwa Capital Markets Hong Kong Limited (“DHK”) which is regulated by the Hong Kong Securities and Futures Commission. Recipients of this research in Hong Kong may contact DHK in respect of any matter arising from or in connection with this research. Ownership of Securities For “Ownership of Securities” information, please visit BlueMatrix disclosure Link at https://daiwa3.bluematrix.com/sellside/Disclosures.action. Investment Banking Relationship For “Investment Banking Relationship”, please visit BlueMatrix disclosure Link at https://daiwa3.bluematrix.com/sellside/Disclosures.action. Relevant Relationship (DHK) DHK may from time to time have an individual employed by or associated with it serves as an officer of any of the companies under its research coverage. DHK market making DHK may from time to time make a market in securities covered by this research.
Singapore This research is distributed in Singapore by Daiwa Capital Markets Singapore Limited and it may only be distributed in Singapore to accredited investors, expert investors and institutional investors as defined in the Financial Advisers Regulations and the Securities and Futures Act (Chapter 289), as amended from time to time. By virtue of distribution to these category of investors, Daiwa Capital Markets Singapore Limited and its representatives are not required to comply with Section 36 of the Financial Advisers Act (Chapter 110) (Section 36 relates to disclosure of Daiwa Capital Markets Singapore Limited’s interest and/or its representative’s interest in securities). Recipients of this research in Singapore may contact Daiwa Capital Markets Singapore Limited in respect of any matter arising from or in connection with the research. Australia This research is distributed in Australia by Daiwa Capital Markets Stockbroking Limited and it may only be distributed in Australia to wholesale investors within the meaning of the Corporations Act. Recipients of this research in Australia may contact Daiwa Capital Markets Stockbroking Limited in respect of any matter arising from or in connection with the research. Ownership of Securities For “Ownership of Securities” information, please visit BlueMatrix disclosure Link at https://daiwa3.bluematrix.com/sellside/Disclosures.action. India This research is distributed by Daiwa Capital Markets India Private Limited (DAIWA) which is an intermediary registered with Securities & Exchange Board of India. This report is not to be considered as an offer or solicitation for any dealings in securities. While the information in this report has been compiled by DAIWA in good faith from sources believed to be reliable, no representation or warranty, express of implied, is made or given as to its accuracy, completeness or correctness. DAIWA its officers, employees, representatives and agents accept no liability whatsoever for any loss or damage whether direct, indirect, consequential or otherwise howsoever arising (whether in negligence or otherwise) out of or in connection with or from any use of or reliance on the contents of and/or omissions from this document. Consequently DAIWA expressly disclaims any and all liability for, or based on or relating to any such information contained in or errors in or omissions in this report. Accordingly, you are recommended to seek your own legal, tax or other advice and should rely solely on your own judgment, review and analysis, in evaluating the information in this document. The data contained in this document is subject to change without any prior notice DAIWA reserves its right to modify this report as maybe required from time to time. DAIWA is committed to providing independent recommendations to its Clients and would be happy to provide any information in response to any query from its Clients. This report is strictly confidential and is being furnished to you solely for your information. The information contained in this document should not be reproduced (in whole or in part) or redistributed in any form to any other person. We and our group companies, affiliates, officers, directors and employees may from time to time, have long or short positions, in and buy sell the securities thereof, of company(ies) mentioned herein or be engaged in any other transactions involving such securities and earn brokerage or other compensation or act as advisor or have the potential conflict of interest with respect to any recommendation and related information or opinion. DAIWA prohibits its analyst and their family members from maintaining a financial interest in the securities or derivatives of any companies that the analyst cover. This report is not intended or directed for distribution to, or use by any person, citizen or entity which is resident or located in any state or country or jurisdiction where such publication, distribution or use would be contrary to any statutory legislation, or regulation which would require DAIWA and its affiliates/ group companies to any registration or licensing requirements. The views expressed in the report accurately reflect the analyst’s personal views about the securities and issuers that are subject of the Report, and that no part of the analyst’s compensation was, is or will be directly or indirectly, related to the recommendations or views expressed in the Report. This report does not recommend to US recipients the use of Daiwa Capital Markets India Private Limited or any of its non – US affiliates to effect trades in any securities and is not supplied with any understanding that US recipients will direct commission business to Daiwa Capital Markets India Private Limited. Taiwan This research is distributed in Taiwan by Daiwa-Cathay Capital Markets Co., Ltd and it may only be distributed in Taiwan to institutional investors or specific investors who have signed recommendation contracts with Daiwa-Cathay Capital Markets Co., Ltd in accordance with the Operational Regulations Governing Securities Firms Recommending Trades in Securities to Customers. Recipients of this research in Taiwan may contact Daiwa-Cathay Capital Markets Co., Ltd in respect of any matter arising from or in connection with the research. Philippines This research is distributed in the Philippines by DBP-Daiwa Capital Markets Philippines, Inc. which is regulated by the Philippines Securities and Exchange Commission and the Philippines Stock Exchange, Inc. Recipients of this research in the Philippines may contact DBP-Daiwa Capital Markets Philippines, Inc. in respect of any matter arising from or in connection with the research. DBP-Daiwa Capital Markets Philippines, Inc. recommends that investors independently assess, with a professional advisor, the specific financial risks as well as the legal, regulatory, tax, accounting, and other consequences of a proposed transaction. DBP-Daiwa Capital Markets Philippines, Inc. may have positions or may be materially interested in the securities in any of the markets mentioned in the publication or may have performed other services for the issuers of such securities. For relevant securities and trading rules please visit SEC and PSE Link at http://www.sec.gov.ph/irr/AmendedIRRfinalversion.pdf and http://www.pse.com.ph/ respectively. United Kingdom This research report is produced by Daiwa Securities Capital Markets Co., Ltd and/or its affiliates and is distributed by Daiwa Capital Markets Europe Limited in the European Union, Iceland, Liechtenstein, Norway and Switzerland. Daiwa Capital Markets Europe Limited is authorised and regulated by The Financial Services Authority (“FSA”) and is a member of the London Stock Exchange, Chi-X, Eurex and NYSE Liffe. Daiwa Capital Markets Europe Limited and its affiliates may, from time to time, to the extent permitted by law, participate or invest in other financing transactions with the issuers of the securities referred to herein (the “Securities”), perform services for or solicit business from such issuers, and/or have a position or effect transactions in the Securities or options thereof and/or may have acted as an underwriter during the past twelve months for the issuer of such securities. In addition, employees of Daiwa Capital Markets Europe Limited and its affiliates may have positions and effect transactions in such securities or options and may serve as Directors of such issuers. Daiwa Capital Markets Europe Limited may, to the extent permitted by applicable UK law and other applicable law or regulation, effect transactions in the Securities before this material is published to recipients.

India Power Utilities & Capital Goods Sectors 18 March 2013
- 74 -
This publication is intended for investors who are not Retail Clients in the United Kingdom within the meaning of the Rules of the FSA and should not therefore be distributed to such Retail Clients in the United Kingdom. Should you enter into investment business with Daiwa Capital Markets Europe’s affiliates outside the United Kingdom, we are obliged to advise that the protection afforded by the United Kingdom regulatory system may not apply; in particular, the benefits of the Financial Services Compensation Scheme may not be available. Daiwa Capital Markets Europe Limited has in place organisational arrangements for the prevention and avoidance of conflicts of interest. Our conflict management policy is available at http://www.uk.daiwacm.com/about-us/corporate-governance-and-regulatory. Regulatory disclosures of investment banking relationships are available at https://daiwa3.bluematrix.com/sellside/Disclosures.action.
Germany
This document has been approved by Daiwa Capital Markets Europe Limited and is distributed in Germany by Daiwa Capital Markets Europe Limited, Niederlassung Frankfurt which is regulated by BaFin (Bundesanstalt fuer Finanzdienstleistungsaufsicht) for the conduct of business in Germany.
Bahrain
This research material is issued/compiled by Daiwa Capital Markets Europe Limited, Bahrain Branch, regulated by The Central Bank of Bahrain and holds Investment Business Firm – Category 2 license and having its official place of business at the Bahrain World Trade Centre, South Tower, 7th floor, P.O. Box 30069, Manama, Kingdom of Bahrain. Tel No. +973 17534452 Fax No. +973 535113
This material is provided as a reference for making investment decisions and is not intended to be a solicitation for investment. Investment decisions should be made at your own discretion and risk. Accordingly, no representation or warranty, express or implied, is made as to and no reliance should be placed on the fairness, accuracy, completeness or correctness of the information and opinions contained in this document, Content herein is based on information available at the time the research material was prepared and may be amended or otherwise changed in the future without notice. All information is intended for the private use of the person to whom it is provided without any liability whatsoever on the part of Daiwa Capital Markets Europe Limited, Bahrain Branch, any associated company or the employees thereof. If you are in doubt about the suitability of the product or the research material itself, please consult your own financial adviser. Daiwa Capital Markets Europe Limited, Bahrain Branch retains all rights related to the content of this material, which may not be redistributed or otherwise transmitted without prior consent. United States This report is distributed in the U.S. by Daiwa Capital Markets America Inc. (DCMA). It may not be accurate or complete and should not be relied upon as such. It reflects the preparer’s views at the time of its preparation, but may not reflect events occurring after its preparation; nor does it reflect DCMA’s views at any time. Neither DCMA nor the preparer has any obligation to update this report or to continue to prepare research on this subject. This report is not an offer to sell or the solicitation of any offer to buy securities. Unless this report says otherwise, any recommendation it makes is risky and appropriate only for sophisticated speculative investors able to incur significant losses. Readers should consult their financial advisors to determine whether any such recommendation is consistent with their own investment objectives, financial situation and needs. This report does not recommend to U.S. recipients the use of any of DCMA’s non-U.S. affiliates to effect trades in any security and is not supplied with any understanding that U.S. recipients of this report will direct commission business to such non-U.S. entities. Unless applicable law permits otherwise, non-U.S. customers wishing to effect a transaction in any securities referenced in this material should contact a Daiwa entity in their local jurisdiction. Most countries throughout the world have their own laws regulating the types of securities and other investment products which may be offered to their residents, as well as a process for doing so. As a result, the securities discussed in this report may not be eligible for sales in some jurisdictions. Customers wishing to obtain further information about this report should contact DCMA: Daiwa Capital Markets America Inc., Financial Square, 32 Old Slip, New York, New York 10005 (telephone 212-612-7000). Ownership of Securities For “Ownership of Securities” information please visit BlueMatrix disclosure Link at https://daiwa3.bluematrix.com/sellside/Disclosures.action. Investment Banking Relationships For “Investment Banking Relationships” please visit BlueMatrix disclosure link at https://daiwa3.bluematrix.com/sellside/Disclosures.action. DCMA Market Making For “DCMA Market Making” please visit BlueMatrix disclosure link at https://daiwa3.bluematrix.com/sellside/Disclosures.action. Research Analyst Conflicts For updates on “Research Analyst Conflicts” please visit BlueMatrix disclosure link at https://daiwa3.bluematrix.com/sellside/Disclosures.action. The principal research analysts who prepared this report have no financial interest in securities of the issuers covered in the report, are not (nor are any members of their household) an officer, director or advisory board member of the issuer(s) covered in the report, and are not aware of any material relevant conflict of interest involving the analyst or DCMA, and did not receive any compensation from the issuer during the past 12 months except as noted: no exceptions. Research Analyst Certification For updates on “Research Analyst Certification” and “Rating System” please visit BlueMatrix disclosure link at https://daiwa3.bluematrix.com/sellside/Disclosures.action. The views about any and all of the subject securities and issuers expressed in this Research Report accurately reflect the personal views of the research analyst(s) primarily responsible for this report (or the views of the firm producing the report if no individual analysts[s] is named on the report); and no part of the compensation of such analyst(s) (or no part of the compensation of the firm if no individual analyst[s)] is named on the report) was, is, or will be directly or indirectly related to the specific recommendations or views contained in this Research Report. The following explains the rating system in the report as compared to relevant local indices, based on the beliefs of the author of the report. "1": the security could outperform the local index by more than 15% over the next six months. "2": the security is expected to outperform the local index by 5-15% over the next six months. "3": the security is expected to perform within 5% of the local index (better or worse) over the next six months. "4": the security is expected to underperform the local index by 5-15% over the next six months. "5": the security could underperform the local index by more than 15% over the next six months. Additional information may be available upon request. Japan - additional notification items pursuant to Article 37 of the Financial Instruments and Exchange Law (This Notification is only applicable where report is distributed by Daiwa Securities Co. Ltd.) If you decide to enter into a business arrangement with us based on the information described in materials presented along with this document, we ask you to pay close attention to the following items. • In addition to the purchase price of a financial instrument, we will collect a trading commission* for each transaction as agreed beforehand with you. Since commissions may be included in
the purchase price or may not be charged for certain transactions, we recommend that you confirm the commission for each transaction. • In some cases, we may also charge a maximum of ¥ 2 million (including tax) per year as a standing proxy fee for our deposit of your securities, if you are a non-resident of Japan. • For derivative and margin transactions etc., we may require collateral or margin requirements in accordance with an agreement made beforehand with you. Ordinarily in such cases, the
amount of the transaction will be in excess of the required collateral or margin requirements. • There is a risk that you will incur losses on your transactions due to changes in the market price of financial instruments based on fluctuations in interest rates, exchange rates, stock prices,
real estate prices, commodity prices, and others. In addition, depending on the content of the transaction, the loss could exceed the amount of the collateral or margin requirements. • There may be a difference between bid price etc. and ask price etc. of OTC derivatives handled by us. • Before engaging in any trading, please thoroughly confirm accounting and tax treatments regarding your trading in financial instruments with such experts as certified public accountants.
*The amount of the trading commission cannot be stated here in advance because it will be determined between our company and you based on current market conditions and the content of each transaction etc.
When making an actual transaction, please be sure to carefully read the materials presented to you prior to the execution of agreement, and to take responsibility for your own decisions regarding the signing of the agreement with us. Corporate Name: Daiwa Securities Co. Ltd. Financial instruments firm: chief of Kanto Local Finance Bureau (Kin-sho) No.108 Memberships: Japan Securities Dealers Association, Financial Futures Association of Japan Japan Securities Investment Advisers Association Type II Financial Instruments Firms Association