Embed Size (px)
Citation preview

Policy Research Working Paper 8002
Do Foreign Investors Underperform?
An Empirical Decomposition into Style and Flows
Alvaro PedrazaFredy PulgaJose Vasquez
Development Research GroupFinance and Private Sector Development TeamMarch 2017
WPS8002P
ublic
Dis
clos
ure
Aut
horiz
edP
ublic
Dis
clos
ure
Aut
horiz
edP
ublic
Dis
clos
ure
Aut
horiz
edP
ublic
Dis
clos
ure
Aut
horiz
ed

Produced by the Research Support Team
Abstract
The Policy Research Working Paper Series disseminates the findings of work in progress to encourage the exchange of ideas about development issues. An objective of the series is to get the findings out quickly, even if the presentations are less than fully polished. The papers carry the names of the authors and should be cited accordingly. The findings, interpretations, and conclusions expressed in this paper are entirely those of the authors. They do not necessarily represent the views of the International Bank for Reconstruction and Development/World Bank and its affiliated organizations, or those of the Executive Directors of the World Bank or the governments they represent.
Policy Research Working Paper 8002
This paper is a product of the Finance and Private Sector Development Team, Development Research Group. It is part of a larger effort by the World Bank to provide open access to its research and make a contribution to development policy discussions around the world. Policy Research Working Papers are also posted on the Web at http://econ.worldbank.org. The authors may be contacted at [email protected].
This paper studies the trading behavior and performance of foreign investors with different management styles. The analysis uses a comprehensive Colombian data with complete transaction records and unique investor identi-fication, and finds that the aggregate under-performance of foreign investors is attributable to foreign passive funds, that is, those that replicate a benchmark index. These funds pay higher prices to increase the speed of their trades to accommodate daily flows proportionally to their index before market closing. Passive funds face
higher transaction costs on days when they trade multi-ple stocks in the same direction, buy (sell) the same stock multiple times, and make large trades near the daily clos-ing time. Meanwhile, foreign active funds trade at more favorable prices and display higher risk-adjusted returns than any other investor group, including domestic funds with similar active management. The findings highlight the potential costs of index investing in developing countries or in securities with low trading activity (small stocks).
Do Foreign Investors Underperform? An Empirical
Decomposition into Style and Flows
Alvaro Pedraza∗ Fredy Pulga† Jose Vasquez‡§
JEL Classification: G12, G14, G23
Keywords: Foreign investors, index funds, performance, transactional data.
∗Corresponding author: World Bank Group, 1818 H Street NW, Washington D.C. 20433, USA. Tel: +1 202 7794158. E-mail address: [email protected].†Universidad de la Sabana, Km 7 Autopista Norte, Bogota, Colombia.‡World Bank and School of Economics, Navarra University, Garcia de Paredes 55 28023, Madrid, Spain.§We have benefited from the comments of Sushant Acharya, Pablo Cuba, Aart Kraay, Pete Kyle, Soledad Martinez,
Claudia Ruiz, and Giorgo Sertsios. We thank Adriana Cardenas and other members of the Colombian Stock ExchangeResearch Committee for providing the data and for multiple discussions. We are also grateful for funding received forthis project from the Strategic Research Program. The views expressed in this paper are entirely those of the authors.They do not necessarily represent the views of the International Bank for Reconstruction and Development/WorldBank and its affiliated organizations, or those of the Executive Directors of the World Bank or the governments theyrepresent.

1 Introduction
“Passive investing has become investors default, driving billions into funds that track
indexes. It’s transforming Wall Street, corporate boardrooms and the life of the neigh-
borhood broker.” (Wall Street Journal, October 17, 2016)
The relative performance of foreign versus domestic investors has been of long-standing interest
to financial economists. Whether foreign individuals or more sophisticated foreign money managers
under-perform local investors is often attributed to an information advantage of one group over the
other. For instance, domestic investors might have an edge due to cultural affinity and familiarity
with local conditions (e.g. Chan et al., 2005; Portes and Rey, 2005; Leuz et al., 2010). In fact,
the international finance literature has often used the view that distance reduces the quality of
information to explain home bias, the volatility of capital flows, and herding (Brennan and Cao,
1997; Lewis, 1999; Karolyi and Stulz, 2003). Conversely, foreign investors might have an advantage
if they are more experienced or if they acquire private information from their presence in multiple
markets (Froot and Ramadorai, 2008; Albuquerque et al., 2009). Average performance, however,
does not only depend on skills in identifying investment opportunities, but also on various constraints
faced by fund managers. For example, on the manager’s discretion to accommodate flows if the
fund is actively or passively managed (index funds).
In this paper we study an issue that is fundamental to understanding the behavior of global
investors in equity markets —the effects of management style on performance. Namely, how do
trading strategies and portfolio returns of foreign funds differ from domestic funds with similar
style of active management? Answering this question would be naturally useful to individual and
institutional investors with international portfolios. Moreover, the issue is particularly relevant
for at least two reasons. First, cross-border portfolio investments are increasingly important in
global markets. Since 2001, the share of equity holdings by foreign investors grew from 19 percent
of the world’s stock market capitalization to more than 35 percent by the end of 2015 (IMF,
2016). Second, much of this recent growth has been in explicit index funds (Cremers et al., 2016).
Notwithstanding their popularity among investors, little is known about how managers of these
funds trade to accommodate net flows, and how their performance compares to local funds with
1

passive management.
While the effect of distance on performance has been extensively studied in the literature, the role
that active management plays on the investment strategies of foreign asset managers has received
little attention. A growing number of empirical studies use complete transaction records within
a country, and compare foreign-managed versus domestic-managed funds. Some of these studies
provide support in favor of the superior skills of domestic investors (Hau, 2001; Choe et al., 2005;
Dvorak, 2005), others document that foreign investors outperform locals (Grinblatt and Keloharju,
2000; Seasholes, 2004; Barber et al., 2009), and some find no differences in performance (Seasholes
and Zhu, 2010). Despite using comprehensive transaction level data, most of these studies do not
distinguish within each group (foreign or domestic), whether one investor is making all the poorly-
performing trades or if the trades are performed by different investors.1 In other words, these studies
do not account for within group heterogeneity that might explain portfolio returns, and what they
estimate is an average performance gap between locals and foreigners.
We investigate the issue of style and distance using a unique transaction data set from the
Colombian Stock Exchange. The advantage and novel aspect of the data is that for all the transac-
tions in the market between January 2, 2006, and January 29, 2016, we have an investor identifier
on both sides of the transaction which allows us to track each fund or individual over time. Given
the panel structure of the data, we are not only able to compare average performance between
foreign and domestic investors, but we can also study the extent to which performance is related
to investor/fund characteristics, such as style and fund flows. Despite the vast segment of the lit-
erature that focuses on investors who are separated by borders, to the best of our knowledge, we
are the first to use information on active management together with complete transaction history
to analyze the relative skill and performance of foreign versus local investors.
We find that on average, foreign investors trade at unfavorable prices relative to domestic in-
vestors. The average disadvantage relative to domestic institutions is 8 basis points for stock
purchases and 7 basis points for sales. These estimates are quantitatively similar to those reported
by Agarwal et al. (2009) in Indonesia over an 8 year period, and smaller but in the same order of
1This is typically a consequence of data restrictions in order to guarantee the anonymity of each trader. Theexceptions are Hau (2001) and Seasholes and Zhu (2010). Hau (2001) uses data on a group of professional traders butdoes not study the role of active versus passive management. Seasholes and Zhu (2010) on the other hand focuses onindividual investors.
2

magnitude to the findings of Choe et al. (2005) for the Republic of Korea between 1996 and 1998.
The comprehensiveness of our data set allows us to go beyond just the documentation of ag-
gregate trading losses and make several contributions relative to prior research. We begin by
documenting that the disadvantage of foreign investors in our sample is attributed to passively-
managed foreign funds, that is, those whose strategy consist of replicating the return on an index
by buying and holding all (or almost all) index stocks in the official index proportions. In addition
to paying higher prices for stock purchases and receiving less when they sell, these funds display
inferior risk-adjusted returns than foreign active funds. Our evidence suggests that managers of
foreign passive funds are paying a price for a trading style that differs from the trading style of
other investors. In particular, worst trades are on days when they are trying to accommodate large
flows in similar proportions to their benchmark index by (i) trading multiple stocks in the same
direction, (ii) buying (selling) the same stock multiple times, and (iii) making large trades at the
end of the trading session.
In addition to comparing performance across foreign investors with different styles of manage-
ment, we also compare the performance of foreign versus local investors by level of active manage-
ment. We find that the yearly returns of passive foreign funds are between 1.19 to 1.90 percentage
points smaller than domestic funds with similar passive strategies. This suggests that index invest-
ing by itself cannot explain the under-performance of foreign investors.
In order to understand outstanding characteristics which may be driving performance, we ana-
lyze the timing of flows across funds. The key finding is that daily net flows of passive funds are
strongly correlated in the cross-section. Specifically, we show that managers of passive funds trade
more intensively on days when other passive funds are trading in the same direction. Furthermore,
the large imbalance of daily flows by foreign passive funds appears to be generating a significant
price pressure on the stocks that they trade. We show that trades by this group are correlated with
same-day returns, which suggests that foreign passive funds are paying a price for accommodating
their daily flows.
Importantly, both components —passive portfolio management and correlated flows – are nec-
essary conditions to explain the magnitude of the under-performance of foreign investors. If flow
imbalances by passive funds are large enough, in order to trade stocks in similar index proportions,
managers pay higher transaction costs to cling to their benchmark before the end of the trading
3

session, that is, they pay a price to increase the speed of their trades to comply with their invest-
ment style. Meanwhile, other investors with more discretion over their flows appear to time their
transactions to take advantage of the common order flow by passive funds.
Our results need to be interpreted in the context of the market microstructure of the Colombian
stock market. For example, average trade size, market impact, and bid-ask spreads constraint the
speed at which managers can execute their trades. Depending on the liquidity of the underlying
asset, managers with private information would optimally split their trades in multiple transactions,
perhaps even across several days (Kyle, 1985; Kyle and Obizhaeva, 2016). Passive fund managers
with little discretion over flows, however, have a natural time limit to execute their trades, namely,
the end of the day. Consequently, managers end up paying higher transaction costs in order to meet
their “deadline” and generate lower returns.
Our evidence is related to an extensive empirical literature that studies the relative value of active
versus passive management. Numerous papers document a poor track record for active funds, with
average returns for investors significantly below those of passive benchmarks (e.g. Wermers, 2000;
Bollen and Busse, 2001; Pastor and Stambaugh, 2002; Avramov and Wermers, 2006). More recently,
Cremers and Petajisto (2009), using a new measure of active management (Active Share), find that
managers with more active trading strategies exhibit relatively more skill than less active managers.
We also use Active Share to asses the level of active management of the funds in our sample. We find
that Active Share predicts fund performance among foreign funds. More importantly, we contribute
to the literature by examining in intra-day trading patterns by level of active management and by
documenting the potential costs of passive investing.
In our paper, instead of trying to identify informational advantages of local versus foreign
investors,2 we document a particular type of disadvantage —the cost of index investing in a small
equity market. We would expect for similar findings in other developing countries, or in small
(illiquid) stocks in developed countries. Overall, our results challenge the conventional wisdom that
passive funds are, unconditionally, the best alternative for investors. While this could be the case
for U.S. households investing in their home country (French, 2008), it is possible that for global
strategies, index investing might deliver disappointing results.
2Other examples in this literature rely on lower frequency data, e.g. monthly or quarterly holdings. Most recently,Ferreira et al. (2015) use a sample of 32 countries to compare the performance of institutional investors in stocks oftheir home country to the performance of money managers located in other countries.
4

Finally, we should point out that our decomposition of performance in terms of style and flows
does not rule out informational advantages across investors. For instance, unsophisticated individual
investors seeking exposure to global markets might optimally self-select into index funds. In fact,
the positive relation between flows across passive funds suggests that investors of these funds might
be less informed, and perhaps more likely to purchase or redeem shares in their index funds at the
same time. On the other hand, active foreign investors in our sample generate yearly returns that
are 3.66 to 4.28 percentage points greater than active funds managed domestically. These results
are consistent with an advantage for this group, perhaps because they are more skilled or have
access to valuable information form their presence in several markets (Albuquerque et al., 2009).
The rest of the paper is organized as follows. In section 2 we provide some background on
the Colombian institutional setting and describe the data. In section 3 we document the general
trading patterns across different investor types and styles. We study the relation between distance,
style, and performance in Section 4 and analyze the role of flows on performance in Section 5. We
conclude in Section 6.
2 Background and Data
2.1 The Colombian Stock Exchange (CSE)
Our data span the time between January 2, 2006, and January 29, 2016. During this period, the CSE
implemented several changes in order to meet international standards. Before February, 2009, the
market operated as a continuous trading system from 8:00 to 13:00 (local time) on weekdays where
participants were only allowed to place limit orders. After February 9, 2009, a new trading platform
was launched, allowing market and stop orders. In addition, a batch auction was introduced during
the last five minutes of each trading day. During this interval, trades are collected and the system
estimates an adjudication price at the maximum volume allocated among the tenders, with the
auction closing randomly in +/- 60 seconds around the daily closing time. The auction price is also
the daily closing price for each stock. Starting January 3, 2011, the trading session was extended
to run from 8:30 to 15:00 with other rules remaining the same. Finally, on February 6, 2012, the
market synchronized its daily trading session with the New York Stock Exchange, from 9:30 NYT
5

to 16:00 NYT.3
Trades are submitted via authorized brokers registered at the exchange and buy and sell orders
meet via the Automated Trading System. Short-sells were allowed during our entire period of study,
however, investors were required to close any short position by the end of each trading day.4 There
are no individual or aggregate ownership limits on foreign investors, and they are allowed to either
reinvest or transfer earnings such as dividends, coupons or capital gains with little restrictions.
Since the Central Bank has discretionary control on net currency flows, including those to equity
instruments, foreign investors are required to report their initial investments and any subsequent
transactions that involve any currency exchange.
2.2 Data
The database, which includes all transactions in the period, was provided by the CSE. The data
disclose the date and time of each transaction, a stock identifier, order type (buy or sell), transaction
price, number of shares, and broker ID. The key novel aspect of the data, and most importantly
for our analysis, is that every transaction record has a unique investor ID number that allows us
to track all the transactions for each investor throughout the entire sample period. In addition,
the transaction records also disclose whether an investor is foreign or domestic. Domestic investors
are further classified into individuals or institutions. Institutions can be broadly categorized into
corporations, pension funds, mutual funds, banks, insurance companies, and brokerage firms trading
on their own accounts. It is important to point out that our database does not allow us to distinguish
whether a foreign investor is an individual or an institutional investor. Based on this, for the rest
of the paper we sometimes refer to foreign investors interchangeably as funds.5
There were over 13 million transactions during the 10-year period. Table 1-Panel A presents the
share of trading volume attributable to different investor types and the number of investors by type
over two sub-samples: 2006-2010 and 2011-2016. Domestic institutions dominate the Colombian
3For non-liquid stocks, an opening auction starts 15 minutes earlier, but trading at this time represents less than0.01 percent of the daily traded value.
4Other rules include a suspension mechanism on each stock based on volatility relative to a “base price” publishedon a daily basis. When a stock price changes more than 10% relative to its reference price, the exchange suspendstrading in that stock temporarily for 30 minutes. In addition, when the representative stock index (COLCAP)decreases more than 10% during a trading session, all transactions are suspended until the next trading day.
5Informal conversations with registered brokers suggest that most (and in several cases all) of their foreign clientsare institutions.
6
stock market accounting for just over half of the total value traded in both periods. Corporations,
pension funds, mutual funds, and brokerage firms account for 98 percent of this volume over the
entire sample, with banks, insurance companies and other institutions representing a small fraction
of the trading activity of domestic institutions. Consistent with international trends, there is a
growing presence of foreign investors over time. The number of foreign investors nearly doubled
from 1,440 to 2,830,6 and the share of total traded value by these group increased from 3.8% in the
first half of the sample to 19.1% in the second half. Figures 1 and 2 plot the time series of the share
of traded value and share of market capitalization respectively by investor type. These figures also
highlight the increasing importance of foreign investors in recent years.
According to Table 1-Panel B, the average number of trades by domestic institutions and foreign
investors are 317 and 316 respectively. The distribution of trades amongst different institutions,
however, is quite heterogeneous, with brokerage firms and mutual funds performing the largest
number of trades on average. We restrict our analysis by considering only those investors who
traded at least a 100 times over the 10 year period.7
We collect stock and market data from Bloomberg, Datastream and the Superintendencia Fi-
nanciera de Colombia (Colombian Financial Superintendency, SFC). We obtain stocks returns,
share price, trading volume, and bid-ask spread from Bloomberg and book value of equity, shares
outstanding, and aggregate institutional ownership from Datastream and the SFC. The number of
traded stocks fluctuated between 62 and 71 during our sample period.8
In Table 2, we present basic descriptive statistics relating to the stock market during our sample
period. According to the table, the performance of the Colombian market closely mimicked that
of the Latin American region. The table is also indicative of increased participation by foreign
investors in the CSE. Despite the large amount of outflows by foreigners during 2014 and 2015,
accumulated foreign net flows are positive over the entire sample period.
6The corresponding numbers for domestic institutions were 6,834 and 10,344 respectively.7We are aware that this cut might bias the sample to those investors who have been active in the market for a
longer period. We performed our analysis by alternatively reducing the threshold to 50 trades and also for a higherthreshold of 200 trades. These changes do not affect any our findings.
8In calculating these numbers, we treat ordinary and preferred shares issued by the same firm as different stocks.
7

2.3 Portfolio Construction
In order to construct our preferred measures of investor characteristics and styles, we use information
on portfolio holdings of market participants over the sample. A limitation of our data set is that
we do not directly observe these portfolios. However, we can build a proxy for actual holdings since
we observe all transactions that were undertaken by each investor over the entire sample. Notice
that if we were to observe portfolios at the beginning of the sample period, then our proxy would
be exactly equal to the portfolios at each point in time for each investor. We begin by imposing a
zero initial holding condition for each investor the first date that she appears in the data set. We
accumulate daily stock holdings by investor over time. In order to account for the short-sell ban,
we take the investor-stock most negative daily position in the entire time series and add that value
to the zero initial holdings. This adjustment ensures that no investor holds a negative position in
any stock at the end of any trading day. We make appropriate adjustments for stock splits and
initial public offering dates.
Despite our portfolio measure being a proxy, we are confident that it captures a significant
amount of actual holdings. This is especially true for those investors who first entered the Colombian
stock market after January 2, 2006, since the assumption that these investors had zero holdings at
the start of the sample is exact. Since many of the foreign investors entered the Colombian stock
market during our sample period, the portfolios of these investors are likely to be more accurate.
Furthermore, since we have 10 years of data, provided that portfolio turnover is large enough, errors
in our measure from differences in initial conditions would diminish very quickly over time in the
sample.9
3 Investor/Fund Style
3.1 Active versus passive management
Our data set does not allow us to observe investor/fund names or funds’ prospectus, i.e. we do
not have information on a fund self-declared investment strategy, and thus, we cannot distinguish
directly between index funds and active funds. In broad terms, passive management of a portfolio
9For instance, Cremers and Pareek (2015) find that the average turnover for an all-equity U.S. mutual funds is 85percent annually. This would imply that the average fund would trade their entire portfolio in 1.2 years.
8
consists of replicating the return on an index with a strategy of buying and holding all (or almost
all) index stocks in the official index proportions. Active management, in turn, can be defined as
deviations from passive management.
We infer active or passive management strategies by computing the Active Share (Cremers and
Petajisto, 2009) for each investor or fund. The measure represents the share of portfolio holdings
that differs from a benchmark index holdings and is calculated as:
Active Sharei,t =1
2
N∑s=1
|wi,s,t − windex,s,t| (1)
where wi,s,t and windex,s,t are the portfolio weights of stock s in fund i and the benchmark index at
time t, respectively, and the sum is taken over the universe of stocks. We compute this measure
by investor/fund at a daily frequency. For the benchmark index, we use the two most popular
Colombian equity indices that track the overall market performance - COLCAP, which is a value
weighted index, and IGBC, which is a liquidity and value weighted index. For each investor, we
compute (1) using each of these indices separately and then set the investor’s Active Share to be
the minimum of the two values.
Using Active Share to characterize management style has an advantage over using self-declared
fund style which may not accurately reflect actual investment behavior. For example, Cremers et al.
(2016) find that 20% of worldwide mutual fund assets are managed by “closet indexers” - investors
who declared themselves as active, but in reality, tracked their respective benchmarks closely as
passive investors would have.
Table 3 reports the share of assets under management (AUM) by investors with an Active
Share below 60 percent. We call this group passive investors.10 Consistent with global trends on
institutional money management, the share of total assets managed by passive domestic institutions
and passive foreign investors increased in the second half of the sample period, from 53.5 percent
to 71.7 percent for domestic institutions and from 29.4 percent to 64.8 percent for foreign investors.
Among domestic institutions, mutual funds and in particular pension funds largely fall under the
category of passively managed. According to Pedraza (2015), Colombian pension funds face a
10This 60 percent threshold has been commonly used in the literature to classify portfolio management as activeor passive (see for example Cremers et al. (2016)). While we use this threshold in this section to present descriptivestatistics, throughout the paper we sort foreign investors by quartile of Active Share or use the continuous measure.
9

financial penalty if they fail to generate a minimum return relative to a peer- and market-based
benchmark. Hence, it is not surprising that the portfolios of these funds replicate to a large extent
the market index. Figure 3 shows the monthly time series of the share of AUM by investor type.
The figure displays the upward trend of passively managed funds by domestic institutions and the
sharp rise of foreign passive funds after 2008.11
Given the unique nature of our transaction database with investor ID, we document how passive
and active investors trade during the day. Table 4 summarizes the intra-day profile of traded value
when we divide the day into eight time intervals.12 Panel A in the table reports the proportion of the
traded value by each group relative to the total traded value in the interval. Excluding the closing
batch, domestic institutions account for more than half of the value traded during each period, with
foreign investors increasing their relative importance in the afternoons. In the closing batch, foreign
investors represent 39.9 percent of the interval, with passive funds accounting for most of those
trades (30.9 percent of the interval). Panel B in the table reports the proportion of traded value
in each interval relative to the total daily value traded by investor group. Domestic institutions
and individuals execute most of their trades in the early hours of the day. On the contrary, passive
foreign funds trade on average 39.8 percent of their daily traded value in the closing batch. While
this behavior is more pronounced for the latter years in the sample, passively-managed foreign funds
were consistently very active in the last five minutes of the trading session since the closing batch
auction was introduced in 2009 (Table 4-Panel C).
Trading at or near closing prices might be an efficient strategy for open-end funds. For example,
mutual funds are “forwarded priced,” which means that while investors can place orders to buy or
sell shares throughout the day, these orders will be executed at the same price, i.e. the end-of-day
net asset value of the fund. A fund manager that trades at closing prices mitigates the timing risk
due to non-simultaneous purchases or sales of the fund shares and the underlying portfolio. In this
scenario, the price that new shareholders pay for shares that are created coincides with the value of
the underlying securities of the fund. Conversely, the price that old shareholders receive for their
11According to Factset Institutional Equity Ownership Database, the percentage of assets managed by foreignowned self-declared index funds grew from 0.1 percent in the first quarter of 2006 percent to 33.6 percent in the lastquarter of 2015. Our time series should capture “closet-indexers” as well as self-declared index funds.
12The sample includes the period between February 6, 2012, and January 29, 2016 when the CSE synchronizedits operations with the NYSE. The table is quantitatively similar if we include the period from February 9, 2011, toFebruary 6, 2012, when the market traded from 8:30 to 15:00 hours and if we match the trading session.
10

redemptions matches the value of the underlying securities in the fund. Interestingly, only foreign
passive funds display such intensive trading at the end of the trading session. For example, foreign
active funds only trade 13 percent of their daily traded value in the closing batch and domestic
mutual funds with passive management style (i.e. those with Active Share below 60) trade only 14
percent of their daily traded value at the closing batch (Figure 4).
3.2 Measures of trading activity
In addition to measuring the investor/fund management style with Active Share, we employ other
common proxies of trading activity. We measure the Fund Turnover Ratio as the minimum of
aggregate sales and aggregate purchases of stocks, divided by the average of the net asset value
of the fund. We calculate the Fund Turnover Ratio at yearly frequencies for each investor/fund
in the database. We also use equity flows normalized by the total AUM at the beginning of each
month. For each investor/fund we report the different number of stocks held in the portfolio and
the different number of stocks traded during each period.
Table 5 reports mean and median values for our variables of interest by investor group. The
average foreign investor manages a portfolio of 20.7 billion pesos (6.5 million USD) with yearly
turnover of 0.9, has monthly net flows of 2.8 percent relative to the AUM (0.14 percent at daily
frequency), holds 9.3 different stocks, and trades more than 3 stocks every month. Among domestic
institutions, pension funds manage the largest equity portfolios, have the lowest turnover ratio and
hold more than 24 different stocks.
Table 6 reports mean values of the relevant variables by investor type and sorted by Active
Share. Groups are constructed using the 25th, 50th, and 75th percentile from the distribution of
Active Share among foreign investors. We then use these cuts to sort domestic individuals and
institutions. According to the table, investors in the lowest group of Active Share, manage more
assets on average, display the lowest turnover, and hold more stocks in their portfolios. In addition,
investors and funds in the low Active Share group trade the most number of stocks on average. For
example, foreign investors in the lowest group of Active Share trade over 5 stocks each month.
11

4 Investor Performance
In order to test whether foreign investors are at a disadvantage, we use two common measures of
performance. In addition to documenting aggregate differences between local and foreign investors,
we study differences by level of active management and other investor/fund characteristics that
correlate with performance.
4.1 Average trading price
Our first measure of performance is the Value-Weighted-Average-Price (VWAP). The VWAP for
each stock s, on day d by investor i is measured as:
VWAP i,s,d =Bi,s,d
As,d× 100 (2)
where Bi,s,d is the volume-weighted average price for all purchases and sales separately for each
investor i, and As,d is the volume-weighted average price for all trades. This price ratio is computed
for buys and sells separately and captures how much more a particular investor paid (received)
relative to the average price of the day when she buys (sells).
The VWAP measure offers at least two advantages. First, it captures short-term market timing
ability and does not require the definition of an asset pricing model. Second, since the measure
has been used by Choe et al. (2005) and Agarwal et al. (2009), we can directly compare our
results to those in these studies and extend previous findings by decomposing performance into
management styles and other investor/fund characteristics.13 One limitation to the VWAP, however,
is that by comparing trading among investors at intra-day frequencies, the measure fails to capture
performance at longer horizons. More precisely, the measure does not identify whether a purchase
that was initially executed at a price above the average daily price turns out to be profitable during
the investor’s holding period. Moreover, if a trade was part of a strategy by the investor which
involves several stocks, the individual trade might be deemed as inferior but the overall strategy
could be successful. In order to consider total portfolio performance, we also measure risk-adjusted
13Most recently, Agudelo et al. (2015) use the VWAP measure to compare performance between different groups ofinvestors in Colombia. The authors, however, do not have investor ID and thus cannot study performance by stylewhich is the main focus of our paper.
12

returns by investor/fund in the following section.
Averages of VWAP by investor type are presented in Table 7-Panel A. Foreign investors pay 4
basis points (bp) more than the average daily price when they buy stocks, while domestic institutions
and domestic individuals pay 4 and 8 bp less than the average price respectively. The 8 and
12 bp differences between foreign and both domestic institutions and individuals are statistically
significant. For sells, foreign investors receive 7 bp less than domestic institutions and 8 bp relative
to domestic individuals. These results indicate that on a round-trip trade, foreign investors face
greater transactions costs on the order of 15 bp compared with domestic institutions and 20 bp
with respect to domestic individuals.14 Furthermore, an investor who trades six times per year
would contemplate a drag on performance in excess of 1 percent of her total traded value. Given
the yearly average buying value of foreign investors of 4.3 trillion COP (1.4 billion USD) and their
yearly selling value of 3.4 trillion COP (1.06 billion USD), their under-performance is equivalent
to paying 6.2 billion COP (2.0 million USD) every year on transaction costs. The documented
disadvantage is quantitatively similar to that reported by Agarwal et al. (2009) in Indonesia over
an 8 year period, and smaller but in the same order of magnitude to the one reported by Choe et
al. (2005) for Korea between 1996 and 1998.
In Panel B of Table 7, we report the average prices paid by foreigners sorted by level of Active
Share. Foreign investors in the lowest quartile of Active Share pay the highest price for purchases
while receiving the lowest price for their sells. On the contrary, foreign investors in the upper 50th
percentile of the Active Share distribution do not trade at prices significantly different from the
average price of the day, with daily purchases and sells insignificantly different from 100.
Given the distinct patterns of intra-day trading activity between passive and active foreign
investors documented in the previous section, we report average transaction prices by trading inter-
val. Table 7-Panel C reports the average trading price of passive and active foreigners based on the
execution time of each trade. We distinguish between transactions executed in the closing batch
and those that are executed during the continuous trading session.15 According to the table, for-
eign passive investors significantly trade at worst prices in both intervals. However, these investors
14The results are similar if we disaggregate the sample into trades of different sizes (results not shown in thetable). For smaller trades, foreign investors’ under-performance relative to individuals is smaller but still statisticallysignificant.
15Panel C only includes trades after February 9, 2009.
13

pay significantly higher prices during the closing batch (the difference is 9 bps with t-statistic of
11.68). In other words, passively-managed foreign funds pay more precisely when they trade more
intensively.
Actively-managed foreign funds also pay higher prices for purchases at the closing batch. Con-
versely, these investors trade at fair prices during the continuous trading session when most of their
operations are executed (VWAP for purchases and sells are indistinguishable from 100 during this
time). It is possible that foreign passive funds trade after prices have move against them due to
momentum strategies. Alternatively, the difference in transaction prices across groups might result
from price pressure exerted by passively-managed foreign funds in the stocks that they trade. We
come back to these explanations in Section 5 where we study the relation between market returns
and flows disaggregated by investor type and by management style.
So far, we document that foreign investors trade at worse prices relative to both domestic
institutions and domestic individuals. Among foreign investors, those with low Active Share and
with more transactions later in the day trade at more unfavorable prices. One limitation to the non-
parametric analysis above is that it does not account for differences in stock-firm characteristics. For
example, whether greater transaction costs are concentrated in smaller and less liquid stocks. To
account for these differences, we use linear regression analysis to further investigate the disadvantage
of foreign institutions. We follow Choe et al. (2005) and control for firm size, book-to-market ratio,
stock and market returns, and stock liquidity. More importantly for our analysis, since we track
each investor throughout the sample, we introduce our measure of active management, Active Share,
and include other controls for investor trading activity, i.e. Fund Turnover Ratio, daily net flows,
and the number of different stocks traded in each day. To capture any residual differences resulting
from trades coming later in the day, we control for the share of the traded value in each stock
executed by the investor in the closing batch. Appendix A presents the list of variables used in the
regression analysis with their corresponding definition and source. Table 8 reports the correlations
between fund/investor variables.
Our dependent variable is ∆VWAPi,s,d, defined as the difference in the daily (d) average price
that foreign investor i pays (for purchases) on stock j (VWAPi,d,j), relative to the average price
paid by all domestic institutions (VWAPd,j) in the same stock.16 We estimate the ∆VWAP for
16We also perform similar estimation relative to domestic individuals. The results are qualitatively similar and are
14

purchases and sells separately using the following model:
∆VWAPi,s,d = γYs,d + δMd + βXi,s,d + εi,s,d (3)
Ys,d is the vector of stock-firm characteristics, Md contains market variables, and Xi,s,d is the
vector with information on investor/fund style. Tables 9 and 10 present regression estimates. Table
9 includes stock fixed-effects and t-statistics are calculated from standard errors clustered at the
fund level. Following Petersen (2009), Table 10 accounts for serial correlation parametrically by
including time dummies, in addition to controlling for stock fixed-effects and cluster in the fund
dimension.17 The disadvantage of this methodology is that it omits any variable with market
information, e.g. market daily returns.
The first four regressions in Tables 9 and 10 (columns 1 to 4), compare average purchases
between foreign and domestic institutions, and the last four regressions (columns 5 to 8) compare
average sells. According to Table 9, foreign investors trade at more favorable prices on days of low
market volatility. The coefficients for opening-to-close stock returns are positive and statistically
significant in all specifications, which implies that foreign investors pay higher prices relative to
domestic institutions on stocks with positive daily returns and receive less when they sell stocks with
negative same-day returns. In regressions (5) through (8) the coefficient for stock price sensitivity,
which proxies for stock liquidity, is negative and statistically significant. This finding suggests that
foreign investors are at a disadvantage when selling stocks with lower liquidity. Also, the evidence
indicates that foreign investors sell larger stocks at better prices (Table 10).
We now turn to the investor/fund variables. We find that the disadvantage of foreign investors
is more pronounced for passively-managed funds and for those with low turnover. Coefficients for
Active Share and turnover are negative for purchases and positive for sells in all the regressions. In
columns (2) and (3) we include the number of different stocks that the fund is buying during the
day, and columns (6) and (7) include the number of different stocks that the fund is selling. The
results indicate that foreign funds trade at worse prices on days when they are trading multiple
stocks in the same direction. Moreover, foreign investors make the worst trades on days in which a
available upon request.17Note that while the Fama-MacBeth approach (Fama and MacBeth, 1973) would efficiently correct for serial
correlation in the error term, one would still need to account for the stock and fund cross-sectional correlation.
15

large portion of their traded value is executed at the closing batch.18
While some of the results would suggest that foreign investors do worse on stocks with greater
information asymmetries, we find strong evidence that style plays a key role in explaining perfor-
mance. In particular, the disadvantage of foreign investors is concentrated among passive funds. It
appears that these funds are paying a price for a trading style that differs from the trading style of
other investors.
4.2 Risk-Adjusted Returns
We use our estimates of monthly equity holdings and the observed net flows to calculate the monthly
gross rate of returns for each fund, i.e. 1 + Ri,t =V Fi,t−NFi,t
V Fi,t−1. We use the cross-sectional variation
to see how returns vary between domestic and foreign funds, and between actively-managed versus
passively-managed funds. We adjust for heterogeneity in risk taking and in style by introducing
various performance benchmarks that account for the possibility that funds load differently on
small-cap stocks, value stock, and price momentum strategies. To be precise, we adjust monthly
fund returns in three different ways: (i) We calculate market-adjusted returns by subtracting the
returns of a market index, (ii) we adjust returns using the Capital Asset Pricing Model (CAPM)
and (iii) the Carhart four-factor model (Carhart, 1997).
The portfolios that make up our performance benchmarks are the return on the market index in
excess of the one-month Colombian T-bill rate (MARKET),19 the returns to the Fama and French
(1993) SMB (small stocks minus large stocks) and HML (high book-to-market stocks minus low
book-to-market stocks) portfolios, and the returns-to-price momentum portfolio WML (winners
minus losers, constructed based on a twelve-month formation period and a one-month holding
period).
Since we are interested in the relationship between management style and performance, we sort
domestic and foreign funds at the beginning of each month into four groups of Active Share. We
then track these eight portfolios for one month and use the entire time series of their monthly
18In the estimation results in columns (4) and (8), we exclude the variable “Number of Stocks”. The correlationbetween the number of different stocks traded during a day and the proportion of the daily trades performed in theclosing batch is 0.53 for purchases and 0.56 for sales. In other words, foreign investors trading multiple stocks in thesame direction during a day are more likely to trade more intensively at the closing batch.
19We use two other measures for the risk-free rate, the monthly return on US T-Bills in Colombian pesos and theColombian deposit rate. Our results are unchanged when using these proxies for the risk-free rate. We omit theseresults for brevity.
16

returns to calculate the loadings to the various factors for each of these portfolios. For every month
in the sample period, each fund inherits the loading of one of these eight portfolios that it belongs
to. In other words, if a foreign fund stays in the same group of Active Share throughout its life, its
loading remain the same, but if it moves from one Active Share group to another during a certain
month, it inherits a new set of loadings which we use to adjust its next month’s performance.
Table 11 reports the average market-adjusted returns and the loadings of the domestic and
foreign funds sorted by group of Active Share. We see that funds with higher Active Share tend to
have lower loadings on MARKET. For instance, while both foreign and domestic funds in the lowest
Active Share group have a market loading of 0.95 (according to the CAPM), the corresponding
loadings in the highest group of Active Share are 0.66 for foreign funds and 0.45 for domestic
funds. The negative relationship between Active Share and the market loading results almost by
construction, since funds with low Active Share are precisely those with similar holdings relative to
the market index.
According to Table 11-Panel A, passively-managed foreign funds display lower market-adjusted
returns and smaller alphas than actively-managed foreign funds. For example, while foreign funds in
Group 4 report an alpha of 0.69% in the four-factor model, the corresponding alpha of foreign funds
in the lowest Active Share group is 0.21%. In other words, actively-managed foreign funds appear
to deliver higher risk-adjusted returns relative to foreign funds with passive management strategies.
For domestic investors (Table 11-Panel B), there is no apparent relation between performance and
Active Share.
The lower risk-adjusted returns of passively-managed foreign funds complements our earlier
finding that passively-managed foreign funds buy (sell) stocks at higher (lower) prices. The result
is not straightforward since trading at unfavorable prices within a day is not necessarily equivalent
to poor performance in longer horizons. For instance, while the Spearman correlation between
market-adjusted returns and VWAP is negative for purchases and positive for sales suggesting that
investors trading at better prices tend to deliver higher returns, the correlations are only -18% and
8% respectively.20
A potential concern to our current findings is that Active Share might be correlated with other
20To calculate this correlation, we construct a monthly measure of VWAP by investor taking the value-weightedaverage of the daily VWAP across stocks.
17

fund characteristics that are driving performance. For example, fund size might erode performance
because of trading costs associated with liquidity and price impact (Chen et al., 2004). Since passive
funds are larger (see Table 6), the reported under-performance of passively-managed foreign funds
might be a consequence of their size rather than their management style. To deal with the correlation
between Active Share with other fund characteristics, we analyze the effect of past Active Share on
performance in a regression framework proposed by Fama and MacBeth (1973), where we control
for the effects of other fund characteristics on performance. We use the following specification
ADJRETi,t = µ+ βForeigni +
3∑a=1
φaGroupai,t−1 +
3∑a=1
δaGroupai,t−1 × Foreigni + γXi,t−1 + εi,t
for i = 1, ..., N (4)
where ADJRETi,t is the return of fund i in month t adjusted by various performance benchmarks
and Xi,t−1 is a set of control variables that includes fund size, turnover, and net flows. Foreign
is a dummy variable equal to 1 for foreign investors and zero otherwise. Groupai,t−1 is a dummy
variable set to one if investor i at time t−1 belongs to the Active Share group Groupa. We take the
estimates from these cross-sectional monthly regression and follow Fama and MacBeth (1973) in
taking their time series means and standard deviations to form our overall estimates. An advantage
of equation (4) is that we can directly compare differences in performance within an investor type
(domestic or foreign) and across levels of active management. Furthermore, we can test for a given
level of active management, the differences in performance by investor location.
Table 12 presents the estimation results. Among foreign funds, those that are actively managed
outperform funds with passive strategies. The difference in risk-adjusted returns is both statistically
and economically significant. Using the most conservative estimates, namely, those from the four-
factor model, actively-managed foreign funds outperform passive funds by 1.70 percent per year
(0.14 percent per month). Although these are gross returns, i.e. they do not take into account
management fees, the difference is above 0.8 percent, which is the average expense ratio that U.S.
active funds charge in excess of passive funds.21 We do not find any differences in risk-adjusted
returns between the top and bottom groups of Active Share for domestic institutional investors.
21According to Thomson Reuters Lipper, the average expense ratio of actively managed equity funds in the U.S. is1.4 percent, while the average expense ratio of passive funds is 0.6 percent.
18

Interestingly, when we compare foreign versus domestic funds within the same group of active
management, we find that foreign funds in the highest level of Active Share display higher risk-
adjusted returns relative to their domestic counterparts. More precisely, according to the four-factor
model, foreign active funds’ rate of returns are greater than those of domestic active funds by 3.66
percent per year. While we do not test directly for stories of informational advantages, it is possible
that the group of active foreign investors may be more experienced on average. On the contrary, we
find that passively-managed foreign funds exhibit lower risk-adjusted returns than domestic passive
funds (-1.19 percent per year).
To summarize, the under-performance of foreign investors in the Colombian stock market is
attributable to passively-managed funds. These funds trade at worse prices and deliver lower risk-
adjusted returns relative to active funds. While the under-performance can be explained in part by
mechanical strategies such as buying and selling multiple stocks in the portfolio at the same time near
closing prices, the fact that domestic passively-managed funds have superior performance suggests
that there are other fund characteristics other than passive management that might explain the
under-performance of foreign funds. In the next section we study outstanding differences among
foreign and domestic institutions. In particular, we focus on fund flows and discuss evidence of
feedback trading.
5 Correlated Flows and Momentum Trading
In this section, we document differences in net flows across investor types and across funds with
different degrees of active management. We also study whether investors’ demands are correlated
to contemporaneous returns, and whether investors display momentum behavior.
5.1 Cross-sectional Correlation in Equity Flows
We are interested in testing whether investors’ demands by management style are correlated in the
cross-section. To examine this question we use the dollar ratio measure of excess demand calculated
for each investor following Lakonishok et al. (1992). For a given day d, Dratioi,d is defined as:
Dratioi,d =
∑Ss=1 buysi,s,d − sellsi,s,d∑Ss=1 buysi,s,d + sellsi,s,d
(5)
19

where buysi,s,d are total purchases on stock s by fund i, and sellsi,s,d are total daily sells.
We begin the analysis by estimating, for each investor, a time-series regression of the investor
daily excess demand (Dratioi,d) on the excess demand by all investors in the same group of active
management (Dratio−id ):22
Dratioi,d = αi + βiDratio−id + εi,d for d = 1, ..., D (6)
Estimation of equation (6) includes days in which fund i is active. The empirical strategy follows
the same logic as the Fama-Macbeth methodology for each investor i. Here we run N time series
regressions and calculate the mean and standard error of the β coefficient for each group of Active
Share, and separately for domestic and foreign investors. The average β captures the extent to
which daily flows are correlated across investors in the same group. We standardized both the
dependent and independent variable such that both have zero mean and unit variance.23
The results are reported in the first column of Table 13. We find strong evidence that demands
by passively-managed foreign funds are correlated in the cross-section. The coefficient associated
with the contemporaneous demand of the foreign funds in the lowest Active Share group is 0.14 and
differs significantly from zero at the 1 percent level. Because the data are standardized, this suggests
that a one standard deviation increase in the same day demand by other passive funds is associated
with a 14 percent standard deviation greater demand of a passive fund. Since the regression only
has one independent variable, the coefficient can also be directly interpreted as the cross-sectional
correlation between daily equity demands among passive foreign funds. For foreign investors in the
highest group of Active Share, the cross-sectional correlation between daily demands is negative
but indistinguishable from zero (-0.01 with a t-statistic of 0.71). For domestic passive funds, the
daily correlation across demands is positive at 2 percent, but significantly smaller than for foreign
investors in the same group of Active Share.
It is possible that the daily cross-sectional correlation across demands by passive funds may result
from momentum strategies, if a large fraction of passive funds follow market returns.24 To evaluate
22To avoid spurious correlation between the two variables, specially for large funds, we exclude fund i from thecalculation of Dratio−i
d .23In our specifications with multiple independent variables this will allow us to directly compare estimated coeffi-
cients.24There is extensive empirical evidence suggesting that institutional investors are momentum traders (e.g. Grinblatt
et al., 1995; Wermers, 2000; Sias, 2004). That is, institutional investors systematically sell stocks with negative returns
20
the role of momentum trading in the relation between investor demands, we add lag standardized
market returns to equation (6).
Average coefficients for each group of active management are reported in model (2) of Table
13. We find that passively-managed foreign funds engage in momentum trading. For example, the
coefficient associated with standardized lag market returns is 0.03 and is statistically significant at
the 5 percent level. Momentum trading, however, accounts for little of the cross-sectional correlation
in demands. That is, adding lag market returns to the regressions has only a small impact on the
average coefficient associated with excess demand by the peer group of active management, e.g. the
average coefficient reported in the first column changes from 0.14 to 0.13. Since all the variables
are standardized, the coefficients associated with demand by the peer group and lag market returns
are directly comparable —the average coefficient of contemporaneous demand by the peer group is
over four times greater than the average coefficient associated with lag returns.
In addition to the lag returns of the Colombian stock market we add standardized lag U.S.
market returns. This controls for the potential relation between market performance abroad and
cross-border net flows at daily frequencies (Griffin et al. (2004) first documented this relation for a
group of emerging markets). Our baseline findings are robust to including this control. Results are
presented in models (3) and (4) of Table 13.
The main take away from models (2) to (4) in Table 13 is that the cross-sectional correlation
between contemporaneous demands changes little after accounting for domestic lag market returns
and U.S lag returns. In other words, momentum trading does not appear to be the primary source
of the strong correlation across demands of passively-managed foreign funds.
5.2 Momentum Trading Using Stock-Level Information
The discussion of momentum investment strategies in the previous section relies on daily flows by
investor and aggregate market returns. It is possible, however, that momentum strategies may be
more pronounced when we disaggregate the data at the investor-stock daily level. For example, the
estimated coefficients capturing momentum strategies reported earlier might be biased downwards
for investors with stock holdings significantly different from the market index. For these investors,
daily market returns could be very different from their own returns, and the resulting correlation
and buy stocks with positive returns.
21

between lag returns and flows would be small.
In order to consider investor-stock information, we calculate the momentum measure of Grinblatt
et al. (1995) using daily trades on individual stocks as follows:
Mi,k =1
T
D∑d=1
S∑s=1
(Qi,s,d −Qi,s,d−1
Qi,s,d
)Rs,d−k (7)
where Qi,s,d are holdings by fund i of stock s at day d, Qi,s,d is defined as (Qi,s,d +Qi,s,d−1)/2, and
Rs,d−k is the return of stock s from d − k − 1 to d − k − 1. When k = 1, the measure captures
the lagged response of trades to returns (“lag-1 momentum” or L1M). When k = 0, this measure
captures the contemporaneous relation between trades and returns (“lag-0 momentum” or L0M).
We calculate L1M and L0M by averaging across investors in the same group of Active Share.
Panel A of Table 14 documents the results for L1M . We find that the average one-day-lagged
momentum measure for passively-managed foreign funds is 3 percent per day, which is consistent
with the 3 percent estimate for the correlation of aggregate flows and lag market returns reported
in the previous section. Since these funds hold similar stocks to the market index, estimates of
momentum strategies using market returns are quite similar to the measure of momentum investing
using stock-level data. This provides further validity to our finding that the cross-sectional correla-
tion in flows among passively-managed foreign funds is not driven by momentum strategies, since
we are controlling for the correct measure of momentum.
In the previous section we found no evidence of momentum trading by actively-managed foreign
funds, however, Table 14-Panel A documents that funds in this group buy and sell in the direction
of one-day lag returns. More precisely, the average of L1M for foreign active funds is 7 percent and
statistically significant at the 5 percent level. The contrast in findings among the two methodologies
(i.e. aggregate versus stock-level) is expected, since funds in this group are precisely those with
holdings significantly different from the market index. For this group, using aggregate flows and
market returns does not appear to be the appropriate strategy to capture momentum investing. The
important finding here is that even if foreign active investors indeed follow momentum strategies, the
coefficient for the cross-sectional correlation between daily equity demands estimated at -1 percent
in Table 13 would be an upper-bound for the actual correlation between flows. In other words, the
evidence indicates that while active foreign funds are momentum investors on the stocks that they
22
trade, daily fund demands are not positively correlated in the cross-section. This would be the case
if active funds trade different stocks each day. Finally, Panel A shows that domestic institutions
are contrarians regardless of their level of active management —they buy and sell stocks in the
opposite direction of lag returns.
Table 14-Panel A presents the contemporaneous correlation between daily stock returns and
flows. We find that purchases and sells by passively-managed foreign funds are systematically
related to stock returns in the same day. The average of L0M for this group is 0.18 (t-statistic of
7.01), which is six times greater than the correlation between flows and lag returns. According to
the table, about 77.8 percent of passive foreign funds buy and sell in the direction of the same-day
returns. Active foreign funds, on the other hand, do not appear to trade in the direction of daily
stock returns, while domestic institutions trade in the opposite direction of returns.
Overall, the evidence is consistent with flows by passively-managed foreign funds driving price
changes. The two related stylized facts are that demands by these funds are positively related in
the cross-section and their trades are largely correlated with same-day returns. This suggests that
foreign passive funds are paying a price for accommodating their excess demands within a day.
6 Conclusions
In this paper, we examine the performance of investors separated by borders with different manage-
ment styles. We find that the aggregate under-performance of foreign investors in the Colombian
Stock Market is largely attributable to the behavior of foreign funds that replicate the market index,
i.e. passively-managed funds. These funds pay higher prices for stocks purchases, receive less when
they sell, and display inferior risk-adjusted returns relative to other investors. In particular, worse
trades are on days when these funds are (i) trading multiple stocks in the same direction, (ii) buy-
ing (selling) the same stock multiple times, and (iii) making large trades at the end of the trading
session. In other words, the worst trades by passive funds appear to be on days when managers are
trying to accommodate large flows in similar proportions to their benchmark index.
Market microstructure characteristics —such as average trade size, market impact, and bid-ask
spreads, constrain the speed at which managers can execute their trades. If flow imbalances by index
funds are large enough, in order to trade stocks in similar index proportions, managers pay higher
23

transaction costs to meet the end-of-day “deadline,” that is, they pay a price to increase the speed of
their trades to comply with their investment style. Meanwhile, other investors with more discretion
over their flows appear to time their transactions to take advantage of the common order flow by
passive funds. In our sample, even foreign active funds —which are known to under-perform passive
strategies, execute better trades and display higher risk-adjusted returns than passive foreign funds.
We anticipate that similar findings are likely in other developing countries, or in small (illiquid)
stocks in developed markets. In such cases, the costs of mechanical trading strategies to accommo-
date flows might outweigh the potential benefits of passive investing.
References
Agarwal, Sumit, Sheri Faircloth, Chunlin Liu, and S Ghon Rhee, “Why do foreign investorsunderperform domestic investors in trading activities? Evidence from Indonesia,” Journal ofFinancial Markets, 2009, 12 (1), 32–53.
Agudelo, Diego, James Byder, and Paula Yepes, “Who Knows Better in an Emerging Mar-ket? Performance of Institutions, Foreigners and Individuals.,” Center for Research in Economicsand Finance (CIEF), Working Papers, 2015, (15-25).
Albuquerque, Rui, Gregory H Bauer, and Martin Schneider, “Global private informationin international equity markets,” Journal of Financial Economics, 2009, 94 (1), 18–46.
Avramov, Doron and Russ Wermers, “Investing in mutual funds when returns are predictable,”Journal of Financial Economics, 2006, 81 (2), 339–377.
Barber, Brad M, Yi-Tsung Lee, Yu-Jane Liu, and Terrance Odean, “Just how much doindividual investors lose by trading?,” Review of Financial studies, 2009, 22 (2), 609–632.
Bollen, Nicolas PB and Jeffrey A Busse, “On the timing ability of mutual fund managers,”The Journal of Finance, 2001, 56 (3), 1075–1094.
Brennan, Michael J and H Henry Cao, “International portfolio investment flows,” The Journalof Finance, 1997, 52 (5), 1851–1880.
Carhart, Mark M, “On persistence in mutual fund performance,” The Journal of finance, 1997,52 (1), 57–82.
Chalmers, John MR, Roger M Edelen, and Gregory B Kadlec, “On the perils of financialintermediaries setting security prices: the mutual fund wild card option,” The Journal of Finance,2001, 56 (6), 2209–2236.
Chan, Kalok, Vicentiu Covrig, and Lilian Ng, “What determines the domestic bias andforeign bias? Evidence from mutual fund equity allocations worldwide,” The Journal of Finance,2005, 60 (3), 1495–1534.
Chen, Joseph, Harrison Hong, Ming Huang, and Jeffrey D Kubik, “Does fund size erodemutual fund performance? The role of liquidity and organization,” The American EconomicReview, 2004, 94 (5), 1276–1302.
24

Choe, Hyuk, Bong-Chan Kho, and Rene M Stulz, “Do domestic investors have an edge?The trading experience of foreign investors in Korea,” Review of financial studies, 2005, 18 (3),795–829.
Cremers, KJ Martijn and Antti Petajisto, “How active is your fund manager? A new measurethat predicts performance,” Review of Financial Studies, 2009, 22 (9), 3329–3365.
Cremers, Martijn and Ankur Pareek, “Patient capital outperformance: The investment skillof high active share managers who trade infrequently,” Journal of Financial Economics (JFE),Forthcoming, 2015.
, Miguel A Ferreira, Pedro Matos, and Laura Starks, “Indexing and active fund manage-ment: International evidence,” Journal of Financial Economics, 2016, 120 (3), 539–560.
Dvorak, Tomas, “Do domestic investors have an information advantage? Evidence from Indone-sia,” The Journal of Finance, 2005, 60 (2), 817–839.
Fama, Eugene F and James D MacBeth, “Risk, return, and equilibrium: Empirical tests,”Journal of political economy, 1973, 81 (3), 607–636.
and Kenneth R French, “Common risk factors in the returns on stocks and bonds,” Journalof financial economics, 1993, 33 (1), 3–56.
Ferreira, Miguel A, Pedro P Matos, Joao Pedro Pereira, and Pedro Pires, “Do LocalsKnow Better? A Comparison of the Performance of Local and Foreign Institutional Investors,”A Comparison of the Performance of Local and Foreign Institutional Investors (May 19, 2015),2015.
French, Kenneth R, “Presidential address: The cost of active investing,” The Journal of Finance,2008, 63 (4), 1537–1573.
Froot, Kenneth A and Tarun Ramadorai, “Institutional portfolio flows and internationalinvestments,” Review of Financial Studies, 2008, 21 (2), 937–971.
Greene, Jason T and Charles W Hodges, “The dilution impact of daily fund flows on open-endmutual funds,” Journal of Financial Economics, 2002, 65 (1), 131–158.
Griffin, John M, Federico Nardari, and Rene M Stulz, “Are daily cross-border equity flowspushed or pulled?,” Review of Economics and Statistics, 2004, 86 (3), 641–657.
Grinblatt, Mark and Matti Keloharju, “The investment behavior and performance of variousinvestor types: a study of Finland’s unique data set,” Journal of financial economics, 2000, 55(1), 43–67.
, Sheridan Titman, and Russ Wermers, “Momentum investment strategies, portfolio per-formance, and herding: A study of mutual fund behavior,” The American economic review, 1995,pp. 1088–1105.
Hau, Harald, “Location matters: An examination of trading profits,” The Journal of Finance,2001, 56 (5), 1959–1983.
IMF, “Coordinated Portfolio Investment Survey,” http://cpis.imf.org, 2016.
25

Karolyi, G Andrew and Rene M Stulz, “Are financial assets priced locally or globally?,”Handbook of the Economics of Finance, 2003, 1, 975–1020.
Kyle, Albert S, “Continuous auctions and insider trading,” Econometrica: Journal of the Econo-metric Society, 1985, pp. 1315–1335.
and Anna A Obizhaeva, “Market microstructure invariance: Empirical hypotheses,” Econo-metrica, 2016, 84 (4), 1345–1404.
Lakonishok, Josef, Andrei Shleifer, and Robert W Vishny, “The impact of institutionaltrading on stock prices,” Journal of financial economics, 1992, 32 (1), 23–43.
Leuz, Christian, Karl V Lins, and Francis E Warnock, “Do foreigners invest less in poorlygoverned firms?,” Review of Financial Studies, 2010, 23 (3), 3245–3285.
Lewis, Karen K, “Trying to explain home bias in equities and consumption,” Journal of economicliterature, 1999, 37 (2), 571–608.
Pastor, L’ubos and Robert F Stambaugh, “Mutual fund performance and seemingly unrelatedassets,” Journal of Financial Economics, 2002, 63 (3), 315–349.
Pedraza, Alvaro, “Strategic interactions and portfolio choice in money management: Theory andevidence,” Journal of Money, Credit and Banking, 2015, 47 (8), 1531–1569.
Petersen, Mitchell A, “Estimating standard errors in finance panel data sets: Comparing ap-proaches,” Review of financial studies, 2009, 22 (1), 435–480.
Portes, Richard and Helene Rey, “The determinants of cross-border equity flows,” Journal ofinternational Economics, 2005, 65 (2), 269–296.
Seasholes, Mark S., “Re-examining information asymmetries in emerging stock markets,” Tech-nical Report 2004.
Seasholes, Mark S and Ning Zhu, “Individual investors and local bias,” The Journal of Finance,2010, 65 (5), 1987–2010.
Sias, Richard W, “Institutional herding,” Review of financial studies, 2004, 17 (1), 165–206.
Wermers, Russ, “Mutual fund performance: An empirical decomposition into stock-picking talent,style, transactions costs, and expenses,” The Journal of Finance, 2000, 55 (4), 1655–1703.
26
7 Appendix: Tables
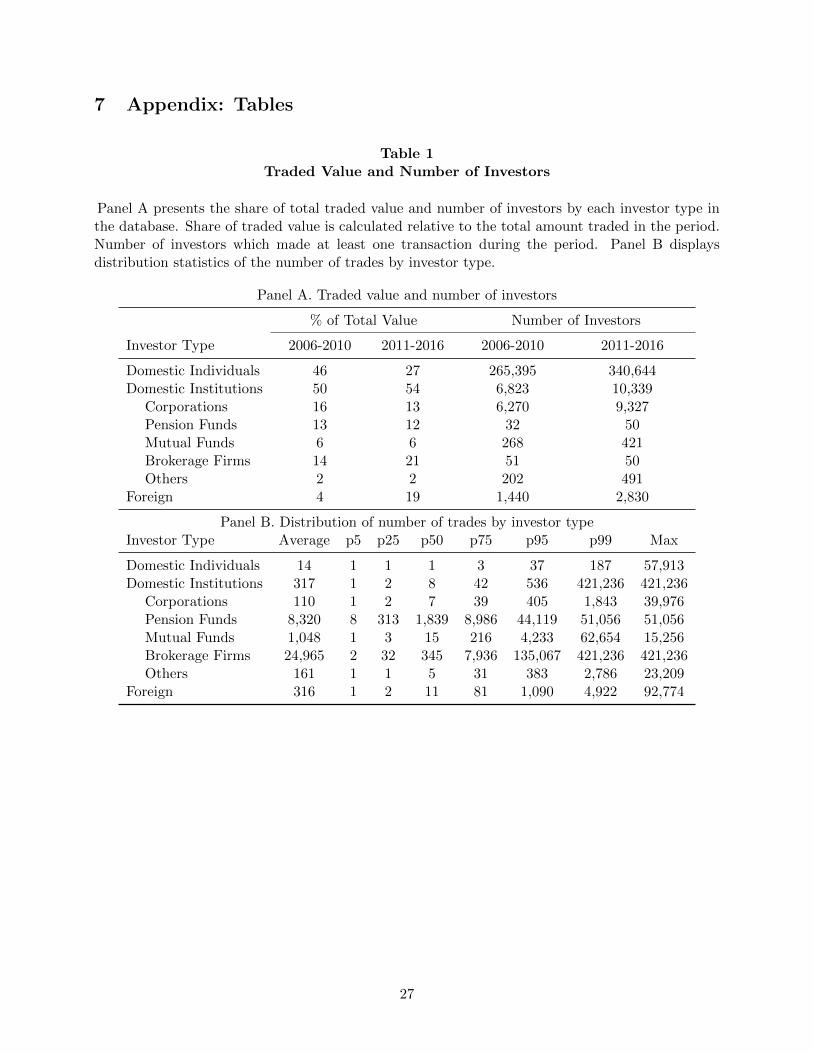
Table 1Traded Value and Number of Investors
Panel A presents the share of total traded value and number of investors by each investor type inthe database. Share of traded value is calculated relative to the total amount traded in the period.Number of investors which made at least one transaction during the period. Panel B displaysdistribution statistics of the number of trades by investor type.
Panel A. Traded value and number of investors
% of Total Value Number of Investors
Investor Type 2006-2010 2011-2016 2006-2010 2011-2016
Domestic Individuals 46 27 265,395 340,644Domestic Institutions 50 54 6,823 10,339
Corporations 16 13 6,270 9,327Pension Funds 13 12 32 50Mutual Funds 6 6 268 421Brokerage Firms 14 21 51 50Others 2 2 202 491
Foreign 4 19 1,440 2,830
Panel B. Distribution of number of trades by investor typeInvestor Type Average p5 p25 p50 p75 p95 p99 Max
Domestic Individuals 14 1 1 1 3 37 187 57,913Domestic Institutions 317 1 2 8 42 536 421,236 421,236
Corporations 110 1 2 7 39 405 1,843 39,976Pension Funds 8,320 8 313 1,839 8,986 44,119 51,056 51,056Mutual Funds 1,048 1 3 15 216 4,233 62,654 15,256Brokerage Firms 24,965 2 32 345 7,936 135,067 421,236 421,236Others 161 1 1 5 31 383 2,786 23,209
Foreign 316 1 2 11 81 1,090 4,922 92,774
27

Table 2Descriptive statistics for the Colombian Stock Exchange
The table displays yearly market stock returns. For Colombia, returns are calculated using theCOLCAP, a value weighted index. The MSCI Latin America index captures large cap and midcap firms across five countries: Brazil, Chile, Colombia, Mexico, and Peru. On December 2015,the country weight of Colombia in the index was 3.15%. Market capitalization (market cap) is theend-of-year total stock market value. Foreign flows and number of stocks are from the CSE dataset.
MSCI Latin Colombian Stock Market Cap Foreign Flows Number ofYear America Market ($ billion cop) ($ billion cop) stocks
2006 43.2% 16.0% 11,161 642 682007 50.4% -4.3% 10,694 275 672008 -51.4% -34.7% 7,561 631 662009 103.8% 42.8% 11,602 943 622010 14.7% 28.9% 15,497 122 632011 -19.4% -20.2% 12,666 -13 712012 8.7% 15.0% 14,716 -44 722013 -13.4% -11.9% 13,071 479 702014 -12.3% -11.6% 11,635 -370 662015 -31.0% -30.8% 8,547 -1390 65
Table 3Passive investors
This table reports the share of assets under management and proportion of passive investors byinvestor type. Passive investors/funds are defined as those with an Active Share measure below 60percent. Sample includes investors with at least 100 trades.
% assets managed by passive % number of passive
Investor Type 2006-2010 2011-2016 2006-2010 2011-2016
Domestic Individuals 35.1 21.9 25.8 12.2Domestic Institutions 53.5 71.7 32.3 26.2
Corporations 13.7 15.2 27.9 20.5Pension Funds 97.9 99.0 81.9 89.5Mutual Funds 92.7 80.7 70.3 49.7Brokerage Firms 45.7 74.0 31.2 40.2Others 15.8 28.3 31.4 30.1
Foreign 29.4 64.8 29.4 37.8
28
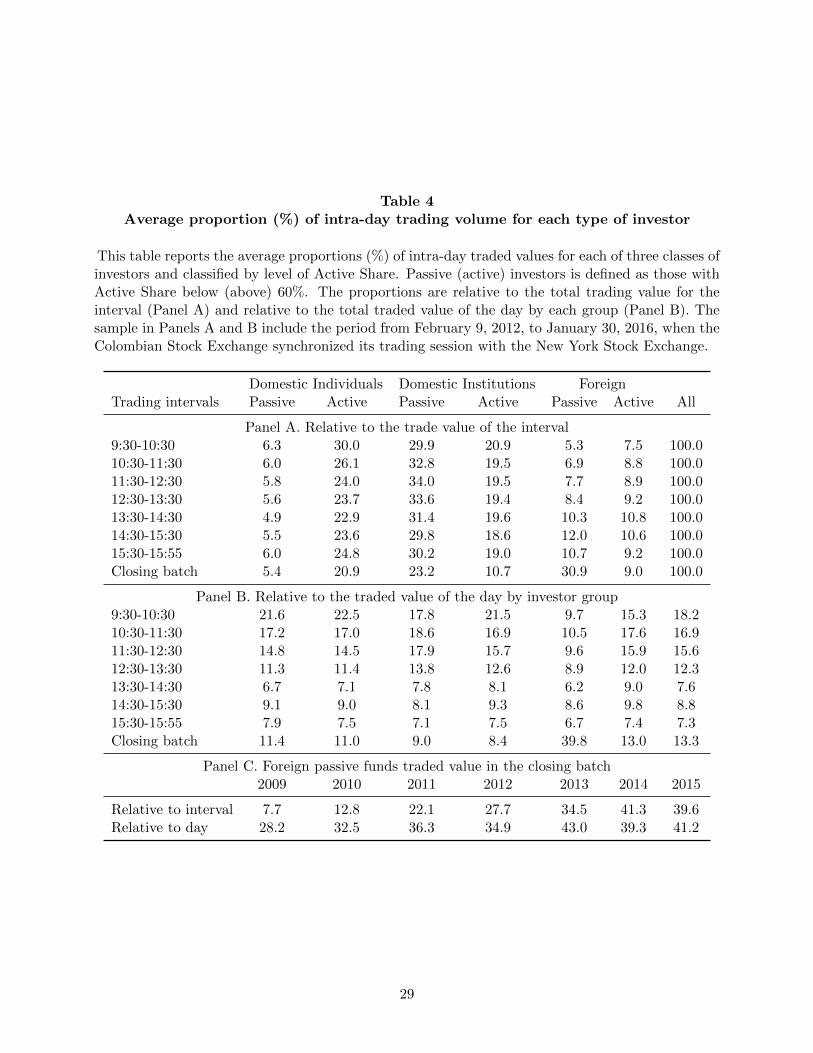
Table 4Average proportion (%) of intra-day trading volume for each type of investor
This table reports the average proportions (%) of intra-day traded values for each of three classes ofinvestors and classified by level of Active Share. Passive (active) investors is defined as those withActive Share below (above) 60%. The proportions are relative to the total trading value for theinterval (Panel A) and relative to the total traded value of the day by each group (Panel B). Thesample in Panels A and B include the period from February 9, 2012, to January 30, 2016, when theColombian Stock Exchange synchronized its trading session with the New York Stock Exchange.
Domestic Individuals Domestic Institutions ForeignTrading intervals Passive Active Passive Active Passive Active All
Panel A. Relative to the trade value of the interval9:30-10:30 6.3 30.0 29.9 20.9 5.3 7.5 100.010:30-11:30 6.0 26.1 32.8 19.5 6.9 8.8 100.011:30-12:30 5.8 24.0 34.0 19.5 7.7 8.9 100.012:30-13:30 5.6 23.7 33.6 19.4 8.4 9.2 100.013:30-14:30 4.9 22.9 31.4 19.6 10.3 10.8 100.014:30-15:30 5.5 23.6 29.8 18.6 12.0 10.6 100.015:30-15:55 6.0 24.8 30.2 19.0 10.7 9.2 100.0Closing batch 5.4 20.9 23.2 10.7 30.9 9.0 100.0
Panel B. Relative to the traded value of the day by investor group9:30-10:30 21.6 22.5 17.8 21.5 9.7 15.3 18.210:30-11:30 17.2 17.0 18.6 16.9 10.5 17.6 16.911:30-12:30 14.8 14.5 17.9 15.7 9.6 15.9 15.612:30-13:30 11.3 11.4 13.8 12.6 8.9 12.0 12.313:30-14:30 6.7 7.1 7.8 8.1 6.2 9.0 7.614:30-15:30 9.1 9.0 8.1 9.3 8.6 9.8 8.815:30-15:55 7.9 7.5 7.1 7.5 6.7 7.4 7.3Closing batch 11.4 11.0 9.0 8.4 39.8 13.0 13.3
Panel C. Foreign passive funds traded value in the closing batch2009 2010 2011 2012 2013 2014 2015
Relative to interval 7.7 12.8 22.1 27.7 34.5 41.3 39.6Relative to day 28.2 32.5 36.3 34.9 43.0 39.3 41.2
29
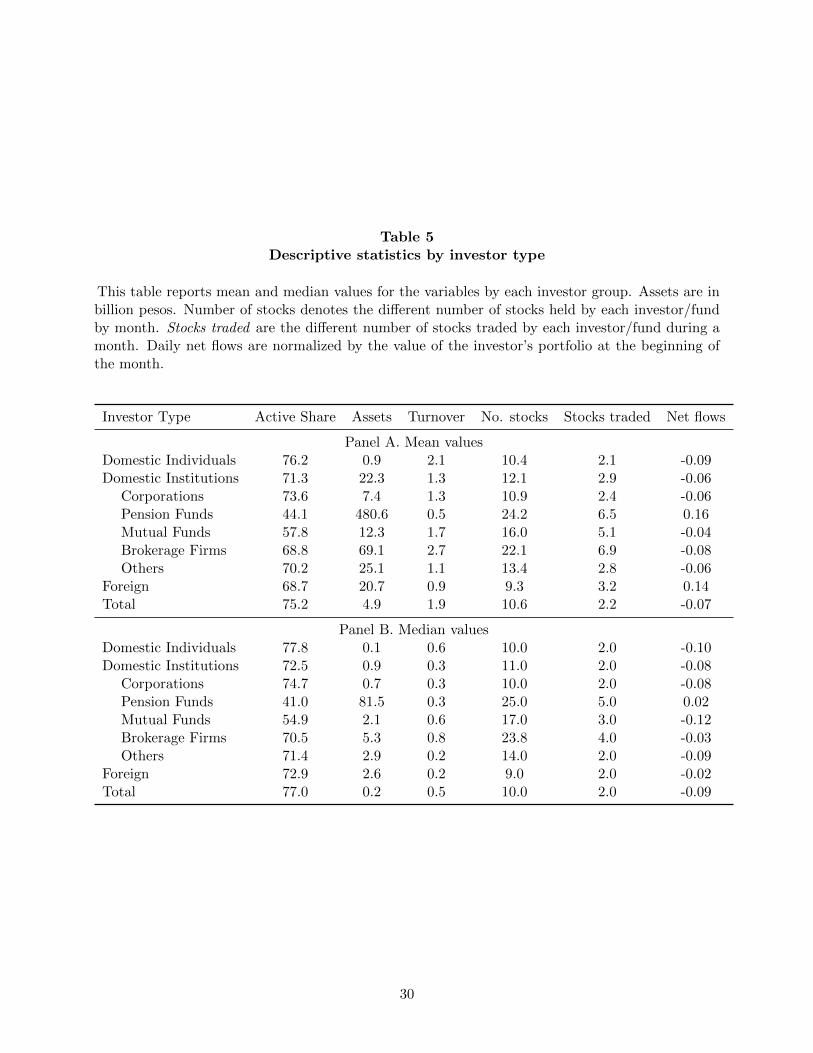
Table 5Descriptive statistics by investor type
This table reports mean and median values for the variables by each investor group. Assets are inbillion pesos. Number of stocks denotes the different number of stocks held by each investor/fundby month. Stocks traded are the different number of stocks traded by each investor/fund during amonth. Daily net flows are normalized by the value of the investor’s portfolio at the beginning ofthe month.
Investor Type Active Share Assets Turnover No. stocks Stocks traded Net flows
Panel A. Mean valuesDomestic Individuals 76.2 0.9 2.1 10.4 2.1 -0.09Domestic Institutions 71.3 22.3 1.3 12.1 2.9 -0.06
Corporations 73.6 7.4 1.3 10.9 2.4 -0.06Pension Funds 44.1 480.6 0.5 24.2 6.5 0.16Mutual Funds 57.8 12.3 1.7 16.0 5.1 -0.04Brokerage Firms 68.8 69.1 2.7 22.1 6.9 -0.08Others 70.2 25.1 1.1 13.4 2.8 -0.06
Foreign 68.7 20.7 0.9 9.3 3.2 0.14Total 75.2 4.9 1.9 10.6 2.2 -0.07
Panel B. Median valuesDomestic Individuals 77.8 0.1 0.6 10.0 2.0 -0.10Domestic Institutions 72.5 0.9 0.3 11.0 2.0 -0.08
Corporations 74.7 0.7 0.3 10.0 2.0 -0.08Pension Funds 41.0 81.5 0.3 25.0 5.0 0.02Mutual Funds 54.9 2.1 0.6 17.0 3.0 -0.12Brokerage Firms 70.5 5.3 0.8 23.8 4.0 -0.03Others 71.4 2.9 0.2 14.0 2.0 -0.09
Foreign 72.9 2.6 0.2 9.0 2.0 -0.02Total 77.0 0.2 0.5 10.0 2.0 -0.09
30
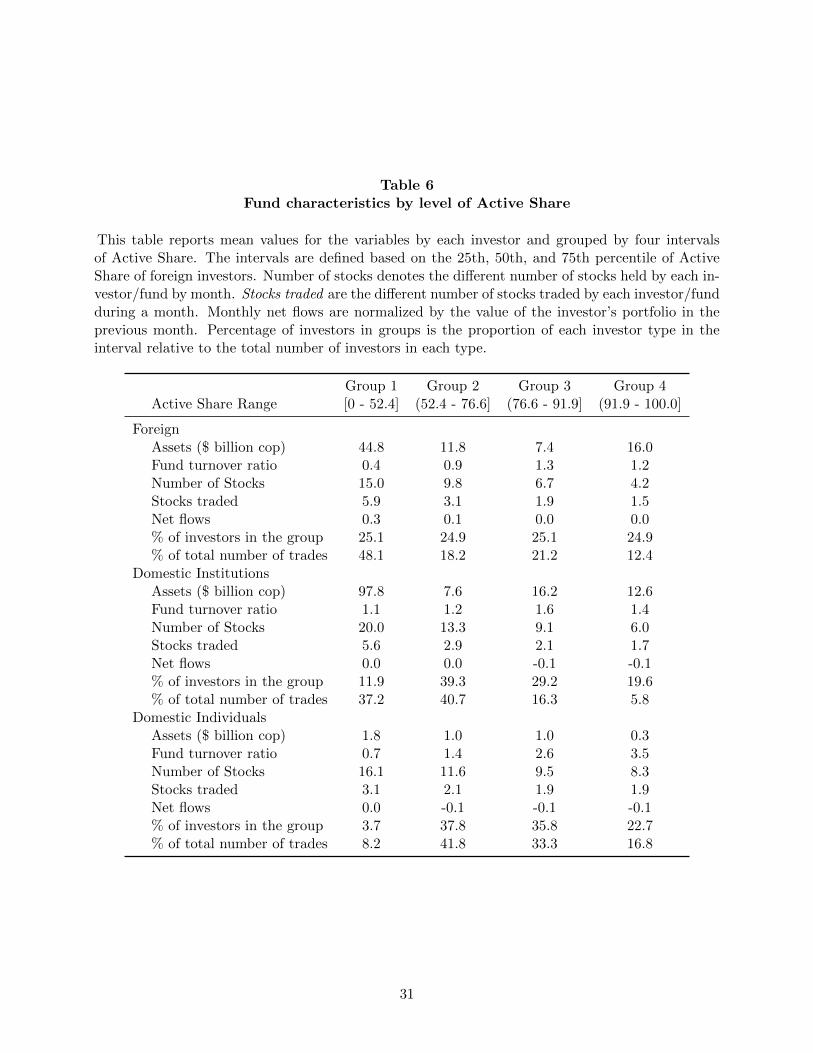
Table 6Fund characteristics by level of Active Share
This table reports mean values for the variables by each investor and grouped by four intervalsof Active Share. The intervals are defined based on the 25th, 50th, and 75th percentile of ActiveShare of foreign investors. Number of stocks denotes the different number of stocks held by each in-vestor/fund by month. Stocks traded are the different number of stocks traded by each investor/fundduring a month. Monthly net flows are normalized by the value of the investor’s portfolio in theprevious month. Percentage of investors in groups is the proportion of each investor type in theinterval relative to the total number of investors in each type.
Group 1 Group 2 Group 3 Group 4Active Share Range [0 - 52.4] (52.4 - 76.6] (76.6 - 91.9] (91.9 - 100.0]
ForeignAssets ($ billion cop) 44.8 11.8 7.4 16.0Fund turnover ratio 0.4 0.9 1.3 1.2Number of Stocks 15.0 9.8 6.7 4.2Stocks traded 5.9 3.1 1.9 1.5Net flows 0.3 0.1 0.0 0.0% of investors in the group 25.1 24.9 25.1 24.9% of total number of trades 48.1 18.2 21.2 12.4
Domestic InstitutionsAssets ($ billion cop) 97.8 7.6 16.2 12.6Fund turnover ratio 1.1 1.2 1.6 1.4Number of Stocks 20.0 13.3 9.1 6.0Stocks traded 5.6 2.9 2.1 1.7Net flows 0.0 0.0 -0.1 -0.1% of investors in the group 11.9 39.3 29.2 19.6% of total number of trades 37.2 40.7 16.3 5.8
Domestic IndividualsAssets ($ billion cop) 1.8 1.0 1.0 0.3Fund turnover ratio 0.7 1.4 2.6 3.5Number of Stocks 16.1 11.6 9.5 8.3Stocks traded 3.1 2.1 1.9 1.9Net flows 0.0 -0.1 -0.1 -0.1% of investors in the group 3.7 37.8 35.8 22.7% of total number of trades 8.2 41.8 33.3 16.8
31

Tab
le7
Valu
e-W
eig
hte
d-A
vera
ge-P
rice
(VW
AP
)by
invest
or
typ
e,
by
Acti
ve
Sh
are
,an
dfo
rd
iffere
nt
tim
ein
terv
als
Panel
A.
VW
AP
by
inves
tor
typ
eIn
div
iduals
Corp
ora
tions
Pen
sion
Funds
Mutu
al
Funds
Bro
ker
age
Fir
ms
All
Inst
ituti
ons
Fore
ign
(1)
(2)
(3)
(4)
(5)
(6)
(7)
Buy:
All
trades
Aver
age
of
mea
nV
WA
P99.9
299.9
599.9
099.9
899.9
999.9
6100.0
4(t
-sta
tist
ics:
H0
=100)
(39.9
6)
(14.8
2)
(12.3
8)
(3.7
5)
(2.8
1)
(13.0
3)
(9.2
2)
Diff
eren
ce:
Fore
ign
-(i
)0.1
10.0
80.1
40.0
60.0
50.0
8(t
-sta
tist
ics:
H0
=0)
(13.5
4)
(13.8
2)
(17.2
7)
(8.2
6)
(7.9
4)
(10.2
7)
Sel
l:A
lltr
ades
Aver
age
of
mea
nV
WA
P100.0
6100.0
5100.0
8100.0
6100.0
4100.0
599.9
8(t
-sta
tist
ics:
H0
=100)
(50.0
4)
(8.7
4)
(13.5
0)
(12.4
9)
(8.4
0)
(15.0
6)
(3.9
7)
Diff
eren
ce:
Fore
ign
-(i
)-0
.08
-0.0
7-0
.09
-0.0
7-0
.06
-0.0
7(t
-sta
tist
ics:
H0
=0)
(13.2
4)
(5.8
6)
(12.9
3)
(11.9
1)
(8.8
9)
(7.6
9)
Panel
B.
VW
AP
of
fore
ign
inves
tors
sort
edby
level
of
Act
ive
Share
Q1
Q2
Q3
Q4
Q1-Q
4
Buy A
ver
age
of
mea
nV
WA
P100.0
9100.0
299.9
9100.0
10.0
9t-
stati
stic
s(2
0.7
8)
(3.0
5)
(0.5
7)
(0.4
5)
(7.8
69)
Sel
l Aver
age
of
mea
nV
WA
P99.9
499.9
9100.0
0100.0
1-0
.06
t-st
ati
stic
s(1
0.1
3)
(0.9
7)
(0.3
7)
(0.6
4)
(6.2
2)
Panel
C.
VW
AP
of
pass
ive
and
act
ive
fore
ign
inves
tors
by
tradin
gin
terv
al
Pass
ive
Act
ive
(1)
Conti
nuous
tradin
g(2
)C
losi
ng
batc
h(2
)-
(1)
(3)
Conti
nuous
tradin
g(4
)C
losi
ng
batc
h(4
)-
(3)
Buy A
ver
age
of
mea
nV
WA
P100.0
2100.1
60.1
599.9
9100.1
10.1
2t-
stati
stic
s(2
.998)
(21.7
82)
(15.5
03)
(2.3
34)
(9.7
72)
(10.9
66)
Sel
l Aver
age
of
mea
nV
WA
P99.9
799.9
1-0
.06
100.0
099.9
5-0
.06
t-st
ati
stic
s(3
.991)
(9.0
18)
(5.0
53)
(0.5
41)
(4.0
76)
(4.4
79)
32
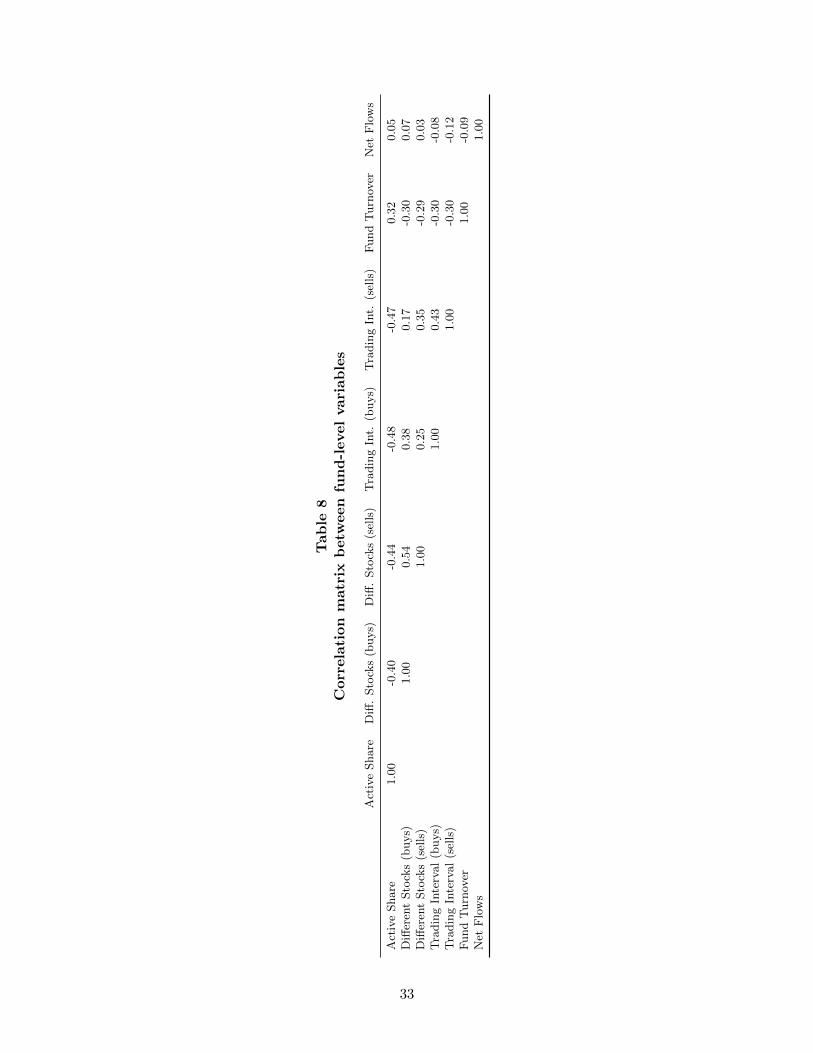
Tab
le8
Corr
ela
tion
matr
ixb
etw
een
fun
d-l
evel
vari
ab
les
Act
ive
Share
Diff
.Sto
cks
(buys)
Diff
.Sto
cks
(sel
ls)
Tra
din
gIn
t.(b
uys)
Tra
din
gIn
t.(s
ells
)F
und
Turn
over
Net
Flo
ws
Act
ive
Share
1.0
0-0
.40
-0.4
4-0
.48
-0.4
70.3
20.0
5D
iffer
ent
Sto
cks
(buys)
1.0
00.5
40.3
80.1
7-0
.30
0.0
7D
iffer
ent
Sto
cks
(sel
ls)
1.0
00.2
50.3
5-0
.29
0.0
3T
radin
gIn
terv
al
(buys)
1.0
00.4
3-0
.30
-0.0
8T
radin
gIn
terv
al
(sel
ls)
1.0
0-0
.30
-0.1
2F
und
Turn
over
1.0
0-0
.09
Net
Flo
ws
1.0
0
33

Table 9VWAP spreads between foreign and domestic institutions: Investor style correlates
This table reports the estimates of daily Value-Weighted-Average-Price (VWAP) of foreign investorsrelative to domestic institutions. The dependent variable in columns (1)-(4) is the VWAP forpurchases. VWAP for sells is reported in columns (5)-(8). Each model include stock fixed-effectsand t-statistics, presented in parenthesis, are calculated from standard errors clustered at the fundlevel. Note: ***/**/* indicate that the coefficient estimates are significantly different from zero atthe 1%/5%/10% level.
Buys Sells
Variables (1) (2) (3) (4) (5) (6) (7) (8)
Firm-stock variableslsize 0.052*** 0.038** 0.031* 0.016 0.001 0.014 0.029** 0.026
(2.996) (2.291) (1.813) (0.787) (0.059) (1.009) (2.102) (1.498)BMratio 0.019 0.005 0.004 0.015 -0.013 0.003 0.002 -0.026
(1.072) (0.253) (0.211) (0.682) (-0.722) (0.166) (0.079) (-1.122)ctc5 -0.387*** -0.380*** -0.419*** -0.482*** -0.084 -0.118 -0.132 -0.162*
(-4.528) (-4.390) (-4.619) (-4.924) (-1.049) (-1.469) (-1.568) (-1.914)cto 0.323 0.372 0.404 0.658* 0.685* 0.688* 0.837* 0.381
(0.861) (0.993) (1.026) (1.716) (1.655) (1.654) (1.863) (0.874)otc 8.235*** 8.273*** 8.675*** 9.493*** 8.375*** 8.368*** 8.820*** 9.454***
(8.257) (8.271) (8.223) (8.390) (7.301) (7.268) (7.278) (7.250)avgps -8.298 -8.193 -7.710 3.779 -18.254*** -16.429*** -15.701*** -19.274***
(-0.725) (-0.734) (-0.698) (1.157) (-3.634) (-3.817) (-3.686) (-6.213)Market variablescolret -0.442 -0.528 -0.575 -0.217 -1.392** -1.555*** -1.686*** -1.447**
(-1.334) (-1.551) (-1.614) (-0.548) (-2.453) (-2.861) (-2.930) (-2.220)mkt25 -0.031*** -0.034*** -0.034*** -0.032*** 0.030*** 0.029*** 0.029*** 0.031***
(-5.476) (-5.891) (-5.798) (-5.721) (4.376) (4.387) (4.277) (4.497)Investor variablesActive Share -0.185*** -0.116*** -0.108*** -0.095*** 0.112*** 0.048** 0.033** 0.121***
(-6.727) (-3.558) (-3.618) (-3.871) (4.796) (2.300) (2.205) (5.430)Different Stocks 0.006*** 0.006*** -0.006*** -0.005***
(4.726) (4.877) (-4.781) (-4.649)Turnover -0.010*** -0.010** 0.007** 0.009**
(-3.060) (-2.557) (2.505) (2.213)Net Flows 0.015*** 0.018*** -0.004** -0.002*
(-2.624) (-2.597) (-2.175) (-1.978)Trading Interval 0.099*** -0.035***
(10.907) (2.937)Constant -1.378** -1.014** -0.786 -0.359 -0.190 -0.519 -0.969** -0.967*
(-2.560) (-1.985) (-1.507) (-0.570) (-0.434) (-1.237) (-2.312) (-1.826)
Observations 104,321 104,321 101,178 95,873 71,471 71,471 69,034 64,906R-squared 0.051 0.053 0.057 0.067 0.052 0.054 0.058 0.064FE stock stock stock stock stock stock stock stockCluster Investor Investor Investor Investor Investor Investor Investor Investor
34

Table 10VWAP spreads between foreign and domestic institutions: Investor style correlates
This table reports the estimates of daily Value-Weighted-Average-Price (VWAP) of foreign investorsrelative to domestic institutions. The dependent variable in columns (1)-(4) is the VWAP forpurchases. VWAP for sells is reported in columns (5)-(8). Each model include time and stockfixed-effects and t-statistics, presented in parenthesis, are calculated from standard errors clusteredat the fund level. Note: ***/**/* indicate that the coefficient estimates are significantly differentfrom zero at the 1%/5%/10% level.
Buys Sells
Variables (1) (2) (3) (4) (5) (6) (7) (8)
Firm-stock variableslsize 0.010 0.016 0.014 0.010 0.050*** 0.045*** 0.045*** 0.044**
(0.459) (0.718) (0.657) (0.466) (3.045) (2.834) (2.810) (2.477)BMratio -0.020 -0.020 -0.016 -0.013 0.044** 0.043** 0.038* 0.024
(-1.019) (-0.980) (-0.757) (-0.661) (2.401) (2.367) (1.913) (1.111)ctc5 -0.516*** -0.494*** -0.543*** -0.551*** -0.384*** -0.380*** -0.383*** -0.388***
(-4.915) (-4.872) (-5.123) (-5.025) (-4.342) (-4.297) (-4.129) (-4.022)cto 1.312*** 1.352*** 1.441*** 1.460*** 1.354*** 1.347*** 1.541*** 1.324**
(2.940) (3.021) (3.071) (3.121) (2.678) (2.663) (2.834) (2.454)otc 8.127*** 8.159*** 8.528*** 8.487*** 8.266*** 8.275*** 8.727*** 9.107***
(8.304) (8.307) (8.189) (8.165) (7.182) (7.169) (7.136) (7.098)avgps -10.197 -10.363 -10.153 -9.536 -19.286*** -18.294*** -18.037*** -20.192***
(-1.151) (-1.180) (-1.164) (-1.059) (-4.299) (-4.155) (-4.124) (-4.898)Investor variablesActiveShare -0.173*** -0.105*** -0.093*** -0.121*** 0.097*** 0.055*** 0.043** 0.108***
(-7.509) (-3.647) (-3.556) (-5.892) (4.730) (2.666) (2.029) (5.260)Different Stocks 0.006*** 0.006*** -0.004*** -0.004***
(4.979) (5.343) (-3.698) (-3.520)Turnover -0.009*** -0.009*** 0.007** 0.010**
(-2.974) (-2.950) (2.347) (2.463)Net Flows 0.013** 0.014* -0.003* -0.001*
(-2.282) (-1.962) (-1.819) (1.772)Trading Interval 0.079*** -0.030***
(8.659) (2.793)Constant -0.100 -0.331 -0.299 -0.229 -1.658*** -1.507*** -1.485*** -1.487***
(-0.153) (-0.508) (-0.464) (-0.359) (-3.435) (-3.226) (-3.186) (-2.857)
Observations 104,321 104,321 101,178 101,178 71,471 71,471 69,034 64,906R-squared 0.126 0.127 0.133 0.133 0.137 0.138 0.144 0.137FE day day day day day day day day
stock stock stock stock stock stock stock stockCluster Investor Investor Investor Investor Investor Investor Investor Investor
35

Table 11Performance benchmarks
This table reports the loadings of the portfolios sorted by Active Share an investor type on variousfactors. Panel A reports loadings for domestic institutional investors and Panel B for foreigninvestors. MARKET is the return of the Colombian market index in excess of the one-monthColombian T-bill rate. SMB is the return on a portfolio of small stocks minus large stocks. HML isthe return on a portfolio long on high book-to-market stocks and short low book-to-market stocks.WML is the return on a portfolio long on stocks that are past-12-month winners and short on thosethat are past-12-month losers.
Market-adj CAPM Carhart 4-FactorActive Share (average) alpha MARKET alpha MARKET SMB HML WML
Panel A. Foreign Investors
Group 1 (low) 0.23% 0.23% 0.95 0.21% 0.92 -0.07 -0.10 0.02Group 2 0.30% 0.40% 0.92 0.38% 0.88 -0.13 -0.05 -0.01Group 3 0.33% 0.69% 0.85 0.61% 0.76 -0.34 0.03 0.01Group 4 (high) 0.64% 0.80% 0.66 0.69% 0.52 -0.50 0.00 0.00
Panel B. Domestic Institutional Investors
Group 1 (low) 0.38% 0.50% 0.95 0.45% 0.90 -0.18 0.01 0.02Group 2 0.33% 0.32% 0.88 0.26% 0.82 -0.20 -0.05 0.05Group 3 0.31% 0.90% 0.87 0.85% 0.79 -0.26 0.02 -0.04Group 4 (high) 0.34% 0.53% 0.45 0.49% 0.46 0.03 -0.07 0.17
36

Table 12Regression of fund performance on lagged Active Share
This table reports the estimates of monthly fund returns regressed on fund characteristics laggedone month. Monthly returns are adjusted using the market model, the CAPM, and the 4-factormodel. The dependent variable is ADJRET . Foreign is a dummy variable equal to one for foreigninvestors. Group i is a dummy variable equal to one if the fund is in Group i of Active Sharein t − 1. All specifications include year-fixed effects. The t-statistics, presented in parenthesis,are calculated from standard errors clustered at the fund level. Note: ***/**/* indicate that thecoefficient estimates are significantly different from zero at the 1%/5%/10% level.
Market-adj CAPM 4-Factor
Panel A. Regression Results
Foreign 0.347*** 0.338*** 0.295***(3.784) (3.805) (3.381)
Group 1 0.008 0.149** 0.131**(0.130) (2.546) (2.233)
Group 2 -0.017 0.127** 0.110*(-0.295) (2.227) (1.935)
Group 3 -0.051 0.093 0.099(-0.819) (1.519) (1.606)
Foreign x Group 1 -0.425*** -0.347*** -0.273***(-4.448) (-3.728) (-2.985)
Foreign x Group 2 -0.323*** -0.282*** -0.208**(-3.188) (-2.848) (-2.141)
Foreign x Group 3 -0.236** -0.213* -0.215*(-2.052) (-1.891) (-1.932)
Fund Size 0.019*** 0.017*** 0.019***(2.870) (2.677) (3.056)
Fund Turnover 0.019** 0.017** 0.018**(2.499) (2.264) (2.348)
Net Flows -0.033* -0.037** -0.037**(-1.776) (-1.981) (-1.992)
Constant -0.082 -0.230* -0.329**(-0.596) (-1.700) (-2.432)
No. of Observations 159,357 159,357 159,357
Panel B. Differences in performance by Active Share and type
Foreign Group 4 - Foreign Group 1 0.42*** 0.20*** 0.14**(5.44) (2.65) (2.02)
Domestic Group 4 - Domestic Group 1 0.02 0.01 0.01(0.44) (0.65) (0.96)
Foreign Group 4 - Domestic Group 4 0.35*** 0.34*** 0.30***(3.78) (3.80) (3.38)
Foreign Group 1 - Domestic Group 1 -0.14*** -0.16*** -0.10***(5.60) (6.34) (4.13)
37
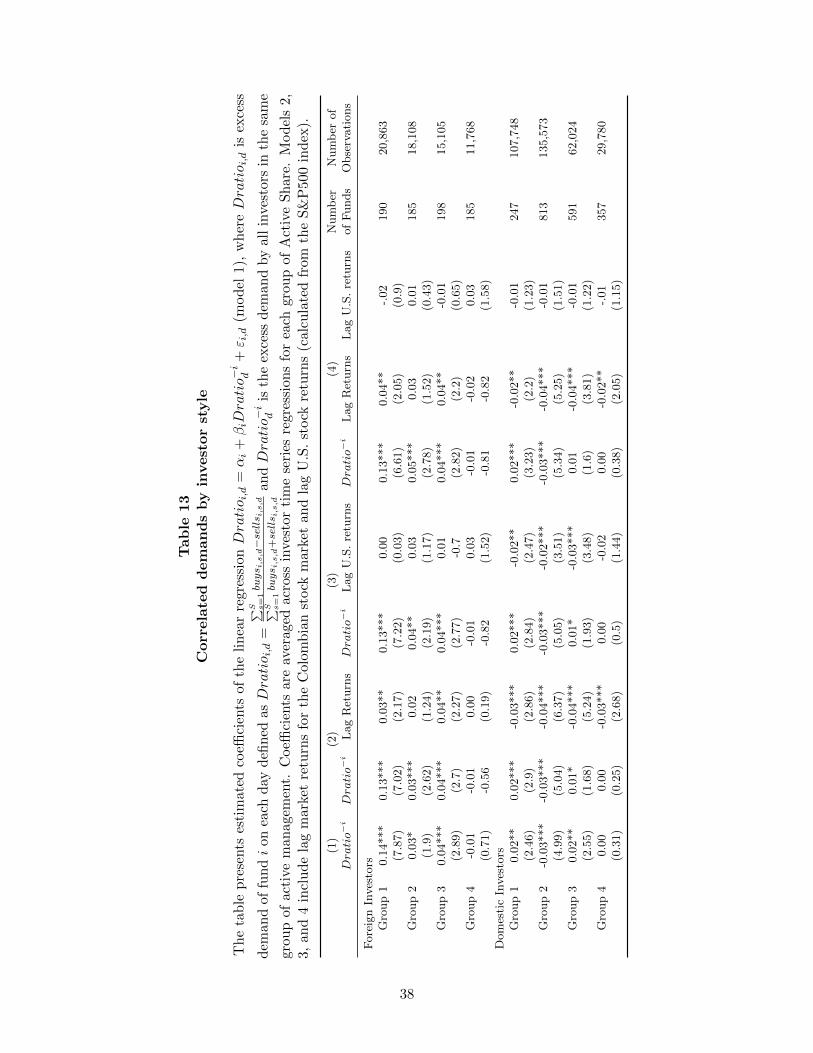
Tab
le13
Corr
ela
ted
dem
an
ds
by
invest
or
style
Th
eta
ble
pre
sents
esti
mat
edco
effici
ents
ofth
eli
nea
rre
gres
sion
Dratio i
,d=αi+βiDratio−
id
+ε i,d
(mod
el1),
wh
ereDratio i
,dis
exce
ss
dem
and
of
fundi
on
each
day
defi
ned
asDratio i
,d=
∑ S s=1bu
ys i
,s,d−sells i
,s,d
∑ S s=1bu
ys i
,s,d+sells i
,s,d
andDratio−
id
isth
eex
cess
dem
and
by
all
inve
stors
inth
esa
me
grou
pof
acti
ve
man
age
men
t.C
oeffi
cien
tsar
eav
erag
edac
ross
inves
tor
tim
ese
ries
regr
essi
ons
for
each
gro
up
of
Act
ive
Sh
are
.M
odel
s2,
3,an
d4
incl
ud
ela
gm
arket
retu
rns
for
the
Col
omb
ian
stock
mar
ket
and
lag
U.S
.st
ock
retu
rns
(calc
ula
ted
from
the
S&
P500
ind
ex).
(1)
(2)
(3)
(4)
Num
ber
Num
ber
of
Dra
tio−
iDra
tio−
iL
ag
Ret
urn
sDra
tio−
iL
ag
U.S
.re
turn
sDra
tio−
iL
ag
Ret
urn
sL
ag
U.S
.re
turn
sof
Funds
Obse
rvati
ons
Fore
ign
Inves
tors
Gro
up
10.1
4***
0.1
3***
0.0
3**
0.1
3***
0.0
00.1
3***
0.0
4**
-.02
190
20,8
63
(7.8
7)
(7.0
2)
(2.1
7)
(7.2
2)
(0.0
3)
(6.6
1)
(2.0
5)
(0.9
)G
roup
20.0
3*
0.0
3***
0.0
20.0
4**
0.0
30.0
5***
0.0
30.0
1185
18,1
08
(1.9
)(2
.62)
(1.2
4)
(2.1
9)
(1.1
7)
(2.7
8)
(1.5
2)
(0.4
3)
Gro
up
30.0
4***
0.0
4***
0.0
4**
0.0
4***
0.0
10.0
4***
0.0
4**
-0.0
1198
15,1
05
(2.8
9)
(2.7
)(2
.27)
(2.7
7)
-0.7
(2.8
2)
(2.2
)(0
.65)
Gro
up
4-0
.01
-0.0
10.0
0-0
.01
0.0
3-0
.01
-0.0
20.0
3185
11,7
68
(0.7
1)
-0.5
6(0
.19)
-0.8
2(1
.52)
-0.8
1-0
.82
(1.5
8)
Dom
esti
cIn
ves
tors
Gro
up
10.0
2**
0.0
2***
-0.0
3***
0.0
2***
-0.0
2**
0.0
2***
-0.0
2**
-0.0
1247
107,7
48
(2.4
6)
(2.9
)(2
.86)
(2.8
4)
(2.4
7)
(3.2
3)
(2.2
)(1
.23)
Gro
up
2-0
.03***
-0.0
3***
-0.0
4***
-0.0
3***
-0.0
2***
-0.0
3***
-0.0
4***
-0.0
1813
135,5
73
(4.9
9)
(5.0
4)
(6.3
7)
(5.0
5)
(3.5
1)
(5.3
4)
(5.2
5)
(1.5
1)
Gro
up
30.0
2**
0.0
1*
-0.0
4***
0.0
1*
-0.0
3***
0.0
1-0
.04***
-0.0
1591
62,0
24
(2.5
5)
(1.6
8)
(5.2
4)
(1.9
3)
(3.4
8)
(1.6
)(3
.81)
(1.2
2)
Gro
up
40.0
00.0
0-0
.03***
0.0
0-0
.02
0.0
0-0
.02**
-.01
357
29,7
80
(0.3
1)
(0.2
5)
(2.6
8)
(0.5
)(1
.44)
(0.3
8)
(2.0
5)
(1.1
5)
38

Table 14Momentum trading
The L0M is the contemporaneous correlation between trades and stock returns. The L1M measuremomentum investing based based on lag-daily stock returns.
Sorted by Active Share Group 1 Group 2 Group 3 Group 4 G1 - G4
Panel A. Lag-1 Momentum (L1M)Foreign Investors
Average (3) 0.03 0.03 0.08 0.07 -0.03(t-statistics: H0 = 0) (1.99) (1.23) (2.86) (2.51) (1.05)Percentage positive 62.8 60.2 64.3 57.3Number of Funds 207 206 207 206
Domestic InstitutionsAverage (4) -0.05 -0.17 -0.20 -0.12 0.07(t-statistics: H0 = 0) (3.25) (12.32) (8.69) (4.42) (1.98)Percentage positive 38.9 32.3 31.8 39.8Number of Funds 247 818 600 394
Average (3) - (4) 0.08 0.20 0.28 0.19(t-statistics: H0 = 0) (3.66) (6.65) (6.59) (4.42)
Panel B. Lag-0 Momentum (L0M)Foreign Investors
Average (1) 0.18 0.03 0.02 0.03 0.15(t-statistics: H0 = 0) (7.01) (0.97) (0.59) (0.89) (3.81)Percentage positive 77.8 56.3 65.7 58.3Number of Funds 207 206 207 206
Domestic InstitutionsAverage (2) -0.12 -0.36 -0.46 -0.35 0.23(t-statistics: H0 = 0) (6.04) (16.82) (14.6) (8.35) (4.13)Percentage positive 36.8 27.3 23.8 34Number of Funds 247 818 600 394
Average (1) - (2) 0.30 0.40 0.48 0.37(t-statistics: H0 = 0) (9.37) (8.54) (8.24) (6.08)
39
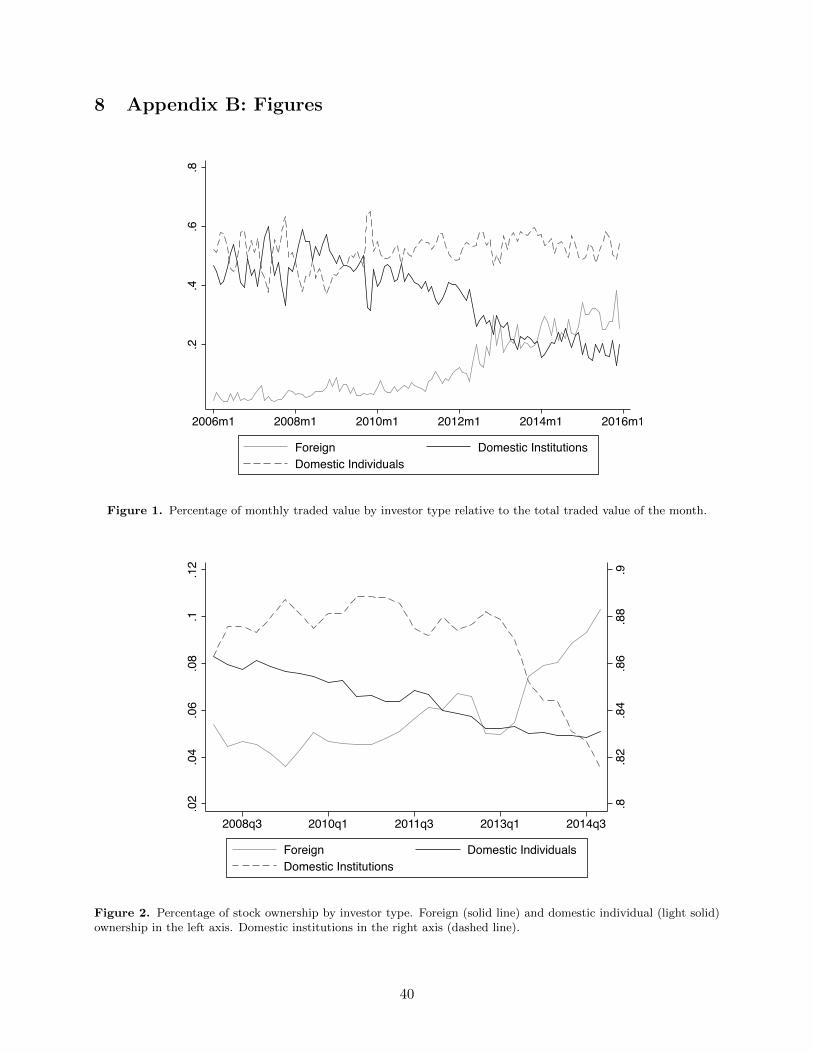
8 Appendix B: Figures
.2.4
.6.8
2006m1 2008m1 2010m1 2012m1 2014m1 2016m1
Foreign Domestic InstitutionsDomestic Individuals
Figure 1. Percentage of monthly traded value by investor type relative to the total traded value of the month.
.8.8
2.8
4.8
6.8
8.9
.02
.04
.06
.08
.1.1
2
2008q3 2010q1 2011q3 2013q1 2014q3
Foreign Domestic IndividualsDomestic Institutions
Figure 2. Percentage of stock ownership by investor type. Foreign (solid line) and domestic individual (light solid)ownership in the left axis. Domestic institutions in the right axis (dashed line).
40
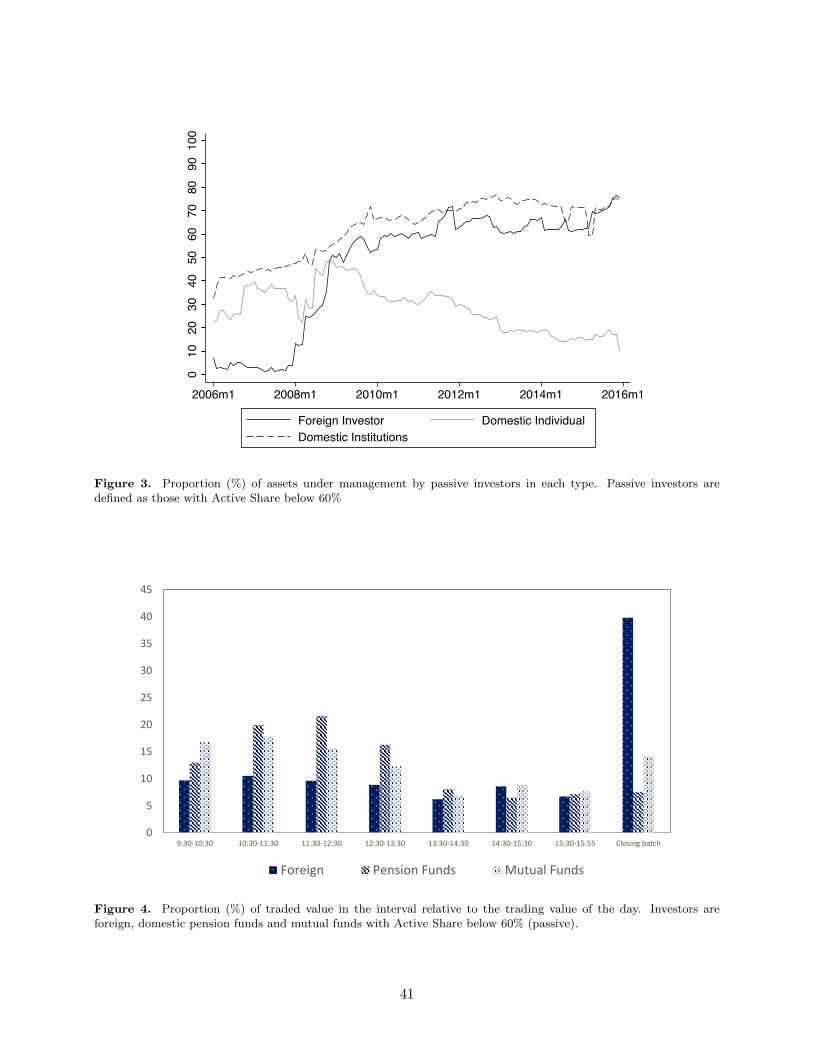
010
2030
4050
6070
8090
100
2006m1 2008m1 2010m1 2012m1 2014m1 2016m1
Foreign Investor Domestic IndividualDomestic Institutions
Figure 3. Proportion (%) of assets under management by passive investors in each type. Passive investors aredefined as those with Active Share below 60%
0
5
10
15
20
25
30
35
40
45
9:30-10:30 10:30-11:30 11:30-12:30 12:30-13:30 13:30-14:30 14:30-15:30 15:30-15:55 Closing batch
Foreign Pension Funds Mutual Funds
Figure 4. Proportion (%) of traded value in the interval relative to the trading value of the day. Investors areforeign, domestic pension funds and mutual funds with Active Share below 60% (passive).
41

A Variable Definitions
Variable Definition Source
Investor/Fund information
Active Sharei,t As defined by Cremers and Petajisto (2009). CSE
Trading Intervali,s,t Proportion of trades in stock s executed in the closing batch. CSE
Different Stocksi,s,t Number of stocks traded during the day in the same direction of s. CSE
Fund Turnover Ratioi,t Minimum between yearly purchases and sells normalized by the average CSEof the fund’s assets.
Net Flowsi,t Daily fund net flows normalized by assets managed in t-1. CSE
Stock-Firm Characteristicslsizes,t Firm size computed as the log of total assets at the end of the quarter. SFC, Datastream
B/Ms,t Book-to-market ratio, computed as the total net assets, divided by the SFC, Datastreamtotal market value of equity at the end of the quarter.
ctc5s,t Close to close return of last five trading days. Bloomberg
otcs,t Open to close daily return. Bloomberg
ctos,t Overnight returns between t-1 and t. Bloomberg
PSs,t Price sensitivity, defined as ln(ph/pl)/V olume where ph and pl Datastreamare the highest and lowest price in each trading day.
Market datamkt25t Indicator variable equal to one if the daily volatility of the COLCAP Bloomberg
is under the percentile 25 for the whole sample.
colrett Daily market returns. Bloomberg
42