Embed Size (px)
Citation preview

Current Trends of Change in the Population of Texas
Karl Eschbach, Ph.D.State Demographer of Texas
Director, Texas State Data CenterUniversity of Texas at San Antonio
TASSCC State of the State 2008December 11, 2008
Austin, Texas

?
Iowa
Population 2007 =
2,988,046
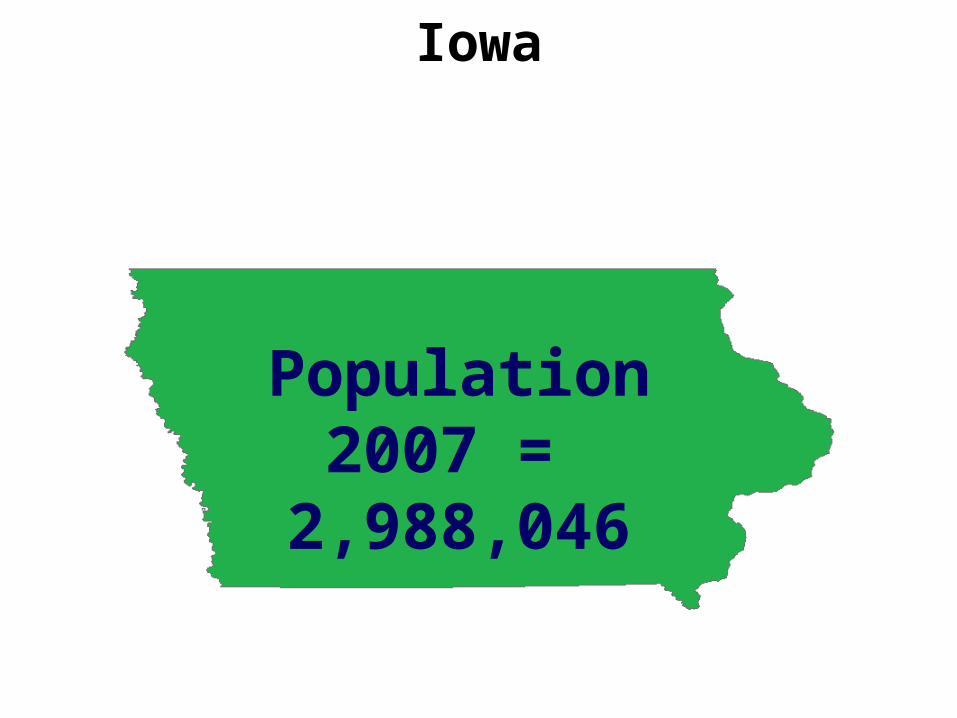
Texas 2007
+
+ 64,535 =
2000
2007
2007

Fastest Growing States, 2000-2007
State2000
Population*2007
Population*
NumericalChange
2000-2007
PercentChange
2000-2007
Texas 20,851,820 23,904,380 3,052,560 14.6
California 33,871,648 36,553,215 2,681,567 7.9
Florida 15,982,378 18,251,243 2,268,865 14.2
Georgia 8,186,453 9,544,750 1,358,297 16.6
Arizona 5,130,632 6,338,755 1,208,123 23.5
North Carolina 8,049,313 9,061,032 1,011,719 12.6
Virginia 7,078,515 7,712,091 633,576 9.0
Washington 5,894,121 6,468,424 574,303 9.7
Nevada 1,998,257 2,565,382 567,125 28.4
Colorado 4,301,261 4,861,515 560,254 13.0
* Population values are decennial census counts for April 1 for 2000 and estimatesfor July 1 for 2007.
Source: Derived from U.S. Bureau of the Census Estimates for dates indicated by the Texas State Data Center, University of Texas at San Antonio

Percent ChangeDue to
Year* PopulationNumerical
ChangeNatural
IncreaseNet
MigrationPercentChange
NaturalIncrease
NetMigration
1950 7,711,194 -- -- -- -- -- --
1960 9,579,677 1,868,483 1,754,652 113,831 24.2 93.91 6.09
1970 11,196,730 1,617,053 1,402,683 214,370 16.9 86.74 13.26
1980 14,229,191 3,032,461 1,260,794 1,771,667 27.1 41.58 58.42
1990 16,986,510 2,757,319 1,815,670 941,649 19.9 65.85 34.15
2000 20,851,820 3,865,310 1,919,281 1,946,029 22.8 49.65 50.35
2007 23,904,380 3,052,560 1,635,015 1,417,545 14.6 53.56 46.44
* All values for the decennial dates are for the indicated census year. Values for 2007 is for July 1 as estimated by the U.S. Bureau of the Census.
Source: Derived from U.S. Bureau of the Census Estimates for dates indicated by the Texas State Data Center, University of Texas at San Antonio
Total Population and Components of Population Change in Texas, 1950-2007

Population Change by Components of Change in the State, 1990-2000 and 2000-2007
State of Texas
1990-2000
Numerical Change 3,865,485
Natural Increase 1,922,044
Domestic Migration 1,166,570
International Migration 776,871
2000-2007
Numerical Change 3,052,560
Natural Increase 1,635,015
Domestic Migration 574,950
International Migration 842,595

Percentage of Texas Population GrowthAttributable to Migration, Observed and Projected
Source Period All Hispanic
Observed,Census Estimates 2000 to 2007 46.7% -
Projected,200-2004 Scenario
2000 to 20102000 to 2040
54.1%77.0%
56.0%73.2%

0%
10%
20%
30%
40%
50%
60%
70%
All
Born in US, Motheris US-Native
Born in US, Motheris an Immigrant
Father-onlyHousehold
Child is foreign-born
Source: American Community Survey Microdata, 2007
Nativity of Texas Children Under 5 Years Oldin Relation to Mother’s Nativity

Annual Net Internal and InternationalMigration to Texas, July 1 to July 1, 2000-2007
Source: U.S. Bureau of the Census Estimates

Population Growth in Texas, 2000-2040
Source: 2006 Texas State Data Center Projections.

County 1980 1990 2000 2007 2040
Big Five Metros 6,235,190 7,602,913 9,270,907 10,588,659 16,859,109
Suburban to Big Five 1,670,678 2,407,688 3,567,510 4,773,315 15,804,522
Border Metros 1,072,113 1,368,514 1,777,429 2,065,545 3,571,423
All Other Metros 2,754,633 2,985,492 3,328,702 3,499,465 3,970,135
All Non-Metro 2,496,577 2,621,903 2,907,272 2,977,396 3,376,739
Total 14,229,191 16,986,510 20,851,820 23,904,380 43,581,928
Source: 1980-2000 - U.S. Census Bureau Counts; 2007 - Census Bureau Estimates;2040 - State Data Center 2000-2004 Migration Scenario Projection
Population Growth for Texas, 1980 -2040(2000-2004 Migration Scenario)

Components of Change for Texas,2000 to 2007
County
PopulationBirths-Deaths
Migration
2000 2007 Change Foreign Domestic
Big Five Metros 9,270,907 10,588,659 1,317,752 851,550 574,332 -142,602Suburban to Big Five 3,567,510 4,773,315 1,205,805 284,627 92,482 837,743
Border Metros 1,777,429 2,065,545 288,116 253,406 92,240 -49,513All Other Metros 3,328,702 3,499,465 170,763 167,430 37,393 -21,751
All Non-Metro 2,907,272 2,977,396 70,124 78,002 46,148 -41,799
Total20,851,82
0 23,904,380 3,052,5601,635,015 842,595 582,078
Source: U.S. Bureau of the Census Counts (2000); Estimate (2007)

Source: Texas Workforce Commission (Employment) U.S. Bureau of the Census (Population). Estimates are for July 1 of each year.
Population and Employment Changein Texas after 2000
County
2000 - 2007 2000 - 2007 2000 - 2007 2000 – 2007
Jobs Population Jobs Population
Big Five Metros 360,408 1,274,418 7.73% 13.68%
Suburban to Big Five 434,571 1,187,227 23.25% 28.41%
Border Metros 112,951 257,198 18.00% 21.13%
All Other Metros 143,627 149,846 9.55% 4.76%
All Non-Metro 75,554 86,848 6.04% 2.80%
Total 1,127,111 2,955,537 11.38% 14.11%

Percent Change in Population andJob Growth in Texas, 1977-2007

Changes in Geographic Distribution in Texas

Internal In-Migration, 2000 to 2007, as a Percent of 2000 Population

Internal Out-Migration, 2000 to 2007, as a Percent of 2000 Population

Recent International Immigration as a Percent of 2007 Population

Percent Growth 1980-1990

Percent Growth 1990-2000

Percent Growth 2000-2007
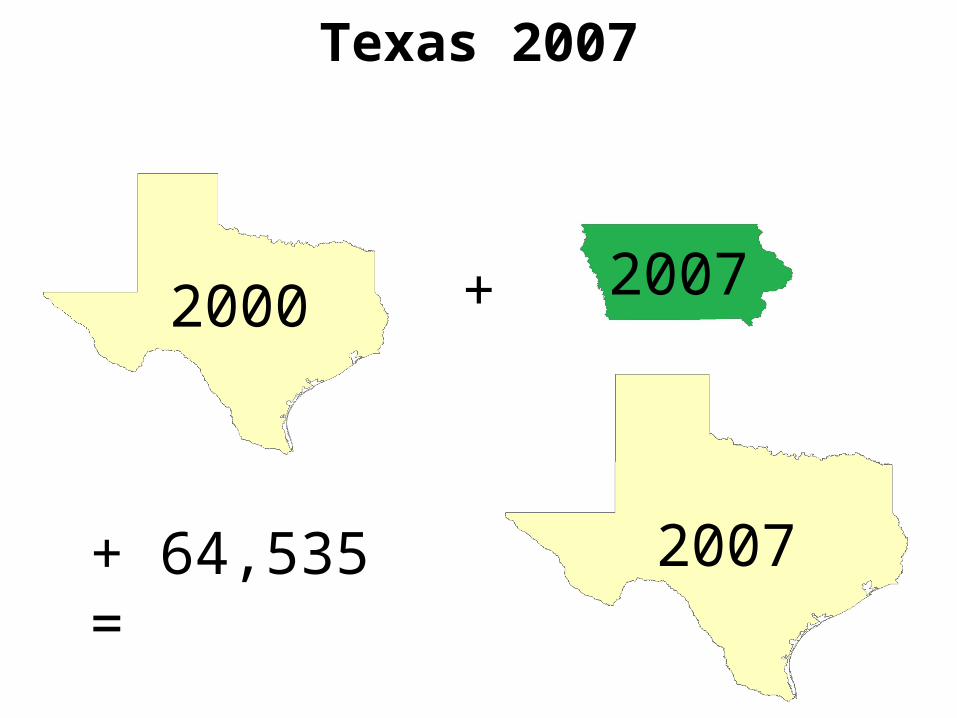
Projected % Growth 2007-2040

Core-Based % of Percent
Statistical Area 1980 2007 Increase Growth Growth
Dallas-P lano-Irving 2,017,465 4,111,529 2,094,064 22 104
Houston-Sugar Land-Baytown 3,148,991 5,628,101 2,479,110 26 79
Fort Worth-Arlington 999,713 2,033,508 1,033,795 11 103
Austin-Round Rock 585,051 1,598,161 1,013,110 10 173
McAllen-Edinburg-Mission 283,229 710,514 427,285 4 151
San Antonio 1,154,648 1,990,675 836,027 9 72
Laredo 99,258 233,152 133,894 1 135
Brownsville-Harlingen 209,727 387,210 177,483 2 85
Tyler 128,336 198,705 70,339 1 55
El Paso 479,899 734,669 254,770 3 53
Total of 10 Areas 9,106,317 17,626,224 8,519,877 89 94
Remainder of State 5,122,844 6,278,156 1,155,312 12 23
Population
Historical Population Increase for Core-Based Areas in Texas, 1980-2007
Source: U.S. Bureau of the Census Population Counts
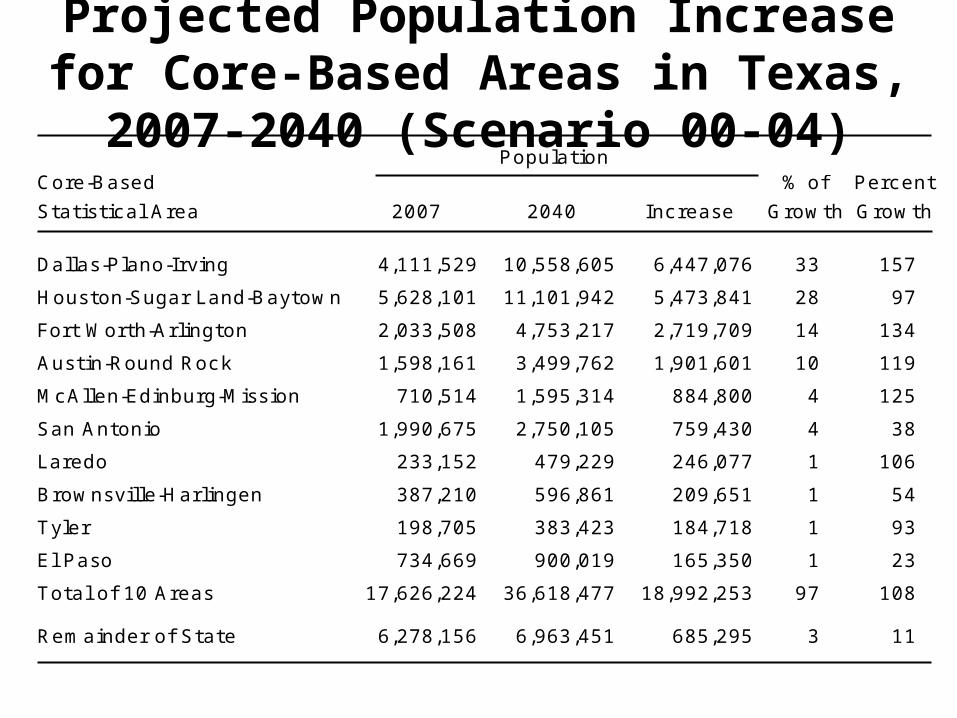
Core-Based % of Percent
Statistical Area 2007 2040 Increase Growth Growth
Dallas-P lano-Irving 4,111,529 10,558,605 6,447,076 33 157
Houston-Sugar Land-Baytown 5,628,101 11,101,942 5,473,841 28 97
Fort Worth-Arlington 2,033,508 4,753,217 2,719,709 14 134
Austin-Round Rock 1,598,161 3,499,762 1,901,601 10 119
McAllen-Edinburg-Mission 710,514 1,595,314 884,800 4 125
San Antonio 1,990,675 2,750,105 759,430 4 38
Laredo 233,152 479,229 246,077 1 106
Brownsville-Harlingen 387,210 596,861 209,651 1 54
Tyler 198,705 383,423 184,718 1 93
El Paso 734,669 900,019 165,350 1 23
Total of 10 Areas 17,626,224 36,618,477 18,992,253 97 108
Remainder of State 6,278,156 6,963,451 685,295 3 11
Population
Projected Population Increase for Core-Based Areas in Texas, 2007-2040 (Scenario 00-04)

Changes in Age Structure

Age-Sex Structure of Texas, 2007 andProjected 2040 (Scenario 2000-2004)
Source: Texas State Data Center Estimates and Projections

Texas Population by Age, 2000 & 2007
Source: U.S. Bureau of the Census Counts (2000); Estimate (2007)

Texas Children by Age, 2000 and 2007
Source: U.S. Bureau of the Census Counts (2000); Estimate (2007)

Percent Change in Enrollment in Texas, 2000-2007

Numeric Change in Enrollment in Texas, 2000-2007

Changes in Ethnicity

Ethnicity & Immigrant Status-State of Texas, 2007
Source: U.S. Bureau of the Census, 2007 American Community Survey Microdata File

Immigrant Status by Age for Hispanics in Texas, 2007

% of Growth Due to Each Ethnicity in Texas, 1980-1990, 1990-2000, 2000-2007, and 2000-2040*
Sources: U.S. Census Counts, and State Data Center Projections, 0.5 Scenario

When do Hispanics pass Anglos in Texas?When do Hispanics become a majority in Texas?
MigrationScenario
PassAnglos ?
AbsoluteMajority?
No Migration 2034 2040+
1/2 of 1990-2000 2020 2035
Observed 1990-2000 2014 2026
Estimated 2000-2004 2015 2027
Source: Texas State Data Center Projections
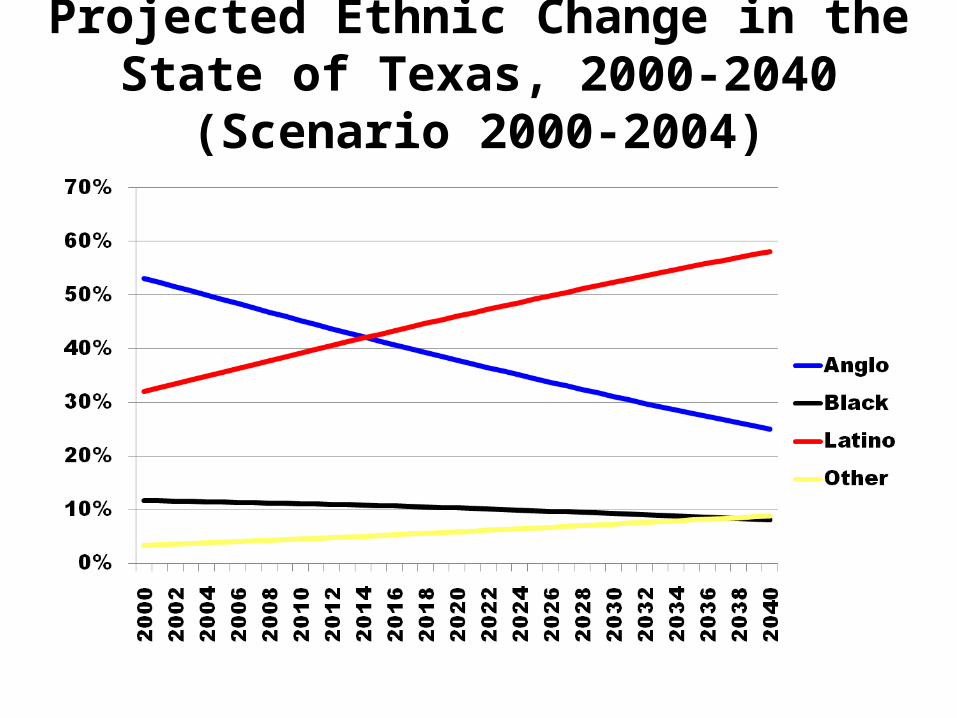
Projected Ethnic Change in the State of Texas, 2000-2040 (Scenario 2000-2004)

Percentage of Texas Population by Ethnicity at Each Age, 2000
Source: U.S. Bureau of the Census, 2000 Census of Population

Percentage of Texas Population by Ethnicity at Each Age, 2040
Source: Texas State Data Center, 2000-2004 Projection Scenario

Workforce Renewalin Texas
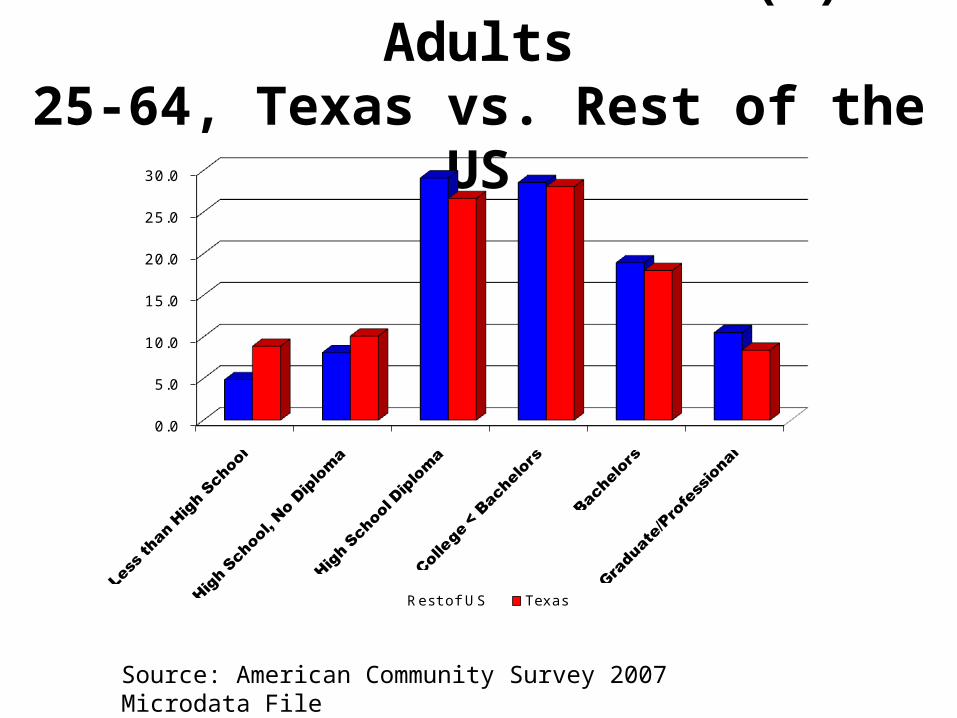
Educational Attainment (%) of Adults25-64, Texas vs. Rest of the US
0.0
5.0
10.0
15.0
20.0
25.0
30.0
Rest of US Texas
Source: American Community Survey 2007 Microdata File

Baby Boomers in Texas Workforce
• 4.3 million Baby Boomers (born 1946 to 1964) in Texas workforce in 2006
• 700,000 born before 1946• Total workforce= 11.5 million• Persons born before 1964 are 43% of
workforce, and 53% of college graduates in the workforce
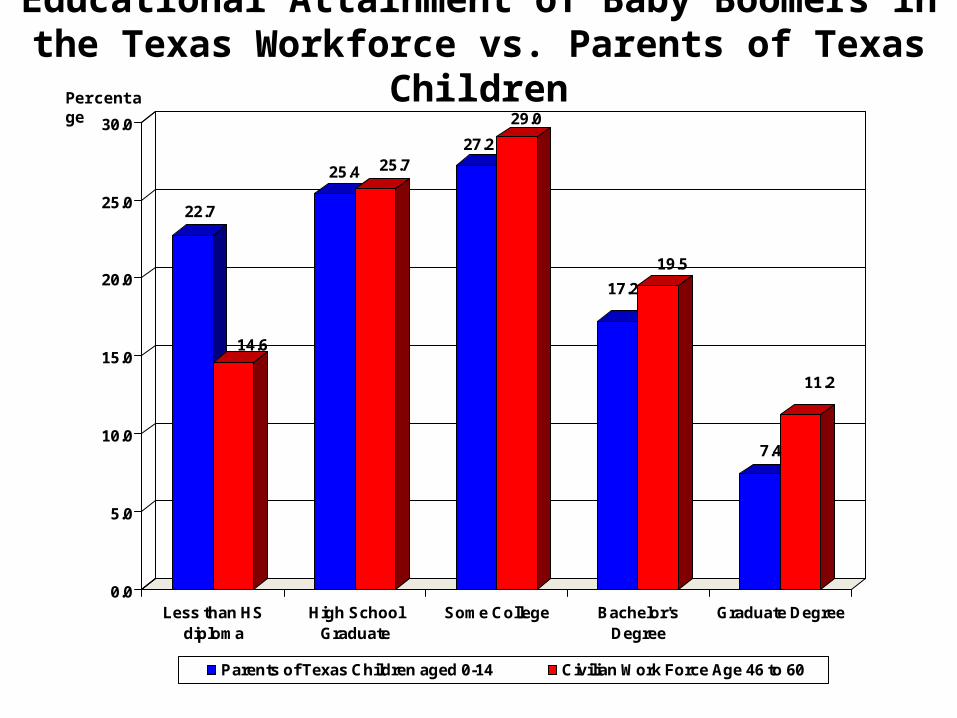
Educational Attainment of Baby Boomers in the Texas Workforce vs. Parents of Texas Children
22.7
14.6
25.4 25.727.2
29.0
17.2
19.5
7.4
11.2
0.0
5.0
10.0
15.0
20.0
25.0
30.0
Less than HSdiploma
High SchoolGraduate
Some College Bachelor'sDegree
Graduate Degree
Parents of Texas Children aged 0-14 Civilian Work Force Age 46 to 60
Percentage

Ratio of over-represented and under-represented occupations:Parents of Texas children vs. Boomers in Civilian Workforce
1.85
1.37 1.34 1.30
1.21
0.67 0.74 0.77 0.79 0.79
0.0
00.5
01.0
01.5
02.0
0
Over Represented
Under Represented
Source: American Community Survey 2006 Microdata File
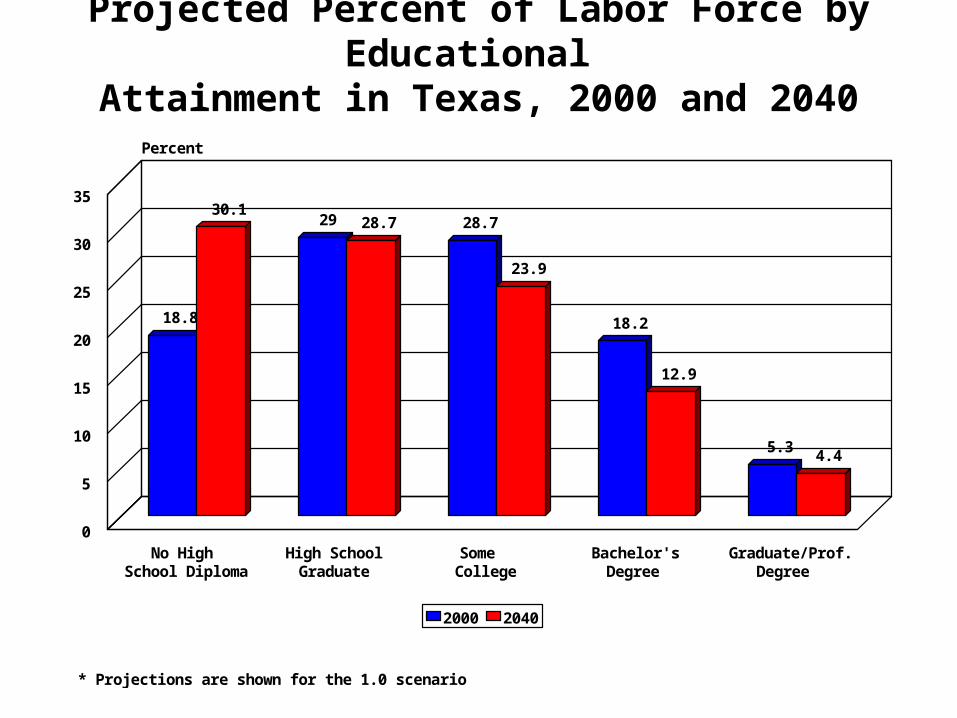
Projected Percent of Labor Force by Educational Attainment in Texas, 2000 and 2040
* Projections are shown for the 1.0 scenario
18.8
29 28.7
18.2
5.3
30.128.7
23.9
12.9
4.4
No High School Diploma
High School Graduate
Some College
Bachelor's Degree
Graduate/Prof.Degree
0
5
10
15
20
25
30
35
Percent
2000 2040

Texas State Data Center and Office of the State Demographer
• Karl Eschbach, Ph.D.• Nazrul Hoque, Ph.D.• Jeff Jordan, Ph.D.• Beverly Pecotte (State Data Center, San Antonio)• Sheila Dos Santos-Dierking (Office of the State
Demographer, Austin)
• Phone 210 – 458 – 6536 (San Antonio)• Phone 512 – 463 – 8390 (Austin)• Website txsdc.utsa.edu