Embed Size (px)
Citation preview

1
Corporate social responsibility and value creation Determinants and mutual relationships in a sample of European listed firms
Authors (*)
Daniela Venanzi Department of Management & Law University of Roma Tre 00154 Rome, Via Ostiense 139 - Italy [email protected] Daniela Venanzi is Full Professor of Corporate Finance at Roma Tre University, Italy. She directed main research projects financed by the Italian National Council of Research (CNR) as well as by the Italian Ministry of Education, University and Research on financial structure decisions and international technology transfers. Applied research and consulting in the areas of corporate finance, financial management, performance and firm evaluation, management control, to private and public sector. She has published extensively on financial structure, cost of capital, ownership and corporate governance, international business management. Referee for various academic journals on corporate finance and economics.
Barbara Fidanza Department of Economic Growth Studies University of Macerata 62100 Macerata, P.zza Oberdan 3 − Italy [email protected] Barbara Fidanza is Associate Professor of Corporate Finance at Macerata University. She has published on asset pricing, financial structure of listed firms, value creation measurement. She partecipated in research projects on financial structure decisions and firm evaluation.
Date
February 2006
(*) The authors’ contributions are the following: §§ 2, 3 and 4.1 by Fidanza; §§ 1,
4.2, 4.3 and 5 by Venanzi

2
Corporate social responsibility and value creation Determinants and mutual relationships in a sample of European listed firms
Abstract
The purpose of this paper is twofold: i) to point out the determinants of a firm
orientation to stakeholders’ interests; ii) to analyze the relationship between
shareholder value and stakeholder value as firm goals. Both issues are empirically
verified on a sample of European listed companies.
Empirical evidence shows that time, nationality, industry, size and level of growth of
a firm determine its stakeholder ratings. Although the empirical evidence presented
concerning the link between the creation of shareholder value and stakeholder value
is neither unequivocal nor statistically significant, it can be inferred that a firm
pursues stakeholders satisfaction to achieve a better value performance.

3
Introduction
For the last two decades, the creation of shareholder value has been (Koller 1994) the
main goal of corporate activity in most US firms. The diffusion of this approach has
changed the way firms compete, their strategy formulation and implementation, their
organisational structures, their management systems and their measurements of
activity and managerial performance (value based management).
The recent European debate concerning the relevance of this goal encompasses now
new issues. Among these issues an unresolved question is whether the creation of
value for the main shareholder is consistent with the achievement of other
stakeholders’ [i.e. current (minority shareholders) and prospective investors,
customers, suppliers, employees, creditors and community] objectives. It is argued
that shareholder value creation is a short term goal and that benefits one category of
stakeholders and overlooks the others.
This critical focus on the short termism of this goal is due to a superficial
understanding of both the theory and practice made in U.S. In fact the leading
authors of this approach (Rappaport 1986) identify the maximization of
shareholders’ welfare with the maximization of the firm’s whole economic value in a
long term perspective, when they measure objectives and outcomes.
The extensive international theoretical and empirical literature about the stakeholder
theory has emphasised the conflict between the creation of value for shareholders
and that creation for other stakeholders. This literature regards increasing shareholder
value as unfair since not all of the stakeholders benefit from it.
Most attentive researchers (Freeman 1984) proved the conflict to be theoretical rather
than actual. The needs of minority shareholders, customers, suppliers, employees and
creditors are naturally met before those of the majority shareholders. Therefore, to
4
maximise the value of shares would be a firm’s ultimate long term target, even from
the social standpoint.
To impartially look after the interests of different stakeholder categories also results
in a better reputation that is amplified when a firm is qualified as sustainable. This is
even more true once the firm becomes included in the stock market sustainability
index as the standing produces concrete economic benefits, higher standing among
investors, increased sales, retention of talented human resources, creation of strategic
alliances, etc.
In Europe and Italy, detractors pointed out multiple reasons to explain the failure of
an approach that maximises shareholder value. Such faults include the inefficiency of
financial markets or the incapacity to reflect the actual economic value of the firm.
Whenever the owner of a firm is also manager and the firms is closely held, a change
in control at the top is unlikely. A social theory of the firm has also been proposed
as an alternative to the shareholder value theory.
The relevance of this topic is clear as it concerns decision making processes as well
as systems of performance evaluation and measurement.
This paper intends contribute to this debate by verifying the existence of a link
between value for shareholders and value for stakeholders in the European context.
From an objective standpoint, shareholder value creation can only be pursued, in a
long term perspective, by achieving the goals of all the stakeholders. From a
subjective standpoint, as the market assesses a firm it also takes into account the
relations of the firm with all the stakeholders.
The fact that shares of companies listed in sustainability indexes ( i.e. Dow Jones
Sustainability Index and Financial Times Stock Exchange 4Good) outperformed
those who are listed in traditional indexes seems reinforcing empirically the
hypotheses made.

5
In order to strengthen the limited research, which has been merely conducted
(Copeland 1994 and Bughin–Copeland 1997) by country with little empirical
evidence from Italy (weight in the sample of 1,4%), this paper is structured as
follows:
• the next paragraph analyzes the stakeholder theory’s impact on social
responsibility of the firm and aspects that affect its decisions, especially
financial ones
• the third paragraph contains a brief review of the international empirical
evidence about the relationship between shareholder and stakeholder value
• the fourth paragraph illustrates tested hypotheses, adopted methodology and
results of the empirical analysis conducted in this study.
Stakeholder theory and social responsibility: theoretical framework and decision-making implications
The term “stakeholder” was first defined by Freeman (1984) as: “primary
stakeholder groups typically are comprised of shareholder and investors, employees,
customers, and suppliers together any group or individual who can affect or is
affected by the achievement of organization’s objectives”. More recently, Clarkson
(1995) expanded the concept of stakeholder by including public stakeholder group
defined as: “the governments and communities that provide infrastructure and
markets, whose laws and regulations must be obeyed and to whom taxes and other
obligations may be due”.
Generally speaking, stakeholders are groups or individuals who are empowered to
affect success or failure of the firm or that have a stake in the firm’s decisions.
Freeman and Clarkson’s regarded stakeholders as a broad group of people who have
a stake in a company although those who are generally accepted as stakeholders
6
include majority shareholders, minority shareholders, customers, suppliers,
employees and local community.
It’s paramount for a modern company to analyse and assess the firm’s performances
from a social, environmental and ethical perspectives as well as to communicate
them accurately and expansively.
The increasing correlation between economic and social performance creates the
need for complete and reliable information. Managers also need increasingly
sophisticated budgeting systems to plan activities and enable stakeholders to measure
how the firm achieves goals linked to their own interest.
Economic and financial indicators need new criteria to define the nature and the
boundaries of stakeholders interests. According to those criteria, entrepreneurs and
managers devise strategies and assess the performance. This approach is rooted in
the idea that stakeholders, in the same way as shareholders invest their capital, invest
resources, competences and knowledge in the company and have a right for to a fair
compensation for their investments. Then corporate strategies should take into
account the stakeholder value.
Lately, corporate social responsibility (CSR) has spread, reflecting the necessity to
protect “secondary stakeholders”. By expanding the purpose of a firm beyond the
creation of profits for the owners, the firm becomes an organism that interacts with a
number of individuals and groups that can contribute to pursue corporate goals but
that depend on the firm to achieve their own private goals. The EU Commission
(2001) defined social responsibility as “a concept whereby companies integrate
social and environmental concerns in their business operations and in their
interaction with their stakeholders on a voluntary basis.”
As a consequence, firms adopt a corporate governance system capable of matching
different interests through global quality and sustainable development.

7
The spread of CSR strengthens the theoretical framework presented above, leading
the firm toward a sustainable development that results in economic growth. This
approach embraces social equity, environmental protection as well as generating
economic competitiveness to create wealth, while respecting the environment.
To understand social responsibility one needs to look at how relations with the
stakeholders become involved in the corporate governance. Corporate governance
shall encompasse not only the relations between principal-agent but also firm-
stakeholder. In other words corporate governance should be seen as the sum of
relations existing between managers, the board of directors, and shareholders as well
as the remaining stakeholders (OECD 1999).
The consequence of the debate between VBM and stakeholder theory is controversial
and affects conspicuously the strategic choices and goals of a firm (i.e. shareholder
value versus stakeholder value). VBM supporters commonly believe that a goal that
a measurable goal affects positively firms’ behaviours and secures the achievement
of both primary and secondary stakeholders needs.
Although, in the last decades Italian firms have achieved this goal by cutting labour
costs through rationalization and outsourcing of non-core business services. The
stakeholder theory recommends a balanced satisfaction of the interests of all people
involved in the business and rejects such radical choices. The maximization of
shareholder value, (and the related social cost), shouldn’t override employee
interest.
In order to assess the social impact of a firm’s behaviour and strategies, it is crucial
to identify which interests are involved. A firm is sustainable as it sets not only
financial goals but also social and environmental goals and it aims to create value
for its shareholders, to improve the quality of life and to use efficiently the
resources it invests.

8
The interests and rights of the company’s “secondary” stakeholders appear to be
residual, but in fact they are not. Value maximisation can be maintained as the main
goal of the firm while considering social aspects. The concepts of ownership and
residual stake that underlay the criteria of value maximisation, still hold up despite
the use of stakeholder management approach.
The following are the advantages of a sustainable company concerning image and
reputation:
• capacity to boost sales as stakeholders perceive a firm responsive to meet
their interests, expanding to new market segments (e.g. more demanding
consumers, interested not only in quality ad price but also in ethical codes
adopted)
• increased fidelity of customers and suppliers
• capacity to retain talented people and cut turnover
• creation of alliances and strategic partnerships
• access to subsidies and financing at a lower interest rate.
An improved image will result in both tangible and intangible benefits that help the
firm in pursuing it’s economic and financial goals. Sustainable companies enjoy
good risk/return trade-offs due to the conviction that sustainability means a
successful management, being leader in strategic areas and the high visibility of
positive results that may be achieved. Sustainable companies make the most of
intangible assets through better relationships with stakeholders, as evidence shows
that their stock outperforms those of non sustainable companies.
A firm that aims at sustainability faces the challenge of creating indicators to
measure the degree of stakeholders satisfaction. Financial markets adapted to the

9
new informational needs through market indexes, that factoring not only economic
but social and environmental variables in order to provide sustainable companies
with benchmarks. The admission of a firm to such an index is subject to rating
companies’ judgment whose criteria are:
• economic (corporate governance, relationships with investors, risk and crisis
management, economic stability and financial solvibility);
• environmental (environmental policies, reporting and performance);
• social (indicators for internal procedures, human capital development, appeal
for talents, involvement of stakeholder).
International empirical evidence
In corporate finance the empirical research about stakeholder theory and social
responsibility is due to researchers’attention to firms’s interaction with respective
stakeholders. The debate is whether or not shareholders’ wealth is maximised at the
expense of other stakeholders.
Several international studies, that did not test the link between stakeholder and
shareholder value directly, reported a positive impact of more social oriented policies
on a firm’s success.
Through an event study, Frooman (1997) documented a negative reaction of the
market to illegal or reckless behaviour of companies. In those instances, market
values decreased significantly.
Researchers paid much attention to the degree of satisfaction of the customers of a
firm and its financial performance especially with respect of the impact of
illegal/reckless managerial practises on market value. For instance some studies
recorded a remarkably negative reaction to the announcement of a product recall

10
(Bromiley-Marcus 1989, Davidson-Worrel 1988, Hoffer-Pruitt-Reilly 1988).
Conversely, it seems that a positive perception of a firm’s product quality and fair
behaviour is apt to increase sales (Waddock-Graves 1997). A number of empirical
and theoretical studies documented that human resources management can affect a
company’s financial performance (Delery-Doty 1996, Huselid 1995, Pfeffer 1994,
Youndt-Snell-Dean-Lepak 1996), and it can be concluded that human resources are a
source of competitive advantage. A successful human resources management can cut
down turnover and absenteeism as well as improve productivity and workers
commitment. Allegedly the possibility for workers of a professional growth would
also promote a better financial performance. A firm would also attract more
competitively the most talented resources (Robinson-Dechant 1997, Thomas- Ely
1996).
How firms deal with their external environment may also have an impact on their
value. Social responsibility can cut down operative costs (Russo-Fouts 1996) and
improve efficiency. For instance, environmentally friendly products are more
inviting to customers and may generate a competitive advantage. A proactive attitude
can also secure a positive image and boost loyalty (Dechat-Altman-Downing-Keeny
1994, Hart 1995).
Recent studies (Copeland 1994, Bughin-Copeland 1997) seem to confirm that the
creation of value in a firm goes hand in hand with increased hiring rates, better
working conditions, higher revenues for the fiscal system, better products and
services, than competitors. These findings may be sufficient to defeat the assumption
of an ever-present trade-off between the goals of different stakeholders.
This does not necessarily mean that value creation is solution for all the conflict of
interest existing between stakeholders, but it does demonstrate that firms creating

11
value in the long term can better meet the needs of all stakeholders. The more value
a firm created, the more benefits it has available and divisible.
Several studies related to this issue (Berman-Wicks-Koth-Jones 1999, Hillman-Keim
2001; Ruf et al. 2001) tested the hypothesis that maximisation of value meet the
interests of all stakeholders. Researchers adopted a regression between a proxy of the
wealth created for shareholders (i.e. dependent variable) and a proxy of the degree of
satisfaction of other stakeholders (i.e. independent variable). In these studies,
researchers adopted an index called KLD (e.g. Kinder, Lydenbur, Domini) as
measure of stakeholder performance. KLD is adopted by a rating company that
assesses social performance of 800 US firms through questionnaires, annual reports,
annual statements, and articles from journals and a number of external sources of
information. In the assessment of a firm‘s social performance a number of aspects are
factored: the existing relationship with local community, employees, customers,
suppliers, as well as the quality of the products and the attention to the weakest
categories of citizens. The results obtained confirm that firms that create higher
market value added (MVA) are more oriented to look after all of the categories of
stakeholders and show higher KLD rates. Yet cited studies don’t illustrate methods
adopted to calculate rating thoroughly thus leaving some elements unsaid (e.g.
measures of the performance, scoring criteria, weights for different criteria) and
room to subjectivity aspects.
An empirical test in European context
The present research partially follows the studies illustrated above. In addition it tries
to broaden the spectrum of analysis in order to identify the features of the firms more
aware of all stakeholder categories needs.
12
Variables
The crucial point of this analysis is defining a sufficiently objective set of proxy
capable to measure the satisfaction degree of each category of stakeholders. Some
indicators come in handy for this purpose. RSI is a compound index that, built for
a sample of European firms, is determined for social responsibility and devised
through data attained via survey. Author of such index is the SiRi group1, whose
KLD is a member. The compound rating is made up according a firm’s handling of
issues related directly to stakeholder categories. For each shareholder category a
corresponding rating is measured (i.e. community, corporate governance,
customers, suppliers, employees, environment, business ethic, controversies). The
total rating averages out the eight ratings above. The following aspects are
considered in measuring each rating: i) voluntary disclosure of impact of firm
activities on stakeholder interests; ii) principles, rules and management systems
utilized in order to meet stakeholder needs; iii) quality/effectiveness of managerial
systems adopted to protect each stakeholder category.
The following are the issues that determine the ratings:
Community
This rating evaluates the attention of the firm to the community. To score
positively, a firm must:
– show a willingness to disclose activity through public reports and
communication, forging a solid relationship with the local community
– establish behavioural tenets and policies concerning the community
– constitute a formal system and/or department to manage public
relations.

13
Corporate Governance
Corporate governance is instrumental in protecting shareholders’ rights,
namely those of minority shareholders. A firm’s willingness to have
specific tenets of corporate governance and then to fully disclose their
effectiveness will gain points for the company. The organization of a firm’s
decision making bodies is also a parameter in the assessment, as it reflects
the respect for minority shareholders. Organisational qualities include the
following:
– the number of directors including non-executive and independent
– the number of board meetings
– the presence of auditing committee and practices
– a compensation system for the directors
– the voting rights of shareholders’ classes
– any existing disputes arising from voting rights or directors’ compensation
issues
Customers
This rating measures a firm’s attention to customers ex-ante and ex-post the purchase of
the product/service. Attention ex-ante means investigating in order to identify
customers’ needs and any product attributes to fit them. Attention ex-post concerns the
measure of customer satisfaction. The following activities have a positive score in rating
measure:
– market research and a relationship built with the general public
– certified quality warranties
– marketing campaign actuation
– a relationship established with acquired customers
– safety guarantees for products

14
– research to verify the degree of customer satisfaction.
Suppliers
Firm scores a higher rating if it implements the following:
– formalised procedures to select suppliers
– periodical visits to suppliers
– fair negotiation with suppliers
– any existing relationship with third world companies
– supplier certification.
Employees
This rating takes into account whether a firm adopts rules, policies and managerial
systems concerning the following aspects:
– health and safety in the workplace
– respect for young labour
– freedom of words and association
– participation in unions
– employee participation in decision making and profit sharing
– employee training programs.
Environment
A firm’s attention to the environment is assessed with respect to the following:
– formal procedures meant to protect the environment (e.g. plans to reduce
water consumption, cut down pollution, to recycle raw materials, etc.)
– certified managerial systems
– allocation of responsibilities
– compliance with existing laws
– any past adverse sentences and fines
– production with low environmental impact

15
Business ethic
This rating deals with mechanisms adopted by the firm in order to prevent
corruption, immorality and illegal behaviours and to promote virtuous practices.
Controversies
This indicator reflects current suits involving a firm’s environmental practices or
questionable product quality. For instance, disputes over the production of GOM
foods or emission of polluting agents will negatively affect the rating.
The present study uses the ratings above to measure the degree of stakeholder
satisfaction. It can be inferred that a higher rating indicates greater attention paid
by the firm to each aspect considered. As a consequence, related stakeholder
categories may attain a higher degree of satisfaction.
In regard to performance variables, the following indicators measure whether
companies − all listed on a stock exchange − create value in terms of market value
created:
– market value/book value ratio
– total shareholder return (which includes both dividends and capital gains)
– market value added (market value – capital employed).
To identify which factors affect ratings, the following aspects are taken into
account: year, country, industry, size and growth rate.
Table 1 lists the variables included in the empirical test (i.e. performance and firm
specifics variables) and how they are measured. Market and accounting
information are provided respectively by Datastream and World Scope databases.
Tab 1

16
Samples, tested hypotheses and methodology
The empirical analysis is conducted on a sample of listed companies − mostly from
Europe − , whose SiRi group ratings are available.
The 716 samplings of data were extracted from 330 European, Canadian and Asian
firms. Some bias in the comparison of variables in the three-year period can stem
from varied composition of the sample, which changes from year to year. The
distribution of data by country and year is described in Table 2.
Tab 2
Empirical analysis involves the following issues:
a) factors that influence the ratings can include the year of sampling, the
country and industry a firm belongs to, and the size and growth rate of a
firm
b) the degree of correlation between ratings
c) the degree of correlation between ratings and performance measures for
the shareholder.
In regard to point a, the following are hypotheses tested:
• ratings have a consistent trend. The hypothesis is grounded in the
increased attention to stakeholders’ interests in the analyzed period,
along with a growing interest around sustainability of a firm’s activities
and social responsibility (recommendations of OECD in 1999 and EU
Commission in 2001). The variability of firms that comprise the sample
may bias the analysis
• The country a firm belongs to − in terms of legal system and degree of
investor protection − influences a firm’s behaviour toward some
stakeholder categories. Such hypothesis is grounded in La Porta et al.
conclusions (1998 and 2000), pointing out that a country’s legal system

17
influences the capital market efficiency and managerial decisions in
finance and corporate governance. Sample firms were clustered
according to legal systems (Nenova 2000) in the following groups:
common law countries (United Kingdom, Canada and Hong Kong), civil
law countries with German origins (Belgium, Germany, and
Switzerland), civil law countries with Scandinavian origins (Sweden and
Finland). The last cluster comprises the remaining European countries
(France, Ireland and Spain); Italy is analyzed in isolation in order to
compare with the other clusters.
• The kind of industry a firm belongs to affects ratings. This hypothesis
tests whether a link exists among industry, its degree of competition, a
firm’s success key-factors and stakeholders with greatest impact on
performance. In other words, when stakeholders greatly affect firm
performance, a higher protection of their interests is expected. The
industry impact is analyzed according to more broadly defined sectors
(manufacturing, banking, etc.) and to the Pavitt taxonomy for
manufacturing firms
• The size and growth rate of firms affect ratings. It is assumed that the
larger the firm, the more attention is given to stakeholders for the sake of
reputation. Size also spurs economies of scale and scope in managing
formalized relationships with stakeholders. Conversely, the link between
growth and ratings is less certain. It is hypothesised that more attention
given to certain stakeholders over others hinders or promotes growth.
However, a high growth rate improves a firm’s image and market
appreciation, leaving the pursuit of stakeholder satisfaction negligible.

18
In regard to the analysis of point b, it is questioned whether a firm’s social
responsibility concerns all stakeholder categories or only some and why.
Analysis of point c received the utmost attention from international literature, as
described in § 3 above.
Methodology relies on a nonparametric ranking (Kruskal-Wallis test) in order to
compare similarities/dissimilarities of ratings with respect to determinants listed
above. Nonparametric tests do not require assumptions about the shape of
underlying distribution (in this study, only total and employees ratings appear to be
normally distributed) and also remain strong in small samples as it is the case of
sub-samples considered in the empirical analysis. The continuous variables
(performance, size, etc.) are grouped and ranked in deciles or in commonly
accepted categories. The respective ranks are used in the analysis, since a non
linear relationship between these variables can be hypothesised.
To analyze correlations, the Spearman Rho coefficient is adopted since it fits the
rank-variables.
Results
Results follow for the three types of analysis presented above.
Determinants of ratings
In respect to different years (2000-2003), ratings grow significantly as legal
controversies ratings show an opposite trend (Table 3). Both trends show more
widespread attention over time to the sustainability issue.
Tab. 3

19
A firm’s nationality notably affects ratings when control variables are included in
the analysis. Statistically significant differences are found (Table 4) between
groups of countries defined above, with respect to the main ratings.
• Italy scores minimum values, except for its corporate governance rating,
which is nearly equal to other EU countries. Attention to current and
prospective minority shareholders has the greatest impact on market
appreciation of shares. While the Italian firms seem to show less
attention to social responsibility “tout court”, the growing attention to
corporate governance may be due to the following occurances in the
analyzed period: the growing diffusion of economic value as a
company’s main goal, the growing role of financial markets in firms’
financing and their process of globalisation, the evolution of Italian
regulation on corporate transparency, on minority shareholders protection
and on corporate control contestability.
• Common law countries show the highest corporate governance ratings.
• Remaining civil law countries, excluding Italy, show similar values in all
ratings besides two: corporate governance, low in German and
Scandinavian countries, and the customers. The latter depends
significantly on the kind of industry, therefore a country’s rating is
affected by the kind of industry specialization existing in that country.
• The highest environmental ratings are observed in the historically
environmentally concerned German and Scandinavian countries.
• Business ethics, controversies, suppliers and employees ratings are
statistically non dissimilar by country.
Tab 4

20
Results above show the relevance of a firm’s nationality as a determinant of ratings
related to the country’s legal framework, namely to the legal and statutory
constraints and protections. This confirms La Porta’s hypothesis that ownership
structure and corporate governance systems differ due to varied investor protection
in legal systems. Corporate governance and community ratings show higher
protection granted to investors in common law countries. These ratings are lower in
all civil law countries, namely those with German origins.
The firm’s industry is the most crucial determinant for customers and environment
ratings (Table 5). Energy sectors show the highest ratings due to the relevance of
environmental issues and the obvious connection with the natural resources.
Tab 5
The most important determinant for the customers rating is the kind of business,
higher in manufacturing than in financial and non-financial services. Within the
manufacturing category (Table 6), the variable scored higher in specialized
manufacturing sectors thanks to the impact of customer relations on a firm’s
performance. Products in these industries are often tailored for single customers
who usually have an exclusive relationship with the firm.
Tab 6
According to such results, customers might not be (or appear to not be) as crucial
for financial and non-financial services as they are for manufacturing firms. This
thought could be attributed to the smaller size of service companies, which cannot
sustain a customer-oriented approach or to a lower degree of competition in the
financial services industry and therefore less customer care. It might also be
alleged that the customers rating regards as customer-oriented some formalized
procedures of forecasting and analyzing customer needs and satisfaction before
and after the service delivery. The rating therefore fails to see that the personal

21
interaction between the firm and the customer at the time of service delivery is
“naturally” customer-oriented.
Firms with many employees score higher in the employees rating, with labour
regarded as a key-factor for success and having employees a significant
contractual-power.
A firm’s size positively affects all ratings except for controversies, which is in fact
negatively associated. Both the whole sample and sub-samples clustered by
industry confirm that conclusion. The banking sector is the only exception, as it
shows no correlation of size with ratings that are respectively the highest
(corporate governance and business ethics) and the lowest (customers), regardless
of the size.
In regard to the growth (Table 7), there is a statistically significant negative
correlation between the growth rate and the stakeholders ratings, except for the
customers and controversies ratings. These two ratings show respectively a
positive and a U-shaped correlation.
Tab 7
There are two possible explanations:
• Growing firms focus on financial performance and cannot pay attention
to aspects other than customers, that crucially influence growth. Also,
controversies ratings show a negative relationship with growth rates,
except for very high growth rates, that are not favoured by a contentious
environment.
• Just as stakeholder value is instrumental in positively impacting
shareholder value, a high growth alone can positively affect economic
performance (value of growth opportunities), making all other factors
negligible.

22
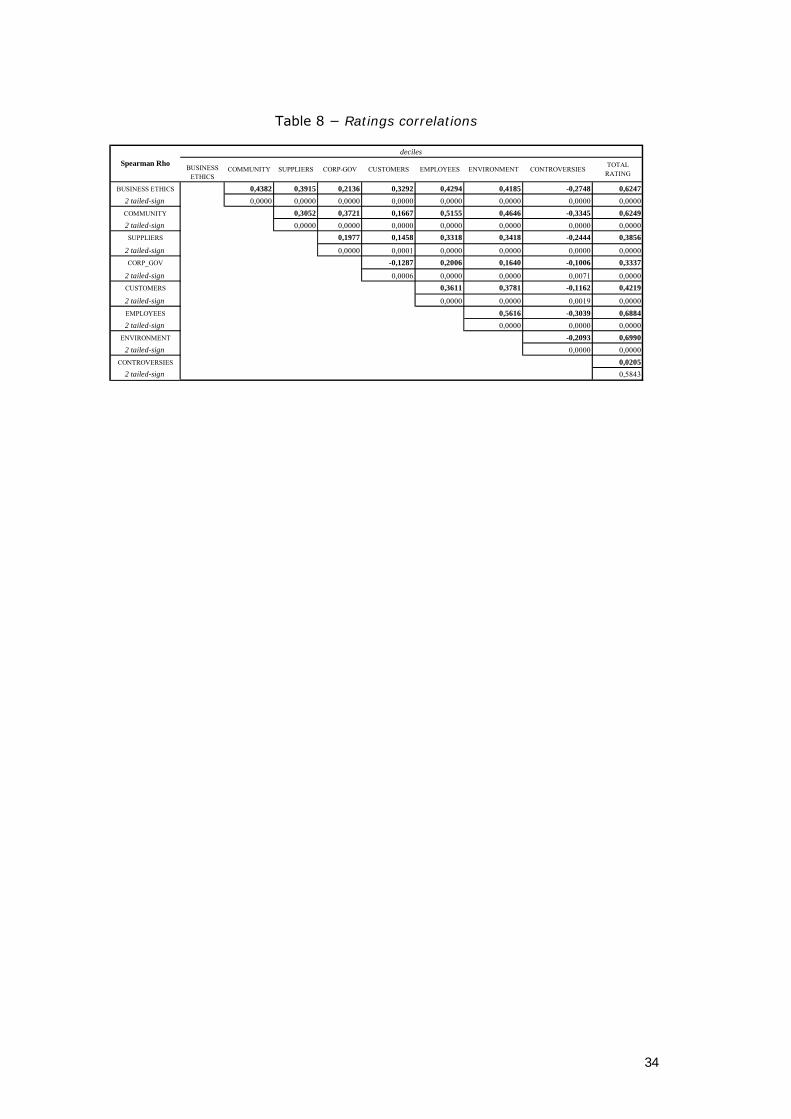
Correlation between ratings
In regard to the entire sample of firms, ratings are statistically positively associated
with one another (Table 8). Environment, business ethics, community, customers
and employees ratings are more correlated, affecting a firm’s image of social
responsibility.
Tab 8
Yet there is an inverse correlation between corporate governance and customers
ratings that may be linked to the whole sample’s stratification by country and
industry (e.g., the high values of the former and low ones of the latter in financial
firms sub-sample). In addition, the fact, however, that the whole sample ratings are
de facto interchangeable with respect to the impact on market value may account
for the inverse correlation. Customer satisfaction is a crucial driver of growth and
of the impact that growth has on a firm’s value.
In sub-samples clustered by country, no correlation can be found in common law
countries, Scandinavian and other European countries between corporate
governance and other ratings, whereas such correlation exists within Italy and
German civil law countries, confirming what is found in the determinants. In the
former group of countries, due to the specifics of the financial markets and of the
ownership and financial stucture of the firms, the attention to corporate governance
issue is shaped by financial markets and related regulation rather than caused by
the degree of social responsibility of the firm. On the other hand, in the latter
group, investors are only an aspect of the broader group of stakeholders. The role
of bank financing in this group of countries accounts for such difference in the
level of protection: the corporate governance systems in these countries are
relationship-based, not market-oriented, and the regulation systems offer lower
investor protection.

23
Shareholder value towards stakeholder value
The correlation existing between the creation of shareholder value and ratings is
statistically weak (Table 9). Only RI shows a statistically significant correlation.
However, RI measures the total shareholder return, but it does not factor the
opportunity cost of capital and overlooks the operating and financial risk. It fails to
measure value creation or destruction, as it is confirmed by absence of correlation
with levered beta. RI (ranked by deciles) has a positive correlation with the total
rating (two-tailed 5% significance) and with community, corporate governance,
suppliers, and business ethics ratings in a decreasing order (two-tailed 1%
significance) and it has a negative correlation with customers (two-tailed 1%
significance) and controversies (two-tailed 5% significance).
Tab 9
Such a positive correlation between RI and corporate governance, business ethics,
and community ratings confirms the effectiveness of these ratings as a general
measure of the shareholder satisfaction, directly and indirectly (through the image
of socially responsible behaviour). High values of these ratings result in higher
values of RI as a deliberate consequence of the firm’s strategy and as an indirect
effect of capital market appreciation.
A good relationship with suppliers has a positive impact on shareholder return, due
to both the results of firm decisions (ex ante) and market evaluation (ex post),
while a good relationship with customers has a negative one. In addition, RI is
generally low for growing companies, whereas MVBV and MVA are significantly
and positively associated with growth.
Lacking a statistically significant correlation between MVA and ratings means that
neither the hypothesis of coherency, nor of the existence of conflict between
shareholder value and stakeholder value are verified.

24
Conclusions
The empirical evidence presented shows that time, nationality, industry, size and
level of growth of a firm determine its stakeholder ratings. A firm's attention to
different stakeholders and respective ratings, while variably significant according
to the different stratification of the sample, happens to be instrumental in achieving
either a directly or indirectly better performance.
Although the empirical evidence presented concerning the link between the
creation of shareholder value and stakeholder value is neither unequivocal nor
statistically significant, it can be inferred that a firm pursues stakeholders
satisfaction to achieve a better value performance.
The empirical analysis has some limits. Defining and measuring a set of proxies
capable of reasonably approximating stakeholder satisfaction was a critical part for
the research. Rating measures are subjective and incomplete, and both aspects
investigated and criteria adopted in measuring ratings are only partially disclosed.
A merely supply-side perspective on measuring stakeholder satisfaction is an
additional limit. Those ratings measure the attention of the firm to stakeholders and
fail to do so from a demand-side perspective. Nevertheless, the latter requires a
very complex data collection method with a high degree of subjectivity.
A solution to such limits may be to create ratings that mix the supply and demand
approaches. It could measure the satisfaction for the different categories of
stakeholders through its direct and indirect effects on a firm’s fundamentals
(results, relationship quality and continuity, reputation, trade-offs between price
and quality, etc.). Such a logical framework could be tested on a limited panel of
firms in order to verify the strength of hypothesized links and to measure the
fundamentals’ impacts on ratings. Therefore, the most statistically significant

25
model (tested on a wide set of different samples) could be widely and generally
utilized in measuring ratings through key effect-variables.
Notes 1 Avanzi srl, the member for Italian firms, has supplied the ratings utilized in this study.
References
Berman S. L., Wicks A.C., Kotha S., Jones T.M., (1999) Does stakeholder orientation matter? The relationship between stakeholder management models and firm financial performance, Academy of Management Journal, 5
Bromiley P., Marcus A., (19899, The deterrent to dubious corporate behavior: profitability, probability and safety recalls, Strategic Management Journal, 2
Bughin J., Copeland T. E., (1997) The virtuous cycle of shareholder value creation, The McKinsey Quarterly, 2
Clarkson M. B. E., (1995) A stakeholder framework for analyzing and evaluating corporate social performance, Academy of Management Review, 1
Copeland T. E., (1994) Why value value?, The McKinsey Quarterly, 4 Davidson W.N., Worrell D.L., (1988) The impact of announcements of corporate illegalities on
shareholders returns, Academy of Management Journal, 31 Dechant K., Altman B., Downing R.M., Keeney T., (1994) Environmental leadership: from compliance
to competitive advantage, Academy of Management Executive, 3 Delery J., Doty D.H., (1996) The impact of human resource management practices on perception of
organizational performance, Academy of Management Journal, 39 EU Commission, (2001) Green Paper–Promoting a European framework for Corporate Social
Responsibility, Bruxelles, COM (2001) 366 Freeman J., (1984) Strategic management: a stakeholder approach, Englewood Cliffs, NJ, Prentice-Hall Frooman J., (1997) Social irresponsible and illegal behavior and shareholder wealth: a meta-analysis of
event studies, Business & Society, 36 Hart S., (1995) A natural resource based view of the firm, Academy of Management Review, 20 Hillman A.J., Keim G. D., (2001) Shareholder value, stakeholder management, and social issues: what’s
the bottom line?, Strategic Management Journal, 22 Hoffer G. E., Pruitt S. W., Reilly R. J., (1988) The impact of products recal on the wealth of sellers: a
reexamination, Journal of Political Economy, 96 Huselid M., (1995) The impact of human resource management practices on tournover, productivity and
corporate financial performance, Academy of Management Journal, 38 La Porta R., Lopez-de-Silanes F., Shleifer A., Vishny R., (1998) Law and finance, Journal of Political
Economy, 106 La Porta R., Lopez-de-Silanes F., Shleifer A., Vishny R., (2000) Investor protection and corporate
governance, Journal of Financial Economics, 1-2 Koller T., (1994) What is value based management?, The McKinsey Quarterly, 3 Nenova T., (2000) The value of corporate votes and control benefits: a cross−country analysis, WP
Harvard Business School OECD, (1999) Principles of corporate governance, Paris Pfeffer J., (1994) Competitive advantage through people: unleashing the power of the work force,
Boston, Harvard Business School Press Rappaport A., (1986) Creating shareholder value, Washington, The Free Press Robinson G., Dechant K., (1997) Building a business case for diversity, Academy of Management
Review, 3

26
Ruf B. M., Muralidhar K., Brown R. M., Janney J. J., Paul K., (2001) An empirical investigation of the relationship between change in corporate social performance and financial performance: a stakeholder theory perspective, Journal of Business Ethics, 32
Russo M., Fouts P., (1997) A resource-based perspective on corporate environmental performance and profitability, Academy of Management Journal, 40
Thomas D., Ely R., (1996) Making differences matter: a new paradigm fro managing diversity, Harvard Business Review, 1
Waddock S.A., Graves S., (1997) The corporate social performance-financial performance link, Strategic Management Journal, 18
Youndt M., Snell S., Dean J., Lepak D., (1996) Human resource management, manufacturing strategy and firm performance, Accademy of Management Journal, 39

27
Table 1 − Variables utilized in the empirical analysis
performance variables acronym formula
MVA
)book value(at assetsnet )book value(at assetsnet - uemarket val
MTBV
)book value(at sharesordinary uemarket valequity
RI return index ( )tRI in period t, that takes in account both capital gains and dividends:
⎟⎟⎠
⎞⎜⎜⎝
⎛⋅+⋅⋅=
−− N
DYPIPI
RIRI t
t
ttt
1100
11
1
1tRI − = return index in t-1
1tPIetPI − = price in t and t-1 respecitvely
tDY = dividend yield % in t N = number of working days in the given period
determinants
acronym formula
year
YEAR year
coun
try
COUNTRY
country of share listing dummy variable that classifies countries according to legal environment index by La Porta (1998) and Nenova (2000)
DUMMYSET dummy variable has the following values in function of the type of industry: 1 = energy, 2 = manufacturing, 3 = services, 4 = banking/insurance
indu
stry
DUMMYPAVITT dummy variable defined according to PAVITT taxonomy: 1 = traditional sectors, 2 = scale sectors, 3 = specialized products, 4 = high technology
TOTAL SALES net sales TOTAL CAPITAL EMPLOYED net fixed assets + net working capital TOTAL ASSETS total assets si
ze
NUMBER OF EMPLOYEES number of employees INVESTMENT RATE capital expenses/fixed assets
grow
th
rate
SALES GROWTH RATE sales(t)/sales (t-1) -1

28
Table 2 – Sample investigated
2001 2002 2003 Total Belgium 5 10 2 17 Canada 3 8 4 15 Finland 6 1 2 9 France 37 44 43 124 Germany 30 34 12 76 Hong Kong 4 3 4 11 Ireland 3 6 1 10 Italy 22 29 7 58 United Kingdom 74 78 26 178 Spain 9 4 6 19 Sweden 12 4 3 19 Swizerland 56 60 64 181 total 261 281 174 716

29
Table 3 − Ratings per year
year
total rating
business ethics community suppliers corporate
governance customers employees environment controversies
number of cases 261 261 261 261 261 261 261 261 261 2001
mediane 4,71 3,42 4,27 2,96 6,47 4,91 5,51 6,00 -0,54 number of cases 281 281 281 281 281 281 281 281 281 2002
mediane 5,01 5,58 5,07 2,64 7,01 5,12 6,02 6,16 -0,61 number of cases 174 174 174 174 174 174 174 174 172 2003
mediane 5,31 6,87 5,86 2,83 7,32 6,38 6,48 6,70 -0,86

30
Table 4 − Ratings per country (average rank and Kruskal-Wallis test)

31
Table 5 − Ratings per industry (average rank and Kruskal-Wallis test)
industry dummy number of cases BUSINESS ETHICS COMMUNITY SUPPLIERS CORP_GOV CUSTOMERS EMPLOYEES ENVIRONMENT CONTROVERSIES
energy 33 401,06 505,89 431,67 446,53 370,89 495,95 521,86 179,53manufacturing 394 361,05 336,27 362,66 317,44 392,31 352,57 390,64 372,20
services 158 317,68 378,90 345,90 394,33 319,95 341,39 320,06 375,64banking-insurance 134 396,69 371,55 351,14 423,35 309,53 370,31 277,15 344,99
total 719
chi-square 12,2462 23,1755 5,1763 39,4843 23,5429 16,2663 55,8096 33,0923asint. sign. 0,0066 0,0000 0,1593 0,0000 0,0000 0,0010 0,0000 0,0000
average rank

32
Table 6 − Ratings per Pavitt sectors (average rank and Kruskal-Wallis test)
Pavitt dummy number of cases BUSINESS ETHICS COMMUNITY SUPPLIERS CORP_GOV CUSTOMERS EMPLOYEES ENVIRONMENT CONTROVERSIES
traditional 71 157,68 194,14 217,74 208,23 169,49 172,99 166,77 169,59scale 137 188,17 198,91 182,48 194,61 182,98 200,41 192,68 173,71
specialization 78 158,19 131,78 150,21 140,86 212,88 146,73 171,26 242,70high tech 83 228,33 204,23 193,85 190,75 175,40 205,81 200,83 160,25
total 369
chi-square 23,8427 25,0010 16,0627 18,2588 7,6204 16,9824 5,9091 36,8639asint. sign. 0,0000 0,0000 0,0011 0,0004 0,0545 0,0007 0,1161 0,0000
average rank

33
Table 7 − Ratings per growth rate (average rank and Kruskal-Wallis test)
sales growth number of cases BUSINESS ETHICS COMMUNITY SUPPLIERS CORP_GOV CUSTOMERS EMPLOYEES ENVIRONMENT CONTROVERSIES total rating1° decile 70 404,51 492,62 385,08 553,11 253,21 382,30 397,33 360,21 456,202° decile 71 356,49 496,30 400,56 555,61 279,50 396,03 426,35 375,51 454,553° decile 71 412,90 391,43 363,96 461,70 364,83 405,25 371,29 320,74 408,974° decile 71 359,27 348,29 324,01 330,03 356,16 349,47 353,98 298,75 326,185° decile 71 405,06 368,77 353,60 296,37 401,50 401,23 369,85 272,36 359,466° decile 71 295,60 299,20 343,36 303,33 314,24 339,25 313,84 334,56 291,897° decile 71 293,34 305,99 346,27 264,22 355,16 326,99 287,06 351,33 292,248° decile 71 372,10 309,92 376,12 282,11 404,48 340,44 367,32 384,69 348,469° decile 71 351,04 281,82 316,88 276,45 437,01 356,63 345,37 403,31 327,6510° decile 68 282,42 237,73 324,38 208,76 368,11 232,70 301,01 426,63 267,21
total 706
chi-square 36,3792 113,2318 12,4393 236,8337 50,0338 38,7352 28,4691 40,7167 68,0083asint. sign. 0,0000 0,0000 0,1897 0,0000 0,0000 0,0000 0,0008 0,0000 0,0000
average rank
34
Table 8 − Ratings correlations
BUSINESS ETHICS 0,4382 0,3915 0,2136 0,3292 0,4294 0,4185 -0,2748 0,62472 tailed-sign 0,0000 0,0000 0,0000 0,0000 0,0000 0,0000 0,0000 0,0000COMMUNITY 0,3052 0,3721 0,1667 0,5155 0,4646 -0,3345 0,62492 tailed-sign 0,0000 0,0000 0,0000 0,0000 0,0000 0,0000 0,0000SUPPLIERS 0,1977 0,1458 0,3318 0,3418 -0,2444 0,3856
2 tailed-sign 0,0000 0,0001 0,0000 0,0000 0,0000 0,0000CORP_GOV -0,1287 0,2006 0,1640 -0,1006 0,3337
2 tailed-sign 0,0006 0,0000 0,0000 0,0071 0,0000CUSTOMERS 0,3611 0,3781 -0,1162 0,4219
2 tailed-sign 0,0000 0,0000 0,0019 0,0000EMPLOYEES 0,5616 -0,3039 0,68842 tailed-sign 0,0000 0,0000 0,0000
ENVIRONMENT -0,2093 0,69902 tailed-sign 0,0000 0,0000
CONTROVERSIES 0,02052 tailed-sign 0,5843
Spearman Rhodeciles
BUSINESS ETHICS
COMMUNITY SUPPLIERS CORP-GOV CUSTOMERS EMPLOYEES ENVIRONMENT CONTROVERSIES TOTAL RATING

35
Table 9 − Ratings and performance variables (correlation)
deciles
Spearman Rho MVBV RI mva
coefficient -0,083 0,090 -0,076 total rating 2-tailed
sign 0,027 0,016 0,044 coefficient -0,039 0,099 -0,043
business ethics 2-tailed sign 0,302 0,008 0,251
coefficient -0,024 0,230 0,040 community 2-tailed
sign 0,530 0,000 0,290 coefficient 0,114 0,143 0,081
suppliers 2-tailed sign 0,002 0,000 0,032
coefficient -0,045 0,179 0,053 corporate governance 2-tailed
sign 0,228 0,000 0,161 coefficient -0,040 -0,128 -0,070
customers 2-tailed sign 0,289 0,001 0,062
coefficient 0,005 0,051 0,019 employees 2-tailed
sign 0,895 0,171 0,622 coefficient -0,115 0,055 -0,144
environment 2-tailed sign 0,002 0,145 0,000
coefficient 0,015 -0,095 -0,050
deciles
controversies 2-tailed sign 0,692 0,011 0,183
2-tailed 1% sign. 2-tailed 5% sign.