Embed Size (px)
DESCRIPTION
Discusses the Valuation and Characterization of Crude Oils
Citation preview

© 2000, 2001 weMeasureIt inc
Crude Oil Quality Crude Oil Quality
A Composition Based AssessmentA Composition Based Assessment
Presented by Presented by
David GrudoskiDavid Grudoski
PresidentPresident
weMeasureIt Inc.weMeasureIt Inc.

© 2000, 2001 weMeasureIt inc
The Issues in Crude Oil Assessement
"At present, no mechanism exists to capture and manage quality data from each cargo lifted. (Such information would go a long way toward achieving true quality transparency and reducing the quality risk inherent in acquiring foreign crude oil.)
The usual contractual reference to "normal export quality" is not very comforting to refiners who must run what they actually receive, regardless of the expected quality and value. This ultimately results in the value of the foreign barrel being discounted by varying amounts, depending on the refiner's tolerance for quality risk and uncertainty.
In our experience, this discounting is typically greater than the actual quality valuation difference justifies (the unknown is viewed as more costly than the known, all else being equal),and in the long run reduces returns to sellers."
Manage crude oil quality for refining profitability" K.G. Waguespack, Hydrocarbon Processing,Sept.98 Vol. 77 No. 9

© 2000, 2001 weMeasureIt inc
What Determines Crude Oil Value?
The value of a crude oil is ultimately determined by the market value of saleable products derived from the crude.
The saleable products produced are determined by the conversion capabilities of the refinery and operational conditions impacting the refining process
The crude oil best able to meet or exceed the product liftings and target profit margins for the facility is the most valuable.
© 2000, 2001 weMeasureIt inc
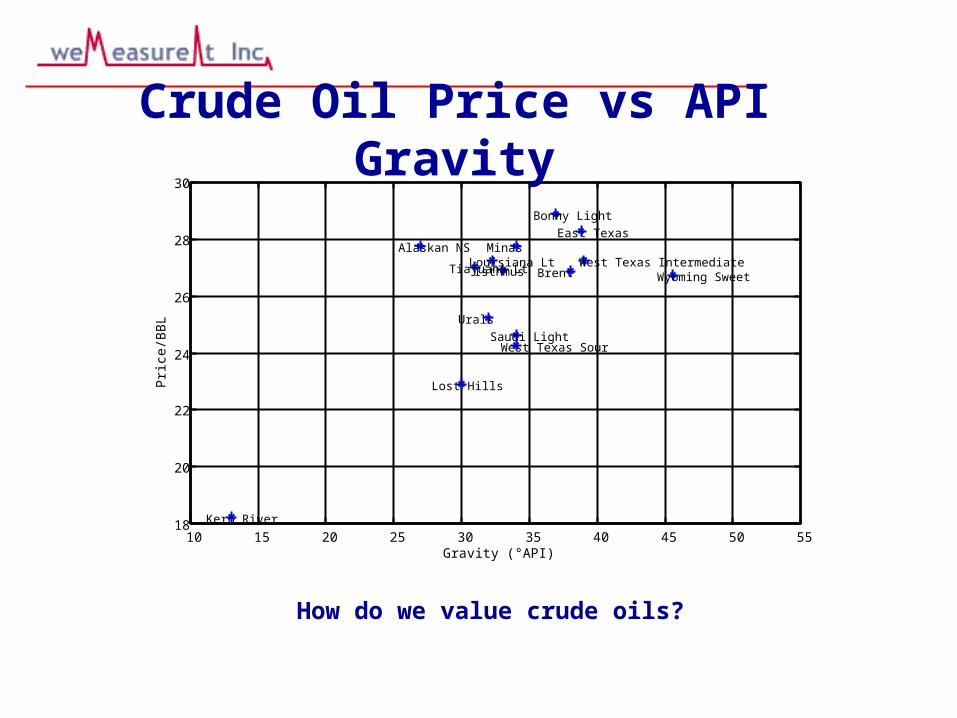
10 15 20 25 30 35 40 45 50 5518
20
22
24
26
28
30
Gravity (°API)
Pric
e/B
BL
Kern River
Alaskan NS
Lost Hills
Tiajuana Lt
Urals
Louisiana Lt Isthmus
West Texas Sour Saudi Light
Minas
Bonny Light
Brent
East Texas
West Texas IntermediateWyoming Sweet
Crude Oil Price vs API Gravity
How do we value crude oils?

© 2000, 2001 weMeasureIt inc
Pour Point vs API Gravity (Whole Crude)
From an assay database of 700 crude
oils
-200
-150
-100
-50
0
50
100
150
0 5 10 15 20 25 30 35 40 45 50 55 60 65 70
Gravity (°API)

© 2000, 2001 weMeasureIt inc
0
1
2
3
4
5
6
7
0 5 10 15 20 25 30 35 40 45 50 55 60 65 70
Gravity (°API)
Sulfur Content vs API Gravity (Whole Crude)
From an assay database of 700 crude oils
30°<=181 Crudes <=35°API1.9%<=29 Crudes <=2.2% Sulfur
16 Crudes meet both criteria16 Crudes meet both criteria

© 2000, 2001 weMeasureIt inc
Crude Oil Price vs Sulfur wt%
How do we value crude oils?
0 0.2 0.4 0.6 0.8 1 1.2 1.4 1.6 1.8 215
20
25
30
Sulfur (Wt%I)
Pric
e/bb
l
Kern River
Alaskan NS
Lost Hills
Tiajuana Lt
Urals
Louisiana Lt Isthmus
West Texas Sour Saudi Light
Minas
Bonny Light
Brent
East Texas
West Texas IntermediateWyoming Sweet
© 2000, 2001 weMeasureIt inc
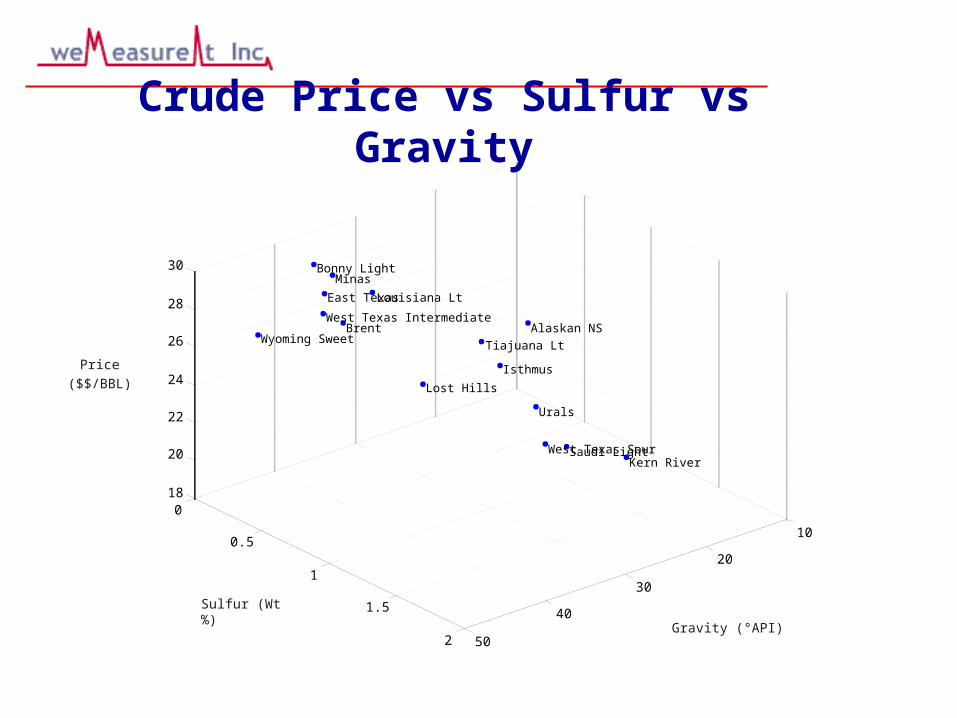
10
20
30
40
50
0
0.5
1
1.5
2
18
20
22
24
26
28
30
Kern River Saudi Light West Texas Sour
Urals
Alaskan NS
Isthmus
Tiajuana Lt
Lost Hills
Louisiana Lt
Brent
Minas
East Texas
West Texas Intermediate
Bonny Light
Wyoming Sweet
Crude Price vs Sulfur vs Gravity
Gravity (°API)
Sulfur (Wt%)
Price
($$/BBL)

© 2000, 2001 weMeasureIt inc
Examples of Crude Oil Yield/Price Variation
<650°F
>650°F
67.2%
32.8%
50.3%
49.7%
West Texas Int. Kern RiverAlaskan North Slope
API
Wt% S
Price
39°
0.3
$27.25
27°
1.1
$27.74
13°
1
$18.25
23.6%
76.4%

© 2000, 2001 weMeasureIt inc
What is Crude Quality
Crude Oil Quality can be simply defined as the agreement of properties and volumetric yields between the contractually tendered crude and the delivered crude.
This quality is generally determined by the Crude Assay. An extensive analysis of the physical and chemical properties of the crude as determined by physical distillation of standard cuts and their characterization by physical and chemical analyses.
In the petroleum industry, price transparency is greatly facilitated by futures exchanges (e.g.,NYMEX, IPE) and price reporting services (e.g., Platts, OPIS, Reuters, etc.), yet no similar mechanism exists for quality.
Because price is tightly linked to quality, the degree of price discovery is ultimately bound by the degree of quality transparency, a fact that is often overlooked by an industry focused on the "paper" side of price risk.

© 2000, 2001 weMeasureIt inc
Crude Reference ID LtGasoline-Gravity, °API LVGO-Gravity, °API AtmResid-Yield, vol % COUNTRY LtGasoline-Mercaptan Sulfur, ppm LVGO-Sulfur, wt % AtmResid-Gravity, °API STATE LtGasoline-Octane Number, Research, Clear LVGO-Nitrogen, ppm AtmResid-Sulfur, wt % CRUDE LVGO-Naphthenes, vol % AtmResid-Nitrogen, ppm Misc. Info LtNap-Gravity, °API LVGO-Paraffins, vol% AtmResid-MCRT, wt % ANALYSIS QUALITY LtNap-Mercaptan Sulfur, ppm LVGO-Pour Point, °F AtmResid-Asphaltenes, wt % (C7 Insolubles) WC-Gravity, °API LtNap-Paraffins vol % LVGO-Acid, mg KOH/g AtmResid-Nickel, ppmWC-Sulfur, Wt % LtNap-Naphthenes, vol % LVGO-Aniline Point, °F AtmResid-Vanadium, ppm WC-Pour Point, °F LtNap-Aromatics, vol % LVGO-Hydrogen, wt % AtmResid-Pour Point, °F WC-Acid, mg KOH/g LtNap-Octane Number, Research, Clear LVGO-Viscosity @ 50 °C (122 °F), cSt AtmResid-Viscosity @ 50 °C (122 °F), cStWC-Viscosity @ 40 °C (104 °F), cSt LVGO-Viscosity @ 100 °C (212 °F), cSt AtmResid-Viscosity @ 100 °C (212 °F), cSt WC-Viscosity @ 50 °C (122 °F), cSt HvyNap-Gravity, °API LVGO-Characterization Factor, K AtmResid-Characterization Factor, K WC-Characterization Factor, K HvyNap-Sulfur, wt % V%Yld-Butanes and Lighter HvyNap-Mercaptan Sulfur, ppm HVGO-Gravity, °API VacResid-Yield, vol % V%Yld-Light Gasoline (55-175 °F) HvyNap-Paraffins vol % HVGO-Sulfur, wt % VacResid-Gravity, °API V%Yld-Light Naphtha (175-300 °F) HvyNap-Naphthenes, vol % HVGO-Nitrogen, ppm VacResid-Sulfur, wt % V%Yld-Heavy Naphtha (300-400 °F) HvyNap-Aromatics, vol % HVGO-Pour Point, °F VacResid-Nitrogen, ppm V%Yld-Kerosene (400-500 °F) HvyNap-Smoke Point, mm (ASTM) HVGO-Acid, mg KOH/g VacResid-Hydrogen, wt %V%Yld-Atm. Gas Oil(500-650 °F) HVGO-Aniline Point, °F VacResid-MCRT, wt % V%Yld-Lt Vacuum Gas Oil (650-800 °F) Jet-Gravity, °API HVGO-Hydrogen, wt % VacResid-Ramsbottom Carbon, wt %V%Yld-Hvy Vacuum Gas Oil (800-1050 °F)Jet-Sulfur, wt % HVGO-Viscosity @ 50 °C (122 °F), cSt VacResid-Asphaltenes, wt % (C7 Insolubles) V%Yld-Vacuum Residuum (1050 °F+) Jet-Mercaptan Sulfur, ppm HVGO-Viscosity @ 100 °C (212 °F), cSt VacResid-Nickel, ppm
Jet-Paraffins vol % HVGO-Characterization Factor, K VacResid-Vanadium, ppm Jet-Naphthenes, vol % VacResid-Iron, ppmJet-Aromatics, vol % VacResid-Pour Point,°F Jet-Freezing Point, °F VacResid-Viscosity @ 50 °C (122 °F), cStJet-Smoke Point, mm (ASTM) VacResid-Viscosity @ 100 °C (212 °F), cSt Jet-Acid, mg KOH/g VacResid-Viscosity @ 135 °C (275 °F), cSt Jet-Viscosity @ 50 °C (122 °F), cSt VacResid-Cutter, vol % in Fuel OilJet-Gravity, °API VacResid-Fuel Oil Yield, vol %
VacResid-Characterization Factor, K AGO-Sulfur, wt % AGO-Nitrogen, ppm AGO-Paraffins, vol%AGO-Naphthenes, vol %AGO-Aromatics, vol%AGO-Acid, mg KOH/gAGO-Pour Point, °F AGO-Viscosity @ 50 °C (122 °F), cStAGO-Cetane Index AGO-Characterization Factor, K
Typical Crude Assay Data
This is the initial information used by Planners to develop operating plans for plants and facilities

© 2000, 2001 weMeasureIt inc
TBP Distillation Curve
Boiling Point (°F)
Yie
ld (
Wt
%) Product Yields
Naphtha/Gasoline
Kero/Jet
Diesel
Atmos Gas Oil
Vacuum Gas Oil
Resid
Distillate Cut Point

© 2000, 2001 weMeasureIt inc
0 200 400 600 800 1000 12000
0.05
0.1
0.15
0.2
0.25
0.3
0.35
0.4
SIMDIS Signature of a Crude Oil
Arabian Lt Crude Oil
Boiling Point (°F)
Yie
ld (
Wt
%)

© 2000, 2001 weMeasureIt inc
0 200 400 600 800 1000 12000
0.05
0.1
0.15
0.2
0.25
0.3
0.35
0.4
A Chromatographic View of Distillate Fractions
Boiling Point (°F)
Yie
ld (
Wt
%)
Naphtha/Gasoline
Kero/Jet
Diesel
Atmos. Gas Oil
Vacuum Gas Oil
Residum
© 2000, 2001 weMeasureIt inc
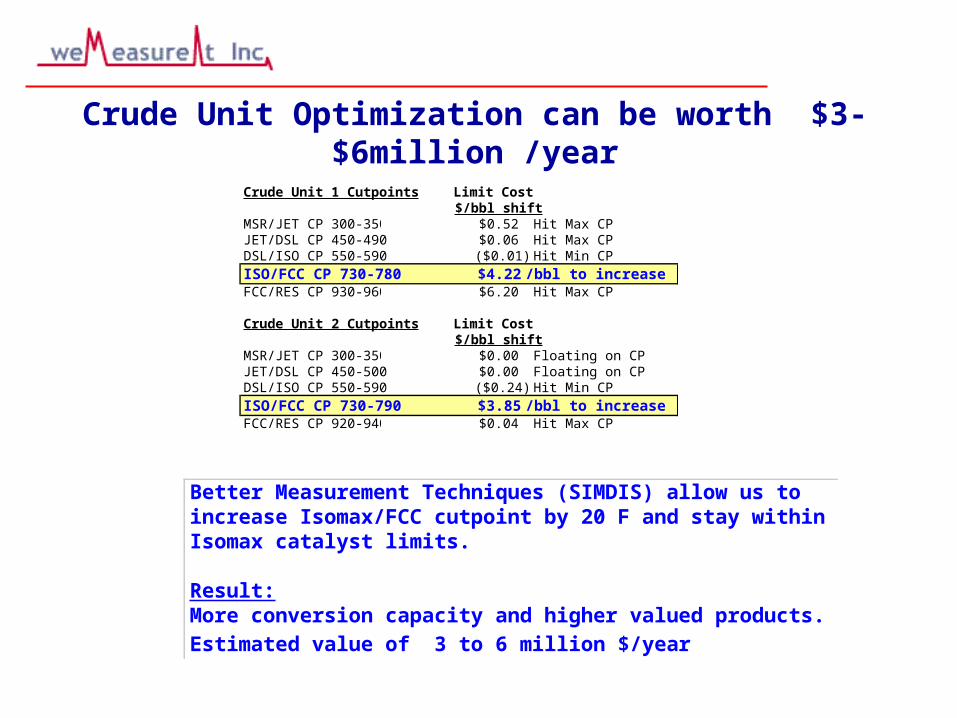
Crude Unit Optimization can be worth $3-$6million /year
Crude Unit 1 Cutpoints Limit Cost$/bbl shift
MSR/JET CP 300-350 $0.52 Hit Max CPJET/DSL CP 450-490 $0.06 Hit Max CPDSL/ISO CP 550-590 ($0.01) Hit Min CP
ISO/FCC CP 730-780 $4.22 /bbl to increaseFCC/RES CP 930-960 $6.20 Hit Max CP
Crude Unit 2 Cutpoints Limit Cost$/bbl shift
MSR/JET CP 300-350 $0.00 Floating on CPJET/DSL CP 450-500 $0.00 Floating on CPDSL/ISO CP 550-590 ($0.24) Hit Min CP
ISO/FCC CP 730-790 $3.85 /bbl to increaseFCC/RES CP 920-940 $0.04 Hit Max CP
Better Measurement Techniques (SIMDIS) allow us toincrease Isomax/FCC cutpoint by 20 F and stay withinIsomax catalyst limits.
Result:More conversion capacity and higher valued products.
Estimated value of 3 to 6 million $/year
© 2000, 2001 weMeasureIt inc
0 200 400 600 800 1000 12000
0.05
0.1
0.15
0.2
0.25
0.3
0.35
0.4
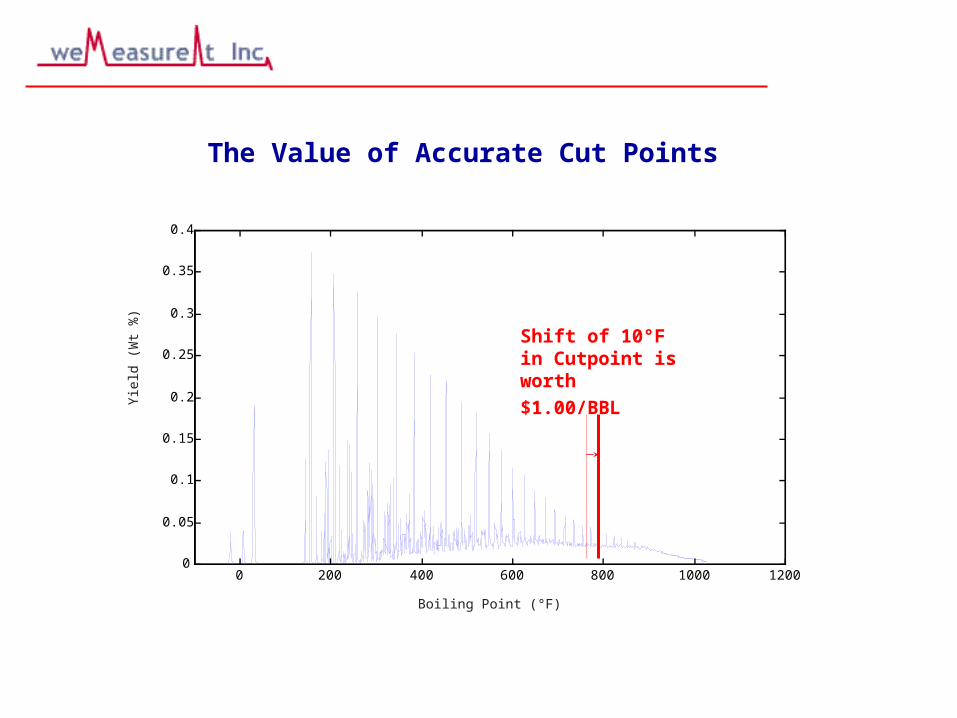
The Value of Accurate Cut Points
Boiling Point (°F)
Yie
ld (
Wt
%)
Shift of 10°F in Cutpoint is worth $1.00/BBL

© 2000, 2001 weMeasureIt inc
New Process Models Assign
Value to Specific Compounds
Molecule DestinationsMogas
Propane ($111.30)Iso Butane ($15.30)
Normal Butane ($2.80)Iso Pentane $16.90
Normal Pentane $12.50Cyclo pentane $24.70
Di-Methyl Butane $25.502 Methyl Pentane $21.003 Methyl Pentane $21.80
Normal hexane $11.70Me- cyclo pentane $20.90
Cyclohexane $19.90Benzene $29.70
C7 Iso Paraffins $19.60C7 Normal Paraffin $8.60
C7 Naphthenes $19.30Toluene $32.40
C8 Iso Paraffins $16.10C8 Normal Paraffin $7.70
C8 Naphthenes $17.80C8 Aromatics $32.80

© 2000, 2001 weMeasureIt inc
The Value of Compositional Measurements
Molecular transformations have differential values
Dimethyl-butane
Cyclohexane
Process DestinationMogas Blend Pool
Aromatics Conversion
$25 /Bbl $16 /Bbl
$30 /Bbl $35 /Bbl

© 2000, 2001 weMeasureIt inc
Carbon/Hydrogen Measurements
When properly configured the GC-AED provides a direct measure of the C/H ratio of petroleum streams
0 200 400 600 800 10000
0.005
0.01
0.015
0.02
0.025
BP (°F)
Ele
me
nt R
ela
tive
Res
po
nse
CH Adjusted Response Curves
Carbon Hydrogen Elemental Signature -Heavy Gas Oil
Total CHCarbonHydrogen
400 600 800 10000
10
20
30
40
50
60
70
80
90
100
BP (°F)
Cum
ulat
ive
Yie
ld W
t%
CH SIMDIS for Heavy Gas Oil
Total CHCarbonHydrogen

© 2000, 2001 weMeasureIt inc
Metals in FCC Feed
Ni and V in FCC FeedDetermined by HT-GC-AED
400 500 600 700 800 900 1000 1100 1200 1300 14000
5
10
15
20
25
30
BP (°F)
Richmond Refinery FCC Total Feed 3/29/99
C179S181
V292Ni301
400 500 600 700 800 900 1000 1100 1200 1300 14000
0.05
0.1
0.15
0.2
0.25
0.3
0.35
BP (°F)
4 ppm Total Ni
High Temperature AED Signatures for C,S,Ni,V
400 500 600 700 800 900 1000 1100 1200 1300 14000
5
10
15
20
25
30
BP (°F)
Richmond Refinery FCC Total Feed 3/29/99
C179S181
V292Ni301
400 500 600 700 800 900 1000 1100 1200 1300 14000
0.05
0.1
0.15
0.2
0.25
0.3
0.35
BP (°F)
4 ppm Total Ni
High Temperature AED Signatures for C,S,Ni,V

© 2000, 2001 weMeasureIt inc
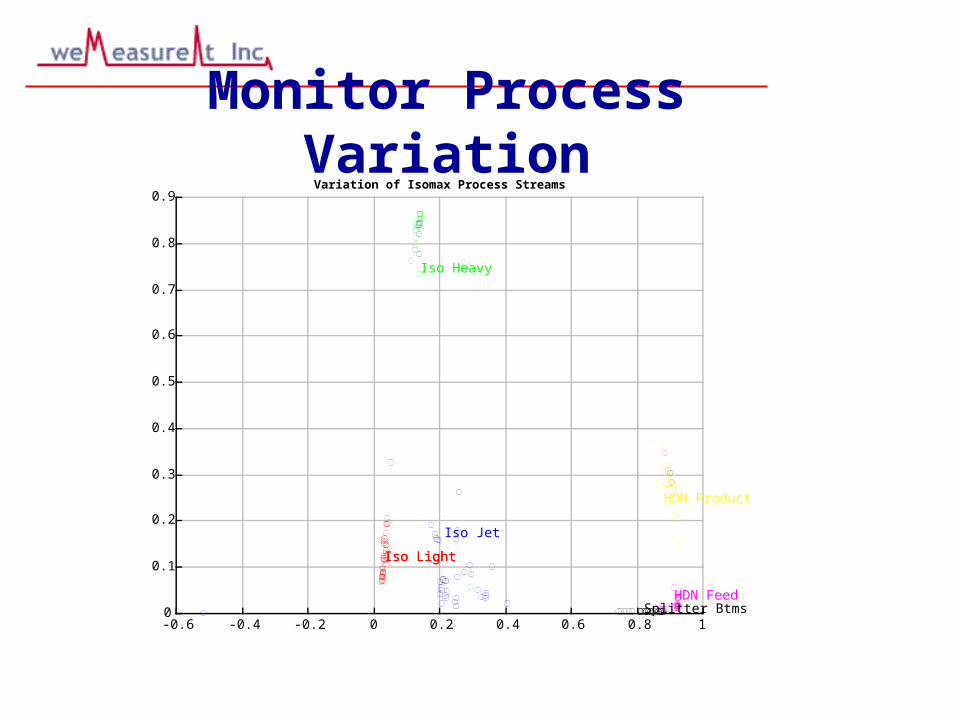
Process Variation
QuickTime™ and aVideo decompressor
are needed to see this picture.
© 2000, 2001 weMeasureIt inc
-0.6 -0.4 -0.2 0 0.2 0.4 0.6 0.8 10
0.1
0.2
0.3
0.4
0.5
0.6
0.7
0.8
0.9
HDN Feed
HDN Product
Splitter Btms
Iso Jet
Variation of Isomax Process Streams
Iso Heavy
Iso LightIso Light
Monitor Process Variation

© 2000, 2001 weMeasureIt inc
0 500 1000 15000
0.1
0.2
0.3
0.4
0.5
0.6
0.7
0.8
0.9
1 HDN Prd 6/11 Target: HDN Prd 6/11
HDN Prd 5/14 Distance=6.2708°
HDN Prd 4/30 Distance=6.8198°
HDN Prd 6/4 Distance=7.2625°
HDN Prd 5/7 Distance=7.2798°
Monitor Process Variation

© 2000, 2001 weMeasureIt inc
0 500 1000 15000
0.1
0.2
0.3
0.4
0.5
0.6
0.7
0.8
0.9
1FCC HCO Source: FCC HCO
FCC HCO
FCC HCO
FCC HCO
FCC HCO
Fingerprinting

© 2000, 2001 weMeasureIt inc
ARAB EXTRA LIGHT
ARABIAN MEDIUM
ARABIAN HEAVY
Crude Oil Signature
Here we show Carbon and Sulfur SIMDIS signatures as an archival record of the composition of crude oil (GC-AED Methodology)

© 2000, 2001 weMeasureIt inc
Crude Oil Characterization
Carbon and Sulfur Distributions in Crude Oils
0 200 400 600 800 10000
100
200
300
0 200 400 600 800 10000
20
40
60
80
0 200 400 600 800 10000
100
200
0 200 400 600 800 10000
10
20
30
0 200 400 600 800 10000
200
400
0 200 400 600 800 10000
50
100
150
Crude A (Asian) Crude B (Mid-East)Crude C (South American)

© 2000, 2001 weMeasureIt inc
WEST TEXAS EUGENE ISLAND MIRI LIGHT KUWAIT EXP GREEN CANYON
ALASKAN NORTH SLOPE BRUNEI VENTURA PIPELINE LAGO TRECO ALASKAN NORTH SLOPE
NIGERIAN MEDIUM NIGERIAN HEAVY WEST TEXASWEST TEXAS INTERMEDIATEAMOCO PIPELINE
KUTUBU EXPORT BLENDPALANCA EXPORT RIO NEGRO SOUDIE WEST LINAPAKAN
KUWAITI ORITO CAAMAR ARCO PIPELINE 63 BEAR RIVER BLEND
CANADON SECO ESCRAVOZ OMAN LENNOX URALS EXPORT
Crude Oil Signatures
Reference Crude Oil Library

© 2000, 2001 weMeasureIt inc
0 500 1000 15000
0.1
0.2
0.3
0.4
0.5
0.6
0.7
0.8
0.9
1KUWAITI Target: KUWAITI
ARABIAN HEAVY Distance=4.8828°
ARABIAN MEDIUM Distance=4.9904°
KUWAIT EXP Distance=5.1902°
IRANIAN LIGHT Distance=5.5716°
Crude Oil Fingerprinting

© 2000, 2001 weMeasureIt inc
A B C D E F G H I J
A
B
C
D
E
F
G
H
I
J
2D Map of the Sample Universe2D Map of the Sample Universe
This plot presents a visualization in a 2D mathematical space of the chromatographic profiles for 1650 samples

© 2000, 2001 weMeasureIt inc
A B C D E F G H I J
A
B
C
D
E
F
G
H
I
J
2D Map of the Sample Universe (n=1650)
Source: KUWAIT EXP
4.4° ARABIAN MEDIUM
5.2° KUWAITI
5.2° IRANIAN LIGHT
6.1° KUWAITI
Identification and Extraction of Similar Samples-Identification and Extraction of Similar Samples-Crude OilsCrude Oils
Here we show the utility of our approach to automatically extract the samples from the data base having the greatest similarity to the source sample

© 2000, 2001 weMeasureIt inc
A B C D E F G H I J
A
B
C
D
E
F
G
H
I
J
2D Map of the Sample Universe (n=1650)
Source: HvyHeart2/12
7.6° HvyHeart2/26
8° HvyHeart2/19
8.5° HvyHeart 3/3
10° HvyHeart Cut
Identification and Extraction of Similar Samples-Identification and Extraction of Similar Samples-NaphthasNaphthas
Here we show the utility of our approach to automatically extract the samples from the data base having the greatest similarity to the source sample

© 2000, 2001 weMeasureIt inc
Thanksfor the
Opportunity