Embed Size (px)
Citation preview
Louisiana State UniversityLSU Digital Commons
LSU Historical Dissertations and Theses Graduate School
1986
The Effects of Alcohols and Crude OilComposition on the Performance andMechanisms of Alkaline Flooding of OilReservoirs.Mohamed Amine DahmaniLouisiana State University and Agricultural & Mechanical College
Follow this and additional works at: https://digitalcommons.lsu.edu/gradschool_disstheses
This Dissertation is brought to you for free and open access by the Graduate School at LSU Digital Commons. It has been accepted for inclusion inLSU Historical Dissertations and Theses by an authorized administrator of LSU Digital Commons. For more information, please [email protected].
Recommended CitationDahmani, Mohamed Amine, "The Effects of Alcohols and Crude Oil Composition on the Performance and Mechanisms of AlkalineFlooding of Oil Reservoirs." (1986). LSU Historical Dissertations and Theses. 4293.https://digitalcommons.lsu.edu/gradschool_disstheses/4293
INFORMATION TO USERS
While the most advanced technology has been used to photograph and reproduce this manuscript, the quality of the reproduction is heavily dependent upon the quality of the material submitted. For example:
• Manuscript pages may have indistinct print. In such cases, the best available copy has been filmed.
• Manuscripts may not always be complete. In such cases, a note will indicate that it is not possible to obtain missing pages.
• Copyrighted material may have been removed from the manuscript. In such cases, a note will indicate the deletion.
Oversize materials (e.g., maps, drawings, and charts) are photographed by sectioning the original, beginning at the upper left-hand corner and continuing from left to right in equal sections with small overlaps. Each oversize page is also filmed as one exposure and is available, for an additional charge, as a standard 35mm slide or as a 17”x 23” black and white photographic print.
Most photographs reproduce acceptably on positive microfilm or microfiche but lack the clarity on xerographic copies made from the microfilm. For an additional charge, 3omm slides of 6”x 9” black and white photographic prints are available for any photographs or illustrations that cannot be reproduced satisfactorily by xerography.
Reproduced with permission of the copyright owner. Further reproduction prohibited without permission.

Reproduced with permission of the copyright owner. Further reproduction prohibited without permission.
8710556
D ahm ani, M oham ed Am ine
THE EFFECTS OF ALCOHOLS AND CRUDE OIL COMPOSITION ON THE PERFORMANCE AND MECHANISMS OF ALKALINE FLOODING OF OIL RESERVOIRS
The Louisiana State University and Agricultural and Mechanical Col. Ph.D. 1986
UniversityMicrofilms
International 300 N. Zeeb Road, Ann Arbor, Ml 48106
Copyright 1987
by
Dahmani, Mohamed Amine
All Rights Reserved
Reproduced with permission of the copyright owner. Further reproduction prohibited without permission.

Reproduced with permission of the copyright owner. Further reproduction prohibited without permission.

PLEASE NOTE:
In all cases this material has been filmed in the best possible way from the available copy. Problems encountered with this document have been identified here with a check mark V .
1. Glossy photographs or pages______
2. Colored illustrations, paper or print_______
3. Photographs with dark background. _ /
4. Illustrations are poor copy_______
5. Pages with black marks, not original copy______
6. Print shows through as there is text on both sides of p a g e _______
7. Indistinct, broken or small print on several pages. ✓
8. Print exceeds margin requirements______
9. Tightly bound copy with print lost in spine_______
10. Computer printout pages with indistinct print_______
11. Page(s)_____________ lacking when material received, and not available from school or, author.j12. Page(s)_____________ seem tc be missing in numbering only as text follows.
13. Two pages num bered . Text follows.
14. Curling and wrinkled pages_______
15. Dissertation contains pages with print at a slant, filmed as received i / *
16. Other____________________________________________________________________________
UniversityMicrofilms
International
Reproduced with permission of the copyright owner. Further reproduction prohibited without permission.

Reproduced with permission of the copyright owner. Further reproduction prohibited without permission.
THE EFFECTS OF ALCOHOLS AND CRUDE OIL COMPOSITION ON THE PERFORMANCE
AND MECHANISMS OF ALKALINE FLOODING OF OIL RESERVOIRS
A DissertationSubmitted to the Graduate Faculty o-f the
Louisiana State University and Agricultural and Mechanical College
in partial -Fulfillment of the requirements for the degree of
Doctor of Philosophyin
The Department of Petroleum Engineering
byMohamed Amine Dahmani
B.S., Louisiana State University, 1981 M.S., Louisiana State University, 1983
December, 1986
Reproduced with permission of the copyright owner. Further reproduction prohibited without permission.

©1987
MOHAMED AMINE DAHMANI
All Rights Reserved
Reproduced with permission of the copyright owner. Further reproduction prohibited without permission.
ACKNOWLEDGEMENTS
The author is gratefully indebted to Dr. W. David Constant, Assistant Professor of Petroleum Engineering, at Louisiana State University, under whose guidance and supervision this work was completed.
Sincere thanks are also extended to Dr. Joanne W. Wolcott, Research Associate of the Petroleum Engineering Department for her suggestions and assistance in the preparation of this work. Comments and suggestions from other committee members, Drs. Zaki Bassiouni, A. T.Bourgoyne, T. Monger, V. P. Singh, and D. J. Henry, and from the rest of the faculty members of the Petroleum Engineering Department are gratefully acknowledged. I extend my gratitude to Dr. Zaki Bassiouni, Chairman of the Petroleum Engineering Department, for his encouragements throughout my studies at Louisiana State University. Due thanks are also extended to Vivien J. Cambridge, graduate student, for his col laboration.
Financial assistance from the Petroleum Engineering Department while the author was in graduate school at Louisiana State University made this study possible.
The author dedicates this work to his parents whose constant encouragement and support helped him to pursue his education.
Reproduced with permission of the copyright owner. Further reproduction prohibited without permission.
TABLE OF CONTENTS
PageACKNOWLEDGEMENTS iiLIST OF TABLES viiLIST OF FIGURES xLIST OF SLIDES xivABSTRACT xvi
CHAPTERI Introduction 1
II Literature Survey 42.1 Caustic Flooding 42.1.1 Process of Caustic Flooding 42.1.2 Field Operations 62.1.3 Displacement Mechanisms 9
1. Wettability Alteration 14A. Reversal o-f Rock Wettability
■from Water— Wet to Oil-Wet 14C. Reversal of Rock Wettability from
Oil-Wet to Water— Wet 14D. Water— Wet, Oil-Wet, Water-Wet
Wettability Changes 182. Emulsification and Entrainment 203. Emulsification and Swelling of the
Oil Phase 214. Emulsification and Entrapment 215. Emulsification and Coalescence of
Oil Droplets 22h. Solubilization of Rigid Films 22
2.1.4 Factors Affecting Caustic Flooding Performance 23
1. Rock Type 23
iii
Reproduced with permission of the copyright owner. Further reproduction prohibited without permission.
2. Type of Alkali 263. Connate Water Composition 294. Crude Oil Properties 305. Caustic Concentration 326. Temperature 32
2.2 Interfacial Activity in Crude Oil/BrineSystems 33
2.2.1 Chemistry of Interfacial Activity 332.2.2 Interfacial Behavior Models 402.3 Emulsion Characteristics of Crude
Oi1/A1kali Systems 452.4 Visual Observation of Flow of Fluids
in Porous Media 462.5 Effect of Alcohols on Flow Behavior 492.6 Hydrocarbon Oxidation 532.7 Conclusions from the Literature Survey 58
III Experimental Approach 643.1 Introduction 643.2 Experimental Apparatus and Procedures 663.2.1 Interfacial Tension Measurements 663.2.2 Flow Behavior Analysis in Flow Cells 69
1. Description of the Cells 692. Preparation and Utilization of the Cells 723. Microphotographic Analysis of Flow 76
Behavior3.2.3 Recovery Efficiency Experiments 77
1. Core Characteristics 772. Flooding Procedure 81
3.2.4 Oxidation of Crude Oil 843.2.5 Fractionation of the Crude Oil 863.3 Analytical Methods 883.3.1 Determination of Crude Oil Properties 88
iv
Reproduced with permission of the copyright owner. Further reproduction prohibited without permission.
3.3.2 Description of Chemicals 913.3.3 Preparation of the Aqueous Solutions 913.3.4 Reactivity of Cryolite to NaOH Solutions 933.3.5 Caustic Consumption of the Ottawa Sand 93
IV Analysis of Results 954.1 Effect of Alcohols on Alkaline Flooding 954.1.1 Effect of Alcohols on Interfacial Tension 96
1. Effect of NaOH and NaCl Concentrationson IFT of MG3 and Tullos Oils 98
2. Effect of Alcohols on IFT at Low NaOHand NaCl Concentrations 102A. Effect of Water Miscible Alcohols
Methanol, Ethanol, IPA, 1-Propanol 105B. Effect of t-Butanol 114C. Effect of 1-Butanol 117D. Comparison of the Effects of
1-Butanol and t-Butanol 120E. Effect of 1-Pentanol 123F. Effect of 2-Methyl-1—Butanol 123G. Effect of 3-Pentanol 127H. Comparison of the Effects of
Alcohols of Different Solubilities 1273. Effect of Alcohols on MG3 Oil IFT at
High NaCl (50,000 ppm) and NaOH(0.5% by Wt.) Concentrations 130A. Effect of Water Miscible Alcohols 130B. Effect of 1-Butanol 130C. Effect of 1-Pentanol :
Solubility = 2 . 7 g/100 g of Water 135D. Effect of Ethanol and 1-Pentanol
on IFT for Tullos Oil 1354. Summary of the IFT Results 138
4.1.2 Effect of Alcohols on Flow Mechanismsand Recovery Efficiency 140
1. Introduction 1402. Flow Behavior During Caustic Flooding 142
A. Analysis of a Plain Waterflood 142B. Mechanisms of Caustic Flooding
Observed 142
v
Reproduced with permission of the copyright owner. Further reproduction prohibited without permission.
a. Emulsification and Entrainment Mechanism 142
b. Emulsification and Coalescence Mechanism 145
c. Emulsification and Entrapment Mechanism 145
d. Interfacial Tension Reduction Mechanism 148
3. Comparison of A1cohol-Augmented Alkaline Floods vs. Plain Alkaline Floods 148
4. Summary of the Flow Cell and Coreflood Studies 1624.2 Effect of Crude Oil Composition on Flow
Behavior 1644.3 Oxidation Studies 173
V Conclusions and Recommendations 1785.1 Conclusions 1785.2 Recommendations 181
REFERENCES 183APPENDICES 193
A 194B 225
VITA 233
vi
Reproduced with permission of the copyright owner. Further reproduction prohibited without permission.

LIST OF TABLES
TABLE Page2.1 Documented Known Field Tests of Alkali Floods 72.2 Comparison of Alkali 272.3 Constituents of Oil that May Be Interfacially
Active 3B2.4 Constituents of Oil Present in Film-Forming
Material 392.5 Acid Numbers of Crude Oils Oxidized with
Limited Air Injection 603.1 Properties of the Acidic Crude Oils 893.2 Properties of the Non-Acidic Crudes 904.1 Properties of the Alcohols Studied 974.2 Sandpack Flood Recovery Results 1564.3 Physical and Chemical Properties of MG3
and Tullos Oils 1664.4 Flow Behavior of Crude Oil Fractions 1724.5 A Comparison of Oxidized and Unoxidized Crudes 1754.6 Recovery Efficiency Results 176A.1 Effect of NaOH Concentration on the Tullos
Oil/Caustic Water IFT 196A.2 Effect of NaOH Concentration on MG3
Oil/Caustic Water IFT 197A.3 Effect of NaCl Concentration on IFT for MG3 Oil 198A.4 Effect of NaCl Concentration on IFT for Tullos Oil 199A.5 Effect of Methanol on MG3 Oil/Caustic Water IFT 200A.6 Effect of Methanol on Tullos Oil/Caustic Water IFT 201A.7 Effect of Ethanol on MG3 Oil/Caustic Water IFT 202
vii
Reproduced with permission of the copyright owner. Further reproduction prohibited without permission.
A. 8 A. 9 A. 10 A. 11 A. 12
A. 13 A. 14
A. 15 A. 16
A. 17
A. 18
A. 19 A. 20
A.21
A. 22 A. 23
A. 24
A. 25
A. 26
A. 27
Effect of Ethanol on Tullos Oil/Caustic Water IFTEffect of IPA on MG3 Oil/Caustic Water IFTEffect of IPA on Tul1os/Caustic Water IFTEffect of 1-Propanol on MG3 Oil/Caustic Water IFTEffect of 1-Propanol on Tullos Oil/Caustic Water IFTEffect of t-Butanol on MG3 Oil/Caustic Water IFTEffect of t-Butanol on Tullos Oil/Caustic Water IFTEffect of 1-Butanol on MG3 Oil/Caustic Water IFTEffect of 1-Butanol on Tullos Oil/Caustic Water IFTComparison of the Effects of 1-Butanol and t-Butanol on MG3 Oil/Caustic Water IFTComparison of the Effects of 1-Butanol and t-Butanol on Tullos Oil/Caustic Water IFTEffect of 1-Pentanol on MG3 Oil/Caustic Water IFTEffect of 1-Pentanol on Tullos Oil/Caustic Water IFTEffect of 2-Methyl-1-Butanol on MG3 Oil/Caustic Water IFTEffect of 3-Pentanol on MG3 Oil/Caustic Water IFTComparison of the Effects of Alcohols of Different Solubilities on MG3 Oil/Caustic Water IFTEffect of Methanol on MG3 Oil/Caustic Water IFT at High NaOH and NaCl ConcentrationsEffect of Ethanol on MG3 Oil/Caustic Water IFT at High NaOH and NaCl ConcentrationsEffect of IPA on MG3 Oil/Caustic Water IFT at High NaOH and NaCl ConcentrationsEffect of 1-Butanol on MG3 Oil/Caustic Water IFT at High NaOH and NaCl Concentrations
viii
203204205206
207208
209210
211
212
213214
215
216217
218
219
220
221
222
Reproduced with permission of the copyright owner. Further reproduction prohibited without permission.
A. 28 Effect of 1-Pentanol on M63 Oil /Caustic Water IFT at High NaOH and NaCl Concentrations
A.29 Effect of Ethanol and 1-Pentanol on Tullos Oil/Caustic Water IFT at High NaOH and NaCl Concentrations
ix
Reproduced with permission of the copyright owner. Further reproduction prohibited without permission.
223
224
LIST OF FIGURES
FIGURE Page2.1 Process of Alkaline Flooding 52.2 Effect of Flood Water pH on Recovery of Crude
Oil by Alkaline Waterflooding 152.3 Effect of Flood Water Salinity on Recovery
of Crude Oil by Alkaline Waterflooding 162.4 Effect of Temperature on Rate of Consumption
of Base from Alkaline Water by Formation Solids 172.5 Mechanism of Trapped Oil Removal by Reverse
Wetting 192.6 Change of Interfacial Activity of Petroleum
Acids by Reaction with Diazomethane at -50 C 352.7 Sketches of Low Capillary Number Trapping
Mechanisms and Configuration of ResidualOil in Pore Doublets 4S
2.8 Electolyte-Alcohol Interaction of Phase Behaviorof a Surfactant System 51
2.9 Schematic Diagram of Oil-in-Water (0/W) andWater— in-Oil <W/0) Microemulsions. The Small Molecules Shown Are the Co-surfactant 52
2.10 Illustration of an Activity Map 542.11 Effects of Pressure, Temperature, Air Flowrate,
and Oxidation Time on Acid Number 562.12 Acid Number vs. Pressure 572.13 Acid Number vs. Time 592.14 Effect of Acid Number on IFT Behavior 613.1 Schematic of Spinning-Drop Apparatus 673.2 Schematic of Rotor Assembly 673.3 Schematic of the Flow Cells 703.4 Syringe Pump 73
x
Reproduced with permission of the copyright owner. Further reproduction prohibited without permission.
3.5 Representation of the Flow Parameters of Darcy's Equation for Dipping Reservoirs
3.6 Flooding Apparatus3.7 Oxidation Apparatus4.1 Effect of NaOH Concentration on the Tullos
Oil/Caustic Water IFT4.2 Effect of NaOH Concentration on the MG3
Oil/Caustic Water IFT4.3 Effect Of NaCl Concentration on IFT for MG3 Oil4.4 Effect of NaCl Concentration on IFT for
Tullos Oil4.5 Effect of Methanol on MG3 Oil/Caustic Water IFT4.6 Effect of Methanol on Tullos Oil/Caustic
Water IFT4.7 Effect of Ethanol on MG3 Oil/Caustic Water IFT4.8 Effect of Ethanol on Tullos Oil/Caustic
Water IFT4.9 Effect of IPA on MG3•Oi1/Caustic Water IFT4.10 Effect of IPA on Tullos Oil/Caustic
Water IFT4.11 Effect of 1-Propanol on MG3 Oil/Caustic
Water IFT4.12 Effect of 1-Propanol on Tullos Oil/Caustic
Water IFT4.13 Effect of t-Butanol on MG3 Oil/Caustic
Water IFT4.14 Effect of t-Butanol on Tullos Oil/Caustic
Water IFT4.15 Effect of 1-Butanol on MG3 Oil/Caustic
Water IFT
Reproduced with permission of the copyright owner. Further reproduction prohibited without permission.
4. 16
4.17
4.18
4.19
4.20
4.21
4.22
4.23
4.24
4.25
4.26
4.27
4.28
4.29
4.304.314.32
Effect of 1-Butanol on Tullos Oil /Caustic Water IFTComparison of the Effects of 1-Butanol and t-Butanol on MG3 Oil/Caustic Water IFTComparison of the Effects of 1-But.anoland t-Butanol on Tullos Oil/Caustic Water IFTEffect of 1-Pentanol on MG3 Oil/Caustic Water IFTEffect of 1-Pentanol on Tullos Oil/Caustic Water IFTEffect of 2-Methyl-1-Butanol on MG3 Oil/Caustic Water IFTEffect of 3-Pentanol on MG3 Oil/Caustic Water IFTComparison of the Effects of Alcohols of Different Solubilities on MG3 Oil/Caustic Water IFTEffect of Methanol on MG3 Oil/Caustic Water IFT at High NaOH and NaCl ConcentrationsEffect of Ethanol on MG3 Oil/Caustic Water IFT at High NaOH and NaCl ConcentrationsEffect of IPA on MG3 Oil/Caustic Water IFT at High NaOH and NaCl ConcentrationsEffect of 1-Butanol on MG3 Oil/Caustic Water IFT at High NaOH and NaCl ConcentrationsEffect of 1-Pentanol on MG3 Oil/Caustic Water IFT at High NaOH and NaCl ConcentrationsEffect of Ethanol and 1-Pentanol on Tullos Oil/Caustic Water IFT at High NaOH and NaCl ConcentrationsIllustration of the Water— Wet Nature of CryoliteAnalysis of a Plain WaterfloodOil Drop Being Contacted by a Caustic Solution
xii
119
121
122
124
125
126
128
129
131
132
133
134
136
137 143143144
Reproduced with permission of the copyright owner. Further reproduction prohibited without permission.
4.33
4.344.354.364.374.38
4.39
4.40
4.41
Oil Drop after Spontaneous Emulsification by the Caustic SolutionEmulsification and Coalescence Mechanism Oil Droplet in Emulsion Entering a Pore Oil Droplet Reentrapped in Pore Oil Drop Stuck in PoreReleased Oil Droplet Through IFT Reduction MechanismOil Bank Formed During Alkaline Flood (Dark Water— in-Oil Emulsions)Oil Bank Dispersed because the Water— in-Oil Emulsions Were too ViscousFlash Photograph of a Drop of Water in Toluene Containing 14V. Ethanol and Saturated with Water (Spontaneous Emulsification)
144146147 149 149
149
151
151
153
xiii
Reproduced with permission of the copyright owner. Further reproduction prohibited without permission.
LIST OF SLIDES
SLIDE1.23-56-8
9-15
16-22
23-25
26-28
29-31
32-35
36,37
38-4041-43
44-49
50-53
54-59
60
Water— Wet Nature of CryoliteAnalysis of a Plain WaterfloodEmulsification and Entrainment of an Oil DropletIllustration of the Emulsification and Coalescence MechanismIllustration of the Emulsification and Entrapment MechanismOil Bank Dispersion During a Plain Alkaline FloodOil Bank Formation during an Alcohol- Augmented FloodEmulsions Obtained with Alcohol- Augmented FloodsEmulsion Obtained with Alcohol- Augmented Flood (Observed in a Pore)Trapped Viscous Emulsions Obtained with the Addition of 1-Pentanol and 2-Methyl-1—ButanolPlain Alkaline Flood Observed in SandpackEmulsions Left Behind During Plain Alkaline Flood in Sandpack1-Pentanol-Augmented Alkaline Flood Observed in SandpackFlow Behavior of Tullos Oil in Thin Flow Cells (10,000 ppm and 500 ppm NaCl)Flow Behavior of Tullos Oil in Thin Flow Cells (400 ppm NaCl)Plain Alkaline Flood of Tullos Oil in Sandpacks at 10,000 ppm NaCl
xiv
Page227227
227
227
228
228
228
228
229
229229
229
230
230
230
230
Reproduced with permission of the copyright owner. Further reproduction prohibited without permission.
61-65 Emulsion Behavior of Fractions A and Bin Thin Flow Cells
66-72 Emulsion Behavior of Fraction C,D and Ein Thin Flow Cells
73,74 Emulsion Behavior of Tullos A+E Fraction75,76 Emulsion Behavior of MG3 A+E Fraction77,78 Emulsion Behavior of Fraction A of
Tullos + Fraction E of MS379,80 Emulsion Behavior of Fraction A of
MG3 + Fraction E of Tullos81-84 Emulsion Behavior of the Mixture of
Fractions A, B and E of Tullos
231
231231232
232
232
232
xv
Reproduced with permission of the copyright owner. Further reproduction prohibited without permission.

ABSTRACT
Alkaline -Flooding -For enhanced oil recovery Mas investigated and methods Mere developed to increase the efficiency and predictability of the process. The problems associated with current alkaline flooding technology were addressed in three Mays. The effect of alcohol additives on alkaline flooding Mas studied since alcohols have benefited related surfactant procedures. Crude oil composition Mas correlated with flood behavior to provide better predictions of alkaline flood performance. Finally, alkaline flood recovery efficiencies of oxidized crudes were measured to determine the benefits of in-situ air oxidation.
The alkaline flooding process was studied through the use of interfacial tension measurements, microscopic examination of floods in thin flow cells, and sandpack floods. Five acidic crudes and four low acidity crudes were investigated.
Alcohol additives were found to significantly improve the alkaline recovery of certain crudes. The improvement in flood performance was found to increase with increasing water solubility of the alcohol. Water miscible alcohols had little effect on the crude oil/water interfacial tension; whereas less soluble alcohols exhibited a high crude
xvi
Reproduced with permission of the copyright owner. Further reproduction prohibited without permission.
oil/water inter-facial tension which was detrimental to oil recovery. Recovery also depended on the emulsion behavior of the crude. Crudes which did not readily emulsify on contact with alkaline water did not show more - efficient recovery with alcohol.
Microscopic studies of alcohol-augmented alkaline floods showed that alcohols destabilized emulsions thereby improving oil drop coalescence which aided the formation of an oil bank. Alcohols also reduced the viscosity of emulsions which resulted in improved sweep efficiency.
Two acidic crudes (Tullos and MG3) which represented the extremes in emulsion behavior were fractionated by ion exchange chromatography and analyzed for chemical composition. The interaction of the fractions with alkaline water was observed in thin flow cells. Only carboxylic acid fractions formed emulsions. However, phenolic fractions curtailed this emulsification. Emulsification behavior was attributed to changes in the crude oil/water interfacial viscosity.
Finally, sandpack floods showed that one oxidized oil yielded 10% higher recovery than the unoxidized oil. It was concluded that air oxidation of the crude yielded surface active material capable of improving oil recovery by alkaline flooding.
xvii
Reproduced with permission of the copyright owner. Further reproduction prohibited without permission.
CHAPTER I
INTRODUCTION
The total production of oil from a reservoir by primary and secondary methods usually does not exceed 40 percent of the original oil in place. Enhanced oil recovery (EQR) procedures are used to extract additional oil from reservoirs that have been depleted using conventional methods of production. After the sharp increase in the price of oil in the last decade, a renewed interest in enhanced oil recovery has been noted. Even with the recent decline in oil prices, the less expensive EOR procedures have been found to be cheaper than geological exploration. Many processes were developed for enhanced oil recovery and are usually classified as either thermal or nan- thermal .
The thermal processes include cyclic steam injection, steam drive and in-situ combustion. In addition to fluid drive, the heat generated by these processes reduces the viscosity of the oil. Also, the thermal expansion of the oil results in an increase of the oil effective permeability.
1
Reproduced with permission of the copyright owner. Further reproduction prohibited without permission.
2
The non-thermal processes include both miscible displacement processes and chemical processes. Misciblehydrocarbon displacement, carbon dioxide injection and inert gas injection are the major miscible displacement processes; whereas polymer -flooding, surfactant-polymer injection and caustic flooding are the major chemical processes.
Caustic flooding is an economically attractive process due to the low cost and availability of caustic material. The major parameter that affects the success of a caustic flood is the capillary number^, generally defined as the ratio of viscous forces to capillary farces. In mostwaterfloods the capillary number is about 10 6 . If this
-4 -2number can be increased to the range of 10 to 10 bylowering the interfacial tension between oil and brine, significant incremental recovery could result. It has been shown that interfacial tension can be lowered if sufficient surface active agents (soaps) are available at the oil-brine interface. These soaps can be generated in-situ by the reaction of naturally occuring organic acids, mainly carboxylic acids, with caustic material.
Field tests have demonstrated that the process of caustic flooding is technically feasible; however, oil recovery efficiencies have varied widely. The mechanisms of this process need to be further understood in order for it to become a viable technique for enhanced oil recovery. One area for improvement is the optimization of the alkaline
Reproduced with permission of the copyright owner. Further reproduction prohibited without permission.
3
water/crude oil interactions. Co-surfactants have been found to optimize surfactant/crude systems. Co-surfactants may also prove beneficial to alkaline flooding. The primary objective of this study is to determine the effects of certain alcohols on interfacial tension, flow mechanisms and recovery efficiency by caustic injection.
Another area for improvement is in developing screening tests for determining the potential of different crude oils for alkaline flooding applications. To meet this objective, two crude oils with different emulsion behaviors when contacted with alkaline solutions were fractionated. These crudes and their fractions were analyzed and the effects of each of these fractions and combinations of fractions on emulsification were investigated.
In continuation of the oxidation investigations of Dahmani and Cambridge*^ , a part of this study was devoted to determining if the oxidation of crude oils by air injection yielded surface active material capable of improving oil recovery in alkaline floods conducted in unconsolidated sandpacks.
Reproduced with permission of the copyright owner. Further reproduction prohibited without permission.
CHAPTER II
LITERATURE SURVEY
2.1 Caustic Flooding2.1.1 Process of Caustic Flooding
2As far back as 1899, Donnan recognized that the addition of alkali to acid-containing hydrocarbons in water
Qcaused a lowering of the interfacial tension . This decrease in interfacial tension was found by Hartridge and
4Peters to be a function of the pH of the aqueous medium which led to the idea of caustic flooding. The first patent on the use of caustic for enhanced oil recovery was issued to H. Atkinson 5 in 1927.
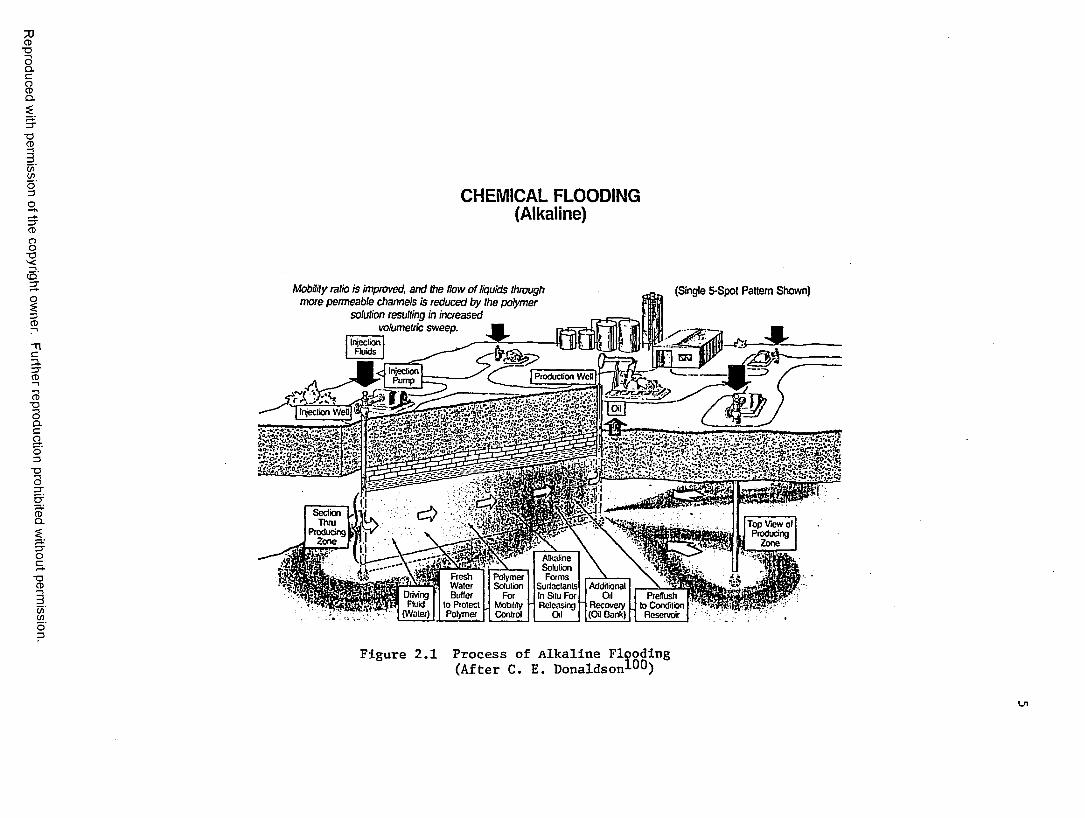
The general procedure for caustic flooding is illustrated in Figure 2.1. First, a conditioning preflush is usually injected to Berve as a buffer between the reservoir brine, which often contains detrimental dissolved salts, and the alkaline water that follows. A polymer solution is then injected after the alkaline water to
4
Reproduced with permission of the copyright owner. Further reproduction prohibited without permission.
Reproduced
with perm
ission of the
copyright owner.
Further reproduction prohibited
without perm
ission.
CHEMICAL FLOODING (Alkaline)
Mobility ratio is improved, and the flow of liquids through more permeable channels is reduced by the polymer
solution resulting in increased volumetric sweep. ■
(Single 5-Spot Pattern Shown)
InjectionFluids
InjectionPump Production Well
Injection
•.•kv*;*'
0m
Top view of Producing
Zone
Alkaline Solution Forms
Surfactants In Situ For Releasing
Oil
Fresh Water Butter
lo Protect Polymer
PolymerSolution
ForMobilityControl
Additional Oil
Recovery ( a t Bank)
DrivingFluid
(Water)
Preflush lo Condition
Reservoir
Figure 2.1 Process of Alkaline Flooding (After C. E. Donaldson-*-^)
6
increase fluid viscosity and efficiently displace the chemicals. A fresh water buffer generally follows to protect the polymer solution. Finally, a driving fluid is injected to return the reservoir water to its original brine concentrati on.
2.1.2 Field OperationsDocumented known field tests of alkaline floods are
shown in Table 2.1. Only a few of these caustic waterfloods have yielded acceptable results. The most successful were in the Whittier Field in California, where it was estimated that 5 to 7% of the pore volume was produced at a cost of approximately $0.3/bbl of incremental oil, and at the Isenhour Unit11 in Wyoming, where polyacrylamide was used as a mobility control agent to improve volumetric and arealsweep efficiencies. Recovery up to January 1, 1985 in the
91Isenhour Unit was 27% of the original oil in place, which is excellent. At the North Ward-Estes Field^ in Texas, 5 to 8% of the pore volume was produced and this was attributed to alkaline injection. The cost of producing the incremental oil, however, was approximately *3.0/bbl. Frequent well plugging problems due to CaSO^ precipitation occurred and added to the production costs. High alkalinity (4.85 wt.%) was presumed to be the cause of the problem.
The remaining field tests have either been outright failures or have not produced enough oil to be called successful. Most of these field tests have not produced more
Reproduced with permission of the copyright owner. Further reproduction prohibited without permission.

Table 2.1 Documented Known Field Tests of Alkali floods
FieldCompleted Field Tests:Bradford Field, Pennsylvania South East, Texas (Exxon) Harrisburg Field, Nebraska Nagylengyel Field, Hungary North Ward-Estes Field, Texas Singleton Field, Nebraska Whittier Field, California Wainwright Field, Alberta Brea Orlinda Field, California Orcutt Hill Field, California
Field Tests in Progress (1980): Biason Basin Field, Wyoming Epping Field, Saskatchewan Huntington Beach Field, Calif. North Ward-Estes, Texas Smackover Field, Arkansas Toborg Field, Texas Wilmington Field, California Isenhour Unit, Wyoming
(after T.F.
Alkali Used
sodium carbonatesodium carbonatesodium hydroxideammonium hydroxidesodium hydroxidesodium hydroxidesodium hydroxidesodium hydroxi.desodium orthosi1icatesodium orthosi1icate
sodium hydroxidesodium hydroxidesodium orthosi1icatesodium hydroxidesodium carbonatesodium hydroxidesodium orthosilicatesodium carbonate
Yen et al )
Reproduced with permission of the copyright owner. Further reproduction prohibited without permission.
8
8than 27. of the pore volume. In the Harrisburg Field , Nebraska, less than 2% of the pore volume was believed to
ghave been produced. The Singleton Project , also in Nebraska, recovered no more than 27. of the pore volume as well.
The alkaline flooding program that received the most10publicity is the Wilmington Project in California. It was
started in 1977 and has so far been very unsuccessful as numerous production problems have tremendously retarded theproject. Another alkaline flood, combined with steam,
12yielded no recovery at the Kern River Field in California. The failure is believed to be due to the fact that the alkaline solution injected lagged too far behindthe steam. Many caustic floods still underway include the
13Torrance Field in California, which was initiated in 1981,14and the Quarantine Bay flood in Louisiana which also
started in 1981.92Recent studies show that alkaline flooding costs
compare favorably with geological exploration as a means of increasing oil reserves, despite the recent decrease in oil prices. Applicability and economic feasibility ofcaustic flooding will be better assessed, however, when the results of the above mentioned and other field trials still underway become available.
Reproduced with permission of the copyright owner. Further reproduction prohibited without permission.
9
2.1.3 Displacement MechanismsA total of six displacement mechanisms have been
described in the literature. Four major parameters of multiphase flow through porous media are used in explaining these mechanisms. These parameters are the capillary number, interfacial tension, rock wettability and sweep efficiency.
The capillary number, which is the ratio of viscous forces to surfaces forces, has been defined by manyinvestigators15 . The most common expression being used is
15from Taber :N - (K AP)/(L a > 2.1ca
Where:K 8 effective permeability, millidarcies <md.)P = pressure drop across the distance L of the core,
psia.L 8 length of the core, fto ■» interfacial tension between the wetting and non
wetting phases, dynes/cm.Experimental results have shown that a capillary number in
-3 -2the 10 to 10 range would be necessary to significantly reduce residual oil saturations left after a normal waterflood where a capillary number is in the range of 10-6 to 10 5 . Since AP cannot practically be increased 1000 fold, the only remaining way to increase the capillary
Reproduced with permission of the copyright owner. Further reproduction prohibited without permission.

10
number to the desired range is by decreasing the inter-facial tension.
The interfacial tension between two liquids is defined as the surface energy per unit of interfacial area. It is a measure of the relative strength of the cohesive forces within each liquid to the adhesive forces between the liquids. If the adhesive forces are as strong as the cohesive forces, the two liquids may mix and form a solution. If the cohesive forces are greater than the adhesive forces, the two liquids will not tend to mix.
The third parameter is wettability, a property of the rock, which is an expression of the interfacial forces that exist between the rock surface and the fluids and can be classified as :
1> Wetted, in which the wetting phase is capable of spontaneous displacement of the non-wetting phase.
2) Intermediate, in which neither phase is capable of spontaneously displacing the other.
3) Non-wetted, in which the non-wetting phase can spontaneously displace the wetting phase.
Knowing the wettability condition of a rock requires knowing the chemical nature of both the rock and the fluids in contact with it. The rock will tend to be water-wet if the surface of the rock is highly charged, mainly because water is a polar molecule. For this reason, sandstones are believed to be strongly water— wet. However, current studies
Reproduced with permission of the copyright owner. Further reproduction prohibited without permission.
11
by Cuiec have shown that oil-wet reservoirs are a very common occurrence. The basic reason advanced is that if a rock is contacted for sufficient time, its ionic charactercan be altered by the presence of some components in the
17 18oil ’ . The rock would therefore become less water-wetor even oil-wet if given enough time.
A direct way to quantify wettability is given by the19following equation :
Ysa - YsiCos 0 = — 2.2
YlaWhere:
0 * contact angle between the liquid and the solid surfaces,
Y*a a solid/air interfacial tension, air being the nonwetting phase,
Ysl = solid/liquid interfacial tension,Yla - 1 iquid/air interfacial tension.
For oil/water systems the above equation can be written as:
Yos - Y MSCos 0 = -------- 2.3
YowWhere:
Yos = oil/solid interfacial tension,Yws B water/solid interfacial tension,Yqw a oil/water interfacial tension.
Reproduced with permission of the copyright owner. Further reproduction prohibited without permission.
Wagner and Leach concluded -from their studies that a contact angle, G , between 0° and 75° would signify that the rock is water— wet, whereas a contact angle between 105° and 180° would signi-fy that the rock is oil-wet. Any angle between the two ranges would mean an intermediate or mixed wettability of the rock.
The fourth parameter frequently mentioned when describing displacement mechanisms is sweep efficiency. Area, volumetric, and unit displacement sweep efficiencies are crucial factors related to the ultimate recovery of the oil in place. In general, oil recovery will increase as the reservoir sweep efficiency increases.
The acid number is another parameter associated with lowering of interfacial tension. It is associated with all the displacement mechanisms of caustic flooding. Alkaline solutions can give extremely low interfacial tensions due to the generation of surface active agents by the reaction of caustic material with mainly organic acids found in some crude oils. Therefore, the acid number of oil, which is defined as the number of milligrams of potassium hydroxide required to neutralize one gram of crude oil, is a criticalparameter of oil recovery by caustic flooding. Ehrlich and
21Wygal conducted caustic waterfloods on nineteen different crude oil samples and found that crude oils with acid numbers greater than 0.1 to 0.2 mg of KOH/grn of oil gave significant increases in production rates.
Reproduced with permission of the copyright owner. Further reproduction prohibited without permission.

13
Other -factors associated with displacement mechanisms22by alkaline -flooding include the type of emulsion formed ,
i.e., oil-in-water or water— in-oil, and also the bondnumber. The bond number is defined as the ratio of
23gravitational to interfacial forces
(Pw - Po> g K
WhereiPw = brine water density, lbm/ft"*P 3o “ Oil density, lbm/ftK ® absolute permeability, md$ = porosity of the rock,0 = oil/water interfacial tension, dynes/cm g = local acceleration of gravity, ft/sec2
An ordinary waterflood would yield a bond number of-6approximately 10 . Because gravity segregation of oil and
_owater can occur at a bond number of 10 , a favorableviscosity ratio is also important in preventing thetunneling of water through the lower strata of the
. 23 reservoir
With the major parameters now defined, the six displacement mechanisms described in literature are discussed below:
Reproduced with permission of the copyright owner. Further reproduction prohibited without permission.
14
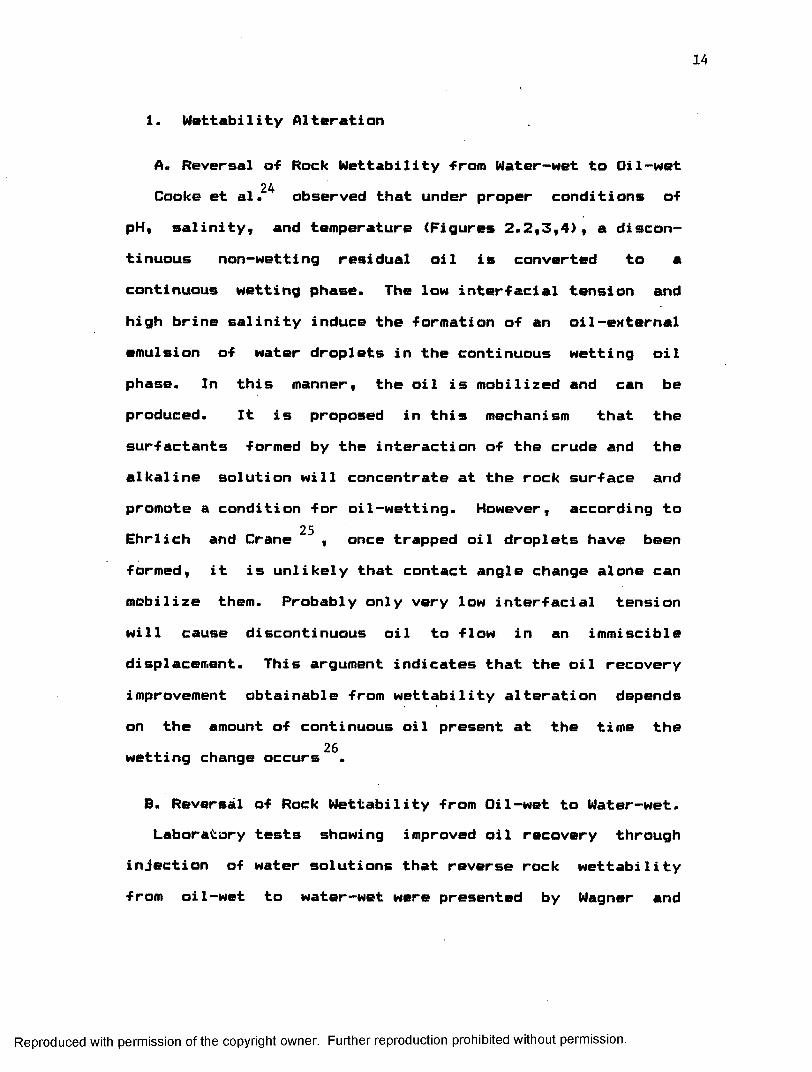
1. Wettability Alteration
A. Reversal of Rock Wettability -from Water— wet to Oil-wetCooke et al.~ observed that under proper conditions of
pH, salinity, and temperature (Figures 2.2,3,4), a discontinuous non-wetting residual oil is converted to a continuous wetting phase. The low interfacial tension and high brine salinity induce the formation of an oil-external emulsion of water droplets in the continuous wetting oil phase. In this manner, the oil is mobilized and can be produced. It is proposed in this mechanism that the surfactants formed by the interaction of the crude and the alkaline solution will concentrate at the rock surface andpromote a condition for oil-wetting. However, according to
25Ehrlich and Crane , once trapped oil droplets have been formed, it is unlikely that contact angle change alohe can mobilize them. Probably only very low interfacial tension will cause discontinuous oil to flow in an immiscible displacement. This argument indicates that the oil recovery improvement obtainable from wettability alteration depends on the amount of continuous oil present at the time the wetting change occurs
B. Reversal of Rock Wettability from Oil-wet to Water— wet.Laboratory tests showing improved oil recovery through
injection of water solutions that reverse rock wettability from oil-wet to water— wet were presented by Wagner and
Reproduced with permission of the copyright owner. Further reproduction prohibited without permission.

15
<tn
40
35
>d 30
Z2 255DC3 20
15-1 <3 OC/3 10UJcr
5 -
T E M P - II2 °FFLOOD RATE - 6 FT/DAYPOROUS MEDIUM - A.G.S. No. 16 OTTAWA SANDALKALINE WATER - 1.0MOLAR(5 .8 % ) SODIUM
ACIDIC OILCHLORIDE 0.10 MOLAR N o2C O j
- CRUDE OIL (A C ID No.2 .4 2 )
_L _L8.0 8.5 9.0 9.5
PH
2 *k
10.0 10.5 11.0
(a fte r C.E. Cooke, et a l. )
FIGURE 2 .2 E F F E C T OF FLOOD W ATER pH ON R ECO VERY OF CRUDE O IL B Y A L K A L IN E W A TERFLO O DING
Reproduced with permission of the copyright owner. Further reproduction prohibited without permission.
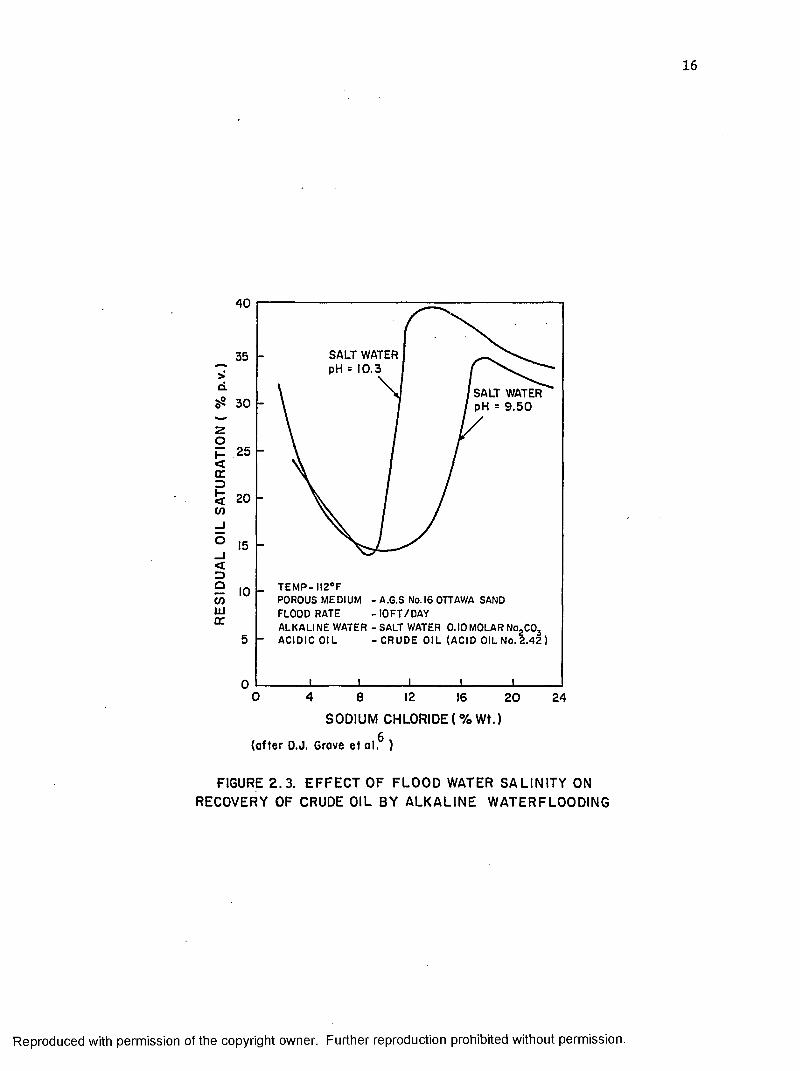
16
40
35>d.
30
i= 25 < tr3 £ 20 <n
15_J<39 10 </>UJDC
SALT WATER pH = 10.3
SALT WATER pH = 9 .5 0
TE M P - II2°FPOROUS MEDIUM - A.G.S No. 16 OTTAWA SAND FLOOD RATE - IOFT/DAY ALKALINE WATER - SALT WATER 0 .10MOLAR No2C03
- ACIDIC OIL CRUDE OIL (ACID O IL N o .2 .4 2 )
_L _L8 12 16 2 0
SODIUM CHLORIDE(%Wt.)24
(flfler D.J. Grave et al. )
FIGURE 2.3. EFFECT OF FLOOD WATER SALINITY ON RECOVERY OF CRUDE OIL BY ALKALINE WATERFLOODING
Reproduced with permission of the copyright owner. Further reproduction prohibited without permission.
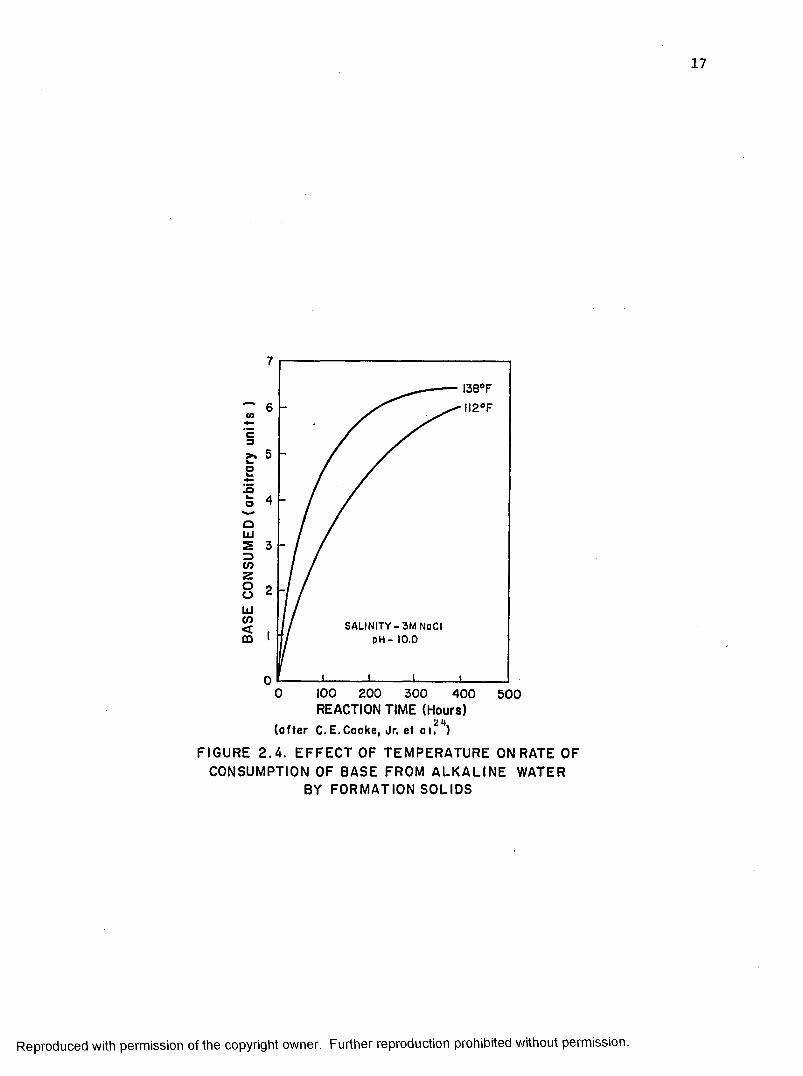
17
c3>*wOk-£wOOUJSZ)COzooUito<tCD
7
6
5
4
3
2
SALINITY -3 M NoCI pH - 10.0
00 100 200 300 400 500REACTION TIME (Hours)2
(a fte r C.E.Cooke, Jr. et a i. )
FIGURE 2.4. EFFECT OF TEMPERATURE ON RATE OF CONSUMPTION OF BASE FROM ALKALINE WATER
BY FORMATION SOLIDS
Reproduced with permission of the copyright owner. Further reproduction prohibited without permission.
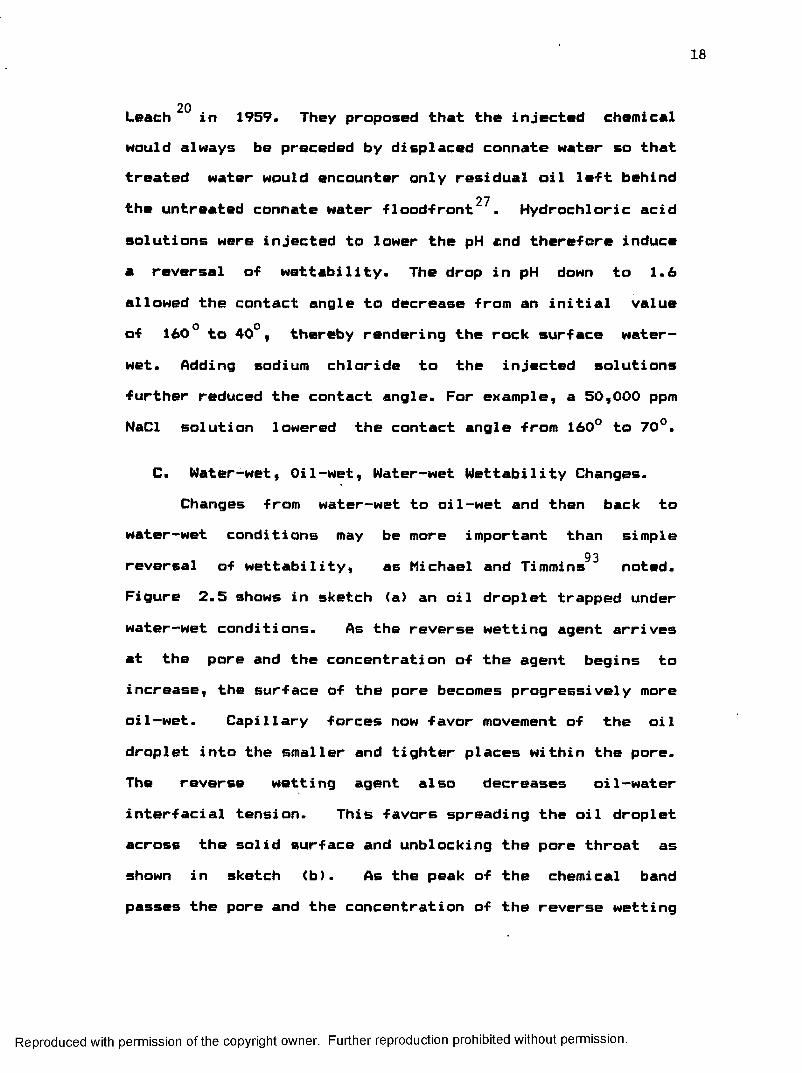
18
20Leach in 1959. They proposed that the injected chemical would always be preceded by displaced connate water so thattreated water would encounter only residual oil left behind
27the untreated connate water floodfront . Hydrochloric acid solutions were injected to lower the pH and therefore induce a reversal of wettability. The drop in pH down to 1.6 allowed the contact angle to decrease from an initial value of 160° to 40°, thereby rendering the rock surface water—
wet. Adding sodium chloride to the injected solutionsfurther reduced the contact angle. For example, a 50,000 ppm NaCl solution lowered the contact angle from 160° to 70°.
C. Water— wet, Oil-wet, Water— wet Wettability Changes.Changes from water— wet to oil-wet and then back to
water-wet conditions may be more important than simple93reversal of wettability, as Michael and Timmins noted.
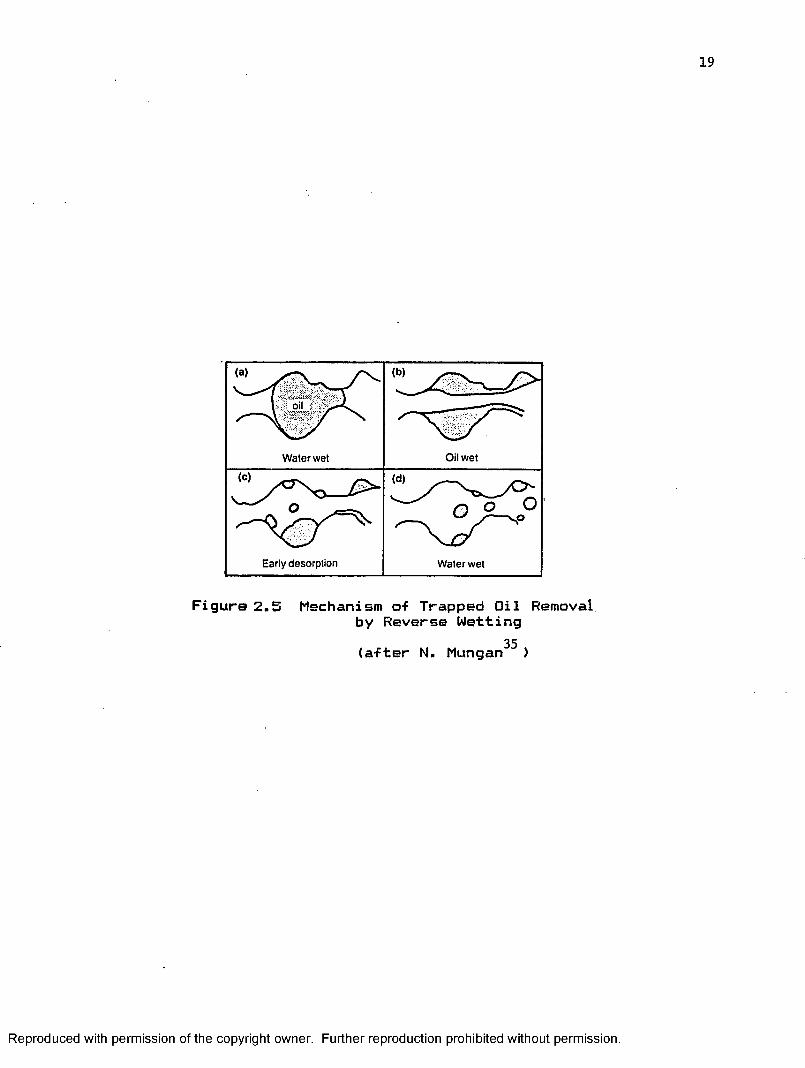
Figure 2.5 shows in sketch (a) an oil droplet trapped under water— wet conditions. As the reverse wetting agent arrives at the pore and the concentration of the agent begins to increase, the surface of the pore becomes progressively more oil-wet. Capillary forces now favor movement of the oil droplet into the smaller and tighter places within the pore. The reverse wetting agent also decreases oi1-waterinterfacial tension. This favors spreading the oil droplet across the solid surface and unblocking the pore throat as shown in sketch (b). As the peak of the chemical band passes the pore and the concentration of the reverse wetting
Reproduced with permission of the copyright owner. Further reproduction prohibited without permission.
19
Water wet Oil wet
^ C) £>■
Early desorption
(d> X — v / O
Water wet
Figure 2.5 Mechanism of Trapped Oil Removalby Reverse Wetting(after N. Mungan"^ )
Reproduced with permission of the copyright owner. Further reproduction prohibited without permission.
20
agent within the pore begins to decrease, the solid surface35starts to return to its original water— wet condition . Oil
droplets, which had moved into constrictions and cracks and which had been spread out along solid surfaces during the period of high surfactant concentration, i.e., oil-wet conditions, now will tend to be displaced from the pores as water wetness returns as sketches (c) and (d) show.
2. Emulsification and Entrainment28As early as 1942, Subkow recognized that the
emulsification of crude oil and its entrainment into a continuous flowing alkaline water phase was one of themechanisms of oil recovery by caustic flooding. Reisberg and
29Dosher added that the ability of caustic to prevent adherence of oil to sand surfaces and to suppress semi—solid film formation at the oil/brine interface plays a part in this mechanism, along with the lowering of the oil/brine interfacial tension. As the IFT decreases, the capillary number increases which allows the oil to be mobilized in an oil-in-water emulsion, and subsequently to be entrained tothe producing wells. The low viscosity of oil-in-water
35emulsions aids recovery . This mechanism is very efficient unless the oil drops interact with the reservoir rock surfaces and become re-entrapped.
Reproduced with permission of the copyright owner. Further reproduction prohibited without permission.
21
3. Emulsification and Swelling of the Oil PhaseQANovosad and McCsiffery , analyzing the mechanisms
leading to alkali-stimulated oil production, noticed for one crude that the discontinuous and trapped residual oil emulsified spontaneously upon contact with the alkaline front, forming water-in-oil emulsions. This oil swelling allowed some of the emulsions to he mobilized and produced until a similar residual oil saturation of the new trapped phase was reached.
4. Emulsification and Entrapment30According to Jennings et al. , if the oil/brine
interfacial tension is low enough, in-situ emulsification of the oil with the flowing caustic could occur. As the emulsion moves downstream, the oil emulsion droplets could be trapped by small pore throats. The water mobility is subsequently decreased and this induces an improvement in both vertical and areal sweep efficiencies. This is especially important in waterflooding of viscous oils wherewaterflood sweep efficiency is extremely poor27 . Studies
31done by Soo on dilute emulsion flow in unconsolidated porous media showed that oil drops build up in pore restrictions and on pore walls, thereby restricting flow. Once captured, there is negligible particle reentrainment. Soo observed that drops smaller than the pore throats also have a significant capture probability, making the mechanism of emulsification and entrainment an unlikely mechanism of
Reproduced with permission of the copyright owner. Further reproduction prohibited without permission.
22
emulsion -Flow. He suggested that mechanical entrapment, rather than adsorption, was the main cause of flow restriction.
5. Emulsification and Coalescence of Oil Droplets Wasan70, in studies of emulsification, suggested that
although low interfacial tension provides a release mechanism (emulsification) of trapped oil, it must be accompanied by rapid coalescence (demulsification). This sequence is necessary to prevent the bypassing and eventual re-entrapment of freed oil drops and ganglia.
6. Solubilization of Rigid FilmsThe formation of rigid films at the oil/water interface
when certain components of crude oil are present has been32demonstrated in several studies. Kimbler described the
physical characteristics of the interfacial films in terms of film pressure vs. interfacial area. It was found that the physical characteristics of the interfacial films of a givencrude are dependent upon the water and oil properties and
33the extent of interfacial area. Dunning and Rabonsuggested that porphyrins and paraffins were responsible for
29the formation of these rigid films. Reisberg and Dosher , working with Ventura Crude, determined that the film-forming material appeared to be resins and asphaltenes but was highly oxygenated and of lower molecular weight. Should these rigid films exist in reservoirs, they can hamper oil
Reproduced with permission of the copyright owner. Further reproduction prohibited without permission.
recovery by impairing oil displacement. However, as Mungarf*5 demonstrated, alkali can dissolve these -films and there-fore facilitate oil displacement.
2.1.4 Factors Affecting Caustic Flooding Performance1. Rock Type
36Laboratory studies conducted by Bernard showed that caustic consumption by the reservoir rock is probably responsible for the fact that eight of the nine causticfloods he studied recovered less than 2% of the pore volume.
37Campbell similarly believes that interaction of alkali with reservoir sands is critical. Interaction of alkali with rock minerals can include surface exchange and hydrolysis, dissolution reactions, and insoluble salt formation.
38According to Novosad , rock bound hydrogen ions are released into solution by alkali and this ion exchange controls the rate of propagation of the caustic flood. Because the ion exchange reaction is difficult to measure, the approach was based on the sodium ion content rather than the OH content in the effluent. The reversible ion exchange studied was of the form:
Rock-H + Na++ OH" ^=5 Rock-Na + H O2
Novosad suggested that the first mechanism is the reaction of Na+ ions with the Rock-H sites causing Na+ substitution. By quantifying the reduction in Na + content of the effluent,
Reproduced with permission of the copyright owner. Further reproduction prohibited without permission.
24
the OH- loss corresponding to this reaction can bedetermined. Then, by determining the total OH in theeffluent, the difference between the substitution losses and the total losses is the loss attributed to OH- ion exchange and mineral dissolution. Their experiments showed that Na+ exchange capacity of berea sandstone can vary widely, intheir case from 0.13 to 0.4 milliequivalent/100 gm of rock.
39Experiments performed by Bunge and Radke revealed a fast, reversible, ion exchange reaction coupled with a slow, irreversible, mineral dissolution reaction. It was found that in reservoir sands both fine silica and clay minerals dissolve under attack by the alkali, yielding a complex distribution of soluble products and new mineral structures. Sydansk^ noted that NaOH consumption is a function of contact time with the rock matrix. Sydansk also noted that NaOH preferentially interacts with the clay matrix and with large surface-area Si02 minerals, and that higher causticconcentration produces higher mineral consumption.
41Somerton and Radke found that the clay mineral contents of the several reservoir oil sands studied were small percentages of the total sand (1 to 2X), but grain size (<2ym) and plate-like nature make major contributions to the total surface area available for physical and chemical reactions. Other minerals present in the fines and the clay fractions of the oil sands, such as zeolites, also contribute to the total reactivity. Accompanying the
Reproduced with permission of the copyright owner. Further reproduction prohibited without permission.
25
dissolution is an increase in permeability of the sandstone,40but as Sydansk found, this trend is generally offset by
the in-situ production of hydrated alumino-silicate minerals which have a tendency to plug the newly created pores. A simplified dissolution reaction of quartz and amorphous silica has been suggested by Somerton and Radke 411
Si02 + H20 + NaOH — NaH3SiD4
In addition to ion exchange and dissolution reactions with sandstone surfaces, some other specific rock minerals can also react directly with alkali. Some of these nonsilicate minerals are gypsum, anhydrite, dolomite, and
41sidente. Somerton and Radke gave an example of the incongruent dissolution of anhydrite and gypsum in alkaline solutions to produce the less soluble calcium hydroxide as shown below:
CaS04 + 2NaOH — Ca<OH>2 + Na2S04
The redissolved calcium hydroxide is believed to have little value in increasing oil recovery since calcium surfactants are generally ineffective as tension-reducing agents. A rock having 0.1 wtX gypsum will consume about 1.5 meq alkali/100 gm of sand42 . Sydansk also showed how
Reproduced with permission of the copyright owner. Further reproduction prohibited without permission.
26
40carbonate minerals are dissolved i
MgC03 + 20H — ► Mg(OH)2 + CO 3"
Two methods have been proposed so far to reduce alkali consumption by reservoir rocks. The first method suggested is to increase the alkali concentration in the floodwater, but as Sydansk^0 found, as the alkali concentration increases, so does the consumption rate, making theincreased concentration ineffective. The other method was
43 44proposed by Krumrine and later by Southwick . It wassuggested that when alkali reacts with quartz, anequilibrium is reached in which some ratio of soluble silicaand alkali exists in solution. They demonstrated that byusing alkaline silicates ((Na2Si02)n ) injected at a ratiosimilar to this equilibrium ratio, the consumption level ofthe quartz can be reduced. Krumrine and Southwick had notextended this work beyond pure quartz systems.
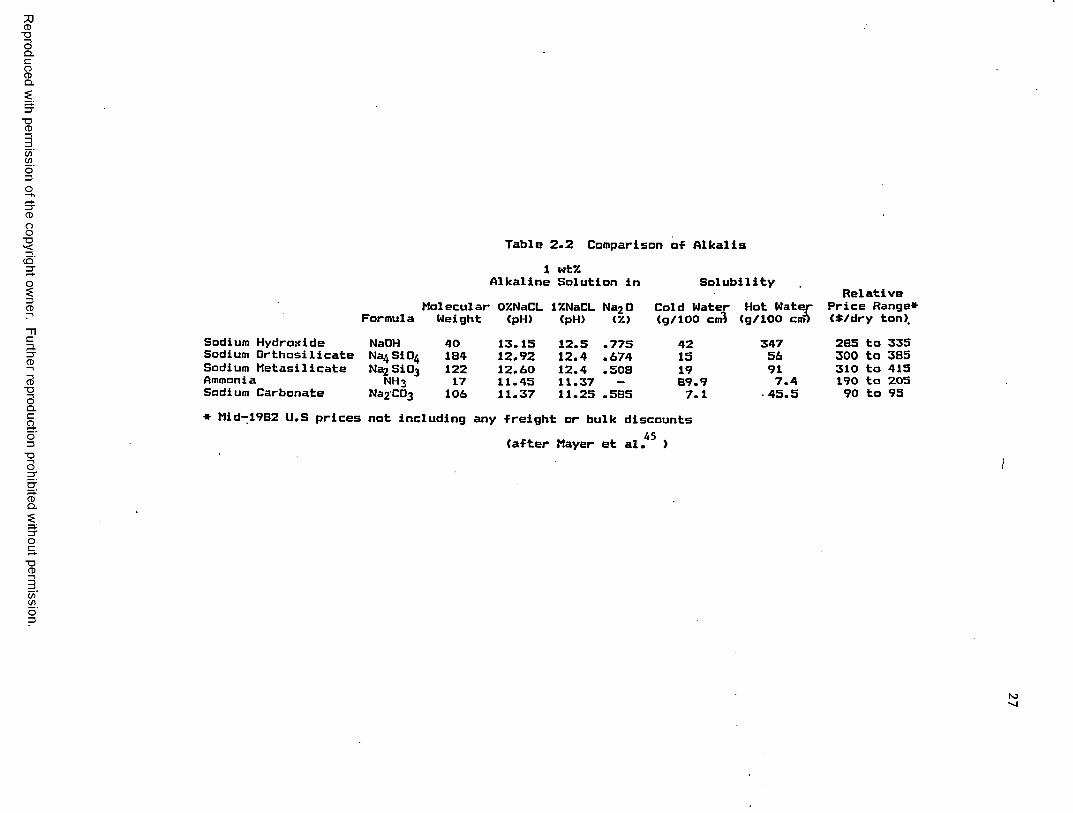
2. Type of AlkaliThe typical alkalis considered in caustic flooding are
45listed in Table 2.2. Mayer et al. also listed some of the important physical properties of these alkalis. Alkaline solutions can be characterized using two parameters, pH and Na20 (alkalinity) content. There is usually no difference between total alkalinity (neutralization with acid to a methyl orange endpoint , pH ■ 3.4) and available alkalinity
Reproduced with permission of the copyright owner. Further reproduction prohibited without permission.
Reproduced
with perm
ission of the
copyright owner.
Further reproduction prohibited
without perm
ission.
Table 2.2 Comparison of Alkalis1 wt 7.
Alkaline Solution in Solubility
FormulaMolecular
WeightOXNaCL(pH)
lZNaCL(pH)
Na20IV .)
Cold Water (g/100 cm)
Sodium Hydroxide NaOH 40 13.15 12.5 .775 42Sodium Orthosi1icate Na4Si04 184 12.92 12.4 .674 15Sodium Metasilicate Na? SiO? 122 12.60 12.4 .508 19Ammonia NH3 17 11.45 11.37 — 89. 9Sodium Carbonate Na2C03 106 11.37 11.25 .585 7.1
Hot Water
34756917.445.5
* Mid-1982 U.S prices not including any freight or bulk discounts45(after Mayer et al. >
Relative Price Range* (*/dry ton).285 to 335 300 to 385 310 to 415 190 to 205 90 to 95
28
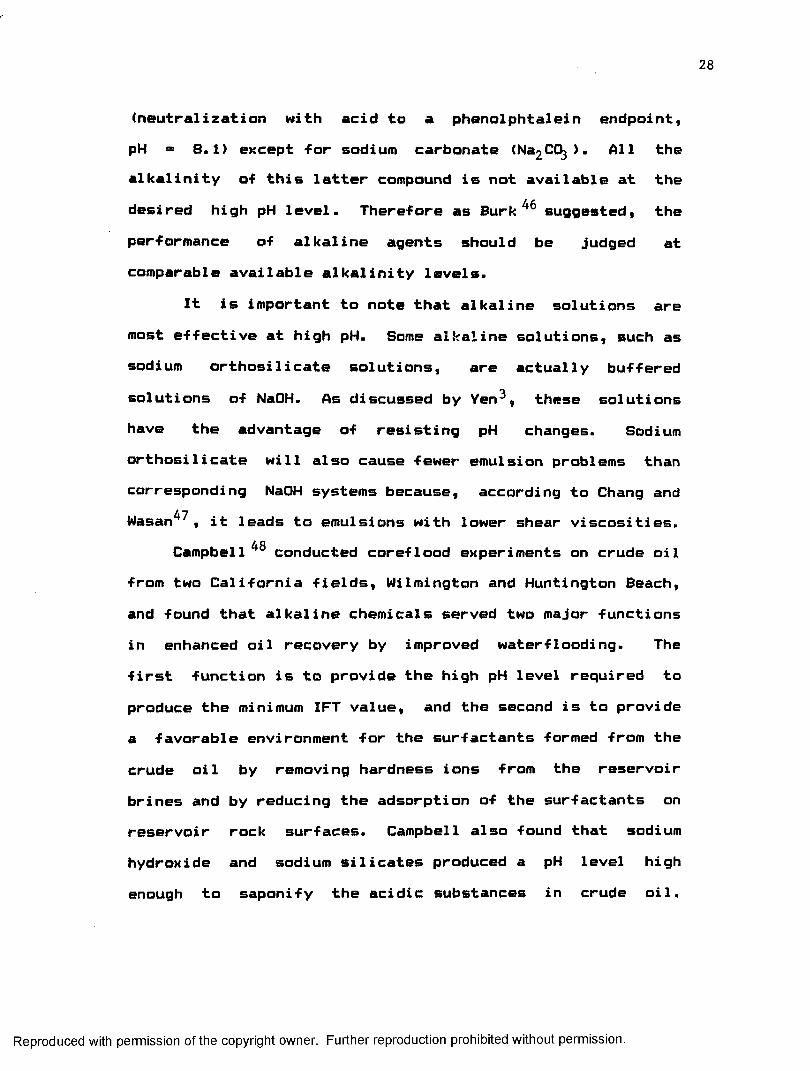
(neutralization with acid to a phenolphtalein endpoint, pH = 8.1) except -for sodium carbonate (Na2C(^). All thealkalinity of this latter compound is not available at the desired high pH level. Therefore as Burk^ suggested, the performance of alkaline agents should be judged at comparable available alkalinity levels.
It is important to note that alkaline solutions are most effective at high pH. Some alkaline solutions, such as sodium orthosilicate solutions, are actually buffered solutions of NaOH. As discussed by Yen^, these solutions have the advantage of resisting pH changes. Sodium orthosilicate will also cause fewer emulsion problems than corresponding NaOH systems because, according to Chang and Wasan^, it leads to emulsions with lower shear viscosities.
AOCampbell conducted coreflood experiments on crude oil from two California fields, Wilmington and Huntington Beach, and found that alkaline chemicals served two major functions in enhanced oil recovery by improved waterflooding. The first function is to provide the high pH level required to produce the minimum IFT value, and the second is to provide a favorable environment for the surfactants formed from the crude oil by removing hardness ions from the reservoir brines and by reducing the adsorption of the surfactants on reservoir rock surfaces. Campbell also found that sodium hydroxide and sodium silicates produced a pH level high enough to saponify the acidic substances in crude oil.
Reproduced with permission of the copyright owner. Further reproduction prohibited without permission.
29
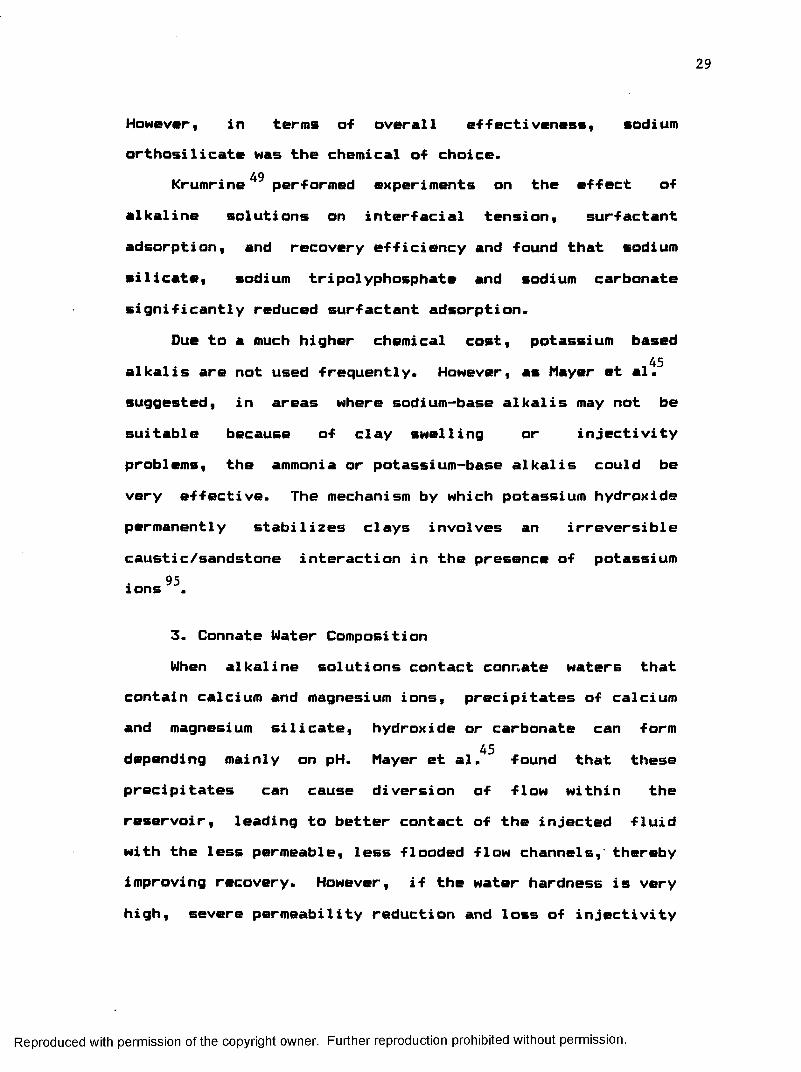
However, in terms of overall effectiveness, sodiumorthosilicate was the chemical of choice.
49Krumrine performed experiments on the effect of alkaline solutions on interfacial tension, surfactant adsorption, and recovery efficiency and found that sodium silicate, sodium tripolyphosphate and sodium carbonate significantly reduced surfactant adsorption.
Due to a much higher chemical cost, potassium based45alkalis are not used frequently. However, as Mayer et al.
suggested, in areas where sodium-base alkalis may not be suitable because of clay swelling or injectivity problems, the ammonia or potassium-base alkalis could be very effective. The mechanism by which potassium hydroxide permanently stabilizes clays involves an irreversiblecaustic/sandstone interaction in the presence of potassium
95ions
3. Connate Water CompositionWhen alkaline solutions contact connate waters that
contain calcium and magnesium ions, precipitates of calciumand magnesium silicate, hydroxide or carbonate can form
45depending mainly on pH. Mayer et al. found that these precipitates can cause diversion of flow within the reservoir, leading to better contact of the injected fluid with the less permeable, less flooded flow channels,' thereby improving recovery. However, if the water hardness is very high, severe permeability reduction and loss of injectivity
Reproduced with permission of the copyright owner. Further reproduction prohibited without permission.

30
can occur. Fresh water pre-flushes have o-ften been used to reduce water hardness, especially around the wellbore wheremost injectivity losses can occur. It is of interest to
40note that Sydansk stated that caustic consumption contributed by multivalent cations dissolved in the formation water is often much smaller than the sandstone multivalent cation exchange capacity. This would causemultivalent ion/caustic reactions to be less critical inmost cases.
Sodium chloride concentration of connate and injected waters is also an important factor in water/caustic/crude oil interactions. It is generally agreed that sodiumchloride reduces the amount of caustic required to give maximum surface activity, as Trujillo observed. Salinity also affects the type of oil/water emulsions that can be formed.
4. Crude Oil PropertiesTwo properties of crude oil, acid number and
viscosity, play an important role in caustic flooding. The acid number of oil is defined as the number of milligrams of potassium hydroxide required to neutralize one gram of crude oil. This number includes both interfacially active and inactive acids, and does not include other species which may be interfacially active. Therefore, the acid number cannot be used as a definitive screening parameter for determining the caustic flooding applicability to a given reservoir.
Reproduced with permission of the copyright owner. Further reproduction prohibited without permission.
31
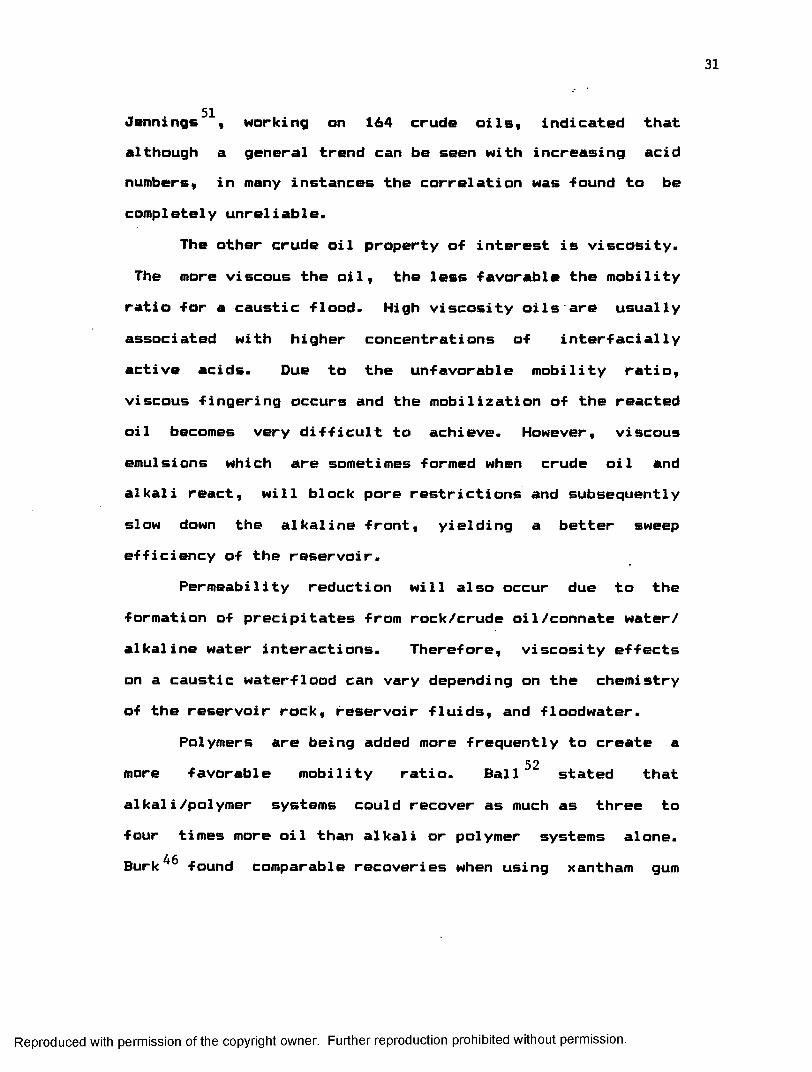
Jennings , working on 164 crude oils* indicated thatalthough a general trend can be seen with increasing acidnumbers, in many instances the correlation was -found to becompletely unreliable.
The other crude oil property o-f interest is viscosity.The more viscous the oil, the less -favorable the mobility
ratio -for a caustic -flood. High viscosity oils are usually associated with higher concentrations o-f inter-f acial ly active acids. Due to the unfavorable mobility ratio,viscous -fingering occurs and the mobilization o-f the reacted oil becomes very di-f-ficult to achieve. However, viscous emulsions which are sometimes formed when crude oil and alkali react, will block pore restrictions and subsequently slow down the alkaline front, yielding a better sweep efficiency of the reservoir.
Permeability reduction will also occur due to the formation of precipitates from rock/crude oil/connate water/ alkaline water interactions. Therefore, viscosity effects on a caustic waterflood can vary depending on the chemistry of the reservoir rock, reservoir fluids, and floodwater.
Polymers are being added more frequently to create a52more favorable mobility ratio. Ball stated that
alkali/polymer systems could recover as much as three to four times more oil than alkali or polymer systems alone. Burk^6 found comparable recoveries when using xantham gum
Reproduced with permission of the copyright owner. Further reproduction prohibited without permission.
32
and polyacrylamides as the thickening agents in coreflood experiments.
5. Caustic ConcentrationDetermining the appropriate caustic concentration of
-flood water has traditionally been a difficult task to accomplish for two principal reasons, i.e., the achievement of minimum IFT and the handling of rock and connate water caustic consumptions.
An alkaline solution that yields the minimum IFT when reacted with a crude oil could be used if rock and connate water consumptions were negligible. But in most reservoirs,this is not the case and therefore more caustic has to be
40added to the floodwater. However, as Sydansk mentioned, increased caustic concentrations will yield increased rockconsumption making the increased concentration ineffective.
3Yen indicated that each acid in crude oil dissociates at a certain pH value, referred to as the onset pH or pKa value, and yields the surface active anion. This study suggested a method of sequential alkaline floods where each flood would have a specific caustic concentration.
6. Temperature40Sydansk , conducting studies on the elevated tempera
ture caustic-sandstone interactions, found that at elevated temperatures (85°C), caustic in the form of NaOH solutions strongly interacted with sandstone. This resulted in
Reproduced with permission of the copyright owner. Further reproduction prohibited without permission.

33
significant dissolution of the more susceptible silicate minerals and in hydroxide-ion consumption. It was also found that at a fixed temperature, pressure, and contact time, the elevated temperature caustic-sandstone interaction caused either permeability increases or decreases, depending on sandstone mineralogy and lithology. Therefore, in designing caustic waterfloods, the effect of temperature on silicate mineral dissolution should be given consideration.
2.2 Interfacial Activity in Crude Oil/Brine Systems2.2.1 Chemistry of Interfacial Activity Viscous forces available from waterflooding gradients
are generally inadequate to overcome capillary forces that inhibit the flow of crude oil in reservoirs. Melrose and Brandner^ stated that the capillary number had to be increased from a value of 10"^ to a value of 10-3 to lO^2 in order to recover additional oil from a chemical flood. This can be achieved by decreasing the interfacial tension between the crude oil and the brine.
In general, the polar components of oil are very activematerials, whereas the non-polar components are inactive.
54Yen et al. have been able to isolate some of the polar compounds of the oil. These polar compounds were obtained from three fractions of crude oil, namely gas oil (avg. MW.=440), resins (avg. MW.=760), and asphaltenes (avg. MW.=1930). However, most of the interfacially active compounds were found in the non-volatile fractions, resins
Reproduced with permission of the copyright owner. Further reproduction prohibited without permission.
34
and asphaltenes, with asphaltenes being the most inter-facially active fraction. Some of the polar compoundsthat have been found in the fractions isolated by Yen et
54al. are listed below:
Phenolss - 3,5 diethyl phenol- di-t-butyl phenol
Amides: - n-ethylbenzynamide- 2-quinoline
Carbazoles: - ll-h-benzo(a)carbazole- 3-methyl-2-propylindole
Carboxylic acids: - cyclohexane carboxylic acid- 8-phenyl-n-butyric acid
Metallo-organics: - vanadyl etioporphyrin- nickel porphyrin
Carboxylic acids appear to be very active interfacially, and at least for one California crude, carboxylic acids were demonstrated experimentally and unequivocally to be the only surface active constituents . In Figure 2.6, the effect of esterification of petroleum acids on the change of interfacial activity at alkaline pH is shown. Carboxylic acids react with alkaline solutions to form surface active dissociated acids. The non-polar hydrocarbon end of the dissociated acid is oil-soluble, whereas the polar end is soluble in the brine.
Reproduced with permission of the copyright owner. Further reproduction prohibited without permission.

CARBOXYLIC ACIDS IN PETROLEUM AND SEDIMENTS
Reaction RCOOHTimeMin.
Mole % Unchanged
100.0
EosWa>c
5 days
2 511010.0zocnzUJI—-1<o2orUJh-z
5 0
7 00.1 100
LlJcr2a.<
0.0110.4 11.0 11.5 12.0 12.5 13.0 13.5 14.0
pH(after W.K. Seifert5 5)
F IG U R E 2. 6 CHANGE OF INTERFACIAL A C TIV ITY OF "PETROLEUM ACIDS" BY REACTION W IT H
D1AZ0M ETHANE A T - 5 0 °C
Reproduced with permission of the copyright owner. Further reproduction prohibited without permission.
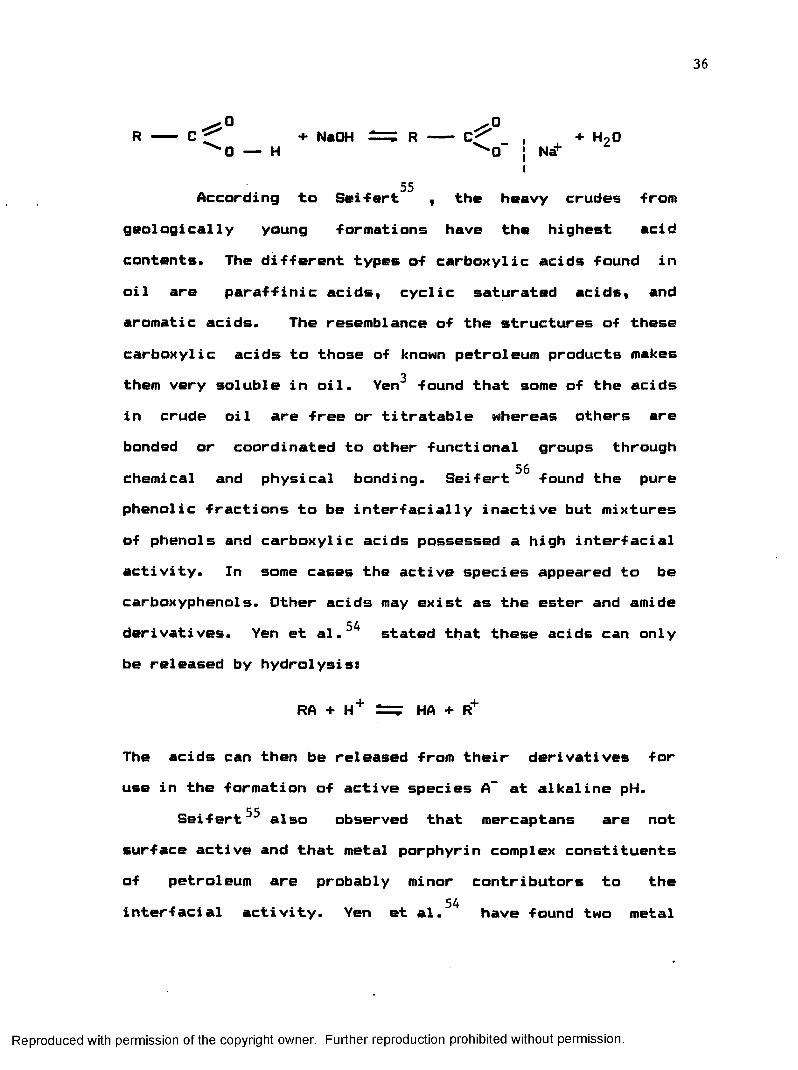
According to Seifert , the heavy crudes from geologically young formations have the highest acid contents. The different types of carboxylic acids found in oil are paraffinic acids, cyclic saturated acids, and aromatic acids. The resemblance of the structures of thesecarboxylic acids to those of known petroleum products makes
3them very soluble in oil. Yen found that some of the acids in crude oil are free or titratable whereas others are bonded or coordinated to other functional groups through chemical and physical bonding. Seifert found the pure phenolic fractions to be interfacially inactive but mixtures of phenols and carboxylic acids possessed a high interfacial activity. In some cases the active species appeared to be carboxyphenols. Other acids may exist as the ester and amide derivatives. Yen et al.^ stated that these acids can only be released by hydrolysis:
RA + H + 2=^ HA + R+
The acids can then be released from their derivatives for use in the formation of active species A~ at alkaline pH.
Seifert^ also observed that mercaptans are not surface active and that metal porphyrin complex constituentsof petroleum are probably minor contributors to the
54interfacial activity. Yen et al. have found two metal
Reproduced with permission of the copyright owner. Further reproduction prohibited without permission.
37
porphyrin complexes, namely nickel porphyrin and vanadyl etioporphyrin, to be ineffective in reducing IFT. Examples of the compounds in the preceeding discussion are shown in Tables 2.3 and 2.4.
The static and dynamic interfacial tension betweencrude oil and caustic solutions has been studied by
50Trujillo . It was fourid that the interfacial tension between various crude oils and caustic increases with time due to the temperature dependent desorption rate of the surface active species from the interface. Only crude oils with a high concentration of acids yielded an ultralow IFTthat could be maintained for any reasonable period of time(24 hours).
Bansal et al .57 have shown a relationship between low IFT and electrophoretic mobility. The pH yielding thehighest negative charge at the interface between crude and caustic is also the pH at which the lowest IFT occurs. Radke et al58 discuss that the rise in IFT with time is related to the phase volumes, making the time dependency observed in the laboratory not representative of that in the field. Asphaltene adsorption at the oil/water interface is believedto create a film that inhibits further reaction of the
59acidic components, as stated by Pasquarelli and Wasan Films with crystalline structures were observed by Wasan et al.*’0 with several alkali /crude oil fraction systems. These films are very viscous and as Slattery61 indicated, when the
Reproduced with permission of the copyright owner. Further reproduction prohibited without permission.

P H E N O L
OH
M ER C APTAN R ------ S ------ H
M ETAL PO RPH YR INr v r £\ / N ------^
N A PTH EN IC ACID
TABLE 2 .3 - CONSTITUENTS OF OIL THAT MAY BE INTERFACIALLY ACTIVE
Reproduced with permission of the copyright owner. Further reproduction prohibited without permission.

E S T E R/ / °
R — C
' ' 'O R 7
K ETO N E
0
1!CE ----O1DC
C A R B O X Y L IC ACID R — C
^ OH
A LDEH YD E
0IIx
— o1DC
C A R B O X Y - PHENO L
OH
tQl^ ^ N C H 2 COOH
TABLE 2 .4 - CONSTITUENTS OF OIL PRESENT IN FILM-FORMING MATERIAL
Reproduced with permission of the copyright owner. Further reproduction prohibited without permission.
40
inter-facial tension is less than the critical value required -for oil displacement and the inter-facial viscosities are large, it is equally important to reduce both theinter-facial tension and the inter-facial viscosities.
Most investigators also agree that calcium ions have a50negative effect on IFT. Trujillo found that the presence
of calcium ions at concentrations of 200 ppm or moredestroyed the capability of caustic to reduce theinterfacial tension.
2.2.2 Interfacial Behavior ModelsSeveral studies have been made to develop an accurate
model for the complex interfacial behavior of caustic/crude62oil systems. England and Berg developed a model that
describes the accumulation of surface active molecules at the interface through bulk diffusion in the oil and Mater phases and adsorptive accumulation at the interface. Thekinetic model assumed two semi-infinite, immiscible phases.
62Rubin and Radke later developed a model for finite systems that was based on Henry and Langmuir adsorption and desorption kinetics as well as bulk phase diffusion of components. When Henry kinetics are assumed, there is a linear relationship between the concentration of activespecies in the bulk phases and their rate of adsorption at
64the interface . Therefore, a linear relationship exists
Reproduced with permission of the copyright owner. Further reproduction prohibited without permission.
41
between surfactant concentration at the interface and6 3interfacial tension
Rubin and Radke's model was later improved by Sharma et al. to explain changes in the IFT behavior as the pH and brine concentration of the aqueous phase change. The model also allowed for the presence of two organic acids in the crude with different pKa values. The interfacial tension can then be computed using the following equation65:
o m cr0 - b CA i3 2.5
Where:o = interfacial tension, dynes/cm oQ = interfacial tension when CAil = 0, dynes/cm b ■ empirical constant, dynes-l/mole-cm
CAi3 = interfacial concentration of the dissociated surface active acid, moles/1
When Langmuir sorption kinetics are assumed, there is an upper limit on interfacial surfactant concentration and the IFT is not linearly related to that concentration, as many investigators observed ̂ 3*64,66 ̂ following equationproposed by Cambridge67 can then be used to compute the interfacial tension:
CA± 3a = C70 + a R T CA*:] In (1 - ----- ) 2.6
Reproduced with permission of the copyright owner. Further reproduction prohibited without permission.
42
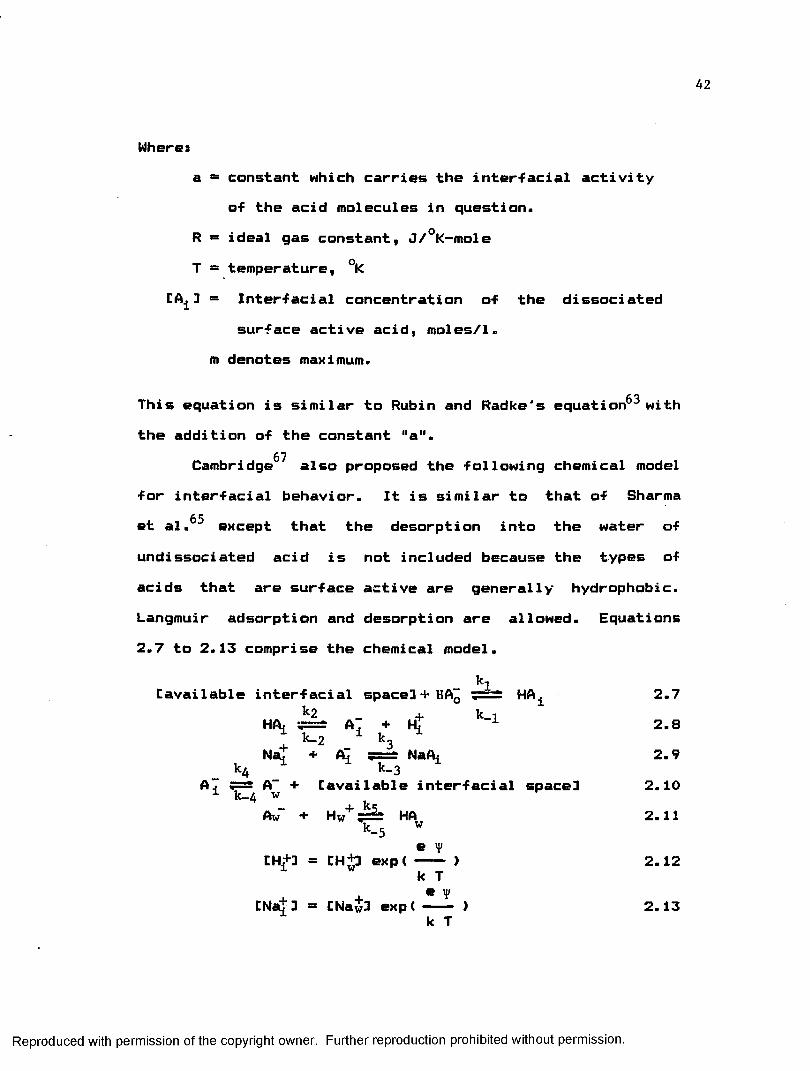
Wheresa = constant which carries the inter-facial activity
o-f the acid molecules in question.R *= ideal gas constant, J/°K-mole T = temperature, °K= Inter-facial concentration of the dissociated
surface active acid, moles/1, m denotes maximum.
C. OThis equation is similar to Rubin and Radke's equation withthe addition of the constant "a".
67Cambridge also proposed the following chemical model for interfacial behavior. It is similar to that of Sharma et al.65 except that the desorption into the water of undissociated acid is not included because the types of acids that are surface active are generally hydrophobic.Langmuir adsorption and desorption are allowed. Equations2.7 to 2.13 comprise the chemical model.
[available interfacial space!+ HA0 \— “ HA^ 2.7k 2 + k_iHA, A. + HT 1 2.8k_2 1 k-
Nat + fiT± sbs± NaA± 2.9k4 k_ 3
AT 5=s A“ + [available interfacial space! 2.104 W kAw" + Hw+ ? ^ HA 2.11
k-5 we H'[H,+! - [H+! exp ( ) 2.12k T
+ + * y [Nat! ■ [Na£! exp( ---- ) 2.13k T
Reproduced with permission of the copyright owner. Further reproduction prohibited without permission.
43
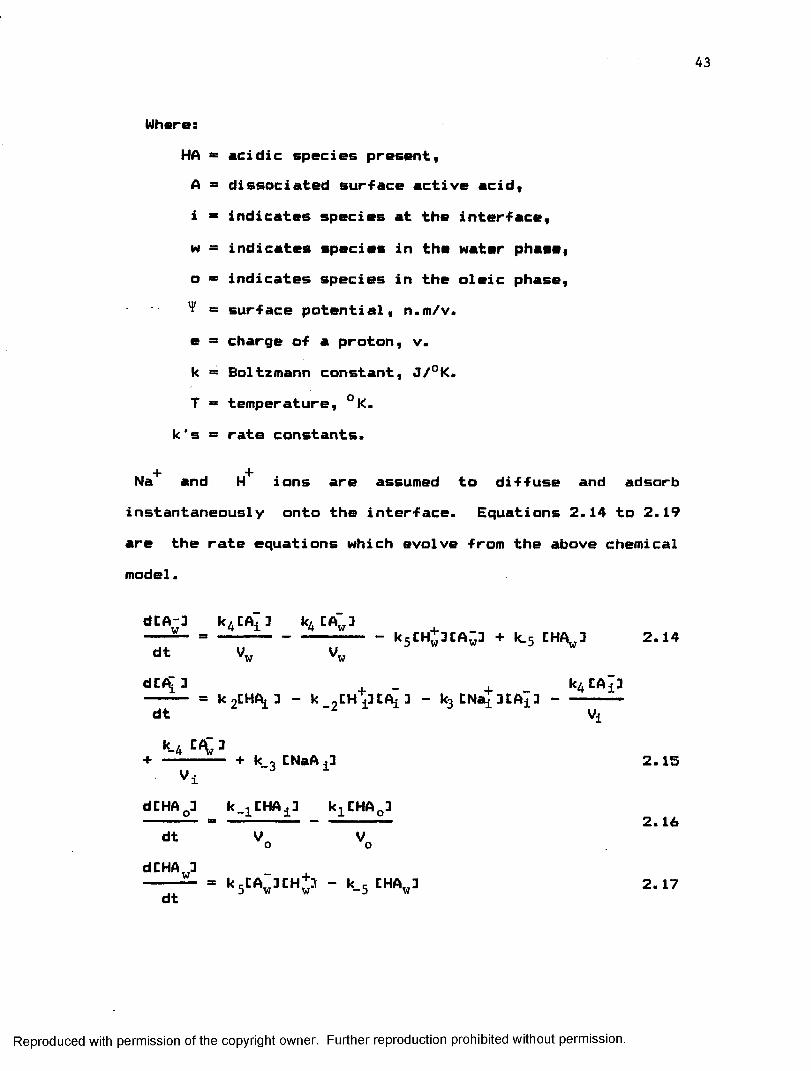
WheresHA = acidic species present,A = dissociated surface active acid, i ■ indicates species at the interface, w = indicates species in the water phase, o * indicates species in the oleic phase,^ = surface potential, n.m/v. e » charge of a proton, v. k = Boltzmann constant, J/°K.T *= temperature, °K.
k's = rate constants.
"H +Na and H ions are assumed to diffuse and adsorb instantaneously onto the interface. Equations 2.14 to 2.19 are the rate equations which evolve from the above chemical model.
dCA-3 k4CAT] k4 CA;3 — --------------------kcCHlDCA"! + k.5 CHft ] 2.14dt V Vvw vw
dCtfD _ k4 EA^D - k 2CHA,3 - k -EHjH A l I - koCNailCAil--------dt Vi
k-4 3
Vi+ k_3 CNaA ±2 2.15
dCHA03 k_1CHAi3 k ^ H A ^ s _ 2.16dt V o Vo
dCHAw3 - +------ * k 5CAw3CHja - k_5 CHA^ 2.17dt
Reproduced with permission of the copyright owner. Further reproduction prohibited without permission.

44
dCNaA.^- k3 CNai+3CAi3 - k_3 CNaA^ 3 2.18
dtdCHA13 k1CHA03CNu3 k ^ E H A ^
+ k_2 CA^3CH^3 - k 2CHAi3dt
2.19
The parameter ENu3 is the interfacial space available for adsorption as defined by the following equation:
where "m" denotes maximum .
These rate equations can be solved with a fourth order
from such a model is clearly dependent on the accuracy and availability of values of the rate constants and interfacial volumes. Rate constant values could be obtained by
diffusion coefficients, and surface film studies for adsorption and desorption coefficients. These experiments can be done routinely on simple liquid systems but they are difficult to perform on mixtures which have a complex chemistry as in crude oils. Interfacial volumes are likely to change considerably in crude oil/caustic reactions especially during the transient period, and it could be best to allow those values to vary as Cambridge^7 suggested.
Therefore, available IFT models are far from being exact, yet they may be used to explain different phenomena
ENu3 « C H A ^ - EHA^ - EA±3 - ENaA±3 2.20
Runge-Kutta routine 67 The quality of the results obtained
conducting electrophoretic mobility experiments for
Reproduced with permission of the copyright owner. Further reproduction prohibited without permission.
45
that are observed in IFT measurement studies. DeZabala and68 62Radke used the England and Berg IFT reduction model in
a transient chromatographic displacement model -for alkalineflooding of acidic crude oils to predict concentrationprofiles in the oil and water phases during displacement.
67Cambridge used a modified model developed by Sharma et65al. to investigate the effects of caustic and brine
concentrations on oxidized crude oil.
2.3 Emulsion Characteristics of Crude Oil/Alkali Systems Emulsion or dispersion of acidic crude oil by alkaline
water is a common occurrence in caustic flooding. However,dispersed non-coalescing oil droplets can become flocculated
47and behave as aggregates . If these aggregates (viscous emulsions) are large relative to the pore dimensions, the high shear viscosities associated with them will result in their entrapment within the pores and hamper oil recovery. These emulsions can be altered by isuch parameters as salinity, divalent ion concentration, and alkali type. According to Chang and Wasan in the absence of divalention salts, viscous water-external emulsions are formed at very low electrolyte concentrations, while viscous oil- external emulsions are formed at higher electrolyte concentrations. Coreflood studies showed that significantly lower oil production rates were obtained in zero salinity environments. When NaCl was added (IX), a definite improvement in oil recovery was observed. The addition of
Reproduced with permission of the copyright owner. Further reproduction prohibited without permission.
46
salt to the -flood-water is believed to destabilize the emulsions, thus improving oil recovery. The results also indicated that there is some optimum salinity (0.5% to 17. by weight NaCl) in the aqueous phase which needs to be maintained to minimize the problems associated with these viscous emulsions. Chang and Wasan ̂ 7 also indicated that emulsions -formed in the presence o-f divalent ion salts have much higher shear viscosities than the corresponding emulsions without divalent ions when the sodium chloride concentration is below one percent.
Wasan69 observed a correlation between emulsion stability, which is de-fined as the coalescence rate of oil droplets in water— external emulsions, interfacial shear viscosity and oil recovery. Although low interfacial tension provided a release mechanism (emulsification) of trapped oil, this release must be accompanied by rapid coalescence (demulsification) to prevent the bypassing and eventual re-entrapment of freed oil drops and ganglia 70 . Finally, high interfacial viscosities were found to be detrimental to oil recovery because they promote emulsion stability preventing the coalescence of oil drops'^1 .
2.4 Visual Observation of Flow of Fluids in Porous Media72As early as 1957, Kimbler and Caudle constructed a
visual cell that was used to study fluid flow and phase distribution in porous media. Crushed glass between two glass plates was used as the porous medium. The technique
Reproduced with permission of the copyright owner. Further reproduction prohibited without permission.

47
73 34was improved later by Sykes and Bourgoyne , who usedcrushed cryolite mineral (consolidated in place by theprecipitation of silica) as the porous medium. Cryolite is ahighly water— wet mineral (Na^AlFg) with a refractive indexvery near that of water which makes it almost transparentwhen wetted. This allows for excellent visualization of theoil in the flow cell; however, due the thickness of theglass plates used, visualization of the flow at highmagnification OlOx) was not possible. A cinephotographictechnique has since been developed by Wasan et al.71 andapplied to micromodel sandpacks. The models were flowchambers measuring 4 by 2 by 1/16 inch packed with sandgrains. Such micromodel sandpacks as well as othermicromodels have a high porosity (around 50%) and a highpermeability (3 to 8 darcy) when compared with properties ofreservoir rocks. However, there is a variety of trappingmechanisms (Figure 2.7) resulting from the combined effectsof aspect ratio (pore body width to pore throat width),pore-body and pore-throat size distribution, arrangement ofpore bodies and throats, as well as coordination number(number of interconnections per lattice node). This makesthe effect of pore size and permeability less significant inthe determination of capillary numbers and residual oilsaturations
Reproduced with permission of the copyright owner. Further reproduction prohibited without permission.
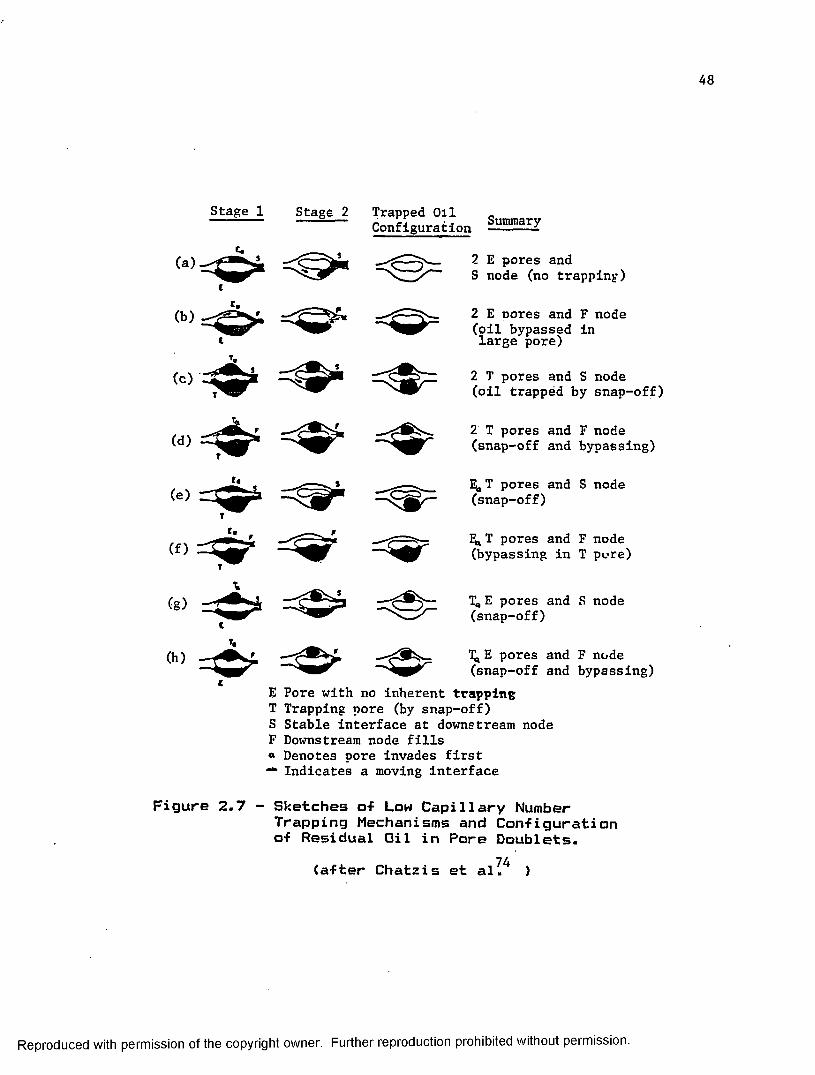
Stage 1 Stage 2 Trapped Oil „ Configuration —
<8)c
2 E pores and S node (no trapping)
2 E pores and F node (oil bypassed in large pore)
2 T pores and S node S'-8 P' (oil trapped by snap-off)
2 T pores and F node (snap-off and bypassing)
T pores and S node (snap-off)
T pores and F node (bypassing in T pore)
T„ E pores and S node (snap-off)
t,(h) TJ,E pores and F node
— (snap-off and bypassing) c E Pore with no inherent trapping T Trapping pore (by snap-off)S Stable interface at downstream node F Downstream node fills * Denotes pore invades first “*■ Indicates a moving interface
Figure 2.7 - Sketches o-f Low Capillary NumberTrapping Mechanisms and Configuration o-f Residual Oil in Pore Doublets.
(after Chatzis et al^ )
Reproduced with permission of the copyright owner. Further reproduction prohibited without permission.
49
2.5 Effect o-F Alcohols on Flow Behavior The addition of a suitable alcohol or a co-solvent to
an aqueous surfactant system has been shown to affect the phase behavior and interfacial tension between oleic and aqueous phases. For example, Wasan and Milos75 have shown that the addition of n-hexanol improved the coalescence rate of oil droplets. This resulted in the destabilization of the emulsions which aided in the formation of an oil bank during the surfactant flood.
Low molecular weight alcohols tend to remain in the aqueous phase7** and can cause a micellar system to becamemore hydrophylic (increase its capacity to absorb water).
77As Jones and Oreher noted , water insoluble alcohols, which tend to partition preferably in the oil phase, reverse these tendencies. Alcohols also have an effect on viscosity. The more water— soluble alcohols produce micellar slugs with lower viscosity than the less water— soluble alcohols77. Anorder of magnitude reduction in viscosity was found by
78Gogarty and Tosch to be very common when one or two percent of either isopropyl or n—butyl alcohol was added.However, the needed concentration of alcohol will vary with
77temperature. As Jones and Dreher observed , increasing temperature increases the affinity of a micellar system for brine and decreases its affinity for oil. Therefore, requirements for a water-insoluble alcohol increase at higher temperatures.
Reproduced with permission of the copyright owner. Further reproduction prohibited without permission.
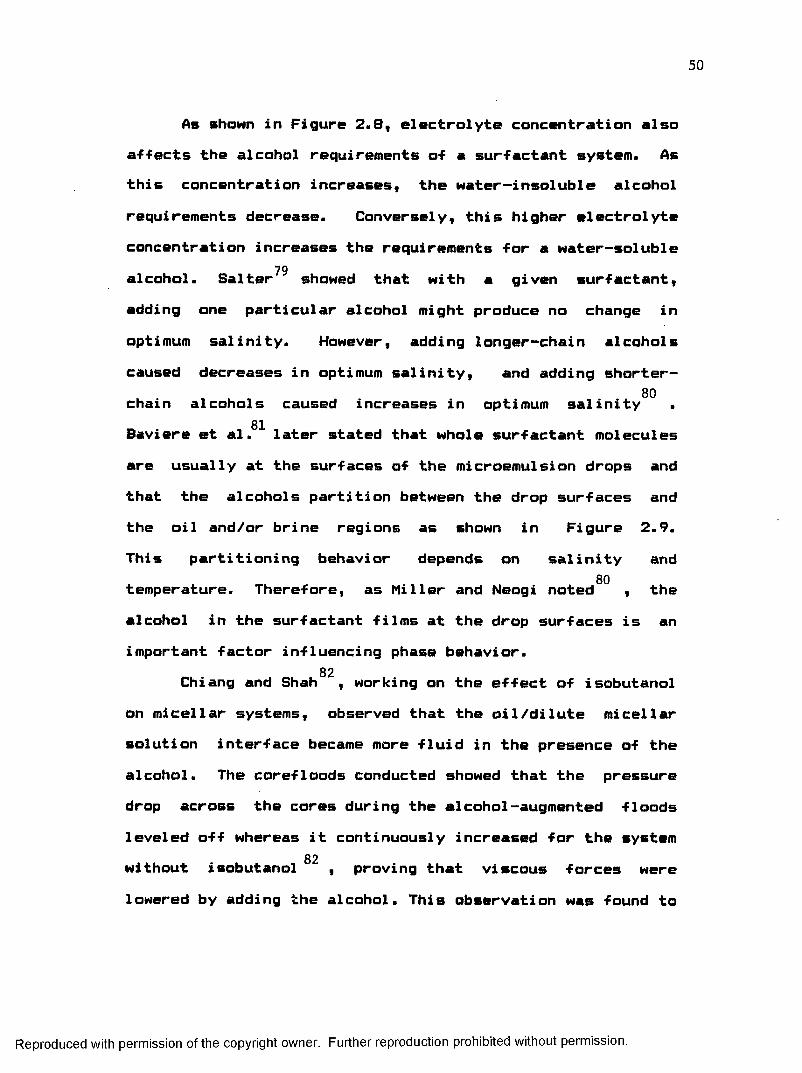
50
As shown in Figure 2.8, electrolyte concentration also affects the alcohol requirements of a surfactant system. As this concentration increases, the water— insoluble alcohol requirements decrease. Conversely, this higher electrolyteconcentration increases the requirements for a water— soluble
79alcohol. Salter showed that with a given surfactant, adding one particular alcohol might produce no change in optimum salinity. However, adding longer— chain alcoholscaused decreases in optimum salinity, and adding shorter-
80chain alcohols caused increases in optimum salinity81Baviere et al. later stated that whole surfactant molecules
are usually at the surfaces of the microemulsion drops and that the alcohols partition between the drop surfaces and the oil and/or brine regions as shown in Figure 2.9.This partitioning behavior depends on salinity and
80temperature. Therefore, as Miller and Neogi noted , the alcohol in the surfactant films at the drop surfaces is animportant factor influencing phase behavior.
82Chiang and Shah , working on the effect of isobutanol on micellar systems, observed that the oil/dilute micellar solution interface became more fluid in the presence of the alcohol. The corefloods conducted showed that the pressure drop across the cores during the alcohol-augmented floodsleveled off whereas it continuously increased for the system
82without isobutanol , proving that viscous farces were lowered by adding the alcohol. This observation was found to
Reproduced with permission of the copyright owner. Further reproduction prohibited without permission.
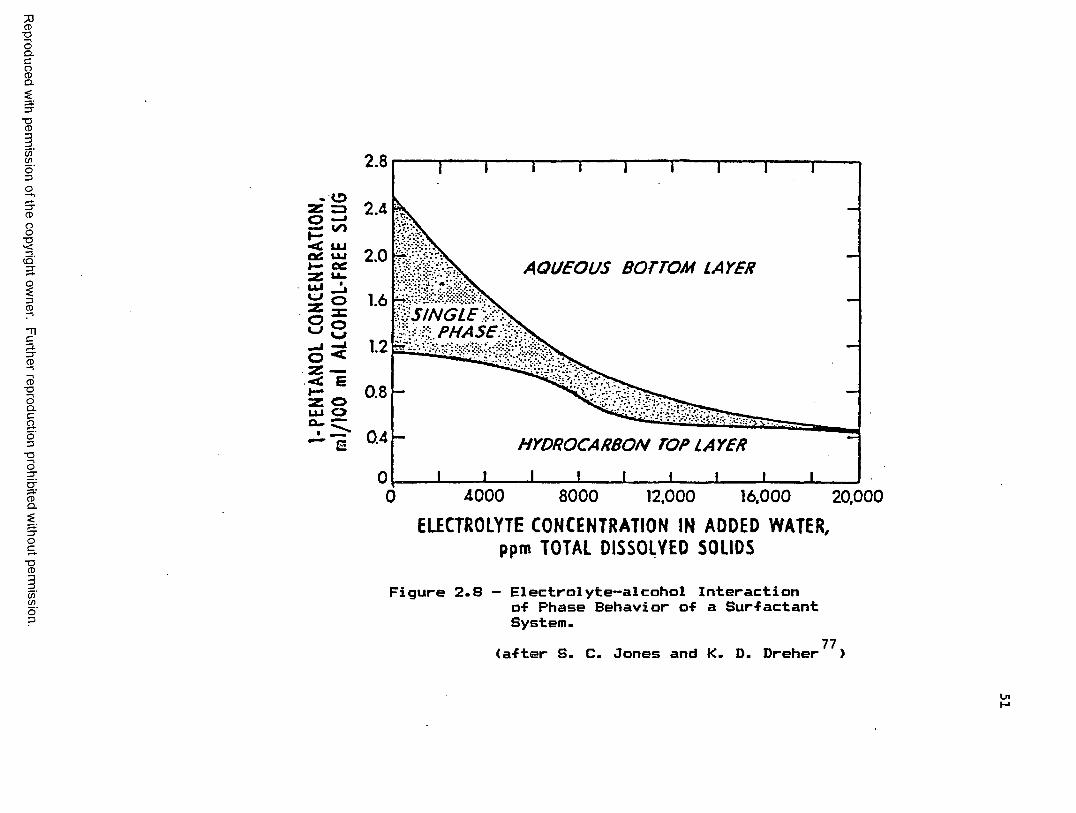
Reproduced
with perm
ission of the
copyright owner.
Further reproduction prohibited
without perm
ission.
2.8
- <3
Zo
oz«*:
COLUUJOCUL.•
ozo
ooE
AQUEOUS BOTTOM LAYER
SINGLE PHASE
XHYDROCARBON TOP LAYER
J 1 t f I > I0 4000 8000 12,000 16.000 20,000
ELECTROLYTE CONCENTRATION IN ADDED WATER, ppm TOTAL DISSOLVED S0LID5
Figure 2.8 — Electrolyte—alcohol Interactiono-F Phase Behavior o-F a Sur-F actant System.
77(after S. C. Jones and K. D. Dreher )
Ui
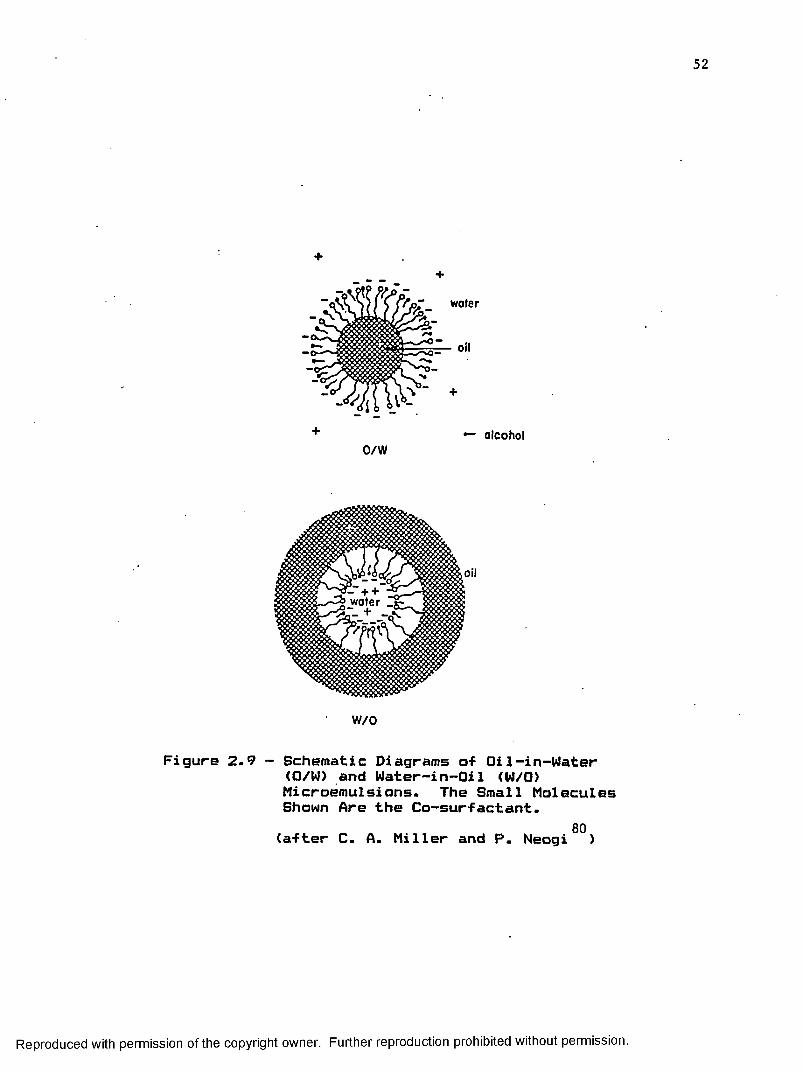
52
++
water
• - alcoholO/W
- “ + + water
W/O
Figure 2.9 - Schematic Diagrams of Oil-in-Water (O/W) and Water— in-Oil (W/0) Microemulsions. The Small Molecules Shown Are the Co-surfactant.
80(after C. A. Miller and P. Neogi )
Reproduced with permission of the copyright owner. Further reproduction prohibited without permission.
53
be consistent with the proposed effect of alcohol, which is to lower interfacial viscosities and promote coalescence of oil ganglia in porous media. The observed improvement in oil recovery could not be explained in terms of any change in 1FT since the same IFT values were obtained for the systems
82 09with and without isobutanol . However, Chiang and Shah observed that alcohol increases the rate of achieving the final value of IFT. This implies that the surfactant, in the presence of the alcohol, comes to the interface much faster.
In an effort to improve alkaline flooding recovery, Nelson et al. used an anionic ethoxysulfate surfactant(Neodol 25-3S) as a co-surfactant. It was observed that low concentrations of such a co-surfactant can raise the concentration of electrolyte required for minimum interfacial tension to alkali concentrations high enough for satisfactory propagation of the alkaline bank. Activity maps as shown in Figure 2.10, which are similar to thesalinity requirement diagrams used in the formulation ofsurfactant floods, illustrate this concept. According to
53Nelson et al. , these activity maps can guide the formulation of co-surfactant-enhanced alkaline floods.
2.6 Hydrocarbon OxidationThe acid number of crude oil may be increased with
83air oxidation. According to Dabbous and Fulton , thereactions between oxygen and petroleum hydrocarbons in a
Reproduced with permission of the copyright owner. Further reproduction prohibited without permission.
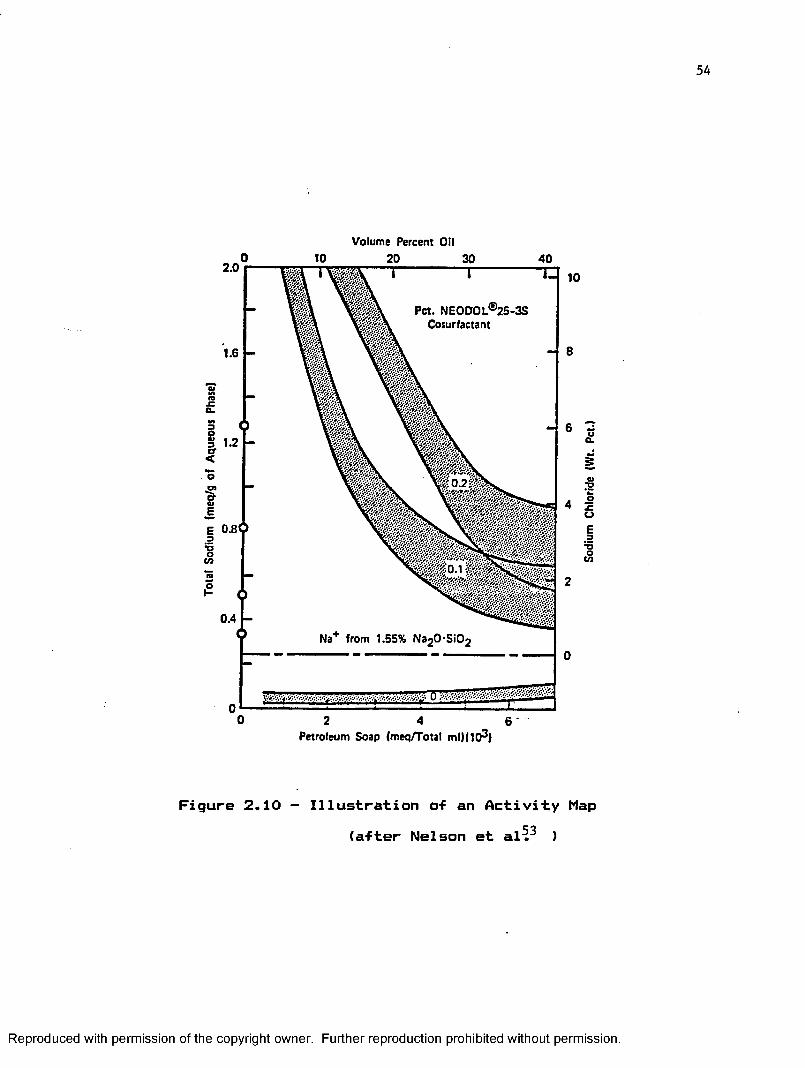
Volume Percent Oil402.0
Pet. NEODOL®25-3S Cosurfactant
1.6
01Mto
asacr<1.2
o•5* ■CPOfEE 0 .8 0 a13 O CO
0.2
IDI
0.4
Na+ from 1.55% Na20-S i02
0 2 4
10
Petroleum Soap (meq/Total ml) (10^)
Figure 2.10 - Illustration of an Activity Map(after Nelson et al^ )
Reproduced with permission of the copyright owner. Further reproduction prohibited without permission.
Sodiu
m Ch
lorid
e (W
t. Pe
t.)
55
porous medium are heterogeneous -flow reactions. Far the reactions to proceed, oxygen must diffuse from the bulk gas stream to the reacting interface, then possibly absorb and react with the hydrocarbons.
The acid content of most crude oils is too low toproduce sufficient amounts of surfactants during a causticwaterflood, thereby limiting caustic flooding applicabilityto only acidic crude oils. Several studies have investigated
84methods to enhance the acid content of crude oils. Sihiwas able to produce carboxylic acids in crude oil by airinjection. Very low oil/caustic brine interfacial tensions were obtained which allowed for successful floods in short berea sandstone cores. The brine solution used contained the caustic concentration yielding the lowest interfacial tension. Sihi's work was continued in a study to determine the effects of oxidation parameters (temperature, pressure,air flowrate, and time) on the acid number of a given crude
85oil. Dahmani determined that increasing temperature, pressure, reaction time, and flowrate increased theoxidation of crude oil, as Figure 2.11 shows. Experimentsat higher pressures (up to 500 psi) were later conducted by
67Cambridge . A strong effect of pressure was found on thedegree of oxidation as shown in Figure 2.12. One canpredict then that oxidation can be obtained even at lower temperatures for reservoir pressures of 1000 psig or higher.
Reproduced with permission of the copyright owner. Further reproduction prohibited without permission.

o 0.5005 0.600
g. 0 .500 0.400
0 .400
cr»
0.300 E 0.200 UJ
CD§> 0.200 Z 0.100
< 0.10050 100 150 200 250 300
P R ESSU R E, psi200 220 240 260
TEM PERATURE, °FO 0.500 6 0.600
cn. f 0.400
a*• f 0.500
0.300 *6 0.400 o>e»
0.200 0.300iii tu
5 0.2000.100
u0.100
100 200 30 0 400 500 A IR FLOWRATE, cc/min
80 100T IM E , hrs
FIGURE2.ilEFFECTS OF PRESSURE, TEMPERATURE, AIR FLOWRATE,
AND OXIDATION TIME ON ACID NUMBER
Reproduced with permission of the copyright owner. Further reproduction prohibited without permission.
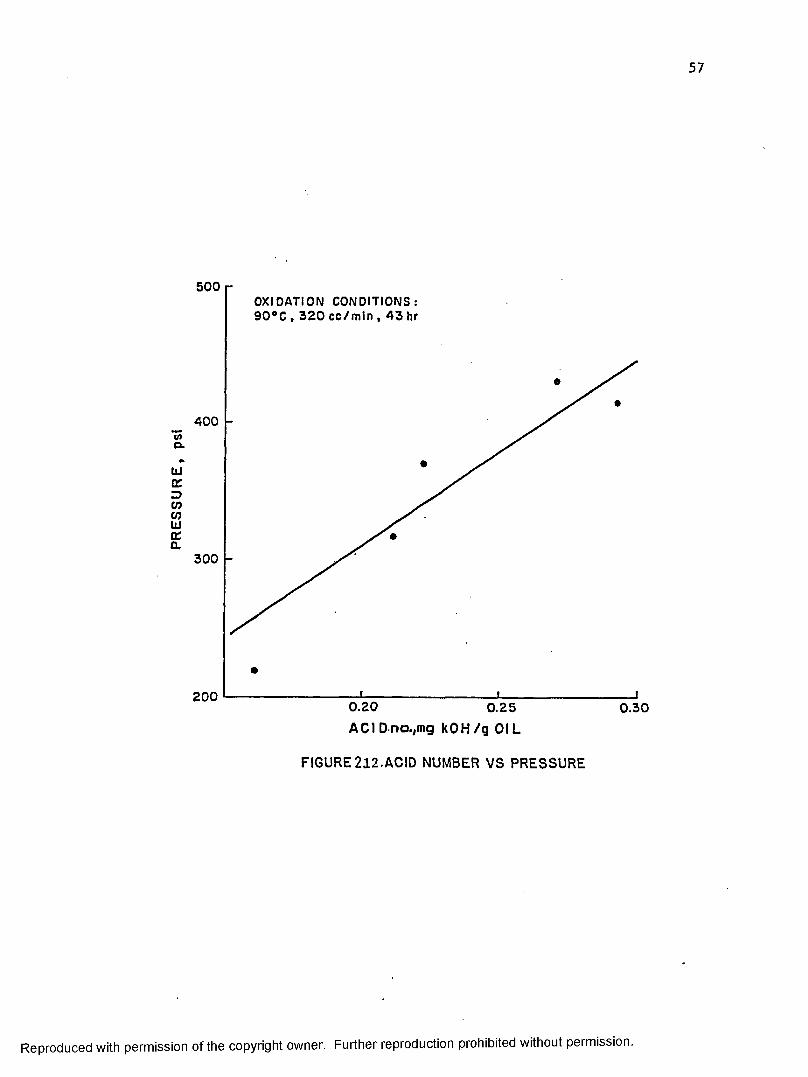
500OXIDATION C O N DITIO N S: 90°C, 320 cc/mln , 43 hr
400</>o.Id X Z> V) UJ Id Xa 300
200 0.20 0.25 0.30AClDna.,mg kOH/g OIL
FIGURE212.ACID NUMBER VS PRESSURE
Reproduced with permission of the copyright owner. Further reproduction prohibited without permission.
58
Oxidation was also achieved at low temperatures and flowrates (in the range o-f actual reservoir conditions) using longer reaction times as shown in Figure 2.13.Because of the possible high costs of air injection, atesting program was initiated to determine the -feasibility of generating acids in oil by injecting a limited amount of air and allowing it to soak with the oil. Table 2.5 shows the results of these soaking experiments conducted byCambridge . Improvements in crude oil acid numbers werenoted and significantly lower interfacial tensions were obtained as shown in Figure 2.14. However, no recovery experiments were performed to determine if interfacially active material capable of improving oil recovery wasproduced by air oxidation.
2.7 Conclusions from the Literature SurveyThe science of caustic flooding is extremely complex
due to the difficulty of defining the physical and chemical properties of the rock/alkaline water/crude oil system. The biggest problem facing alkaline flooding is the optimization of the rock/alkaline water/crude oil interactions. This is due to the fact that many mechanisms can be involved in caustic flooding and also that there are many factors (rock and alkali type, connate water composition, crude oil properties, caustic concentration, temperature, and emulsion characteristics) that affect alkaline flooding. Numerous studies have been or are being conducted in the field of
Reproduced with permission of the copyright owner. Further reproduction prohibited without permission.
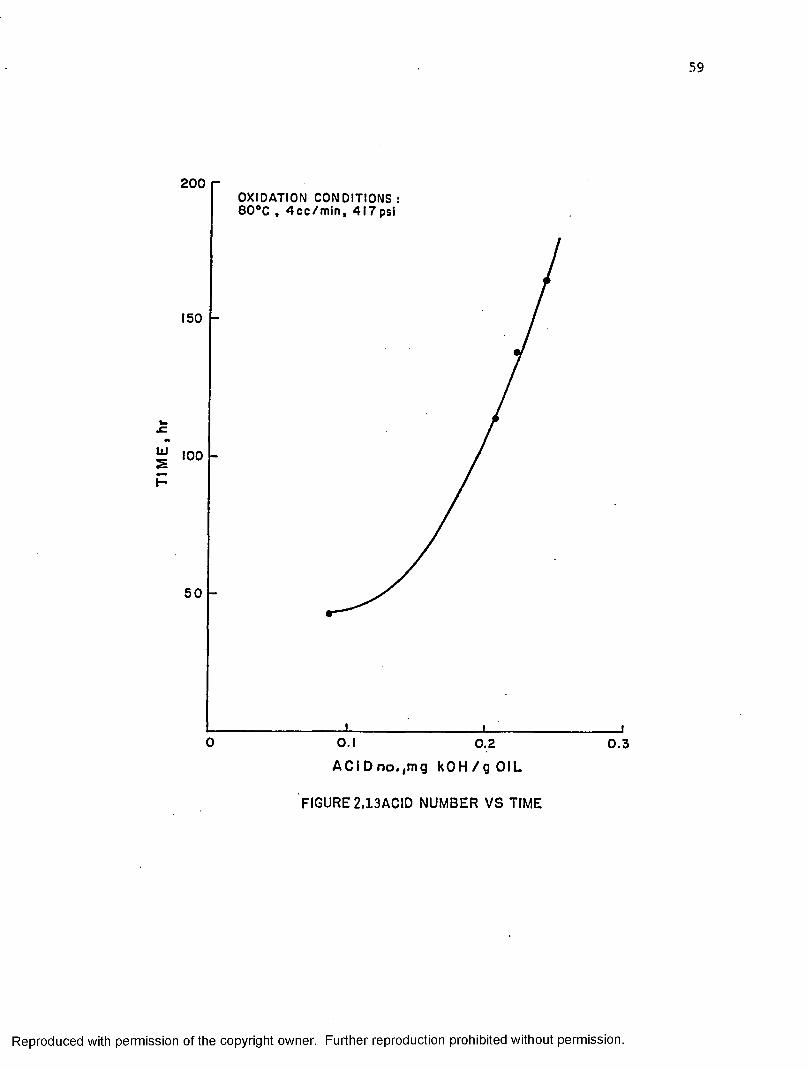
200O XIDATION C O N D ITIO N S: 8 0 °C , 4 c c / m i n , 4 1 7 psi
150
W.C«
g 100
5 0
0 0.1 0.2 0 .3
ACiDno.|mg kOH/gOIL
FIGURE 2.13ACID NUMBER VS TIME
Reproduced with permission of the copyright owner. Further reproduction prohibited without permission.

60
Table 2.5 Acid Numbers of Crude Oils Oxidized withLimited Air InjectionExperiment Pressure Temperature Time Acid Number(psi ) < C) <hrs>
1 450 75 216 0. 1642 435 75 168 0.1313 450 70 504 0.2544 450 75 240 0.1436 450 70 216 0.170
<after V. J. Cambridge,67>
Reproduced with permission of the copyright owner. Further reproduction prohibited without permission.
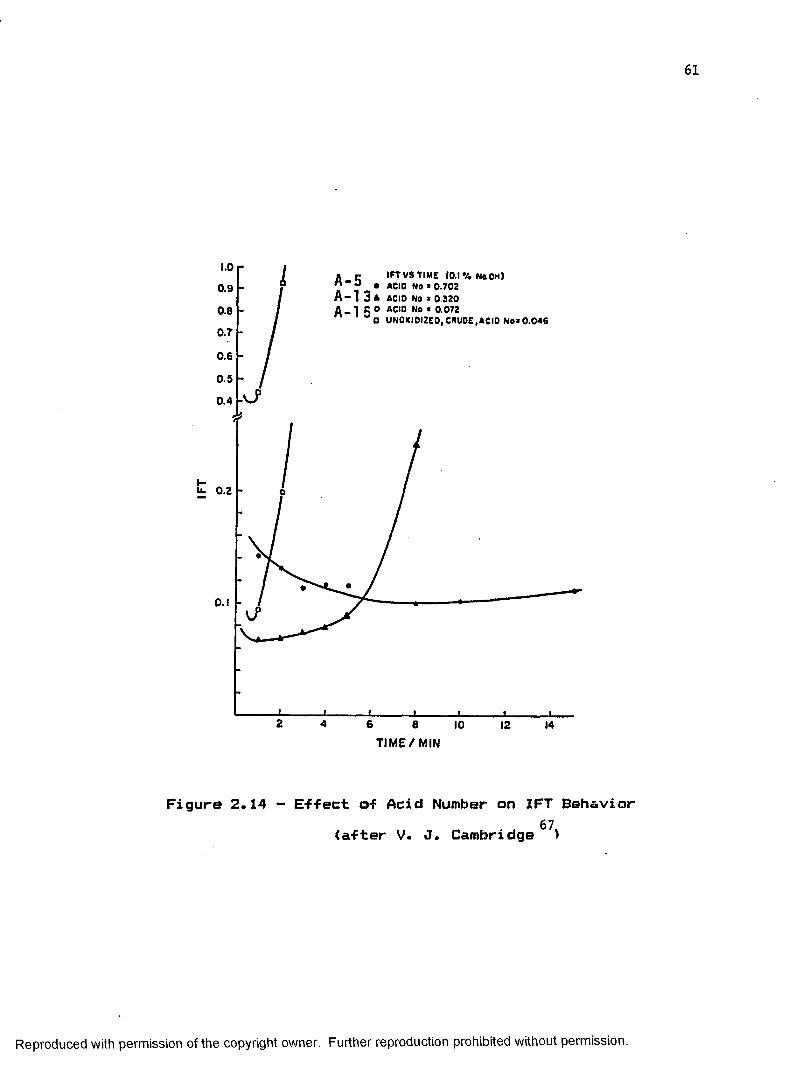
1.0 IFT VS TIME (0.1% NaOH)• ACID No > 0 .702 A-l 3a ACIO No t 0 3 2 0
A-l 5° AC,D No * 0072O UNOXIDIZEO, CRUDE,ACIO N o t 0 .0 4 6
A-50.9
0.80.7
0.60.5
0.4
u- 0.2
2 4 6 8 10 12 14
TIME/MIN
Figure 2.14 - E-f-fect o-f Acid Number on IFT Behavior67(a-fter V. J. Cambridge )
Reproduced with permission of the copyright owner. Further reproduction prohibited without permission.
62
17 44,95rock/fluid reactions ’ . Little research in the areaof co-surfactant-enhanced alkaline flooding has been
53conducted . Components frequently mentioned as possiblealkaline flooding enhancers are surfactants and alcohols. Studies of the effects of alcohols on alkaline flooding were not found in the literature. Thus, a major part of this research will be devoted to the investigation of the effects of certain alcohols on interfacial tension, flow mechanisms and recovery by caustic injection.
The composition of the surface active agents in the crude has been shown to be a major factor in determining IFT behavior. In order to be able to more accurately predictthe performance of an alkaline flood on a particular crude oil, it is necessary to consider the composition of the surface active species present as well as the total acidity or acid number of the crude. Several studies have isolated various crude fractions using long and laborious separationprocedures and attempts have been made to correlate
3 59petroleum properties with surface activities ’ . Moreefficient methods of analyzing and categorizing the surface active species are necessary to provide more reliable screening criteria for the alkaline flooding process. In addition, if the crude properties governing recoveryefficiency were known, it would be easier to design floodformulations to optimize flood performance. The second part of this research will be devoted to the study of two acidic
Reproduced with permission of the copyright owner. Further reproduction prohibited without permission.
63
crude oils that have different behaviors during alkaline flooding procedures. The study will provide further insight into the crude properties responsible for flood performance.
Caustic flooding can be applied only to a limited number of reservoirs. Crude oils with low acid numbers (less than 0.1 mg of KQH/gm of oil) are usually ruled out because they do not contain enough acids to produce surface active agents capable of mobilizing the entrapped oil. To increase the general utility of caustic flooding, i.e., to increase the number of crude oils suitable for causticflooding, crude oils with low acid numbers were oxidized in
85 67previous studies * by air injection to increase their acid number. To complete these studies, the oxidized crudes must be tested to determine if oxidation improves response to alkaline flooding.
Reproduced with permission of the copyright owner. Further reproduction prohibited without permission.
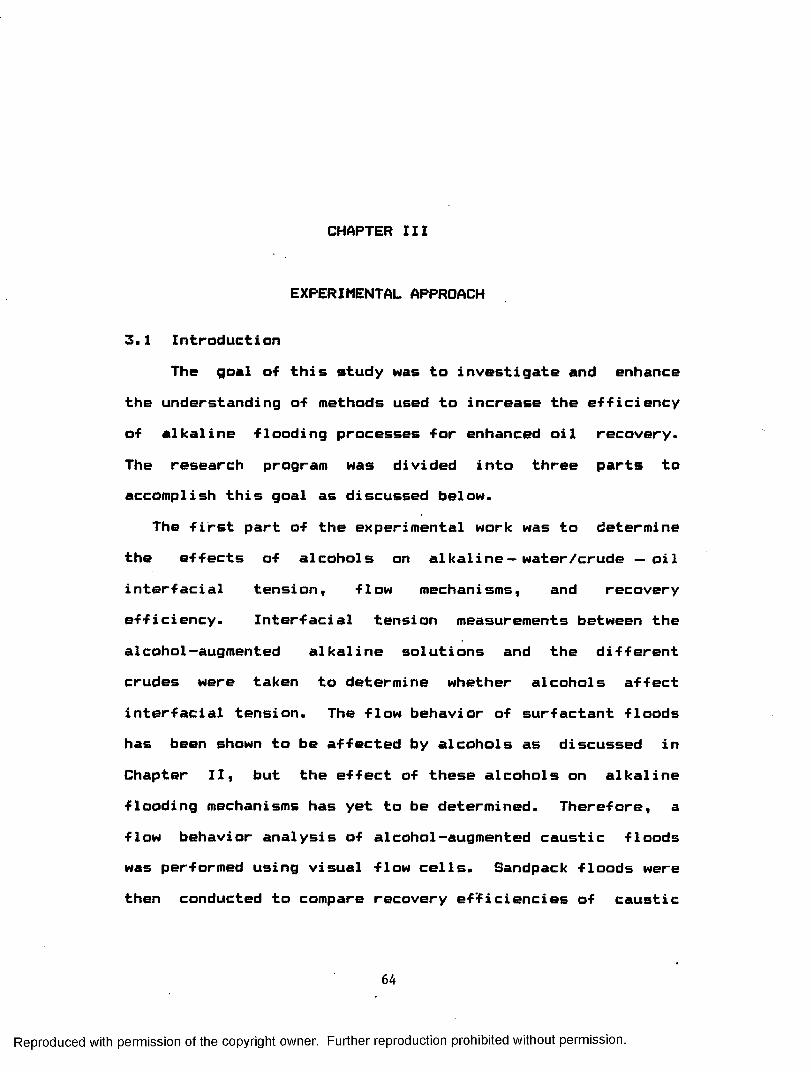
CHAPTER III
EXPERIMENTAL APPROACH
3.1 IntroductionThe goal of this study was to investigate and enhance
the understanding of methods used to increase the efficiency of alkaline flooding processes for enhanced oil recovery. The research program was divided into three parts to accomplish this goal as discussed below.
The first part of the experimental work was to determine the effects of alcohols on alkaline— water/crude — oil interfacial tension, flow mechanisms, and recovery efficiency. Interfacial tension measurements between the alcohol-augmented alkaline solutions and the different crudes were taken to determine whether alcohols affect interfacial tension. The flow behavior of surfactant floods has been shown to be affected by alcohols as discussed in Chapter II, but the effect of these alcohols on alkaline flooding mechanisms has yet to be determined. Therefore, a flow behavior analysis of alcohol-augmented caustic floods was performed using visual flow cells. Sandpack floods were then conducted to compare recovery efficiencies of caustic
64
Reproduced with permission of the copyright owner. Further reproduction prohibited without permission.
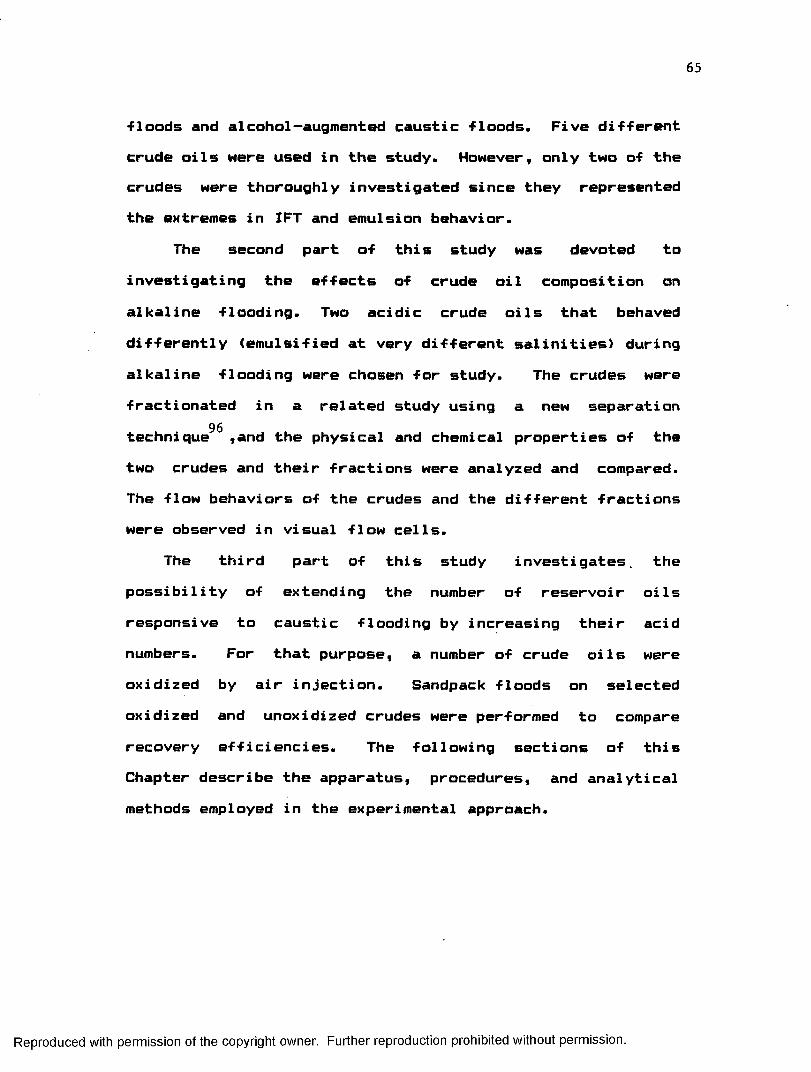
65
■Floods and alcohol—augmented caustic floods. Five different crude oils were used in the study. However, only two of the crudes were thoroughly investigated since they represented the extremes in IFT and emulsion behavior.
The second part of this study was devoted to investigating the effects of crude oil composition on alkaline flooding. Two acidic crude oils that behaved differently (emulsified at very different salinities) during alkaline flooding were chosen for study. The crudes were fractionated in a related study using a new separation technique9 ̂,and the physical and chemical properties of the two crudes and their fractions were analyzed and compared. The flow behaviors of the crudes and the different fractions were observed in visual flow cells.
The third part of this study investigates, the possibility of extending the number of reservoir oils responsive to caustic flooding by increasing their acid numbers. For that purpose, a number of crude oils were oxidized by air injection. Sandpack floods on selected oxidized and unoxidized crudes were performed to compare recovery efficiencies. The following sections of this Chapter describe the apparatus, procedures, and analytical methods employed in the experimental approach.
Reproduced with permission of the copyright owner. Further reproduction prohibited without permission.
66
3.2 Experimental Apparatus and Procedures3.2.1 Interfacial Tension Measurements
Interfacial tension measurements were made between the crude oils and brine solutions containing different concentrations of sodium hydroxide, sodium chloride, and alcohol. The measurements were made on a Model 300 SpinningDrop Interfacial Tensiometer developed by J. L. Cayias et
87al. of the University of Texas at Austin. The instrument is shown in Figures 3.1,2.
In the spinning drop technique, a drop of the oil phase is injected into a capillary tube containing the aqueous phase and the tube is spun at high speed. The interfacial tension, which tries to minimize interfacial area, counteracts the gyrostatic pressure differential which tends to minimize drop diameter. An empirical measurement of theinterfacial tension between the two fluids can then be
87obtained by measuring the oil drop diameter .87The following equation, developed by Cayias et al. for
the Model 300 interfacial tensiometer, was used to determine the oil/caustic brine interfacial tension (IFT):
d 3' ApIFT <dynes/cm> * 522,032 ------- 3.1
P2
Where:d = thickness of the elongated oil drop, cm
Reproduced with permission of the copyright owner. Further reproduction prohibited without permission.
POWCRa m p l if ie r
MOTORCONTROL
BOX
FREOUENCY tem per atu r eCOUNTER CONTROLLER
SIGNAL STROBEGENERATOR s u p p l y
MOTOR
b
SCOPE
rotor a s s ’ y
LAMP
SP IN N IN O «OROP APPAR ATU S
F i g u r e 3 . 1 - S c h e m a t i c o f s p i n n i n g - d r o p a p p a r a t u s
Slotted Disk
RubberSeptum
BrassShaft
D.C. Motor Generator
F i g u r e 3 . 2 - S c h e m a t i c o f R o t o r a s s e m b l y ( A f t e r C a y i a s e t a l 7 )
Reproduced with permission of the copyright owner. Further reproduction prohibited without permission.
68
Ap ■ density di-f-ference between the oil and the aqueous phase, gm/ml
p = period of spinning, msec/rev.
The capillary tubes were soaked in an alcoholic potassium hydroxide solution to remove any organic contaminant. The tubes were rinsed in dilute HC1, distilled water, and then flushed twice with the aqueous solution to be used before they were filled. A TL-80300-10yl Hamilton syringe was used to inject a 2yl drop of oil in the aqueous solution. Care was taken to eliminate any air bubbles in the pyrex glass tube. After the capillary tube was capped, it was placed in the instrument and spun at a preset speed
Q Qof 7500 rpm (8 msec/rev.). As Manning et al. noted, this allows the oil/water system to reach gyrostatic equilibrium almost instantaneously. Measurements of the oil drop diameter were then made by means of the traveling scales in the instrument microscope at the desired time intervals. The measurements were used in Equation 3.1 to determine interfacial tensions of crude Dil/alkaline water systems.
As suggested by Cambridge*’7, the interfacial tensiometer was run for one hour to allow the housing temperature to stabilize before the capillary tube was inserted and measurements were taken. All the IFT measurements were performed at the stabilized instrument temperature of 31°C.
Reproduced with permission of the copyright owner. Further reproduction prohibited without permission.
69
3.2.2 Flow Behavior Analysis in Flow CellsThe -flow behavior o-F fluids in porous media can best be
observed in micromodel flow cells. The visual flow cells used in this study were similar to the ones used by Sykes73, Bourgoyne3̂ t and later Mathews^. However, some changes were made to their design and construction.
1. Description of the CellsAs shown in Figure 3.3, two window glass plates were
used as the top and bottom of the flow cells. The bottom plate was a double-strength window glass 10 in. long, 1 in. wide and 1/S in. thick. The top plate was a single strength window glass 10 in. long, 1 in. wide, and 5/64 in. thick. Two 1/8 in. holes were drilled in the top plate using a Dremel variable speed drill Model 3801 and tungsten-carbide bits. The holes were approximately 1/2 in. from each end of the plate.
Two stainless steel 1/8 in. Swagelok caps with 1/16 in. holes drilled through them were placed on top of the holes in the plate and bonded to the glass with Devcon EK-1 epoxy. Two sections of 28 gauge <0.015 in. diameter) nichrome wire were then looped around the bottom plate about 1/4 in. from each side. The top plate was placed on top of the bottom plate with the spacing wire between them and the two plates were then clamped with binder clips. The plates were bonded together by allowing clear, waterproof Devcon 2-ton epoxy to
Reproduced with permission of the copyright owner. Further reproduction prohibited without permission.

70
crvollee crystals
nlchrome vires1/8" svagelok cap
..\f11 "
oo
boccom place
Figure 3.3 SCHEMATIC OF THE FLOW CELLS
Reproduced with permission of the copyright owner. Further reproduction prohibited without permission.
71
imbibe between the plates until it reached the nichrome wire.
The porous medium injected into the cell consisted of cryolite crystals. Cryolite (Na^AlFgHs a highly water— wet mineral -Found in Greenland, with a re-Fractive index very near that o-F water. The cryolite rock was purchased -from Ward's Natural Science Establishment, Inc.. It was then crushed and sieved to 100 to 150 mesh (approximately 0.006 in. to 0.0045 in. respectively) to be representative of reservoir rocks.
The packing procedure consisted o-F applying a vacuum on one end o-F the cell through a glass wool -filled -Fitting and injecting the cryolite crystals through the other fitting. The glass wool prevented the cryolite from entering the vacuum pump during the procedure wherein the cell was tapped gently to pack the cryolite crystals as closely as possible.
The porous medium was then consolidated by injecting a fresh mixture of tetraethyl orthosilicate (60% by volume), ethanol (32% by volume), and 0.IN HC1 (8% by volume). Most of the mixture was removed from the cell by drawing air through the porous medium for five hours using a vacuum pump. The rest of the orthosilicate mixture precipitates into non-reactive silica at the points of contact between the cryolite crystals themselves and also between the crystals and the glass plates. At this point the porous medium is consolidated and the cell is ready for use.
Reproduced with permission of the copyright owner. Further reproduction prohibited without permission.

72
2. Preparation and Utilization of the CellsThe air in the porous cryolite medium was displaced by
injecting a 10,000 ppm NaCl solution for three consecutive days. A Sage Instruments syringe pump Model 355 was used for that purpose, as shown in Figure 3.4.
The porosity of the flow cells was then calculated by taking the ratio of the amount of water in the cell over the volume of the empty cell, i.e.:
where,<j> = Porosity of the core,
Vw = Volume of water in the porous cryolite medium of the cell, cm3
Vc * Volume of the cell without the porous cryolite medium,3cm J.
For the cells used in this study,VtT = 0.49 cm3
W
V = 0.99 cm3c0.49
(jj s ------ = 0 . 4 9 50.99
The absolute permeability of the porous cryolite medium90was calculated using the following equation :
6.328 K A APq = 3.3
V L
Reproduced with permission of the copyright owner. Further reproduction prohibited without permission.
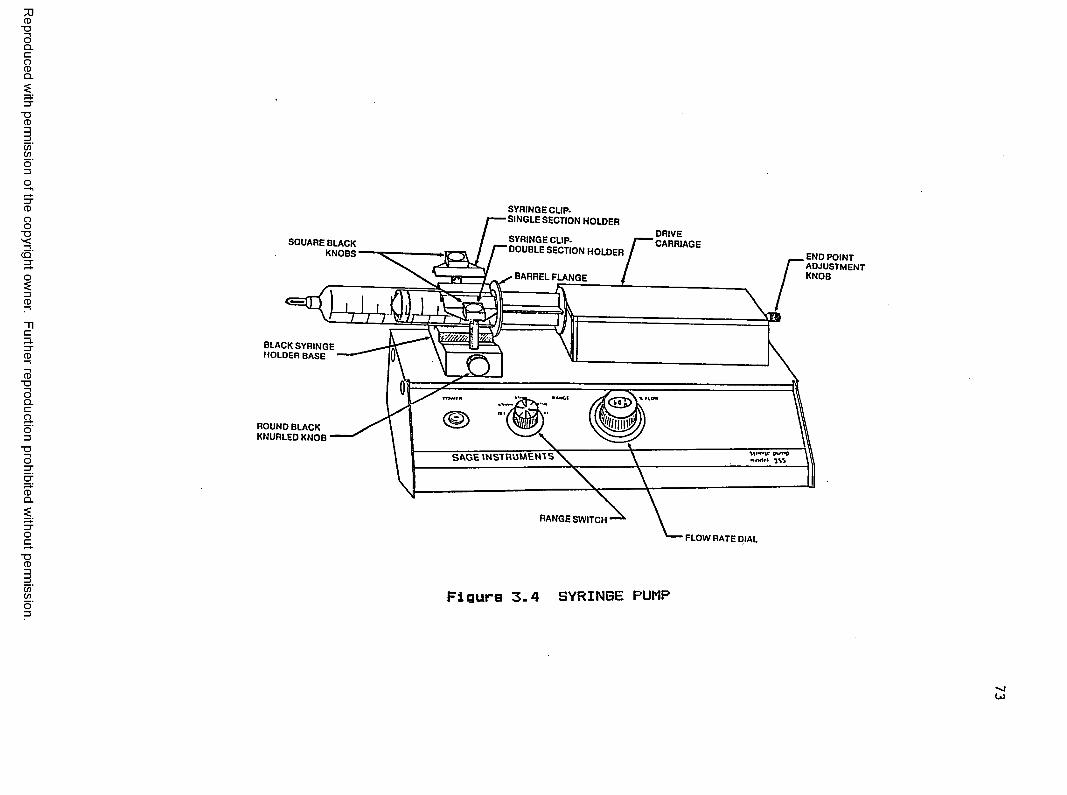
Reproduced
with perm
ission of the
copyright owner.
Further reproduction prohibited
without perm
ission.
SYRING E CLIP-SING LE SECTION HO LDER
SYRING E C U P - DOUBLE SECTION HOLDER
DRIVECARRIAGESQUARE BLACK
KNOBS END PO IN TAD JUSTM ENTKNOBy BARREL FLANGE
BLACK SYRING E HOLDER BASE
RO UND BLACK KNURLED KNOB
S A G E IN S T R U M E N T S
RANG E SW ITCH
FLO W RATE DIAL
Figure 3 . 4 SYRINGE PUMP
OJ
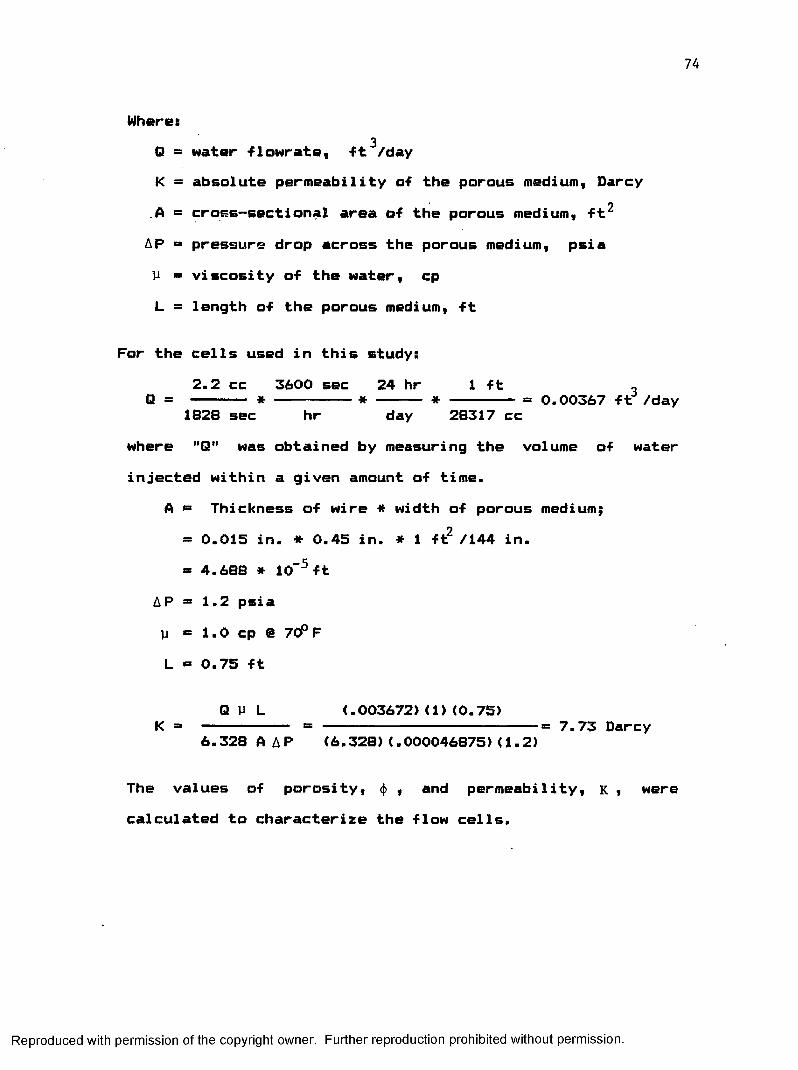
74
Where:3Q = water -flowrate, -ft /day
K = absolute permeability of the parous medium, Darcy A = cross-sectional area o-f the porous medium, -ft2
A P - pressure drop across the porous medium, psiaU ■ viscosity of the water, cpL = length of the porous medium, ft
For the cells used in this study:2.2 cc 3600 sec 24 hr 1 ft ,
Q = *--------- * ------ * ------- a 0.00367 ft /day1828 sec hr day 28317 cc
where "Q" was obtained by measuring the volume of waterinjected within a given amount of time.
A *= Thickness of wire # width of porous medium;- 0.015 in. * 0.45 in. * 1 ft2 /144 in.- 4.688 * 10“5 ft
A P s 1.2 psiaV - 1.0 cp @ 7CPF L - 0.75 ft
Q V L (.003672)(1)(0.75)K = ■ a 7.73 Darcy
6.328 A A P (6.328)(.000046875)(1.2)
The values of porosity, <f> , and permeability, K , were calculated to characterize the flow cells.
Reproduced with permission of the copyright owner. Further reproduction prohibited without permission.

75
All the -fluids were injected through the -flow cells in a horizontal orientation (0° dip) with the syringe pump shown previously in Figure 3.4. The -following flooding procedure was used:
a) The cryolite medium was saturated with water of a predetermined NaCl concentration.
b) The water saturated medium was driven to residual water saturation by slowly injecting the crude oil of interest for one day.
c) The flow cells were not used for 2 days to allow equilibrium between crude oil, water, and cryolite to be reached.
d) Waterfloods and caustic floods were performed at a velocity of less than 1 ft/day to simulate reservoir fluid velocities.
e> Photos of the flow behavior of the fluids in theflow cells were taken during the flooding procedure, as discussed in the next section.
f) After the floods were conducted, the flow cells were cleaned by first injecting toluene until all the crude oil was removed. Then ethanol was injected to remove alcohol-soluble material, and finally a brine solution was injected to displace the ethanol.
g) Each cell was used twice and was then discarded due to the possible wettability alteration of the cryolite.
Reproduced with permission of the copyright owner. Further reproduction prohibited without permission.
76
h> The experiments were performed at atmospheric pressure and room temperature (approximately 76°F).
3. Microphotographic Analysis of Flow BehaviorA microphotographic technique was developed for taking
color slides of the flow behavior of fluids in the flow cells. For this purpose, an Olympus microphotographic system Model PM-10AD was used. The system includes a microscope with a 35 mm camera and an automatic exposure control unit.
Due to the fact that cryolite becomes transparent when wetted by water, it is possible to observe the flow behavior inside the porous medium using transmitted light through the flow cell. The rack/fluid system magnification was in the
QQorder of 10 to 50X. Flow cells used by Mathews would only allow 10X magnification due to the thickness of the top glass plates. The top glass plates used in the present study were 5/64 in. thick, i.e., nearly half the thickness of the ones used by Mathews. This increased range of magnification makes it possible to analyze the flow behavior of fluids inside the pores in more detail. Kodak Ektachrome Tungsten 160 color film, and the automatic exposure control unit were used to record the fluid flow observed inside the celIs.
Reproduced with permission of the copyright owner. Further reproduction prohibited without permission.
3.2.3 Recovery Efficiency ExperimentsThe purpose of the recovery efficiency experiments was
to obtain comparative data between the different alkaline floods. Unconsolidated cores (sandpacks) were used since they give results that are easily reproducible. This is due to the high reproducibi1ity of porosity and permeability of these sandpacks. Also, since pressure is not expected tohave a large effect on caustic flooding, the floods were run
78at atmospheric pressure . There was no need to run the floods at temperatures other than room temperature (76 °F) because this study was not oriented towards any particular reservoir and only fundamental comparative results were needed.
1. Core characteristics 120-170 mesh Ottawa sand (with a neutral pH), obtained
from the Ottawa Industrial Sand Company of Ottawa, Illinois, was used as the unconsolidated core. The sand was packed in a plexiglass transparent core holder 12 in. long, with an outside diameter of 2 in. and an inside diameter of 1.5 in. Two snap-ring connectors were attached to each side of the core holder. The volume of the core holder was measured to be 338 cm^.
To prevent air bubbles from forming during the packing of the core, water was poured in the core holder before the Ottawa sand was added. The sand was poured in the water— filled core holder at a constant rate to obtain uniform
Reproduced with permission of the copyright owner. Further reproduction prohibited without permission.
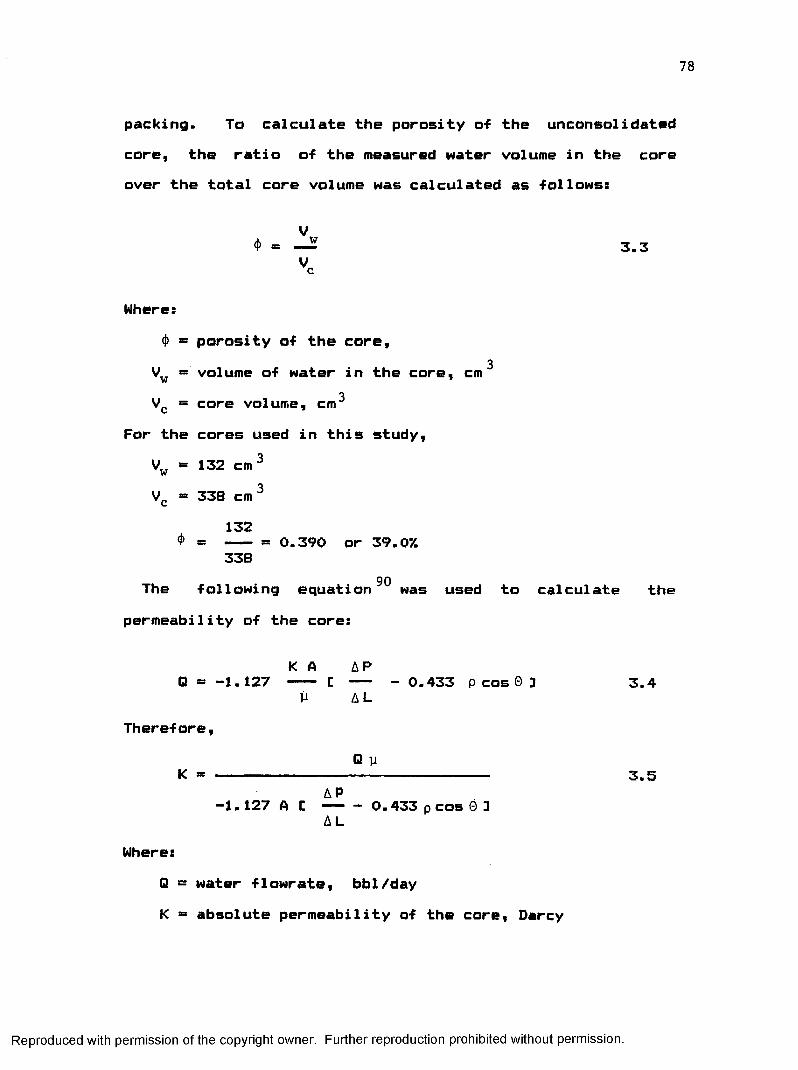
78
packing. To calculate the porosity of the unconsolidated core, the ratio of the measured water volume in the core over the total core volume was calculated as follows:
Where:<j> = porosity of the core,
3Vw = volume of water in the core, cmOVc = core volume, cm
For the cores used in this study,V„ = 132 c m 3 Vc - 338 c m 3
132<f> = = 0.390 or 39.07.
33890The following equation was used to calculate the
permeability of the core:
K A A PQ =* -1.127 C - 0.433 p cos 0 3 3.4
V A LTherefore,
Q yK * ------------------------------- 3.5AP-1.127 A [ 0.433 p cos 9 JA L
Where:Q = water flowrate, bbl/day K = absolute permeability of the core, Darcy
Reproduced with permission of the copyright owner. Further reproduction prohibited without permission.
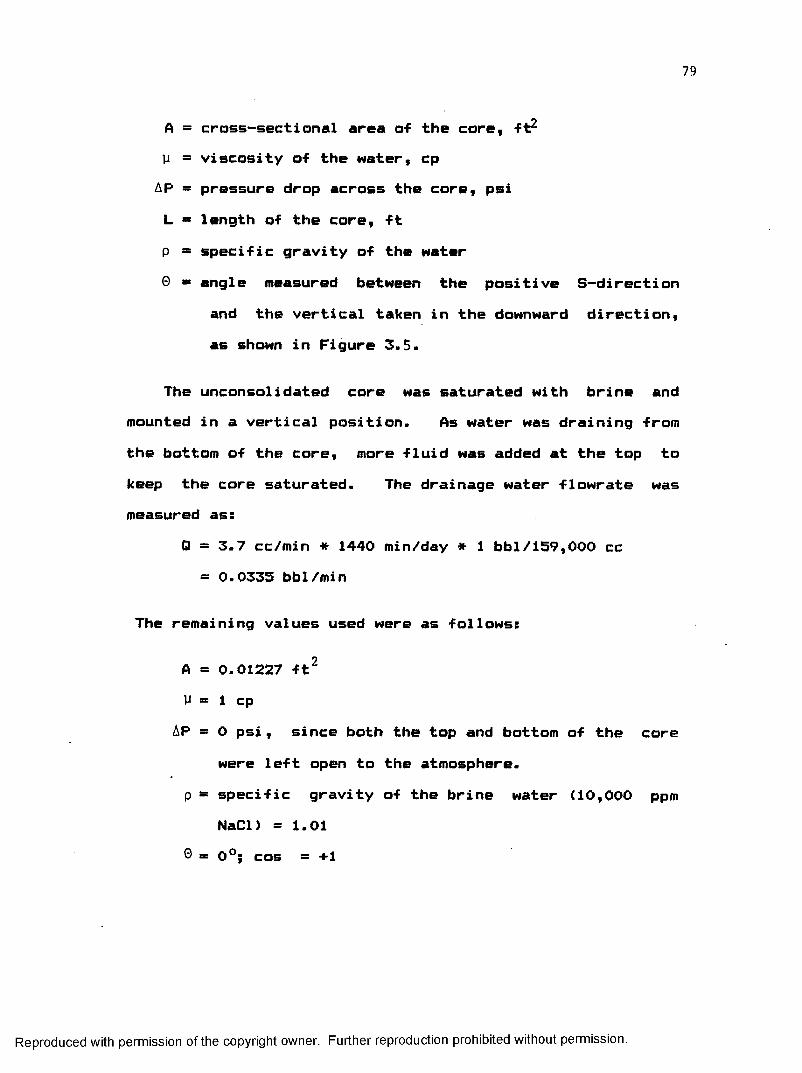
79
A = cross-sectional area of the core, ft^y = viscosity of the water, cpAP = pressure drop across the core, psiL ” length of the core, ftp = specific gravity of the water0 « angle measured between the positive S-direction
and the vertical taken in the downward direction, as shown in Figure 3.5.
The unconsolidated core was saturated with brine and mounted in a vertical position. As water was draining from the bottom of the core, more fluid was added at the top to keep the core saturated. The drainage water flowrate was measured as:
Q = 3.7 cc/min * 1440 min/day * 1 bbl/159,000 cc = 0.0335 bbl/min
The remaining values used were as follows:
A - 0.01227 ft2 y «s i cp
AP = 0 psi, since both the top and bottom of the core were left open to the atmosphere,
p = specific gravity of the brine water (10,000 ppm NaCl) = 1.01
© = 0°; cos = +1
Reproduced with permission of the copyright owner. Further reproduction prohibited without permission.
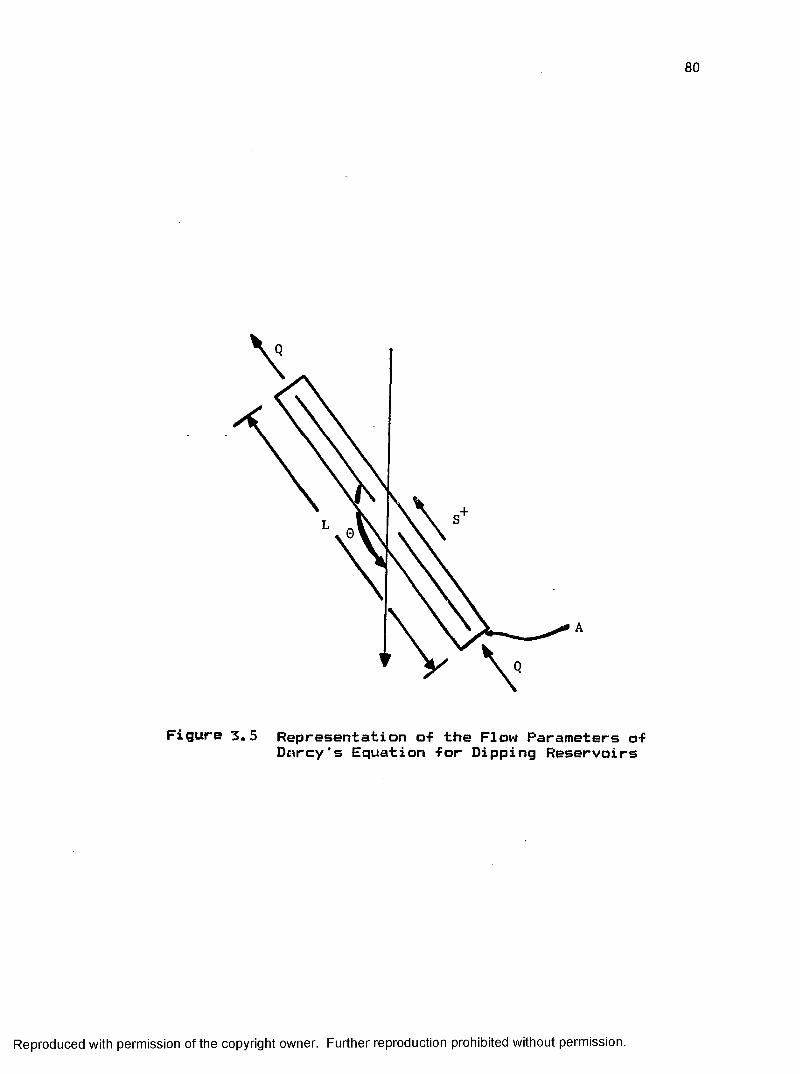
80
Figure 3.5 Representation o-f the Flow Parameters o-F Darcy's Equation -for Dipping Reservoirs
Reproduced with permission of the copyright owner. Further reproduction prohibited without permission.

81
Theref ore,(.0335)<1>K = --------------------------------------- 5.54 Darcy
-1.127(.01227)E 0 - (.433)(1.01)(+1)3
The values of porosity and permeability calculated above are in the same range as the values calculated for the flow cells.
2. Flooding ProcedureThe apparatus shown in Figure 3.6 was used for the
sandpack floods. The fluids to be injected were first poured into a 2-liter plastic container. The container was connected to a Fluid Metering, Inc. (FMI) positive displacement laboratory pump Model No. RP-G6. The outlet of the pump was connected to a pulse dampener to produce a constant flowrate of fluids to the core. The pulse dampener was followed by a micrometer to regulate fluid flow. The flowline coming out of the micrometer was connected to the upright core from the bottom if the fluids used were brines or caustic solutions. If crude oil was injected, it was first poured into a plexiglass displacement cylinder connected to the micrometer from the bottom end and to the top of the core from the top end. This way, the crude oil was displaced by a brine solution injected from the pump into the bottom of the displacement cylinder. Crude oil then entered the brine saturated core from the top, producing a gravity stable displacement and ensuring the
Reproduced with permission of the copyright owner. Further reproduction prohibited without permission.
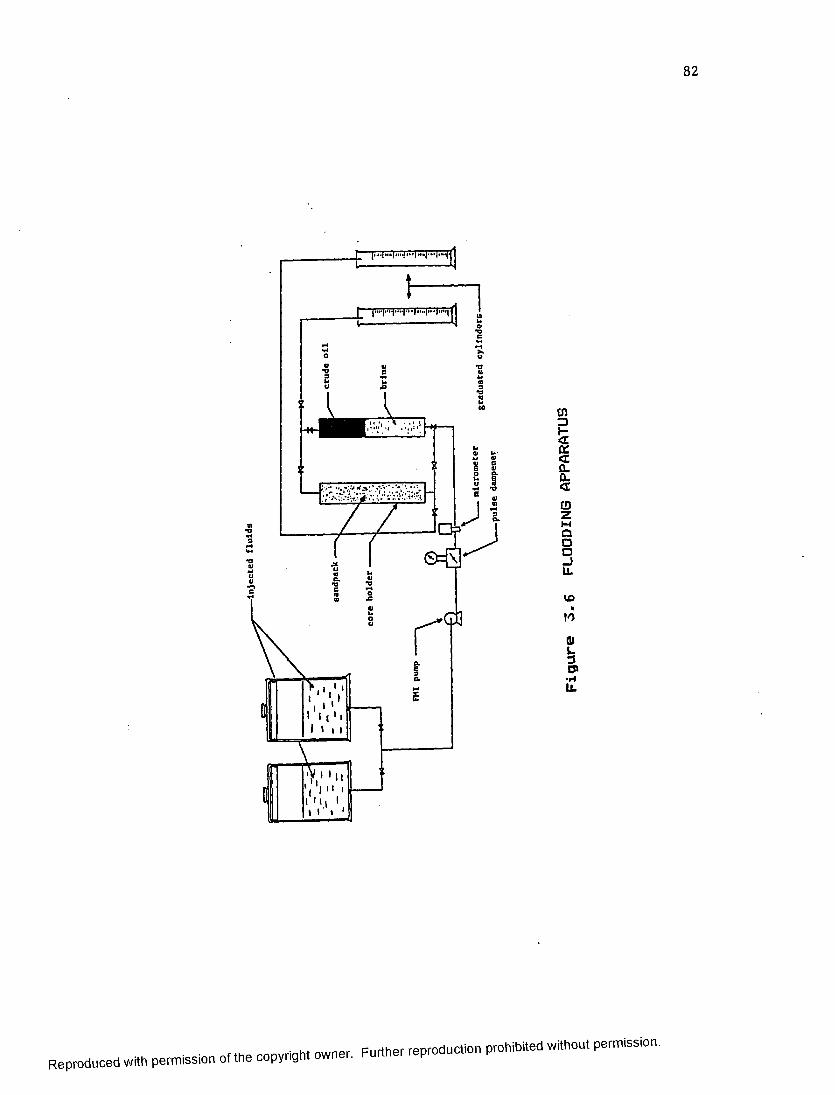
i 11'.1111
Vi" ' 1 111 1 1 It '
Reproduced with permission of the copyright owner. Further reproduction prohibited without permission.
Figure
3.6
FLOODING
APPA
RATU
S
83
reduction of the brine saturated core to residual water saturation. The oil saturation <SQ) of the core wascalculated by taking the ratio of the displaced water volume <Vwd> over the pore volume <Vp). Residual water saturation (Swr ) was simply calculated as 1-S0 , i.e.:
Where:SQ « initial oil saturation of the core
- residual water saturationVwd = water displaced from the core by the crude oil
3injected, cmVp = pore volume, cm3
After the core was saturated with oil, it was undisturbed for two days to allow the rock and the fluids to reach equilibrium. Plain waterfloods and caustic waterfloods were then conducted by injecting fluids into the bottom of the core to ensure a gravity stable system. Injection rates were adjusted so that fluid velocities did not exceed 1 ft/day, and the produced fluids were collected in a graduated cylinder. The recovery efficiencies of the floods were calculated by measuring the amount of crude oil produced. If an emulsion was obtained, it was broken by
Reproduced with permission of the copyright owner. Further reproduction prohibited without permission.
84
adding both hydrochloric acid (3 ml o-f a 12N HC1 solution) and a measured amount of toluene to recover oil sticking*tc the sides of the containers. Separation was obtained by spinning the sample in an IEC-Centra-7 centrifuge for 30minutes at 2800 rpm. Color slides of the floodfrants andthe core were taken to compare flow behaviors, using a Minolta SRT 201 camera equipped with a 45 mm lens.
3.2.4 Oxidation of Crude OilTo investigate .the effects of oil oxidation on recovery
efficiency, a comparison was made between the recovery efficiencies of unoxidized and oxidized crudes by conductingcaustic waterfloods in sandpacks. This project was a
85continuation of the study described by Dahmani and Cambridge
The equipment shown in Figure 3.7 was used to perform the oxidation experiments. An unconsolidated core was packed into a stainless steel tube 14 in. long, with an inside diameter of 1.5 inches. The core porosity wasapproximately 40%, with an oil saturation of 40V. and a water saturation of 60%. This water— to-oil ratio simulates a waterflooded core condition. The tube was placed in an oven and heated to the desired temperature. A temperature probe inserted inside the stainless steel tube allowed themonitoring of the core temperature. Nitrogen was flowed through the tube during the heating period to prevent any oxidation. After reaching the desired temperature, air was
Reproduced with permission of the copyright owner. Further reproduction prohibited without permission.

Reproduced
with perm
ission of the
copyright owner.
Further reproduction prohibited
without perm
ission.
inlet pressure gauge fitter
3 way valve
temperature readout
oven
temperature probe
outlet pressure gaugefilter
I X Air
core
•>-to venttrap
flowmeter
pressure regulator flow control valve
Figure 3.7 OXIDATION APPARATUS
00Ui

86
injected at a predetermined flowrate, inlet and outlet pressure, and for an appropriate length of time. The oven was then turned off and the tube was allowed to cool slowly while nitrogen was again passed through it. The unconsolidated core was removed from the tube and washed with toluene until all oil was extracted. The oxidized oil was prepared for analysis by removing the toluene with a RE-120B rotary evaporator.
Corefloods were conducted for several of the unoxidized and oxidized crudes to compare recovery efficiencies. For this purpose, the method previously described in Section3.2.3 was used.
3.2.5 Fractionation of the Crude OilCrude oils from the Tullos and Vinton Fields in
Louisiana were fractionated in a related study ̂ . The following procedure was used to isolate the asphaltenes (polycyclic structure, non-volatile solid) and the acidic components (mainly carboxylic acids):
1. Twenty grams of crude oil were dissolved in 400 ml of pentane and allowed to mix overnight. The pentane solution was filtered through a double-walled cellulose Soxlet extraction thimble. The thimble was then placed in a Soxlet extractor and washed with pentane to remove residual oil. The asphaltene fraction (fraction AA) was extracted by refluxing toluene through the thimble and evaporating the solvent on a rotary evaporator.
Reproduced with permission of the copyright owner. Further reproduction prohibited without permission.
87
2. Forty grains o-f ion exchange medium (J.T. Baker's bonded phase-quanternary amine) Mas Mashed tMice Mith methanol (MeOH). The ion exchange medium Mas then converted to the hydroxide -form by Mashing it tMice Mith a NH^OH/MeGH solution <2 ml o-f NH4OH in 100 ml o-f MeOH). The solid phase Mas alloMed to soak in the NH40H solution for five minutes before filtering. The solid phase Mas then Mashed Mith MeOH until the filtrate Mas neutral, Mashed tMice Mith pentane, and then air dried.
3. The ion exchange medium Mas packed into a glass Soxlet extraction thimble (coarse frit), and a piece of filter paper Mas placed on top of the solid phase and pentane Mas refluxed through the medium until all air bubbles Mere removed.
4. Deasphaltenated crude (20 gms) obtained from the pentane solution (Step 1) Mas placed on the ion exchange medium and pentane Mas refluxed through the thimble (usually overnight) until the extract Mas clear. Pentane Mas removed on the rotary evaporator to yield a non-acidic fraction A.
5. The thimble Mas removed from the Soxlet extractor and Mashed in succession Mith 600 ml of each of the folloMing solvents as shoMn beloM to yield fraction B and three acidic fractions C,D and E:
- Toluene (fraction B)- 10*/. isopropyl alcohol (IPA)/toluene (fraction C)- 25’/. MeOH/toluene (fraction D)
Reproduced with permission of the copyright owner. Further reproduction prohibited without permission.
88
- 0. IN HC1 in 50'/. MeOH/toluene -Followed by 0.2N HC1 in MeOH (fraction E)
3.3 Analytical Methods3.3.1 Determination of Crude Oil Properties
Five untreated acidic crude oils from the Vinton, Plaquemine and Tullos Fields in Louisiana were used in the alcohol studies (Table 3.1). However, only the MG3 and Tullos crudes were investigated thoroughly and fractionated since they represented the extremes in IFT and emulsion behavior. The four non-acidic crudes used in the oxidation are described in Table 3.2. The specific gravities of the crudes were measured by weighing the oil samples in 10ml volumetric flasks and taking the ratio of the mass of the oil over its volume. The viscosity of the oils was obtained by using an Ostwald viscometer. The method found to be best suited for the determination of the acid number of these crude oils was the potentiometric titration (ASTM procedureD664). The color indicator method (ASTM procedure D974-64)
84and Sihi's method were discarded because of the difficulty involved in detecting color changes accurately due to the dark color of the oil. A Sargent Welch Model 6000 pH meter and electrode were used for the potentiometric titration method. The ASTM procedure D664 was used with the following changes.
Reproduced with permission of the copyright owner. Further reproduction prohibited without permission.
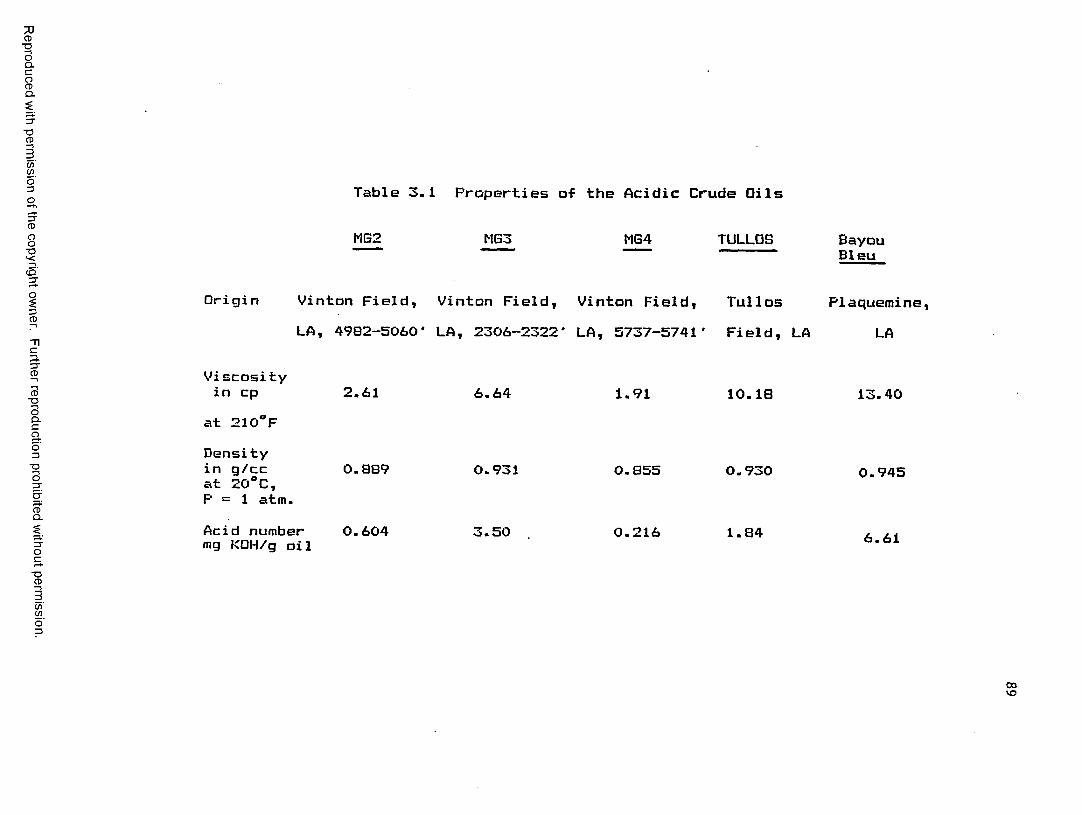
Reproduced
with perm
ission of the
copyright owner.
Further reproduction prohibited
without perm
ission
Table 3.1 Properties o-f the Acidic Crude Oils
MG2 MG3 MG4 TULLOS BayouBleu
Origin Vinton Field, Vinton Field, Vinton Field, Tullos Plaquemine,LA, 4982—5060* LA, 2306-2322* LA, 5737-5741' Field, LA LA
Vi scosity in cp 2.61
at 210°FDensityin g/cc 0.889at 20°C,P = 1 atm.Acid number 0.604mg KOH/g oi1
6.64 1.91 10.18
0.931
.50
0.855
0.216
0.930
1.84
13.40
0.945
6.61
ooVO
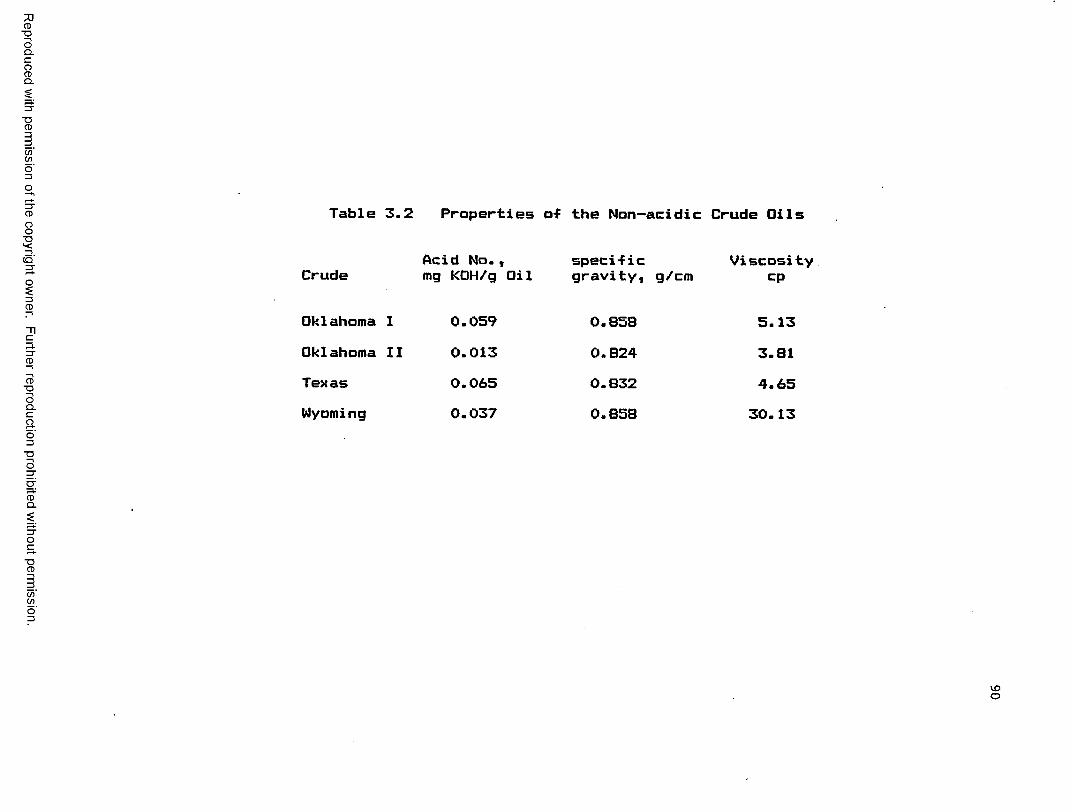
Reproduced
with perm
ission of the
copyright owner.
Further reproduction prohibited
without perm
ission.
Table 3.2 Properties o-f the Non-acidic Crude Oil!
Acid No.t speci-f ic Viscosi-Crude mg KOH/g Oil gravity, g/cm cp
Oklahoma 1 0.059 0.858 5.13Oklahoma II 0.013 0.824 3.81Texas 0.065 0.832 4.65Wyoming 0.037 0.858 30.13
VOO
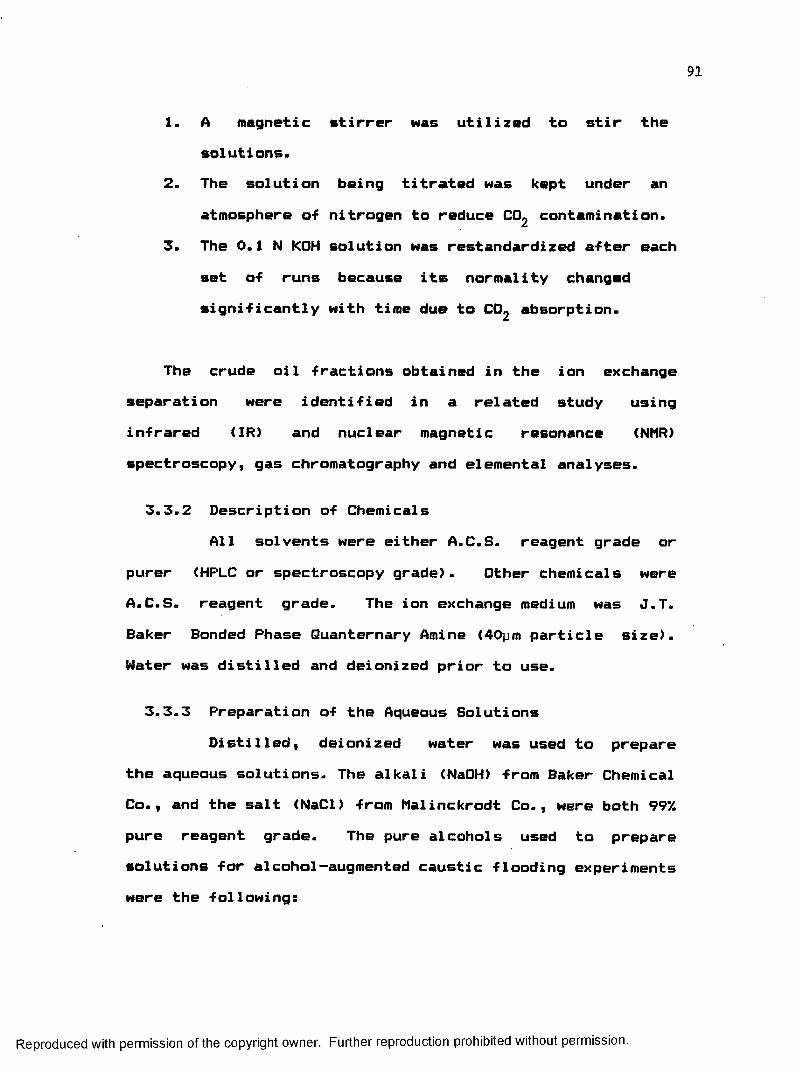
91
1. A magnetic stirrer was utilized to stir the solutions.
2. The solution being titrated was kept under an atmosphere of nitrogen to reduce C02 contamination.
3. The 0.1 N KOH solution was restandardized after each set of runs because its normality changed significantly with time due to C02 absorption.
The crude oil fractions obtained in the ion exchange separation were identified in a related study using infrared <IR) and nuclear magnetic resonance (NMR) spectroscopy, gas chromatography and elemental analyses.
3.3.2 Description of ChemicalsAll solvents were either A.C.S. reagent grade or
purer (HPLC or spectroscopy grade). Other chemicals were A.C.S. reagent grade. The ion exchange medium was J.T. Baker Bonded Phase Quanternary Amine (40pm particle size). Water was distilled and deionized prior to use.
3.3.3 Preparation of the Aqueous SolutionsDistilled, deionized water was used to prepare
the aqueous solutions. The alkali (NaOH) from Baker Chemical Co., and the salt (NaCl) from Malinckrodt Co., were both 99V. pure reagent grade. The pure alcohols used to prepare solutions for alcohol-augmented caustic flooding experiments were the fallowing:
Reproduced with permission of the copyright owner. Further reproduction prohibited without permission.
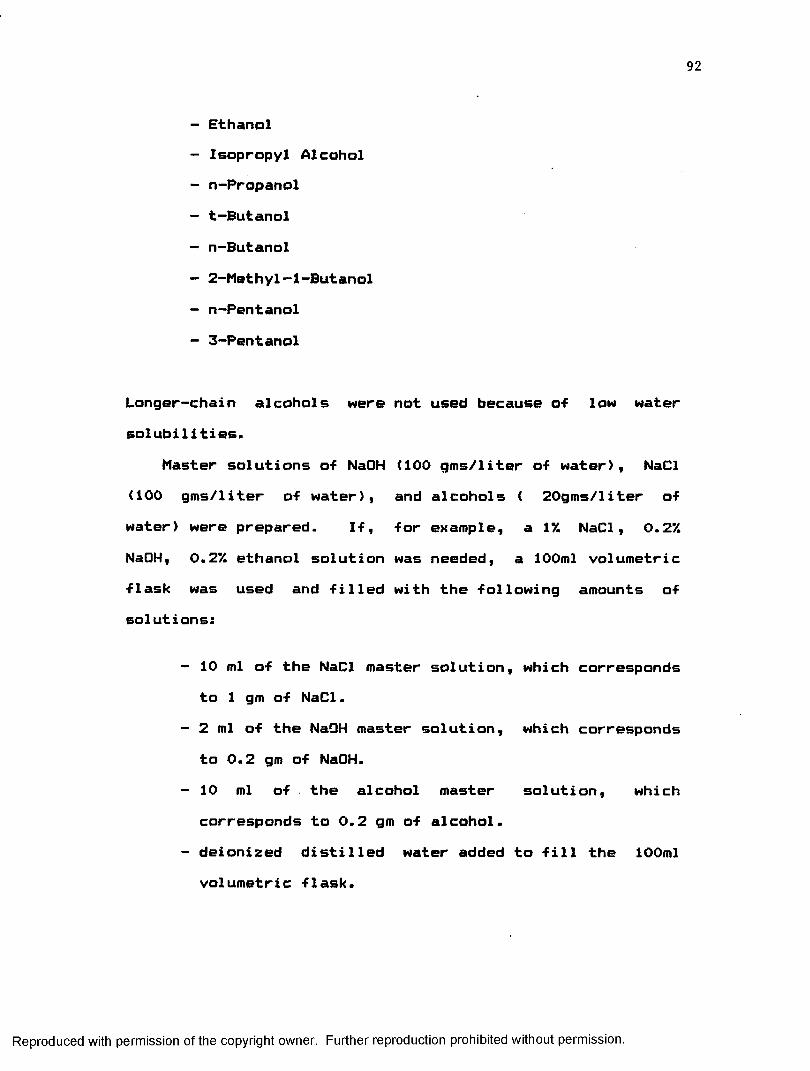
92
- Ethanol- Isopropyl Alcohol- n-Propanol- t-Butanol- n-Butanol- 2-Methyl-1-Butanol- n-Pentanol- 3-Pentanol
Longer— chain alcohols were not used because o-f low water solubilities.
Master solutions of NaOH (100 gms/liter of water), NaCl (100 gms/liter of water), and alcohols ( 20gms/liter of water) were prepared. If, for example, a 17. NaCl, 0.2’/. NaOH, 0.27. ethanol solution was needed, a 100ml volumetric flask was used and filled with the following amounts of solutions:
- 10 ml of the NaCl master solution, which correspondsto 1 gm of NaCl.
- 2 ml of the NaOH master solution, which correspondsto 0.2 gm of NaOH.
- 10 ml of the alcohol master solution, whichcorresponds to 0.2 gm of alcohol.
- deionized distilled water added to fill the 100ml volumetric flask.
Reproduced with permission of the copyright owner. Further reproduction prohibited without permission.

93
Fresh sample solutions were used for each experiment to minimize the depletion of NaOH due to its reaction with C02.
3.3.4 Reactivity Test of Cryolite to NaOH SolutionsTwo caustic solutions with NaOH concentrations within
the range used during the flooding experiments were prepared. One contained 1% by weight NaOH and the other0.2 7. by weight NaOH. The alkalis were dissolved in distilled, deionized water and the pH of each solution was recorded. Ten grams of cryolite crystals were then poured in each solution. The containers of the solutions were sealed and allowed to stand for 72 hours. The pH of each mixture was measured again and compared to the pH of the original solutions. A Sargent Welch Model 6000 pH meter and electrode were used for this purpose. No significant change in pH was noted. Therefore, caustic consumption by the cryolite was considered to be negligible.
3.3.5 Caustic Consumption of the Ottawa SandThe caustic consumption of the Ottawa sand was
determined by adding 100 ml of 17. NaOH solution to 100 gm of sand (80 to 120 mesh). The normality of the 17. NaOH solution (Nl) was determined to be 0.2252N by titrating a measured quantity of the standard acid (potassium hydrogen phtalate). The normality of the NaOH solution that was exposed to sand for 24 hours (N2) was found to be 0.2236N by performing a similar titration. Therefore, the consumption over a 24
Reproduced with permission of the copyright owner. Further reproduction prohibited without permission.
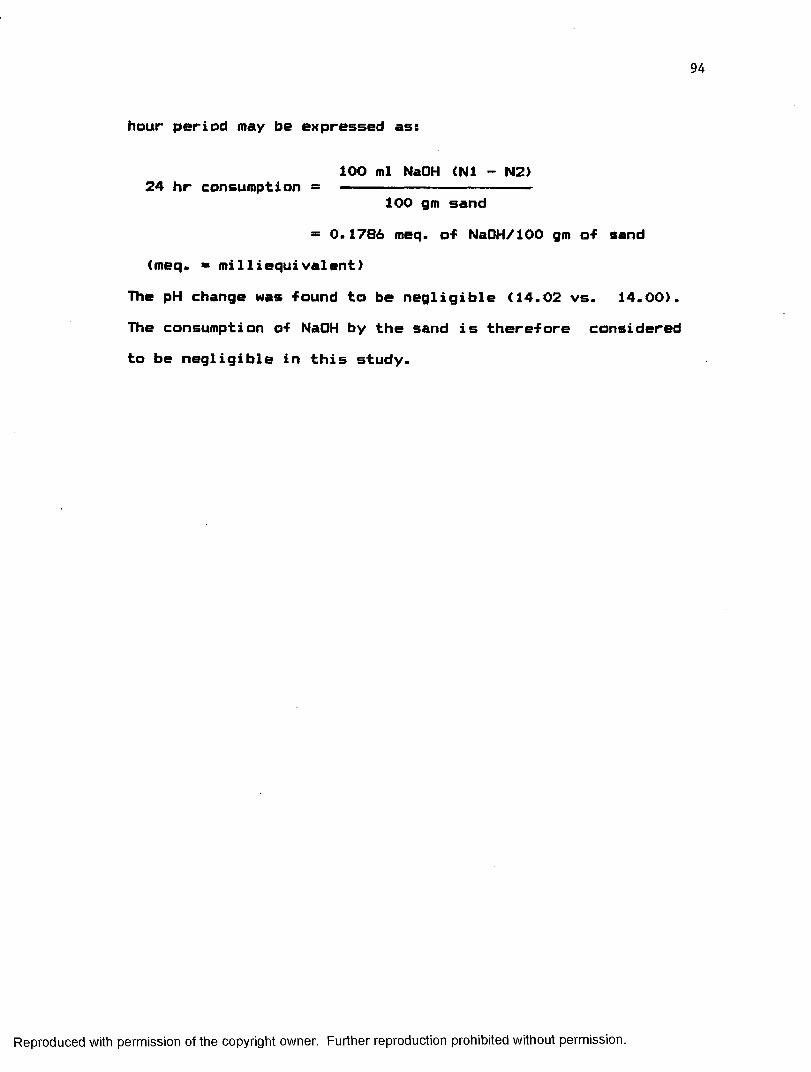
94
hour period may be expressed as:
lOO ml NaOH <N1 - N2)24 hr consumption = <■
100 gm sand= 0.1786 meq. of NaOH/100 gm of sand
(meq. = milliequivalent)The pH change was found to be negligible (14.02 vs. 14.00).The consumption of NaOH by the sand is therefore consideredto be negligible in this study.
Reproduced with permission of the copyright owner. Further reproduction prohibited without permission.

CHAPTER IV
ANALYSIS OF RESULTS
4.1 Effect of Alcohols on Alkaline FloodingAlcohols are known to improve surfactant flooding
efficiency by reducing the detrimental effect of high brine77concentrations . High brine and caustic concentrations are
also known to adversely affect alkaline flooding efficiency.53Nelson et al. used a complex anionic ethoxysulfate co
surfactant <a combination of surfactant and alcohol) to offset the effect of high brine concentrations in alkaline flooding. In the present study, it was therefore decided to isolate the effect of alcohols alone as co-surfactants in order to determine their impact on alkaline flooding.
Interfacial tension (IFT) is known to affect alkaline flooding efficiency 1 . Therefore, the effect of alcohol on IFT was initially determined. The IFT studies were followed by thin cell experiments to determine any mechanism changes produced by the addition of alcohol. Finally, recovery efficiency studies in unconsolidated cores were conducted in order to determine the benefits to be gained by ' alcohol addition.
95
Reproduced with permission of the copyright owner. Further reproduction prohibited without permission.
96
4.1.1 Effect of Alcohols on Interfacial TensionPreliminary IFT studies of isopropyl alcohol/alkaline
water systems were conducted on MG2, MG3, MG4 and Tullos oils. The behavior of the four oils was very similar but MG3 and Tullos oils were chosen for detailed studies due to their contrasting emulsion behavior.
Interfacial tension vs. time measurements between the two crude oils (MG3 and Tullos) and solutions containing different concentrations of NaOH, NaCl and alcohol were taken. IFT results are presented in graphical form in this discussion. The corresponding data may be found in Appendix A and is referred to in the discussion. Properties of the crudes are shown in Table 3.1 of Chapter III.
The alcohols chosen for study have the properties shown in Table 4.1.
Two different concentrations of NaOH were used <0.2% and 0.5% by weight). A NaOH concentration of 0.2% is usually in the region of optimum IFT behavior when no alkali is consumed by the rock and divalent ions. The 0.5% concentration represents the concentration most likely to be used during field operations. The extra 0.3% is added to make up for rock and divalent ion consumption of NaOH.
Two different concentrations of NaCl within reservoir brine concentration limits were also used. 50,000 ppm was chosen to represent a high brine concentration and 10,000 ppm represented a relatively low concentration. The
Reproduced with permission of the copyright owner. Further reproduction prohibited without permission.
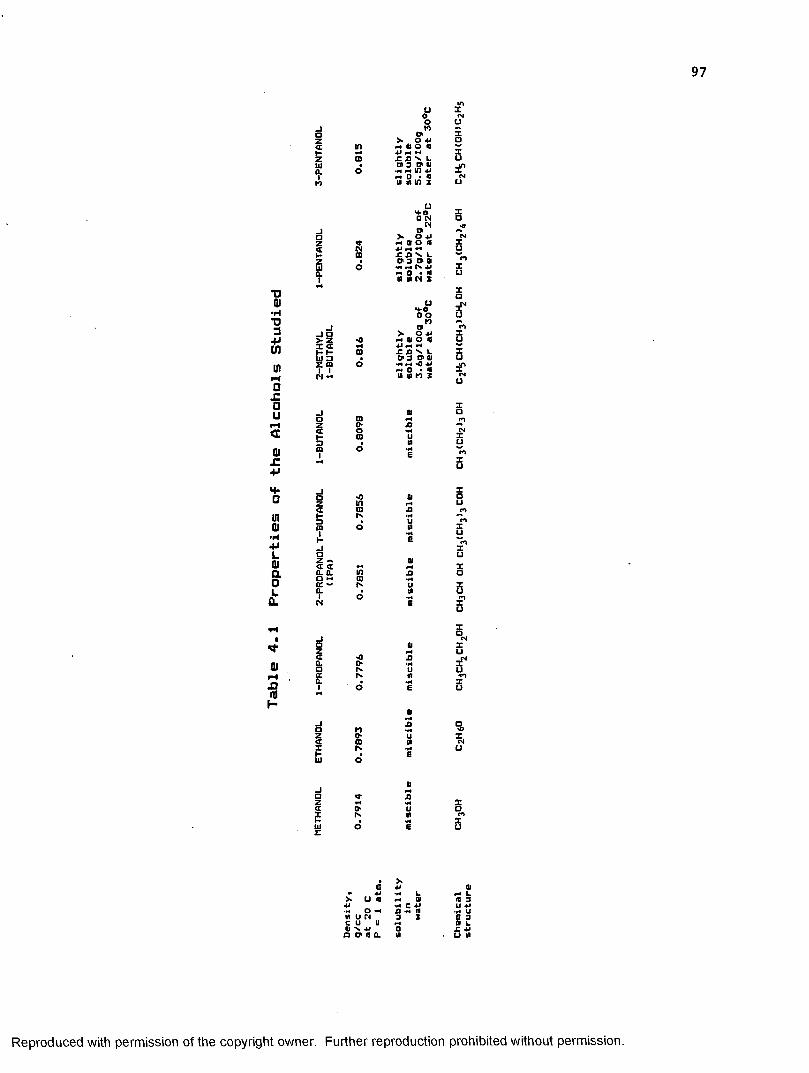
97
53CLIto
to<*4mo
uooto
ot>. O 4im a o «pH *4ru's l
at s o» i i•*4 ** in *•(■4 0 * 4i0 m in z
x□Xu
•aQI•HT3-M
0JZ0u
OJ£
oz<r
CL1
I?M •«
JOz<rai
*N00
<000o
atho00
uH*00 NNat>. O 4J hUO0 4i *4 •<£ XI V La» a at ai•*4 M N 4J
PH 0 • * M M N 2UH>00 otoat> o *j H t l O (+J pH «H£ XI ̂ L9 3 at a*4 04 *c 4* r- o • «10 10 tO 2
01pHXI
X□XCJXu
ifXuXu
X□XuXu
H-0in01
•H4JL01a0La.
-joz<raiL-Jaz ̂ <x <zCl CLa ~ a ~ a.iN
*0inors
inooN
an
01H13
XOu
XuXoXuXu
01rH£mH
-joz<1CL0ccCL1
az<rx
*0O'h.rv
toO'COh*
01pHn
pHXI
Xu
Xu
-Jaz<rHir
O'N
01rHJ3 XO
» >»6 4* aM *H L 04 L>• U <0 pH 01 * 34J •HC 4J u *>•<H O £•P4 to •r4UftU N 3 2 6 3c u u pH 01 L01>»4J 0 £ -Wa 9 >0CL w • u 01
Reproduced with permission of the copyright owner. Further reproduction prohibited without permission.
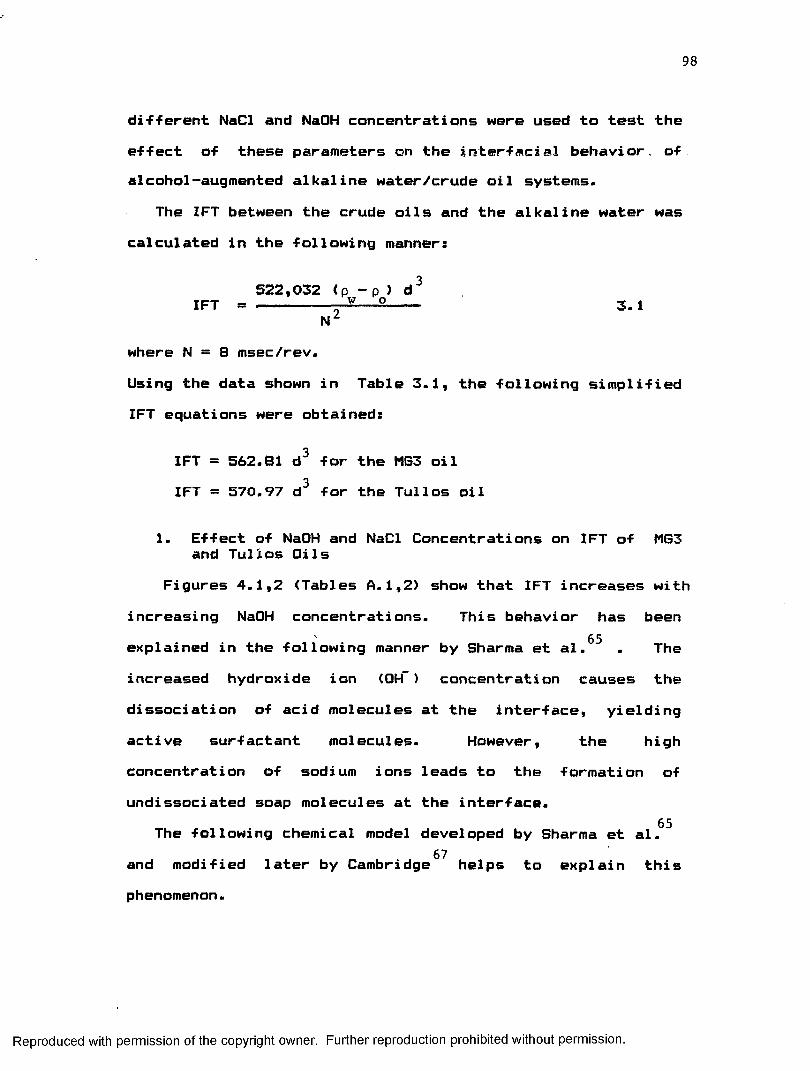
98
different NaCl and NaOH concentrations were used to test the effect of these parameters on the irsterfacial behavior, of alcohol-augmented alkaline water/crude oil systems.
The IFT between the crude oils and the alkaline water was calculated in the following manner:
522,032 (p - p ) d 3IFT = -------- r-E--2---- 3.!N
where N = 8 msec/rev.Using the data shown in Table 3.1, the fallowing simplified IFT equations were obtained:
IFT = 562.81 d3 for the MG3 oil IFT * 570.97 d3 for the Tullos oil
1. Effect of NaOH and NaCl Concentrations on IFT of MG3 and Tullos Oils
Figures 4.1,2 (Tables A.1,2) show that IFT increases withincreasing NaOH concentrations. This behavior has been
\
explained in the following manner by Sharma et al. . Theincreased hydroxide ion (QH~) concentration causes the dissociation of acid molecules at the interface, yielding active surfactant molecules. However, the highconcentration of sodium ions leads to the formation of undissociated soap molecules at the interface.
65The following chemical model developed by Sharma et al.67and modified later by Cambridge helps to explain this
phenomenon.
Reproduced with permission of the copyright owner. Further reproduction prohibited without permission.
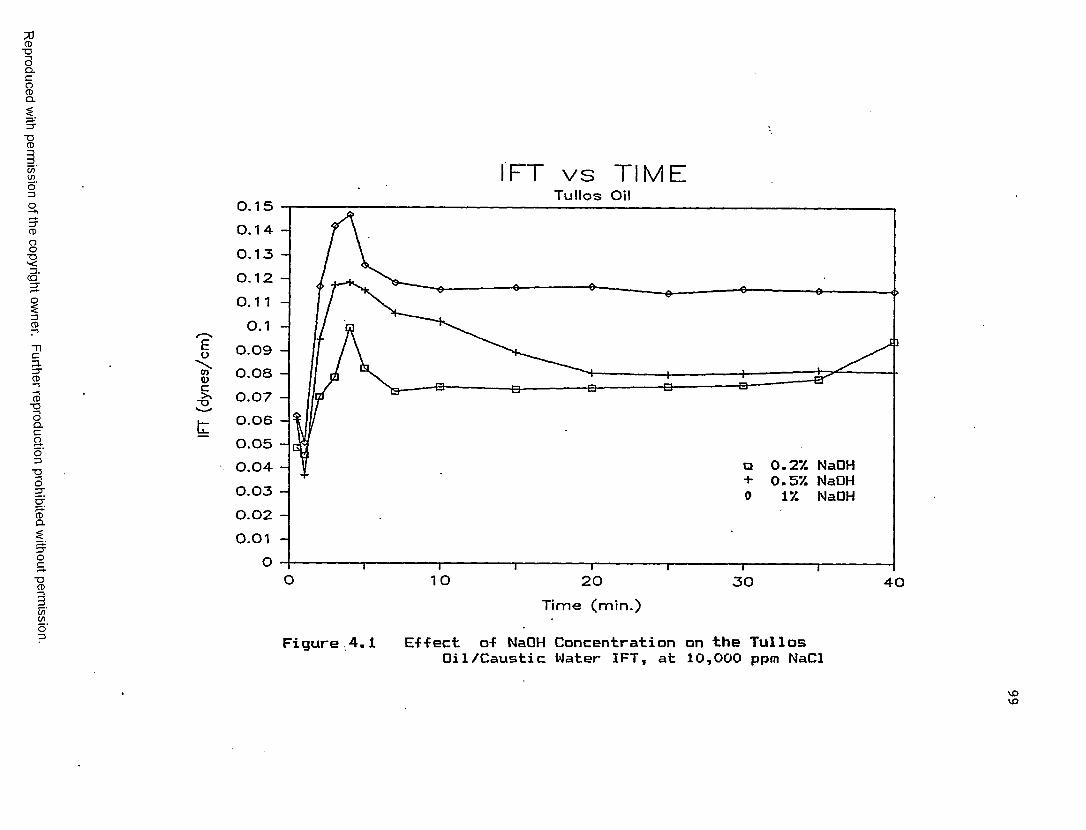
Reproduced
with perm
ission of the
copyright owner.
Further reproduction prohibited
without perm
ission.
£oCO<Dc>\"O
IF T v s T I M ETullos Oil0.15
0.140.130.12
0.10.090.080.070.060.05
0.2*/. NaOH 0.57. NaOH 17. NaOH
0.040.030.02
0.01
O 10 20 3 0 4 0Ti m e (min.)
Figure 4.1 E-f-fect o-f NaOH Concentration on the Tullos Oil/Caustic Water IFT, at 10,000 ppm NaCl
V0VO
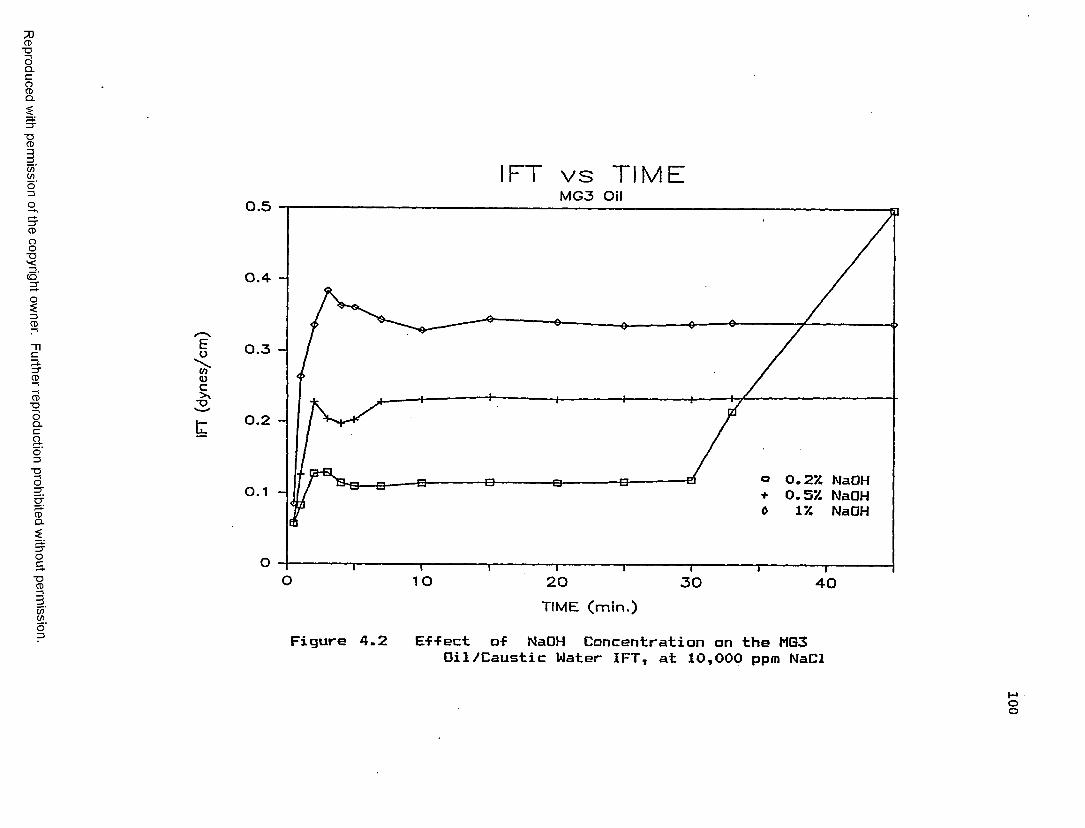
Reproduced
with perm
ission of the
copyright owner.
Further reproduction prohibited
without perm
ission.
Eo\WVc>xT>
FT v s T I M EM G 3 Oil0.5
< >0.3
0.2
o 0.2% NaOH + 0.5% NaOH0 1% NaOH
0 .1
O 10 20 30 40TIME (min.)
Figure 4.2 E-f-fect of NaOH Concentration on the MG3 Oil/Caustic Water IFT, at 10,000 ppm NaCl

101
[available inter-facial space3+ HAn «— - HAi 2.72.82.9
A" . Aw”+ [available inter-facial space!k-4 . . ..
2. 10Aw + Hw+ 5 = HAw 2.11
2.12k T
[Nai + 3 = [Naw+3 exp ( ̂ -̂ )k T 2.13
Where all the parameters of the equations were defined earlier in Chapter II. In this model, Langmuir adsorption and desorption are allowed, which means that there is a finite maximum interfacial surfactant concentration and that IFT is not linearly related to that concentration. Equation 2.13 shows that the sodium concentration at the interface [Nai+ 3 is proportional to the sodium concentration in the water phase [Naw+3. Therefore, as the Na+concentration in the water phase increases, so does the Na+ concentration at the interface. This causes reaction 2.9 to shift to the right, i.e., more NaA^ molecules (undissociated acid molecules) are produced. However, these molecules are hydrophobic and interfacial1y inactive.
The interfacial space [Nu3 available for adsorption is defined by the following equation where "m" denotes maximum:
[Nu3 ■ [HA13m - [HA±3 - [Ap - [NaAi3 2.20
Reproduced with permission of the copyright owner. Further reproduction prohibited without permission.
102
As the concentration of undissociated acid molecules CNaA^l increases, the interfacial space ENul available for adsorption decreases. Less space is therefore available for interfacially active species to adsorb at the interface. Subsequently, the stabilized IFT is higher at higher NaOH concentrations. The IFT also remains stable longer athigher NaOH concentrations because the adsorption of the interfacially active species, mainly carboxylic acids, isslowed down by the lack of interfacial space.
The same theory developed above applies for NaOHsolutions containing a high concentration of NaCl. Theincreased CNa*! concentration from the additional NaCl further increases IFT, as presented in Figures 4.3,4 (Tables A.3,4).
2. Effect of Alcohols on IFT at Low NaOH and NaCl Concentrati onsThe concentrations of NaOH (0.2% by wt. for MG3, 0.1%
by wt. for Tullos) and NaCl (10,000 ppm) were chosen to give optimum flood behavior for the particular crudes without spontaneous emulsification. Avoiding spontaneous emulsification allows for reproducible IFT data to be obtained (rare easily. The experimental error associated with IFT measurements involves the measurement of drop diameters, density differences, periods of revolution and cylindrical lens effects of the capillary tubes. The standard deviation on measurements taken on the tensiometer
Reproduced with permission of the copyright owner. Further reproduction prohibited without permission.
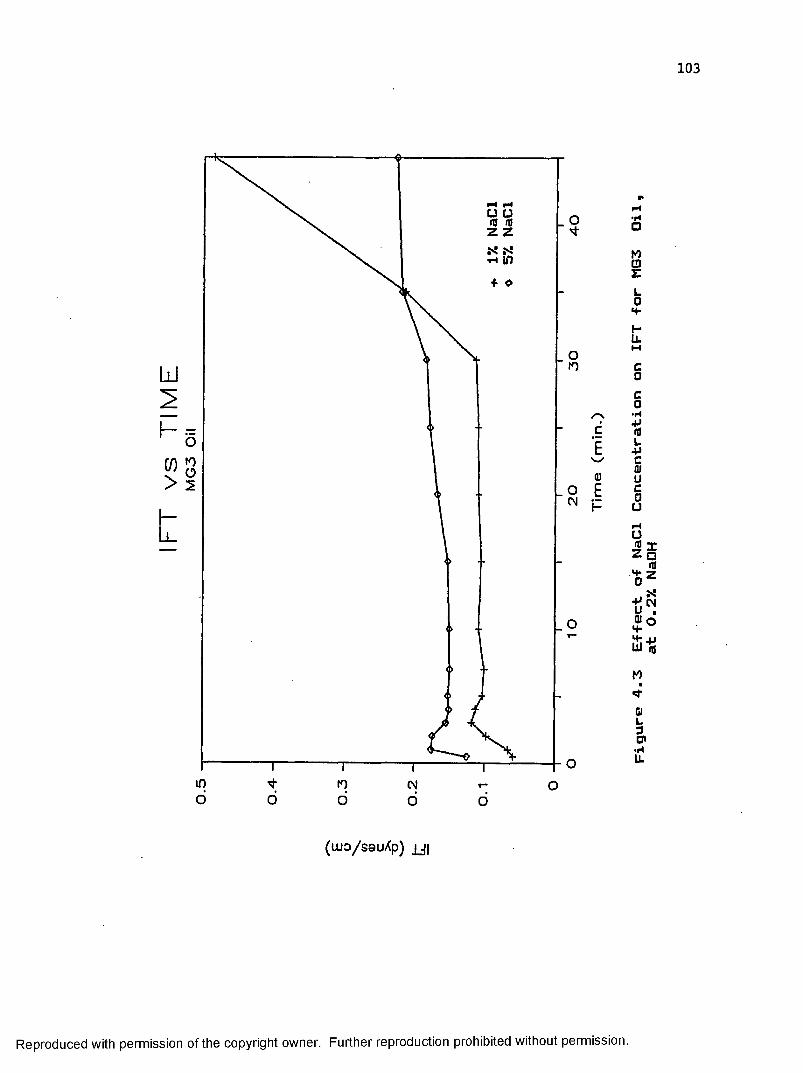
103
u u m (0 z zN" N'H If)
_ O
_ o
m o
( lu o /s a u X p ) j j |
Reproduced with permission of the copyright owner. Further reproduction prohibited without permission.
Figure
4.3
Effect
o-f NaCl Concentration
on IFT
-for
MGS
Oil
at 0.2
7. Na
OH
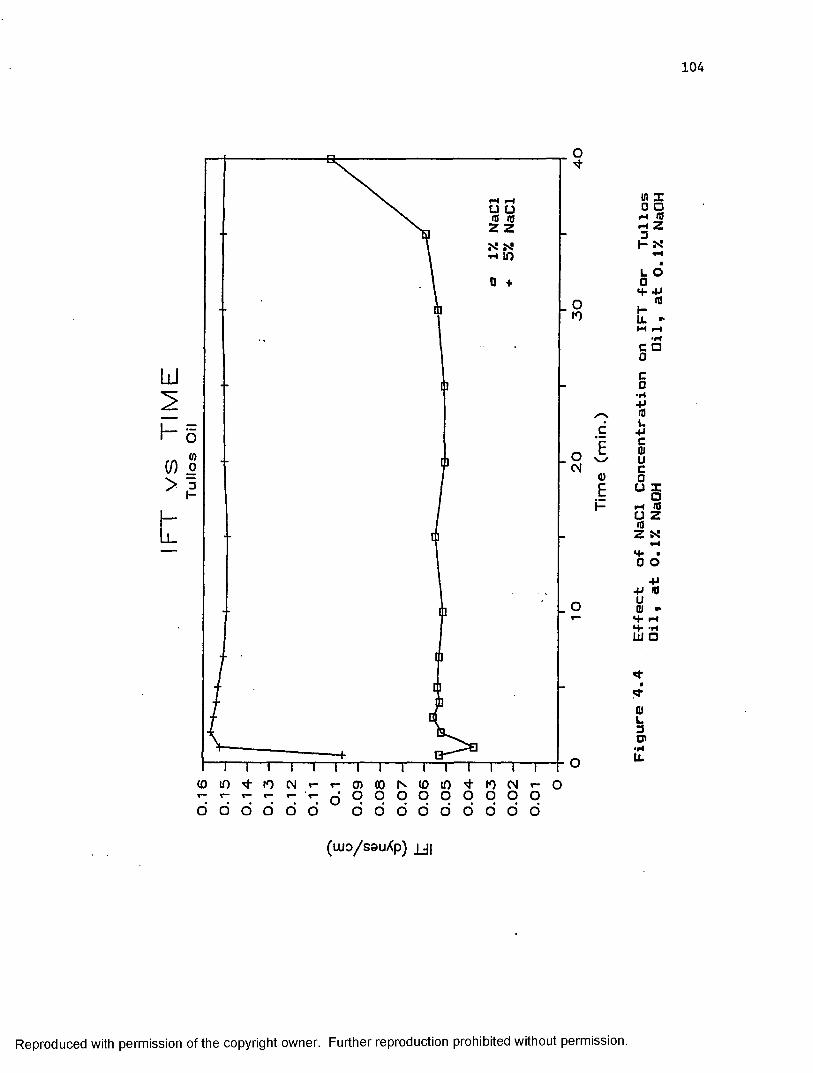
104
(0 m ro <N t— «- 0) oo rs (o m OJ r- OT— r- r* f— f— ' r“ o 9 o o o o o o o oo o o o o o o o o o o o o o o
(UJO/sauXp) JJI
Reproduced with permission of the copyright owner. Further reproduction prohibited without permission.
Figure 4.4
Effect
of NaCl
Concentration
on IFT
for
Tull o
s Oil, at
0.17.
NaOH
Oil, at
0.17.
NaOH
105
used was -found to be 7’/.. This value is comparable to the67error reported by other investigators
A. Effect of Water Miscible Alcohols: Methanol, Ethanol, IPA, 1-propanol
As shown in Figures 4.5-4.12 (Tables A.5,12>, a smallincrease in IFT (around 15%) was recorded with the additionof 0.5% of any these alcohols except for ethanol. Nosignificant increase in Tullos oil/alkaline water IFT wasrecorded when IPA or 1-propanol was added. Alcohols that aremiscible in water tend to remain in the water phase.However, it is expected that some alcohol would partition atthe interface due to its partial solubility in crude oil.The interfacial space CNu] available for adsorption, asdefined earlier in Section 4.1.1 (1), is the following:
CNuD = CHA - CHAi D - CA^l - CNaA ±] 2.20
The term CHA^D includes all the interfacially active species present at the interface. They are mainly carboxylic acids but other compounds such as aldehydes and ketones may alsocontribute to interfacial activity. Alcohols are also
64interfacially active , but the short chain length of the water soluble alcohols makes them much less interfacially active than most carboxylic acids present in acidic crude oils. Therefore, the presence of these alcohols at the interface could be detrimental to IFT reduction because they will occupy space that would otherwise be available for
Reproduced with permission of the copyright owner. Further reproduction prohibited without permission.
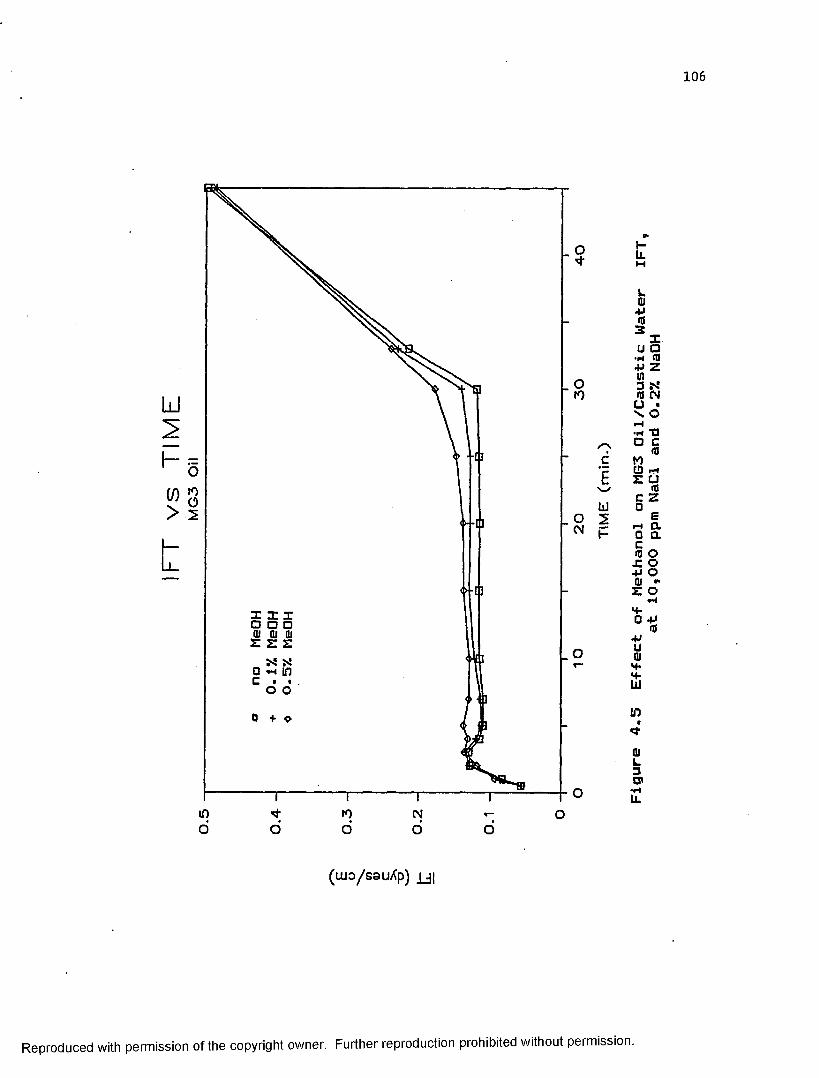
I l l o o □ qj ai ai S I Sa -< in
(uu o /sau X p ) x j |
Reproduced with permission of the copyright owner. Further reproduction prohibited without permission.
Figure
4.5
Effect
of Methanol
on MG3
Oil/Caustic
Water
IFT
at 10,000
ppm
NaCl
and
0.27.
NaOH
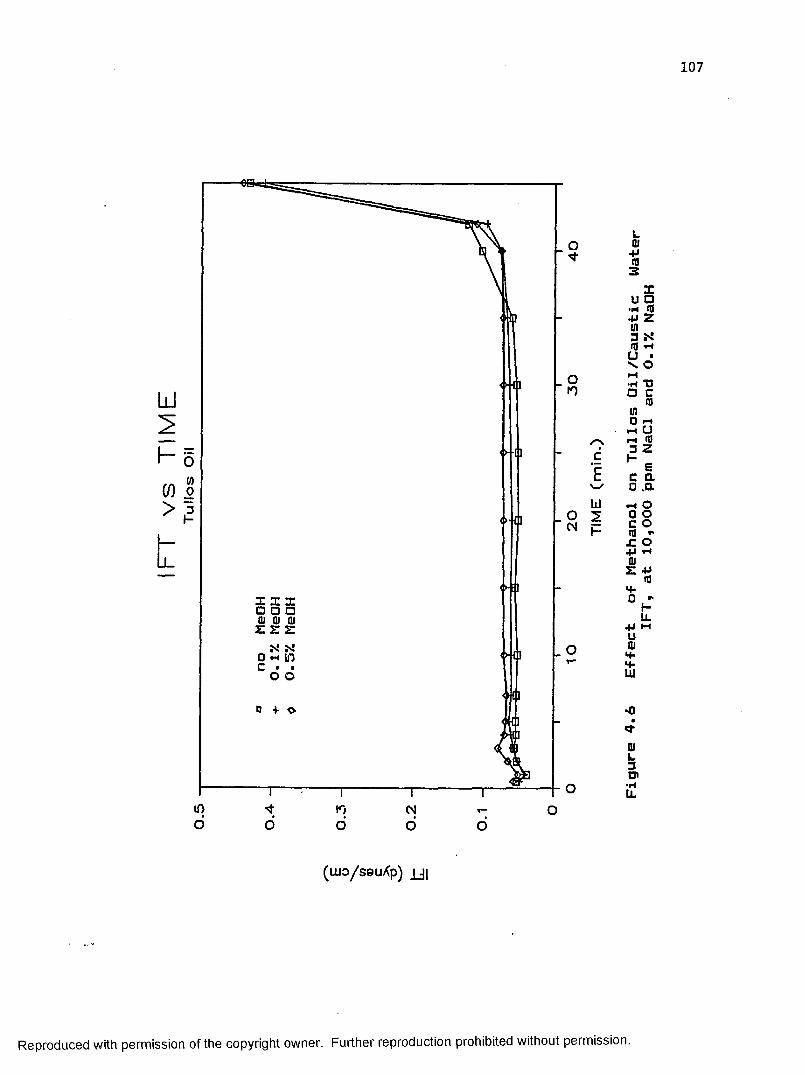
. o
X X□ a ai ai z z
0
< 1 1
ID r,
(LU0/S9U/<p) J[j|
Reproduced with permission of the copyright owner. Further reproduction prohibited without permission.
Figure
4.6
Effect
of Methanol
on Tull os
Oil/Caustic
Wate
rIFT, at
10,000
ppm
NaCl
and
0.1%
NaOH
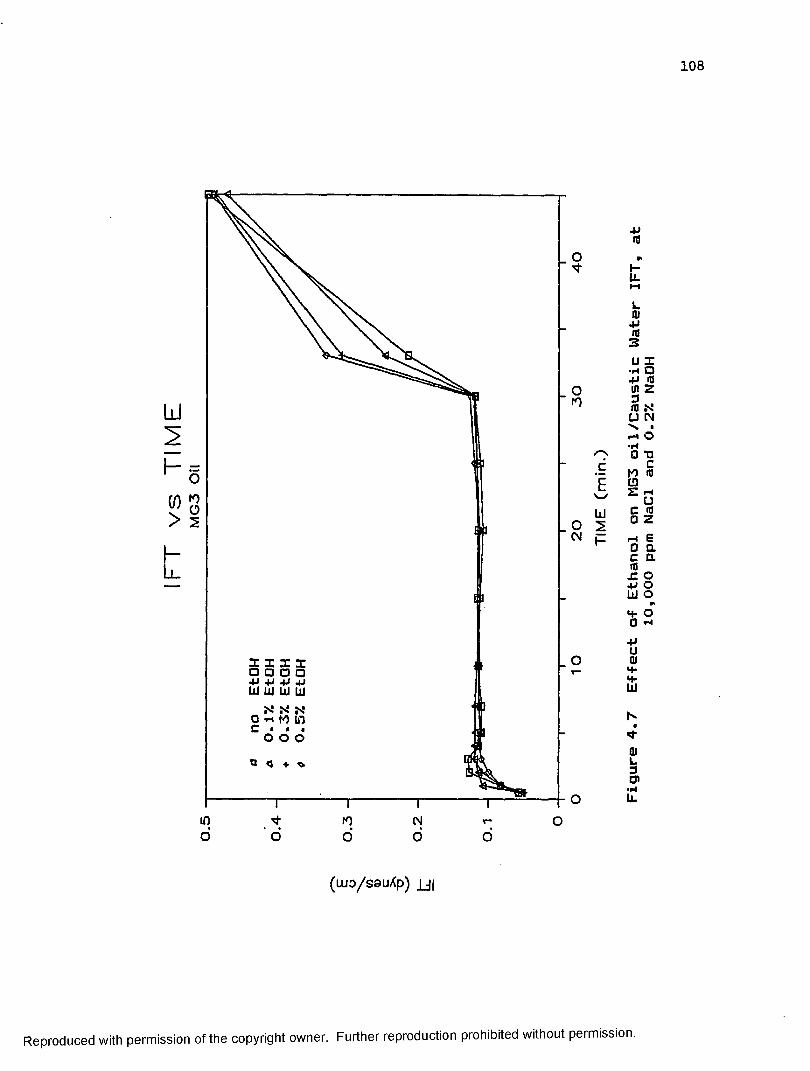
108
LI
mo
a: 1 1 1 o o a a+» +> 4J +> Id UJ W UJN N* N
0 -ri M 111C . . .o o o
o < ^
T
o
c
EU
O 2 CM p
TJOo
TCMo
(uuo /ssuX p) J J |
Reproduced with permission of the copyright owner. Further reproduction prohibited without permission.
Figure 4.7
Effect
of Ethanol
on MG3
oil/Caustic
Water
IFT, at
10,000
ppm
NaCl
and
0.27.
NaOH

109
_ O
- •□ a a+» 4J 4Jm w w
S'! S'! o *h in c • • o o. O
in o
cEw2t-
(Ulo/sauXp) UI
Reproduced with permission of the copyright owner. Further reproduction prohibited without permission.
Figure 4.8
Effect
of Ethanol
on Tullos
Oil/Caustic
Water
IFT
at 10,000
ppm
NaCl
and
0.17.
NaOH
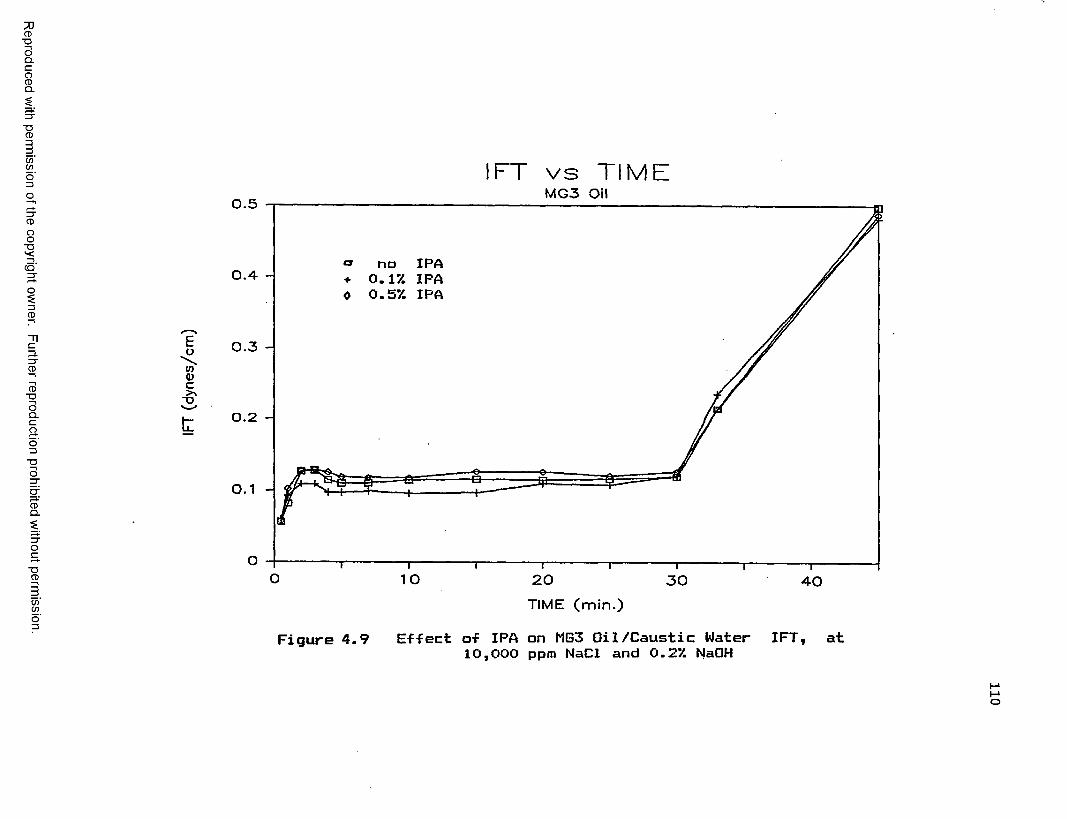
Reproduced
with perm
ission of the
copyright owner.
Further reproduction prohibited
without perm
ission.
EoWVc>\x>
0.5
0.4 -
0.3 -
0.2 -
0.1 -
no IPA ♦ 0.17. IPA0 0.57. IPA
IFT v s T I M EM G 3 Oil
I— 10 20
TIME (min.)3 0
Figure 4.9 Effect of IPA on MG3 Oil/Caustic Water 10,000 ppm NaCl and 0.27 NaOH
4 0
IFT, at

I l l
LI
>
L
_ o
oWo"5F-
<1 <E <t 0 . Cl CLH M H
0 «H UTc ■ >o o
m m m
cELy
1112I-
(O ID/sauXp) 2JI
Reproduced with permission of the copyright owner. Further reproduction prohibited without permission.
Figure
4.10
E-f-fect
o-f IPA
on Tullos
Oil/Caustic
Water
IFT, at
10,000
ppm
NaCl
and
0.1/i
NaOH
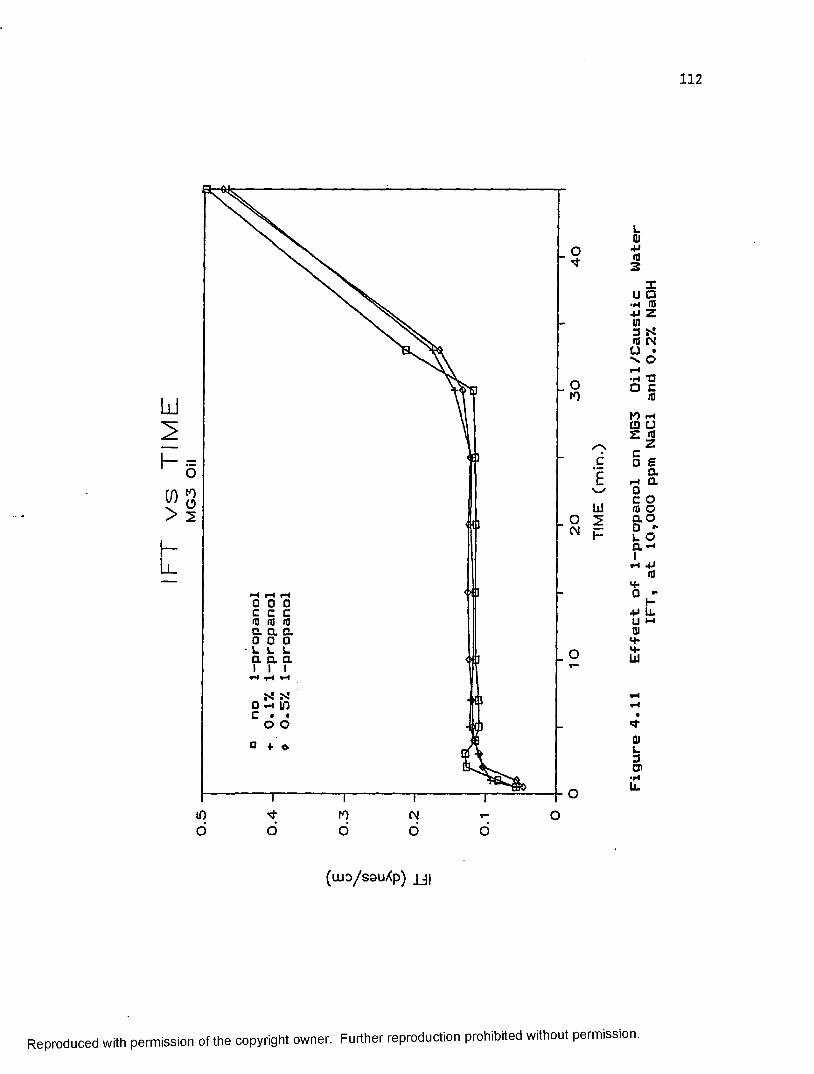
112
bJ
h 6U)X' o > 2
Ll
0 0 c c nj <n m a a a. □ oo l l u a a a i i i
oc
if)o
0 ̂ 10 c • •o o0 + o
T«•o
too
cElii2H-
(ujo/ssuXp) J J |
Reproduced with permission of the copyright owner. Further reproduction prohibited without permission.
Figure 4.11
E-f-fect
of 1—propanol
on MG3
Oil/Caustic
Wate
rIFT, at
10,000
ppm
NaCl
and
0.27.
NaOH
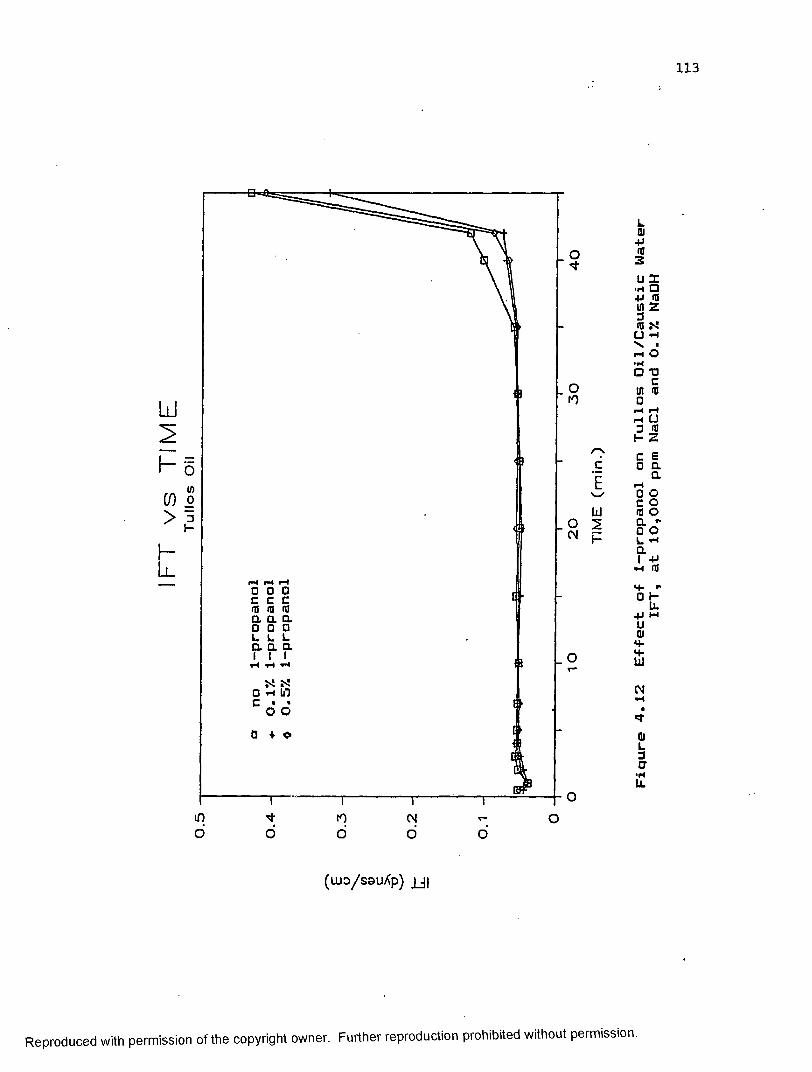
113
Ll I
h
>h-Ll
w031-
a a aa a a
o ■* 111 c • • o o
in
c
EUJ2H
(ujo/ssuXp) JJ|
Reproduced with permission of the copyright owner. Further reproduction prohibited without permission.
Fiqure
4.12
E-f-fect
o-f 1-propanol
on Tullos
Oil/Caustic
Wate
rIFT, at
10,000
ppm
NaCl
and
0.1%
NaOH

114
acidic species. This leads to a lowering of the quantity of acidic species present at the interface, resulting in an increase in IFT.
The higher alcohol concentrations (0.5%) yielded higher IFT values than the lower concentrations (0.1%). A difference in IFT values of approximately 10% was noted. This suggests that higher alcohol concentrations in the water phase may provide higher alcohol concentrations at the interface, and therefore higher IFT's.
There was no significant difference in IFT behavior when ethanol was used (Figures 4.7,8 and Tables 4.9,10). No reason could be determined for the difference in behavior of ethanol as compared to the other water miscible alcohols. The effects of IPA and 1-propanol on Tullos oil/alkaline water IFT were also negligible possibly due a lower solubility of these alcohols in the Tullos crude. In general, MG3 was more sensitive to alcohol addition than Tullos, which suggests that alcohol partitioning at the interface may be higher for MG3 than Tullos, probably due to a difference in solubility of these alcohols in the two crudes.
B. Effect of t-Butanol Figures 4.13,14 (Tables A.13,14) show a more
significant increase in IFT (about 20%) when 0.5% t-butanol was added to alkaline water. t—Butanol, which is more soluble in the oil than the previously mentioned alcohols,
Reproduced with permission of the copyright owner. Further reproduction prohibited without permission.
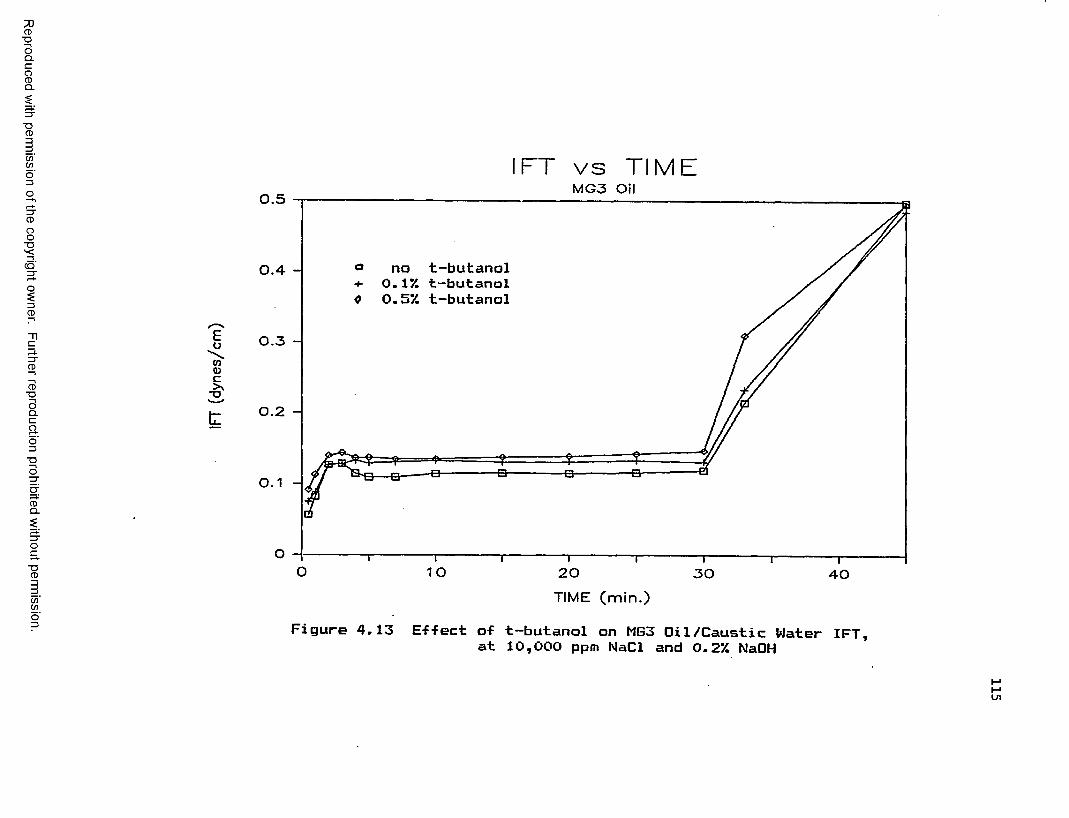
Reproduced
with perm
ission of the
copyright owner.
Further reproduction prohibited
without perm
ission.
IF
Eo\COQ>c>\•D
v s T I M EM G 3 Oil0.5
no t-butanol O. 131 t—butanol 0.531 t-butanol
0.4 -
0.3 -
0.2 -
0.1
O -O 10 20 3 0 4 0
TIME (min.)
Figure 4.13 E-f-fect o-f t-butanol on MG3 Oil/Caustic Water IFT,at 10,000 ppm NaCl and 0.231 NaDH
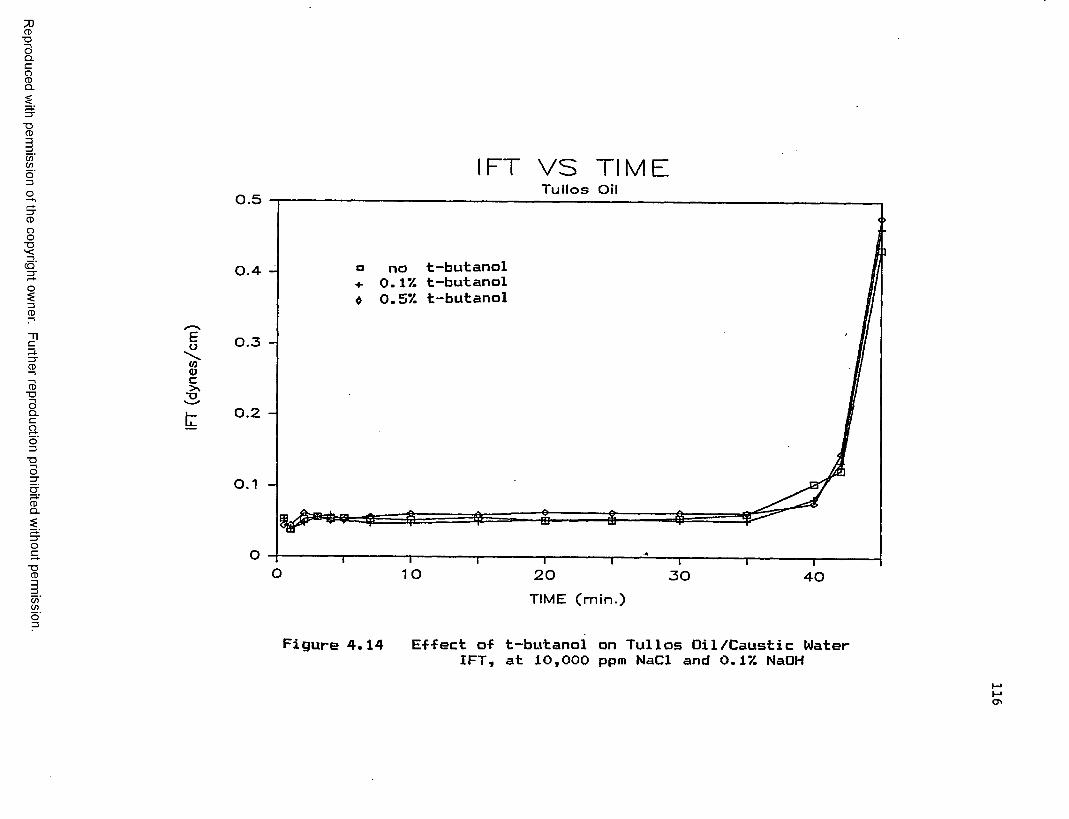
Reproduced
with perm
ission of the
copyright owner.
Further reproduction prohibited
without perm
ission.
e0 \01 Vc•u
IFT V S T I M ETullos Oil0.5
< >
o no t-butanol O. IV. t-butanol
$ 0.5V. t-butanol0.4 -
0.3 -
0.2 -
0 .1
O 1 0 20 3 0 4 0TIME (min.)
Figure 4.14 E-f-fect of t-butanol on Tullos Oil/Caustic WaterIFT, at 10,000 ppm NaCl and 0.1% NaOH
116
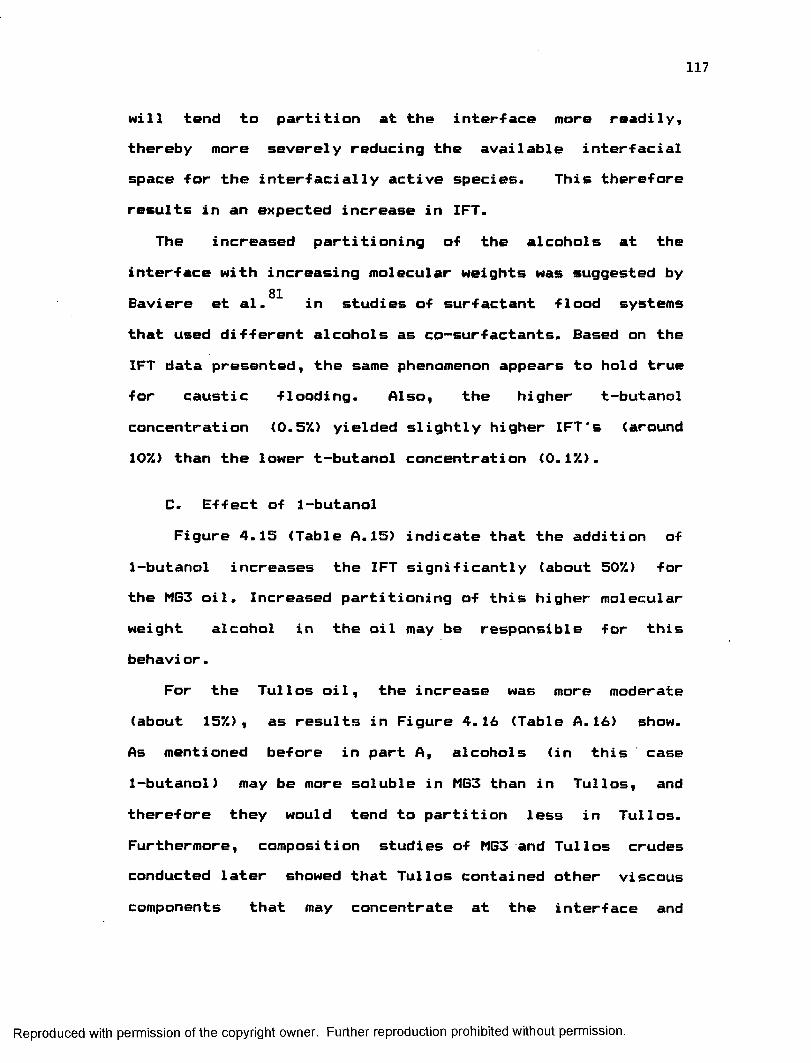
117
Mill tend to partition at the interface more readily, thereby more severely reducing the available interfacial space for the interfacially active species. This thereforeresults in an expected increase in IFT.
The increased partitioning of the alcohols at theinterface with increasing molecular weights was suggested by
81Baviere et al. in studies of surfactant flood systems that used different alcohols as co-surfactants. Based on the IFT data presented, the same phenomenon appears to hold true for caustic flooding. Also, the higher t-butanol concentration (0.5%) yielded slightly higher IFT's (around 10%) than the lower t-butanol concentration (0.1%).
C. Effect of 1-butanol Figure 4.15 (Table A.15) indicate that the addition of
1-butanol increases the IFT significantly (about 50%) for the MG3 oil. Increased partitioning of this higher molecular weight alcohol in the oil may be responsible for this behavi or.
For the Tullos oil, the increase was more moderate (about 15%), as results in Figure 4.16 (Table A.16) show. As mentioned before in part A, alcohols (in this case 1-butanol) may be more soluble in MG3 than in Tullos, and therefore they would tend to partition less in Tullos. Furthermore, composition studies of MG3 and Tullos crudes conducted later showed that Tullos contained other viscous components that may concentrate at the interface and
Reproduced with permission of the copyright owner. Further reproduction prohibited without permission.

Reproduced
with perm
ission of the
copyright owner.
Further reproduction prohibited
without perm
ission.
IFT v s T I M EM G 3 Oil0.5
1 - b u t a n o l 1 - b u t a n o l 1—b u t a n o l
no 0 . IX 0 .5 X
0.4 -
0.3 -
0.2 -
0 .1
O 10 .20 3 0 4 0TIME (min.)
Figure 4.15 E-f-fect of 1—butanol on MG3 Oil/Caustic Water IFT,at 10,000 ppm NaCl and 0.2X NaOH
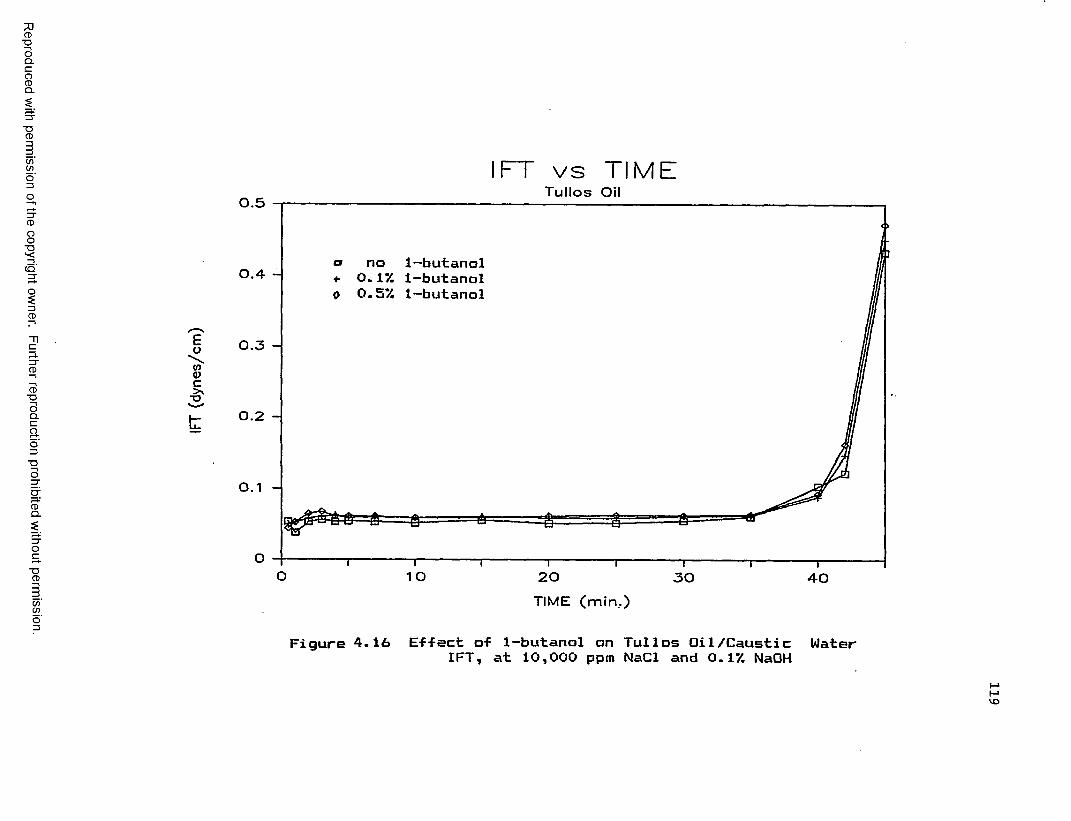
Reproduced
with perm
ission of the
copyright owner.
Further reproduction prohibited
without perm
ission.
eo\mvc>\“O
0.5
0.4 -
0.3 -
0.2 -
0.1 -
IF v s T I M ETullos Oil
a n o 1—b u t a n o l «■ O . tV. 1—b u t a n o l 0 0 . 5 / i 1 - b u t a n o l
i1 o
& &
20TIME (min,)
3 0 4 0
Figure 4.16 E-f-fect of 1-butanol on Tullos Oil/Caustic WaterIFT, at 10,000 ppm NaCl and 0.1/i NaOH

120
further reduce interfacial space available for surface active species. This is further discussed in Section 4.2. The higher i-butanol concentration (0.5%) yielded higher IFT's (around 25%) than the lower 1-butanol concentration. This again suggests that the higher alcohol concentration in the water phase may lead to a higher alcohol concentration at the interface and therefore to a higher IFT.
D. Comparison of the Effects of 1-Butanol and t-Butanol Figure 4.17 (Table A.17) present results showing that
for MG3, 1-butanol gave higher IFT's than t-butanol (50% vs. 20%). This data implies that 1-butanol is more soluble in the oil than t-butanol, and therefore higher concentrations of 1-butanol would more likely be found at the interface than t-butanol. This would then make the IFT values of 1-butanol-augmented alkaline water/crude oil systems higher than the IFT values of the t-butanol—augmented alkaline water/crude oil systems. Therefore, 1-butanol may be more harmful to oil recovery than t-butanol, provided that such an increase in IFT overwhelms other beneficial effects the alcohols may have.
Figure 4.18 (Table A.18) show that for Tullos oil, 1-butanol also gave higher IFT's than t-butanol (20% vs. 10%), but the increases were not as high as for MG3. These alcohols are probably more soluble in MG3 than Tullos, as mentioned earlier.
Reproduced with permission of the copyright owner. Further reproduction prohibited without permission.
Reproduced
with perm
ission of the
copyright owner.
Further reproduction prohibited
without perm
ission.
IFT v s T I M E
Eo\w<DC>\-U
M G 3 Oil0.5
no butanol 0.52 t—butanol 0.52 1-butanol
0.4 -
0.3 -
0.2 -
0.1
O 1 O 20 3 0 4 0TIME (min.)
Figure 4. 17 Comparison of the Effects of 1—butanol andt-butanol on MG3 Oil/Caustic WaterIFT,
at 10,000 ppm NaCl and 0.22 NaOH

Reproduced
with perm
ission of the
copyright owner.
Further reproduction prohibited
without perm
ission.
IFT v s T I M ETullos Oil0.45
0.4 - butanolno0.5% 1—butanol 0.5% t-butanol0.35 -
0.3 -
0.25 -
0.2 -
0.15 -
0.1
0.05 -
O 10 20 3 0 4 0TIME (min.)
Fiqure 4.18 Comparison of the Effects of 1-butanol andt-butanol on Tullos Oil/Caustic Water IFT,
at 10,000 ppm NaCl and 0.1% NaOH
123
E. Effect of 1-pentanol: Solubility: 2.7 g/lOOg of water Figures 4.19f20 (Tables A.19,20) present IFT data
indicating that the addition of 0.5% 1-pentanol increases the IFT drastically (up to 400%). 1-pentanol is much less soluble in water than the previously mentioned alcohols. It will tend to go into the oil phase or partition at the interface more readily than the other more water soluble alcohols. The higher the concentration of 1-pentanol at the interface, the less space is available for the surfactants in the oil phase to go to the interface. This then drastically increases the IFT.
The higher 1-pentanol concentration (0.5%) yielded much higher IFT's (up to 300%) than the lower 1-pentanol concentration (0.1%). This definitely suggests a higher partitioning of the alcohol at the interface with higher alcohol concentrations in the water phase.
F. Effect of 2-methyl-1-butanol: Solubility = 3.6 g/ 100 g of water
Figure 4.21 (Table A.21) present the results of IFT studies showing that the addition of 0.5% 2-methyl-1-butanol increases the IFT drastically (up to 380%). This behavior is similar to that of 1-pentanol addition. This is to be expected since the two alcohols have comparable water solubilities.
Reproduced with permission of the copyright owner. Further reproduction prohibited without permission.
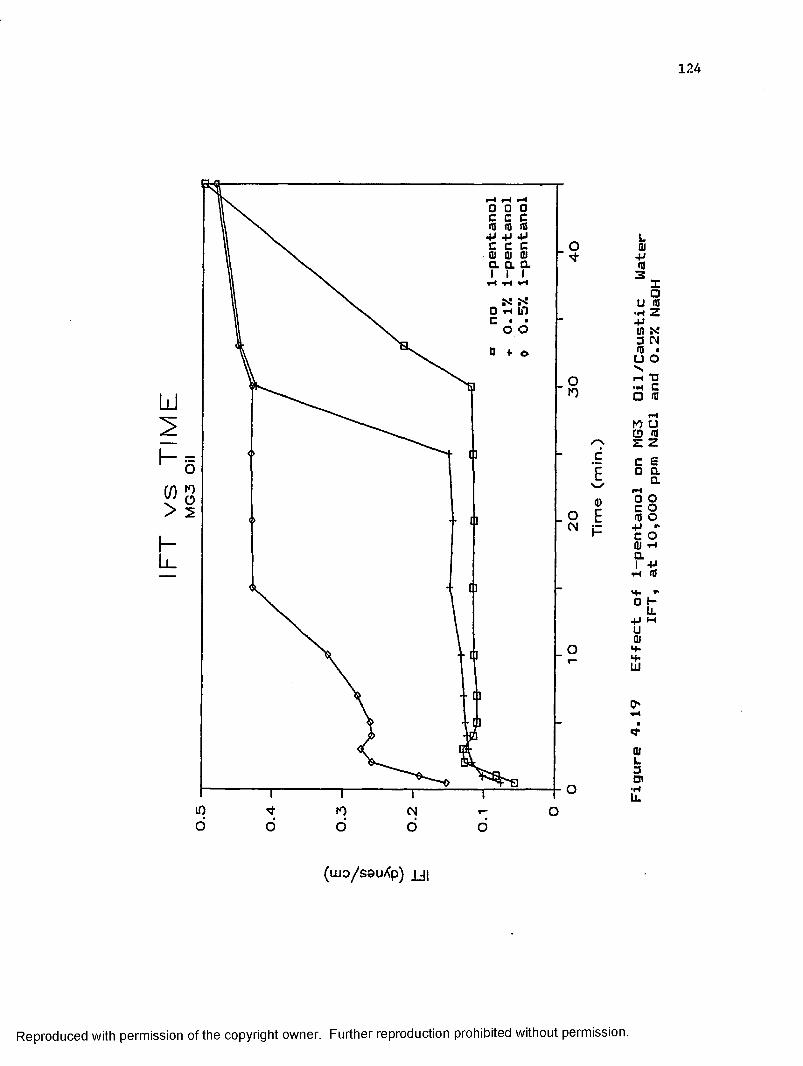
124
111
Cf) ^ X* o > 2hL.
□ 00 c c cUJ <0 ID +J 4J 4J C C C OJ 01 01 a a a i i i
0 th in c o o
•• 11 oCM
c1
a>EF
(lU0/S3U/<p) UI
Reproduced with permission of the copyright owner. Further reproduction prohibited without permission.
Figure
4.19
Effect
of 1-pentanol
on MG3
Oil/Caustic
Wate
rIFT, at
10,000
ppm
NaCl
and 0.27.
NaOH
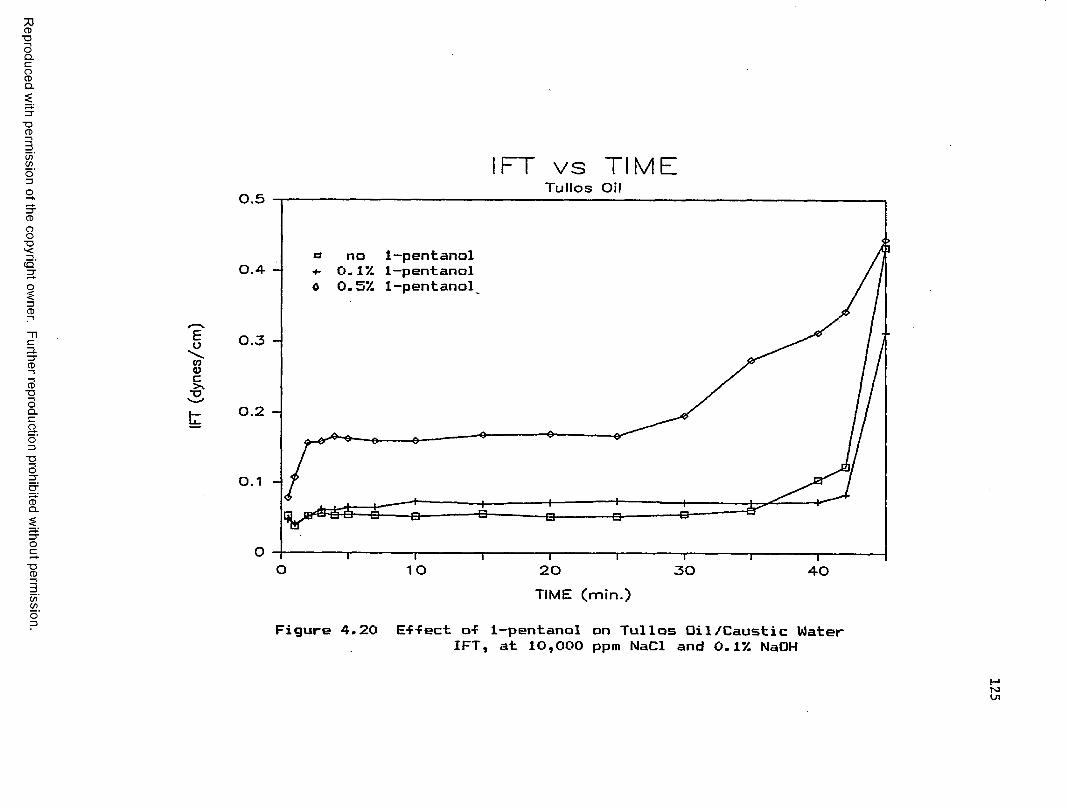
Reproduced
with perm
ission of the
copyright owner.
Further reproduction prohibited
without perm
ission.
EowVc>\x>
0.5
0.4 -
0.5 -
0.2 -
0.1 -
IF T v s T I M ETullos Oil
a no 1-pentanol O. 17. 1—pentanol
0 0.5 7. 1-pentanol
— l— 10
-B-
20TIME (min.)
30 40
Figure 4.20 E-f-fect o-f 1—pentanol on Tullos Oil /Caustic WaterIFT, at 10,000 ppm NaCl and 0.1% NaOH
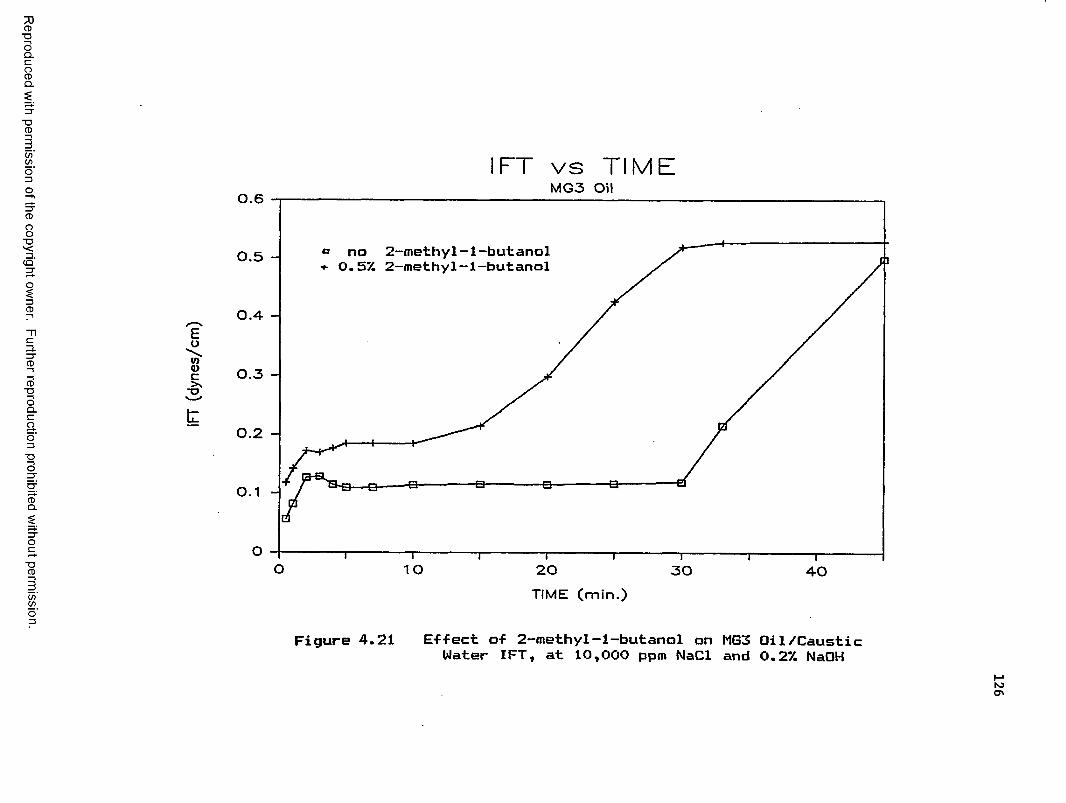
Reproduced
with perm
ission of the
copyright owner.
Further reproduction prohibited
without perm
ission.
IFT v s T I M EM G 3 Oil
Eowa>c-a
0.6
a no 2-methyl-1-butanol O. 57. 2—methyl —1—butanol0.5 -
0.4 -
0.3 -
0.2 -
0.1
O 10 20 3 0 4 0TIME (min.)
Figure 4.21 Effect of 2-methyl-1-butanol on MG3 Oil/CausticWater IFT, at 10,000 ppm NaCl and 0.2% NaOH
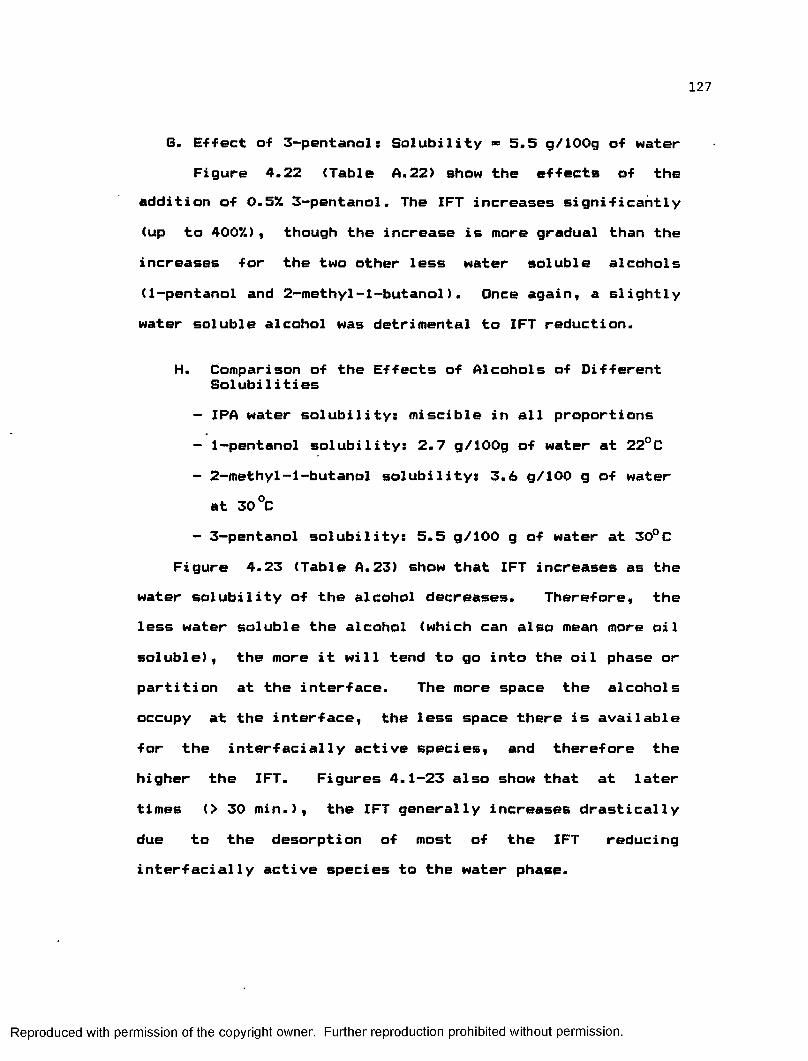
127
6. Effect of 3-pentanol: Solubility « 5.5 g/iOOg of waterFigure 4.22 (Table A.22) show the effects of the
addition of 0.5% 3-pentanol. The IFT increases significantly (up to 400%), though the increase is more gradual than the increases for the two other less water soluble alcohols (1-pentanol and 2-methyl-1-butanol). Once again, a slightly water soluble alcohol was detrimental to IFT reduction.
H. Comparison of the Effects of Alcohols of Different Solubi1ities
- IPA water solubility: miscible in all proportions- 1-pentanol solubility: 2.7 g/lOOg of water at 22°C- 2-methyl-1-butanol solubility: 3.6 g/100 g of water
at 30°C- 3-pentanol solubility: 5.5 g/100 g of water at 30°C
Figure 4.23 (Table A.23) show that IFT increases as thewater solubility of the alcohol decreases. Therefore, the less water soluble the alcohol (which can also mean more oil soluble), the more it will tend to go into the oil phase or partition at the interface. The more space the alcohols occupy at the interface, the less space there is available for the interfacially active species, and therefore the higher the IFT. Figures 4.1-23 also show that at later times (> 30 min.), the IFT generally increases drastically due to the desorption of most of the IFT reducing interfacially active species to the water phase.
Reproduced with permission of the copyright owner. Further reproduction prohibited without permission.
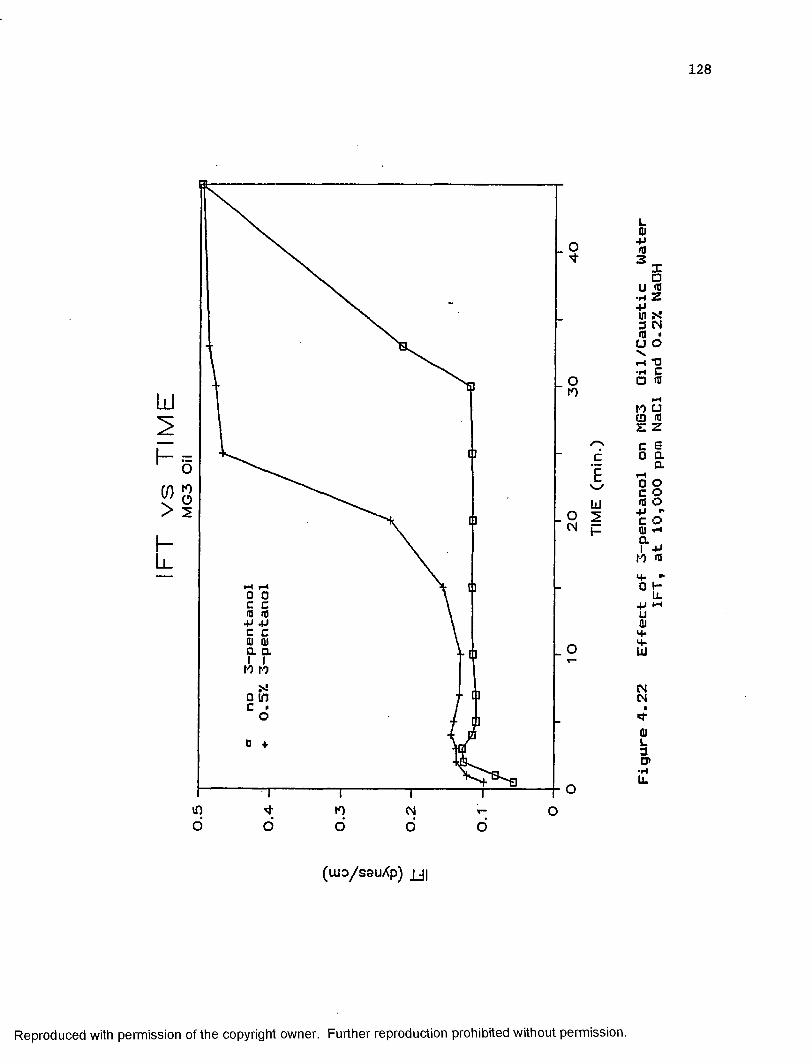
128
LU
a a I Ito to
o in
O
Oto
cEU 2<N p
mo o
»oo
(UJD/S8UXp) JJI
Reproduced with permission of the copyright owner. Further reproduction prohibited without permission.
Figure 4.2
2 Effect
of 3-pentanol
on MG3
Oil/Caustic
Wate
rIFT, at
10,000
ppm
NaCl
and
0.2%
NaOH

Reproduced
with perm
ission of the
copyright owner.
Further reproduction prohibited
without perm
ission.
IFT v s T I M E
eo\wc~o
0.6
0.5% 1-pentanol (2.7g/100g water)
0.5
0.5% 2—M—l—butanol (3.6g/100g water)0.4
0.5% 3-pentanol (5.5g/100g water)0.3
0.5 IPA (miscible)0.2
0.1
no alcohol
O 1 0 20 3 0 4 0TIME (min.)
Figure 4.23 Comparison o-f the Effects of Alcohols of DifferentSolubilities on MG3 Oil/Caustic Water' IFT,at 10,000 ppm NaCl and 0.2% NaOH
129
130
3. Effect of Alcohols on MG3 Oil IFT at High NaCl (50,000 ppm) and NaOH (0.5% by wt.) Concentrations
A. Effect of Water Miscible AlcoholsResults presented in Figures 4.24,25,26 (Tables
A.24,25,26) show that the IFT increases slightly when 0.5% water miscible alcohol was added. The apparent increase (10% or less) can be attributed to partitioning of the alcohols at the interface. Also, higher alcohol concentrations (0.5%) gave slightly higher IFT values than the lower alcohol concentration (0.1%) overall.
It is expected that increasing the electrolyte concentration will decrease the solubility of alcohol in water (salting out effect) and force the alcohol in the oil phase, further increasing the IFT. This effect was not so evident in the results obtained. This could be due to the fact that the IFT values were already high and further increases become difficult to achieve because the interface is already saturated with Na+ ions, leaving less interfacial space available for the alcohols to partition.
B. Effect of 1-ButanolThe IFT increased approximately 30% when 0.5%
1-butanol was added as shown in Figure 4.27 (Table A.27). This indicates an increase in partitioning of the alcohol at the interface due to its higher solubility in crude oil (or lower solubility in water) when compared to the previously mentioned lower molecular weight alcohols.
Reproduced with permission of the copyright owner. Further reproduction prohibited without permission.
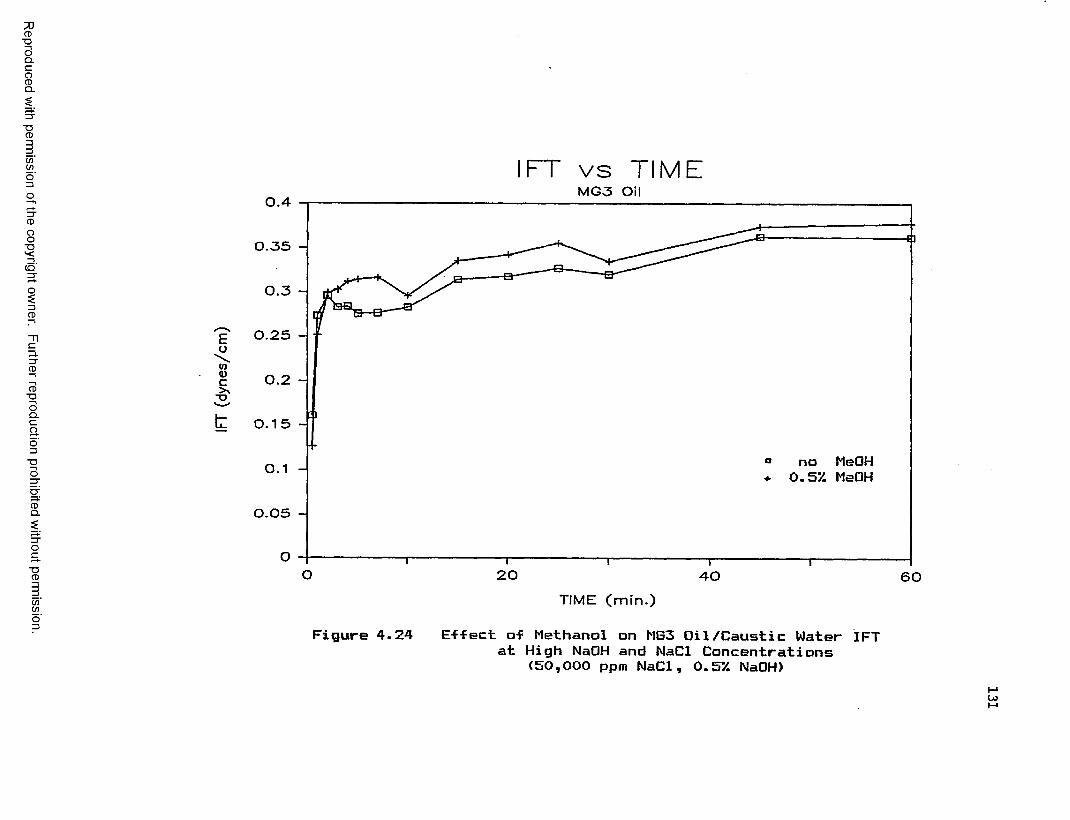
Reproduced
with perm
ission of the
copyright owner.
Further reproduction prohibited
without perm
ission.
IF T v s T I M EM G 3 Oil0.4
0.35 -
0.3 -
0.25 -
0.2 -
0.15 -
° no MeOH + 0.57. MeOH0.1
0.05 -
O 20 4 0 6 0TIME (min.)
Figure 4.24 E-f-fect o-f Methanol on MG3 Oil/Caustic Water IFTat High NaOH and NaCl Concentrations
<50,000 ppm NaCl, 0.57. NaOH)
131
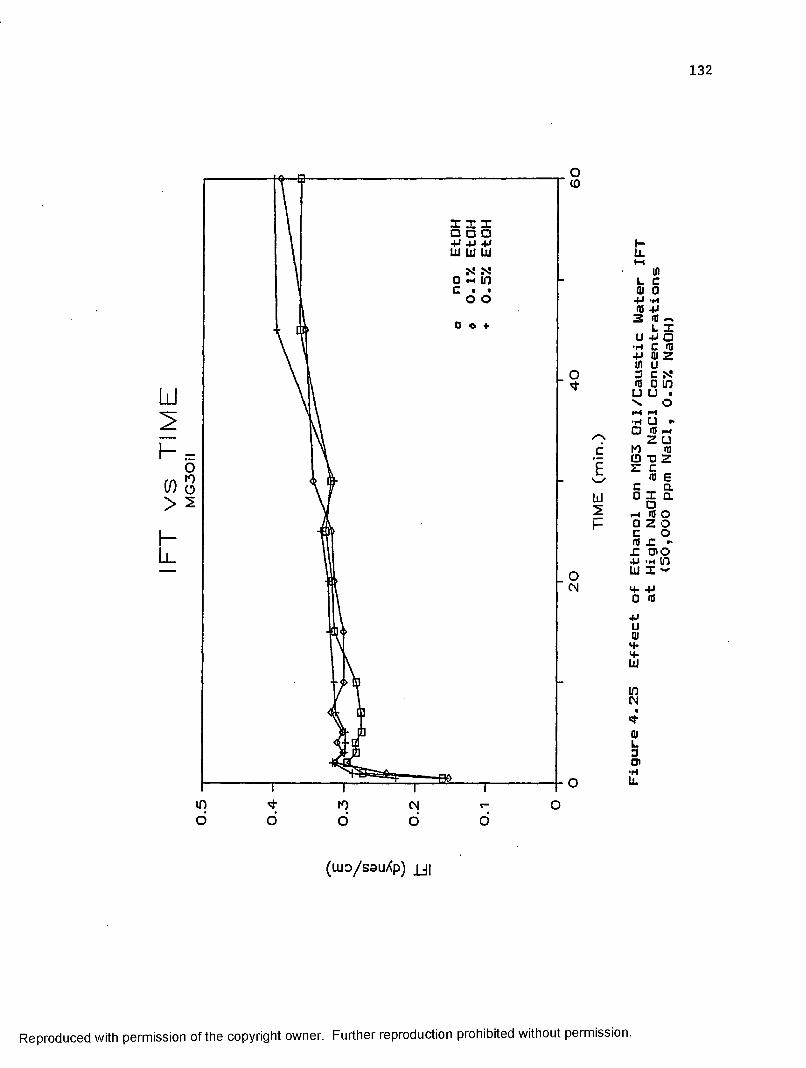
132
I I I a o □ ■M +1 + • lii LU UJN No th in
fiOm o
oCO
o
rsC£w2(-
001
(LU0/S9uXp) JJI
Reproduced with permission of the copyright owner. Further reproduction prohibited without permission.
Figure 4.2
5 Effect
of Ethanol
on MG3
Oil/Caustic
Water
IFT
et High
NaOH
and
NaCl
Conc
entr
atio
ns
<50,000
ppm
NaCl,
0.5%
NaOH)
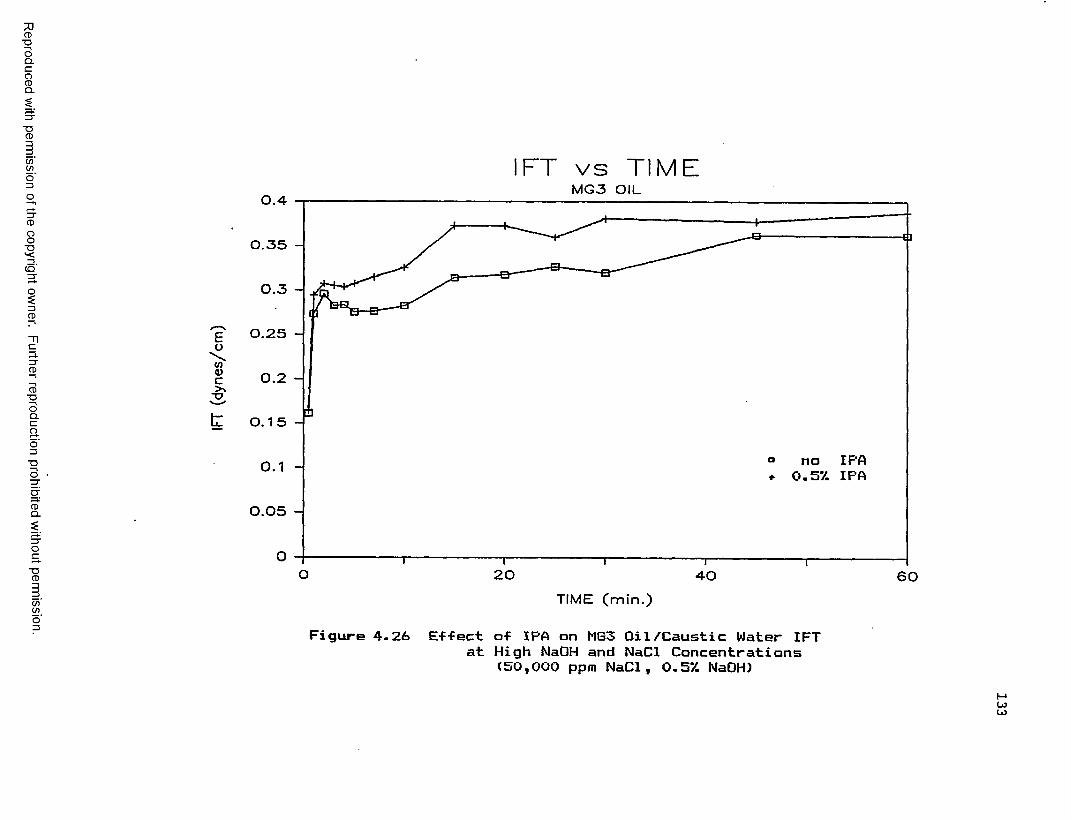
Reproduced
with perm
ission of the
copyright owner.
Further reproduction prohibited
without perm
ission.
IFT v s T I M EM G 3 OIL0.4
0.35 H
0.3 H
0.25 H
0.2 H
0.15 H
IF'A IPA
no0.1
0.05 H
O 20 40 6 0TIME (min.)
Figure 4.26 Effect of IPA on MG3 Oil/Caustic Water IFTat High NaOH and NaCl Concentrations
(50,000 ppm NaCl, 0.5% NaOH)

Reproduced
with perm
ission of the
copyright owner.
Further reproduction prohibited
without perm
ission.
FT v s T I M EM G 3 Oil
eo\mo>CX>
0.5
0.4 -
0.3 -
0.2 -
n no 1-butanol ♦ 0.5% i—butanol0 .1
o 20 4 0 6 0TIME (min.)
Figure 4.27 Effect of 1-butanol on MS3 Oil/Caustic Water IFTat High NaOH and NaCl Concentrations
(50,000 ppm NaCl, 0.5% NaOH)
135
C. E-f-fect o-f 1-pentanol: Solubility <= 2.7 g/100 g ofwater
Figure 4.28 (Table A.28) present IFT results showing that the addition of 0.5% 1-pentanol increases the IFT drastically (100% or more). The low solubility (2.7 g/100 g of water) of this alcohol tends to make it go into the oil phase or at the interface more readily than the other alcohols that are water soluble in all proportions. The increase in IFT suggests also that the concentration of interfacially active species at the interface decreased when this alcohol was added. If Langmuir type kinetics are assumed* the available interfacial space is limited. Therefore, the alcohol occupies space at the interface that would have been otherwise available for the interfacially active species. The alcohol, being less interfacially active than the other interfacially active species (mainly carboxylic acids), would not contribute significantly to the decrease in IFT and this results in a higher overall IFT.
D. Effect of Ethanol and 1-Pentanol on IFT for Tull os OilAs shown in Figure 4.29 (Table A.29), a slight increase
(around 10%) in IFT was recorded with the addition of 0.5% ethanol. This behavior is similar to the one observed for the MG3 crude oi1.
When 0.5% 1-pentanol was added, the IFT increased drastically (200 to 250%) as was the case for the MG3 oil. As stated earlier, the greater partitioning of this higher
Reproduced with permission of the copyright owner. Further reproduction prohibited without permission.
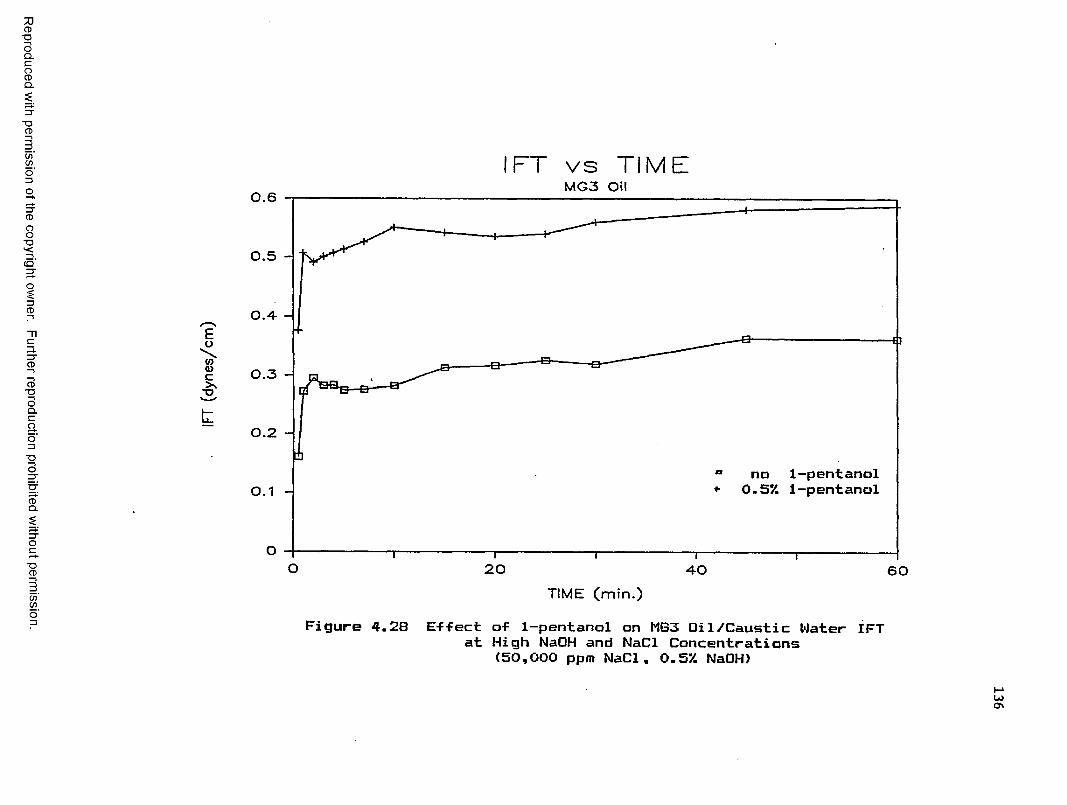
Reproduced
with perm
ission of the
copyright owner.
Further reproduction prohibited
without perm
ission.
IF T v s T I M EM G 3 Oil
Eo\(0Q>C"O
0.6
0.5 -
0.4- -
0.3 -
0.2 -
1-pentanol1-pentanol
no0.5*/.0 .1
O 20 4 0 6 0TIME (min.)
Figure 4.28 Effect of 1-pentanol on MG3 Oil/Caustic Water IFTat High NaOH and NaCl Concentrations
(50,000 ppm NaCl, 0.57. NaOH)
136
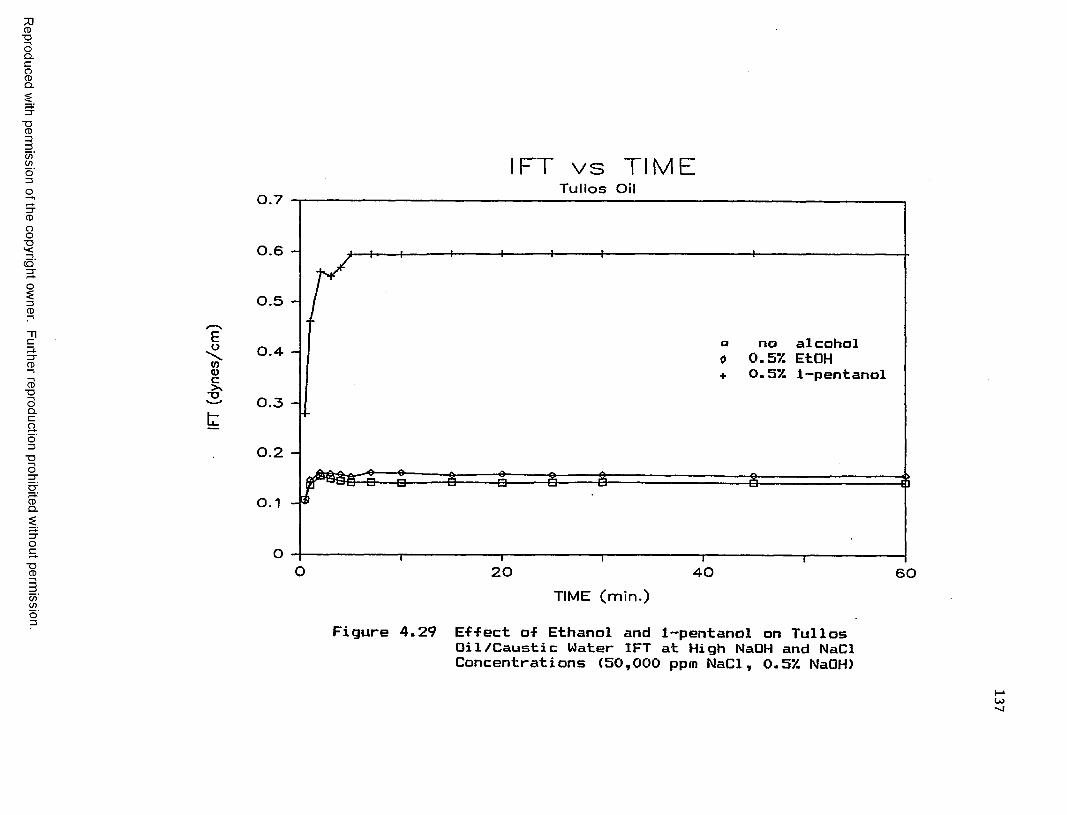
Reproduced
with perm
ission of the
copyright owner.
Further reproduction prohibited
without perm
ission.
Eo\Wa>c•o
IF T v s T I M ETullos Oil0.7
0.6 -
0.5 -
no alcohol 0.57. EtQH 0.57 1-pentanol
0.4 -
0.3 -
0.2 -
0 .1
O 20 4 0 6 0TIME (min.)
Figure 4.29 Effect of Ethanol and 1-pentanol on Tullos Oil/Caustic Water IFT at High NaOH and NaCl Concentrations (50,000 ppm NaCl, 0.57 NaOH)
137
138
molecular weight alcohol should be responsible -For this increase.
4. Summary o-f the IFT Results The addition of water miscible alcohols (methanol,
IPA, 1-propanol) produced a small increase in IFT (about 15%) when 0.5% of the alcohols was added to the alkaline solutions. Some partitioning of the alcohols at the interface may be the cause of this behavior since the alcohols occupy space at the interface that would otherwise be available for surface active species, thereby increasing IFT. This increase in IFT was not observed when ethanol was used on MG3 oil for reasons that could not be determined. Also, the increases in IFT on Tullos oil when 1-propanol or IPA were used were negligible. This behavior was attributed to a possible lower solubility of the alcohols in Tullos oil. This may also explain why the MG3 oil was found to be more sensitive to the alcohols than the Tullos crude.
The higher alcohol concentration used (0.5%) yielded higher IFT values (about 10% higher) than the lower concentration (0.1%). This suggests that the partitioning of the alcohols at the interface increases when higher concentrations of alcohols are present in the alkaline water.
1-Butanol and t-butanol produced higher IFT's than the other water miscible alcohols. This indicates that these two alcohols partition at the interface more than the
Reproduced with permission of the copyright owner. Further reproduction prohibited without permission.
139
lighter alcohols since they are more soluble in the oil than those alcohols. 1-Butanol gave higher IFT's than t-butanol probably due to a higher solubility of 1-butanol in the MG3 oil. Results on Tullos oil showed a similar trend but the increases were more moderate, which suggests that 1-butanol and t-butanol are more soluble in MG3 than Tullos or affect the MG3/alkaline water interface more effectively.
Studies on 1-pentanol, 2-methyl-1-butanol and 3-pentanol showed that the IFT increases as the water solubility of the alcohol decreases. The less water soluble the alcohol, the more it will tend to go into the oil phase or partition at the interface and thereby increase IFT.
At higher electrolyte concentrations <50,000 ppm NaCl,0.5% NaOH), the IFT results were comparable to the ones at the lower electrolyte concentrations <10,000 ppm NaCl, 0.2% or 0.1% NaOH). The higher electrolyte concentration increased the solubility of the alcohols in the oil, but probably due to the Na saturation at the interface, less space was available there for the alcohols to partition. This space reduction limits a potentially higher negative effect of the alcohols on IFT.
From the results obtained from this IFT study, it appears that alcohols may be detrimental to oil recovery since IFT values of crude oi1/alkaline water systems increase when the alcohols, particularly the higher molecular weight alcohols,are added. However, alcohols are
Reproduced with permission of the copyright owner. Further reproduction prohibited without permission.
140
also known to affect phase behavior of crude oil/alkaline water systems. Therefore, flow behavior studies of alcohol- augmented alkaline floods must also be conducted in order to determine the effect of these alcohols on the mechanisms of this enhanced oil recovery process. This study, along with recovery efficiency studies are discussed in the following section.
4.1.2 Effect of Alcohols on Flow Mechanisms and Recovery Efficiency
1. IntroductionSix recovery mechanisms are often mentioned in
alkaline flooding as described in Chapter II. They are the following:
1) Emulsification and entrainment2) Emulsification and entrapment3) Emulsification and swelling of the oil phase4) Emulsification and coalescence of oil droplets5) Wettability alteration6) Solubilization of rigid interfacial films
Improving the effectiveness of any of these mechanisms is essential if alkaline flooding is to become a viable enhanced oil recovery method. The focus of this part of the study is to improve the understanding and efficacy of emulsification mechanisms. Alcohols were used to improve emulsion behaviors of alkaline floods.
Reproduced with permission of the copyright owner. Further reproduction prohibited without permission.
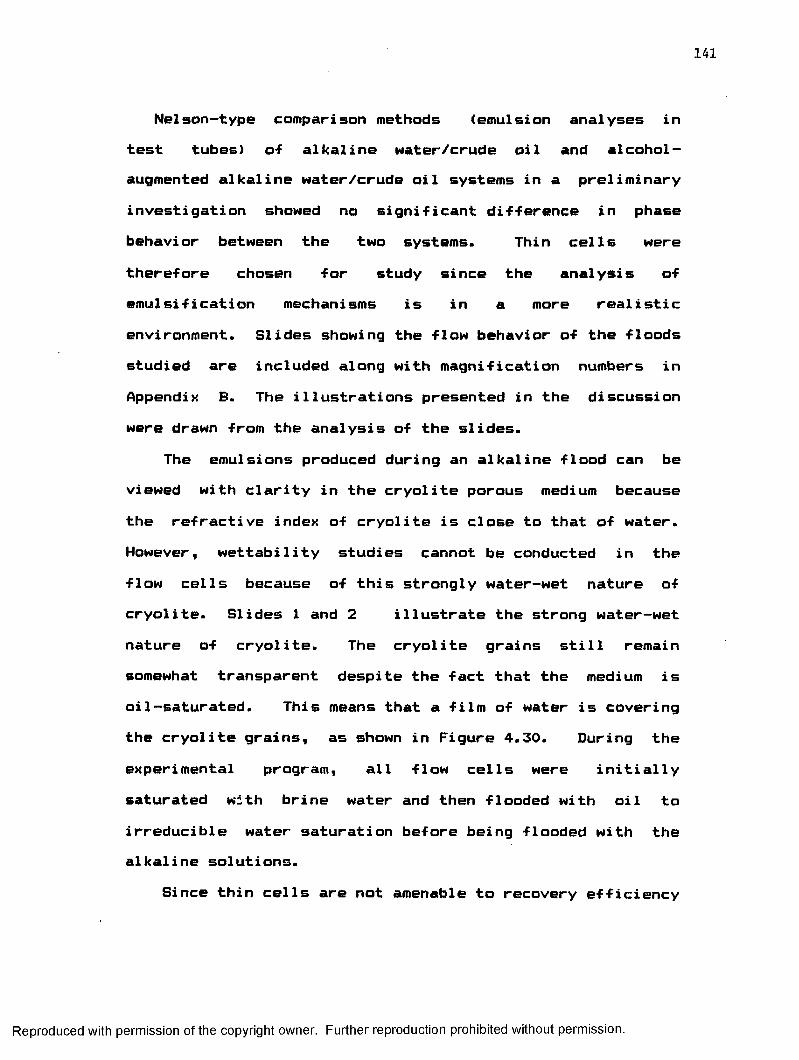
141
Nelson-type comparison methods (emulsion analyses in test tubes) o-f alkaline water/crude oil and alcohol- augmented alkaline Mater/crude oil systems in a preliminary investigation showed no significant difference in phase behavior between the two systems. Thin cells were therefore chosen for study since the analysis of emulsification mechanisms is in a more realistic environment. Slides showing the flow behavior of the floods studied are included along with magnification numbers in Appendix B. The illustrations presented in the discussion were drawn from the analysis of the slides.
The emulsions produced during an alkaline flood can be viewed with clarity in the cryolite porous medium because the refractive index of cryolite is close to that of water. However, wettability studies cannot be conducted in the flow cells because of this strongly water-wet nature of cryolite. Slides 1 and 2 illustrate the strong water— wet nature of cryolite. The cryolite grains still remain somewhat transparent despite the fact that the medium is oil-saturated. This means that a film of water is covering the cryolite grains, as shown in Figure 4.30. During the experimental program, all flow cells were initially saturated with brine water and then flooded with oil to irreducible water saturation before being flooded with the alkaline solutions.
Since thin cells are not amenable to recovery efficiency
Reproduced with permission of the copyright owner. Further reproduction prohibited without permission.
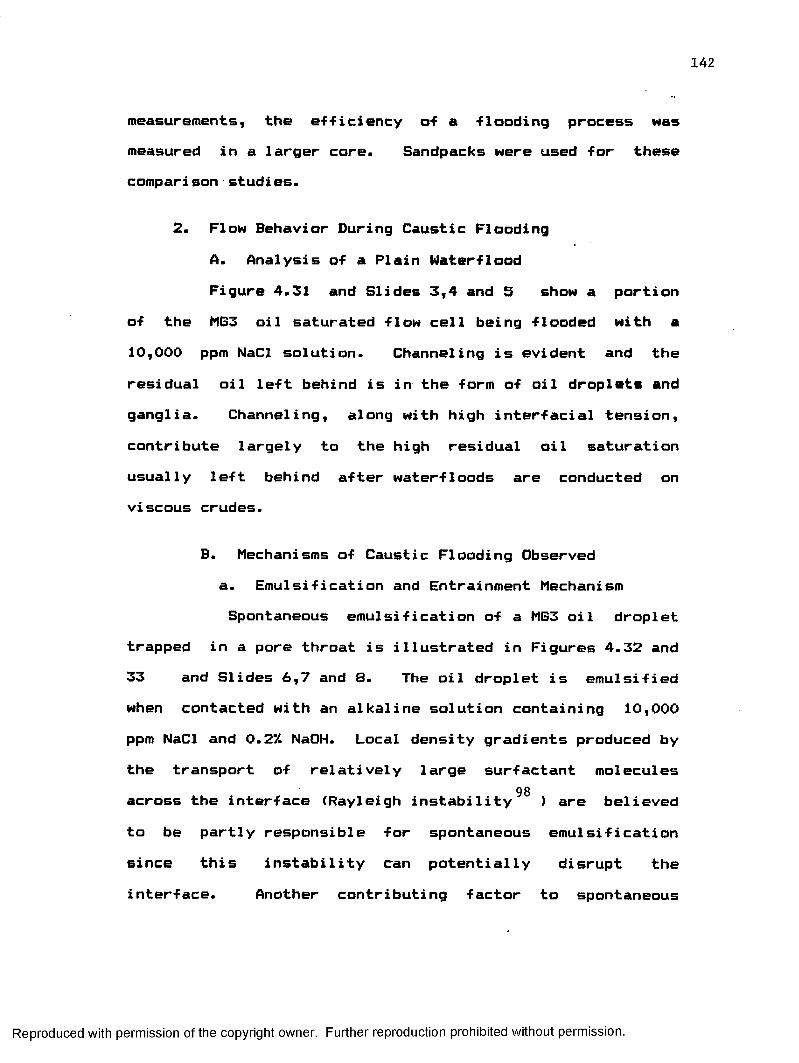
142
measurements, the efficiency of a flooding process wasmeasured in a larger core. Sandpacks were used for these comparison studies.
2. Flow Behavior During Caustic Flooding A. Analysis of a Plain WaterfloodFigure 4.31 and Slides 3,4 and 5 show a portion
of the MG3 oil saturated flow cell being flooded with a 10,000 ppm NaCl solution. Channeling is evident and the residual oil left behind is in the form of oil droplets and ganglia. Channeling, along with high interfacial tension, contribute largely to the high residual oil saturation usually left behind after waterfloods are conducted onviscous crudes.
B. Mechanisms of Caustic Flooding Observeda. Emulsification and Entrainment Mechanism Spontaneous emulsification of a MG3 oil droplet
trapped in a pore throat is illustrated in Figures 4.32 and 33 and Slides 6,7 and 8. The oil droplet is emulsified when contacted with an alkaline solution containing 10,000 ppm NaCl and 0.2% NaOH. Local density gradients produced bythe transport of relatively large surfactant molecules
98across the interface (Rayleigh instability ) are believed to be partly responsible for spontaneous emulsificationsince this instability can potentially disrupt theinterface. Another contributing factor to spontaneous
Reproduced with permission of the copyright owner. Further reproduction prohibited without permission.
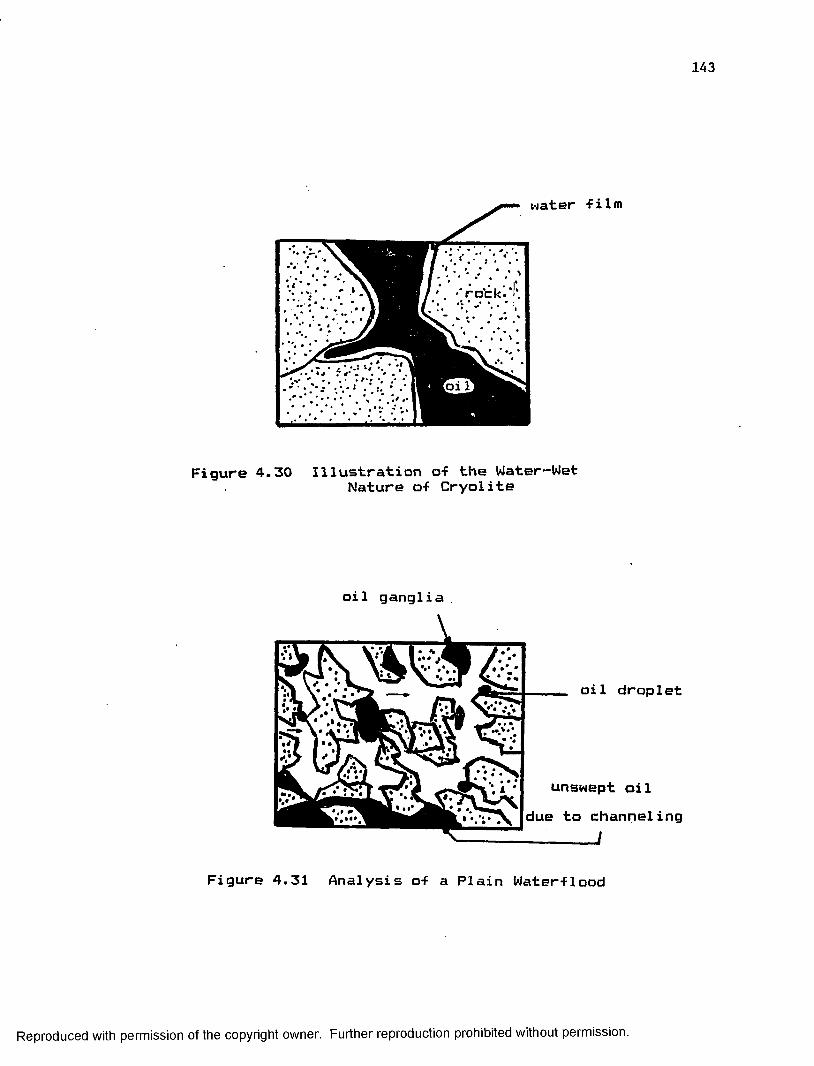
143
Figure 4.30 Illustration of the Water— WetNature of Cryolite
oil ganglia
_ oil droplet
unswept oil due to channeling
J
Figure 4.31 Analysis of a Plain Water-flood
Reproduced with permission of the copyright owner. Further reproduction prohibited without permission.
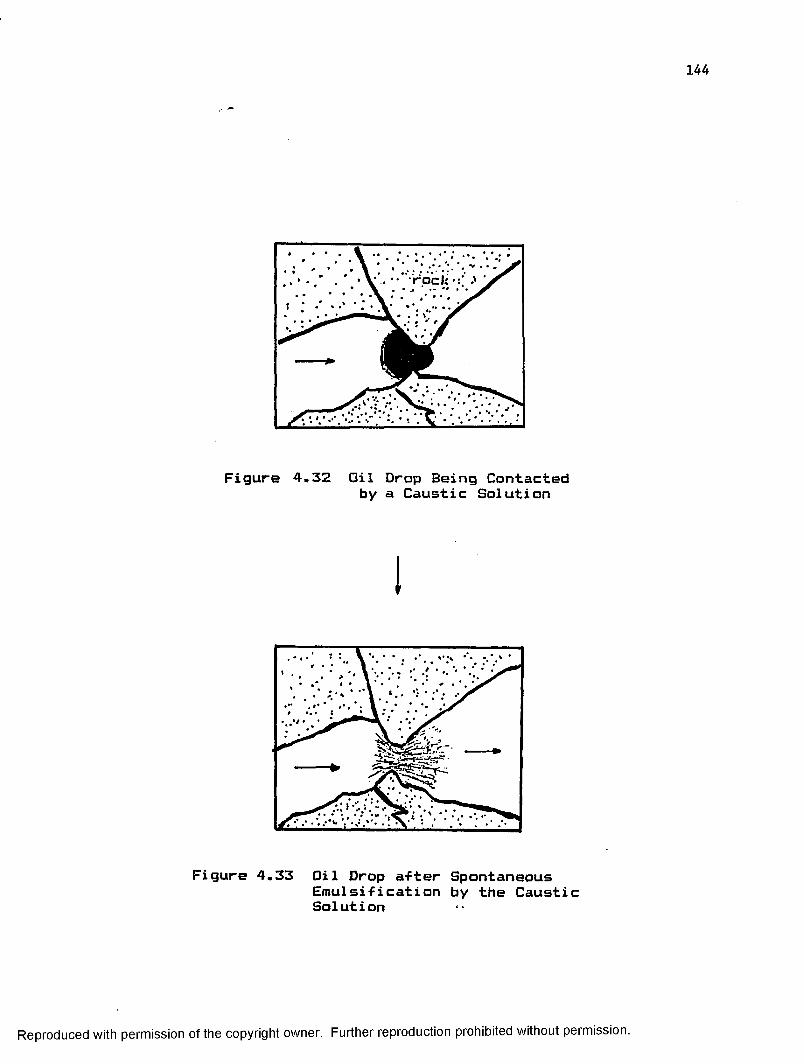
rocl:
Figure 4.32 Oil Drop Being Contacted by a Caustic Solution
Figure 4.33 Oil Drop after SpontaneousEmulsi-fication by the Caustic Solution
Reproduced with permission of the copyright owner. Further reproduction prohibited without permission.
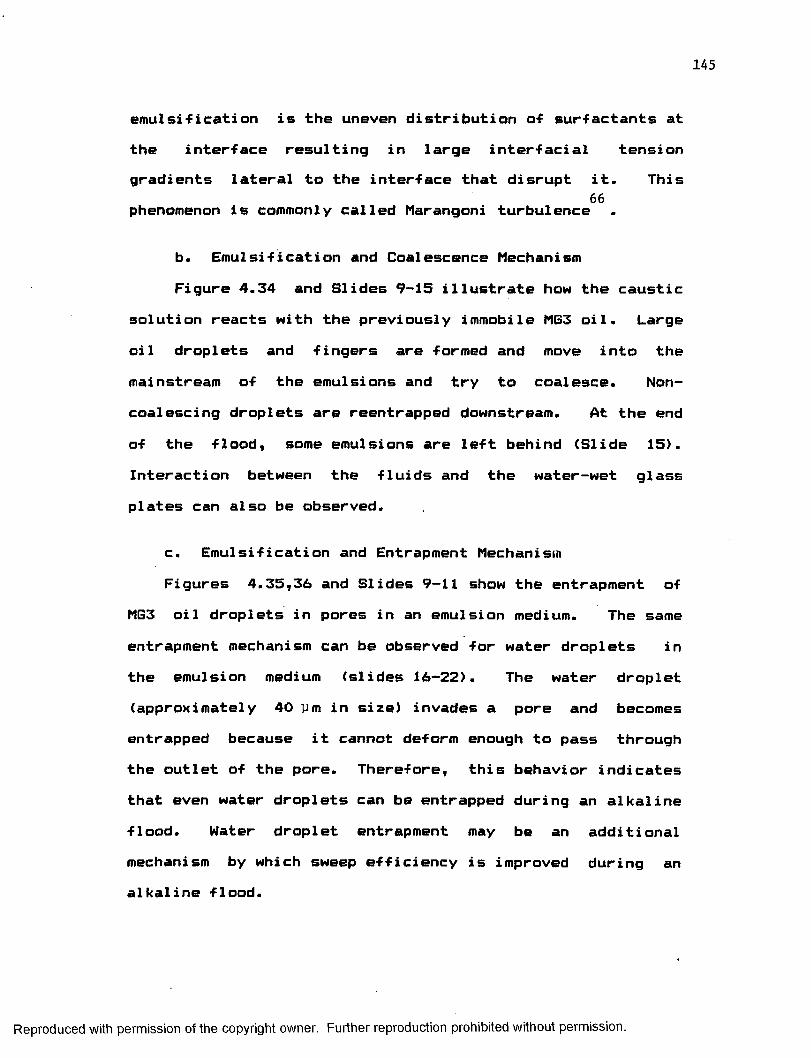
145
emulsi-fication is the uneven distribution o-f surfactants at the interface resulting in large interfacial tensiongradients lateral to the interface that disrupt it. This
66phenomenon is commonly called Marangoni turbulence
b. Emulsification and Coalescence Mechanism Figure 4.34 and Slides 9-15 illustrate how the caustic
solution reacts with the previously immobile MG3 oil. Large oil droplets and fingers are formed and move into the mainstream of the emulsions and try to coalesce. Noncoalescing droplets are reentrapped downstream. At the end of the flood, some emulsions are left behind (Slide 15). Interaction between the fluids and the water— wet glass plates can also be observed.
c. Emulsification and Entrapment Mechanism Figures 4.35,36 and Slides 9-11 show the entrapment of
MG3 oil droplets in pores in an emulsion medium. The same entrapment mechanism can be observed for water droplets in the emulsion medium (slides 16-22). The water droplet (approximately 40 ym in size) invades a pore and becomes entrapped because it cannot deform enough to pass through the outlet of the pore. Therefore, this behavior indicates that even water droplets can be entrapped during an alkaline flood. Water droplet entrapment may be an additional mechanism by which sweep efficiency is improved during an alkaline flood.
Reproduced with permission of the copyright owner. Further reproduction prohibited without permission.
Reproduced
with perm
ission of the
copyright owner.
Further reproduction prohibited
without perm
ission.
coalescing oil droplets emulsion stream
non-coalescing droplets reentrapped
Figure 4.34 Emulsification and Coalescence Mechanism
146

Emulsion Stream
Figure 4.35 Oil Droplet in EmulsionEntering a Pore
I
Figure 4.36 Oil Droplet Reentrappedin Pore
Reproduced with permission of the copyright owner. Further reproduction prohibited without permission.
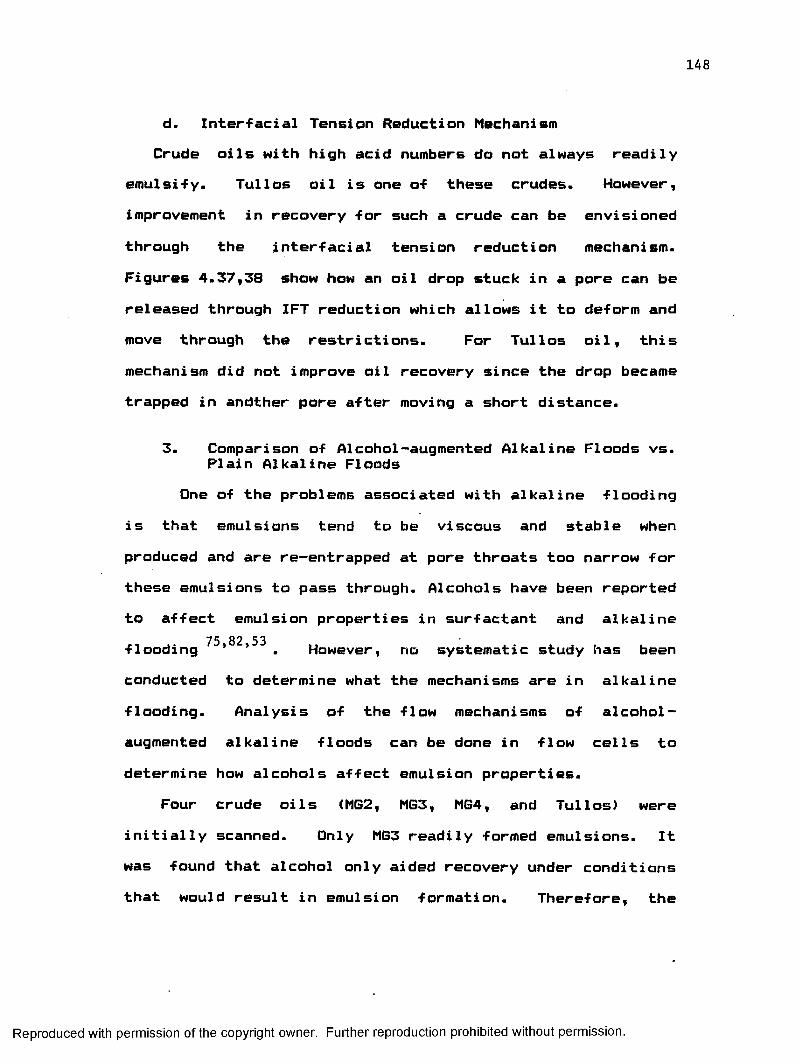
148
d. Inter-facial Tension Reduction Mechanism Crude oils with high acid numbers do not always readily
emulsify. Tullos oil is one o-f these crudes. However, improvement in recovery for such a crude can be envisioned through the interfacial tension reduction mechanism. Figures 4.37,38 show how an oil drop stuck in a pore can be released through IFT reduction which allows it to deform and move through the restrictions. For Tullos oil, this mechanism did not improve oil recovery since the drop became trapped in andther pore after moving a short distance.
3. Comparison of Alcohol-augmented Alkaline Floods vs.Plain Alkaline Floods
One of the problems associated with alkaline flooding is that emulsions tend to be viscous and stable when produced and are re-entrapped at pore throats too narrow for these emulsions to pass through. Alcohols have been reportedto affect emulsion properties in surfactant and alkaline
75 82 53flooding * ’ . However, no systematic study has beenconducted to determine what the mechanisms are in alkalineflooding. Analysis of the flow mechanisms of alcohol- augmented alkaline floods can be done in flow cells todetermine how alcohols affect emulsion properties.
Four crude oils (MG2, MG3, MG4, and Tullos) were initially scanned. Only MG3 readily formed emulsions. It was found that alcohol only aided recovery under conditions that would result in emulsion formation. Therefore, the
Reproduced with permission of the copyright owner. Further reproduction prohibited without permission.
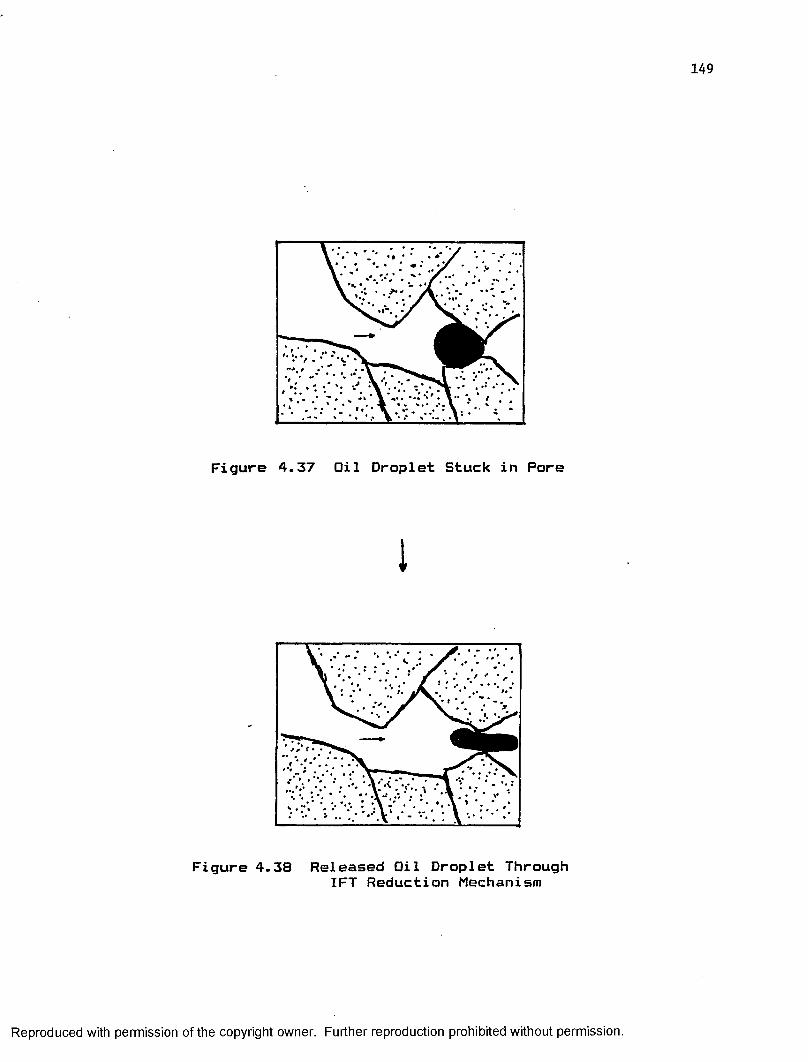
Figure 4.37 Oil Droplet Stuck in Pore
I
Figure 4.38 Released Oil Droplet Through IFT Reduction Mechanism
Reproduced with permission of the copyright owner. Further reproduction prohibited without permission.
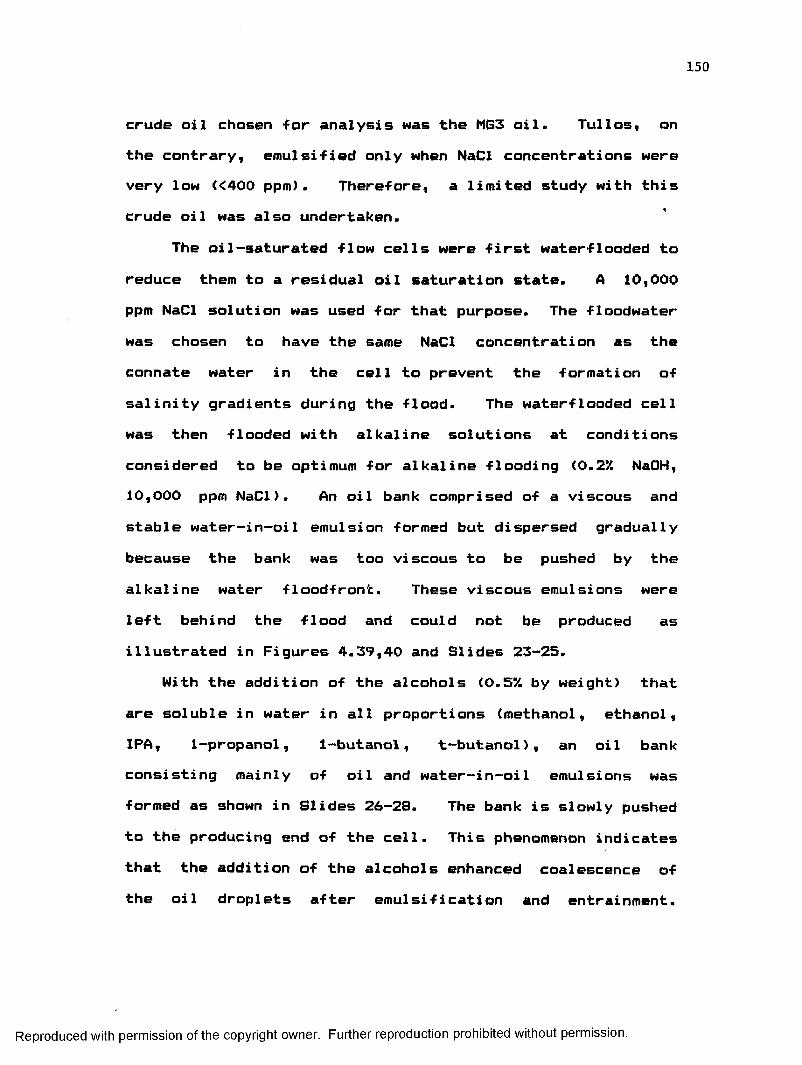
150
crude oil chosen for analysis was the MG3 oil. Tullos, on the contrary, emulsified only when NaCl concentrations were very low (<400 ppm). Therefore, a limited study with this crude oil was also undertaken.
The oil-saturated flow cells were first waterflooded to reduce them to a residual oil saturation state. A 10,000 ppm NaCl solution was used for that purpose. The floodwater was chosen to have the same NaCl concentration as the connate water in the cell to prevent the formation of salinity gradients during the flood. The waterflooded cell was then flooded with alkaline solutions at conditions considered to be optimum for alkaline flooding (0.2% NaOH,10,000 ppm NaCl). An oil bank comprised of a viscous and stable water— in-oil emulsion formed but dispersed gradually because the bank was too viscous to be pushed by the alkaline water floodfront. These viscous emulsions were left behind the flood and could not be produced as illustrated in Figures 4.39,40 and Slides 23-25.
With the addition of the alcohols (0.5% by weight) that are soluble in water in all proportions (methanol, ethanol, IPA, 1-propanol, 1-butanol, t—butanol), an oil bank consisting mainly of oil and water— in-oil emulsions was formed as shown in Slides 26-28. The bank is slowly pushed to the producing end of the cell. This phenomenon indicates that the addition of the alcohols enhanced coalescence of the oil droplets after emulsification and entrainment.
Reproduced with permission of the copyright owner. Further reproduction prohibited without permission.
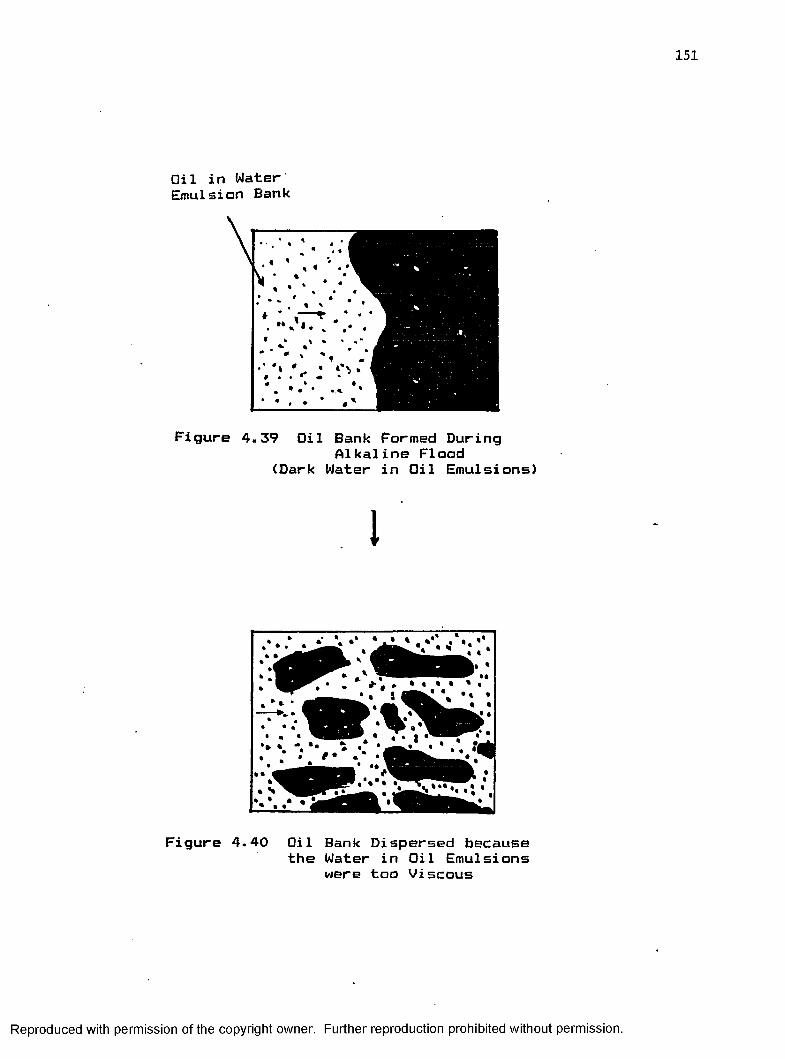
Oil in Water Emulsion Bank
Figure 4.39 Oil Bank Formed DuringAlkaline Flood
(Dark Water in Oil Emulsions)
I
Figure 4.40 Oil Bank Dispersed because the Water in Oil Emulsions
were too Viscous
Reproduced with permission of the copyright owner. Further reproduction prohibited without permission.

152
71Wasan et al. observed similar behavior during a sur-factant ■Flood where the addition of n-hexanol improved the coalescence rate of oil droplets and aided in oil bank formation. Wasan reported that alcohol reduced the crude oil/water interfacial viscosity which aided coalescence. The partitioning of the alcohols at the interface, as discussed in the IFT results, implies that the alkaline/crude interfacial viscosity may also be reduced and produce the rapid coalescence observed in the flood.
The effect of alcohols on interfacial turbulence has64been observed by Davies and Haydon , who took a flash
photograph of a drop of water in toluene containing 147. ethanol and saturated with water, seven seconds after formation. The spontaneously formed emulsion is seen both inside and outside the drop which is "kicking” strongly, as shown on Fig. 4.41.
The emulsions obtained with the addition of the alcohols are lighter in color (more optimum) and appear less viscous than the ones obtained when no alcohol was added. Slides 29-31 (10X magnification) and Slides 32-35 (50Xmagnification) show the emulsions formed with the alcohol- augmented floods. Slides 9-14 illustrate the darkeremulsions obtained when no alcohol was added.
98An attempt was made by Cambridge to measure thesuspected decrease in interfacial viscosity when alcohol is added, with the use of a "SITE LP12" interfacial
Reproduced with permission of the copyright owner. Further reproduction prohibited without permission.
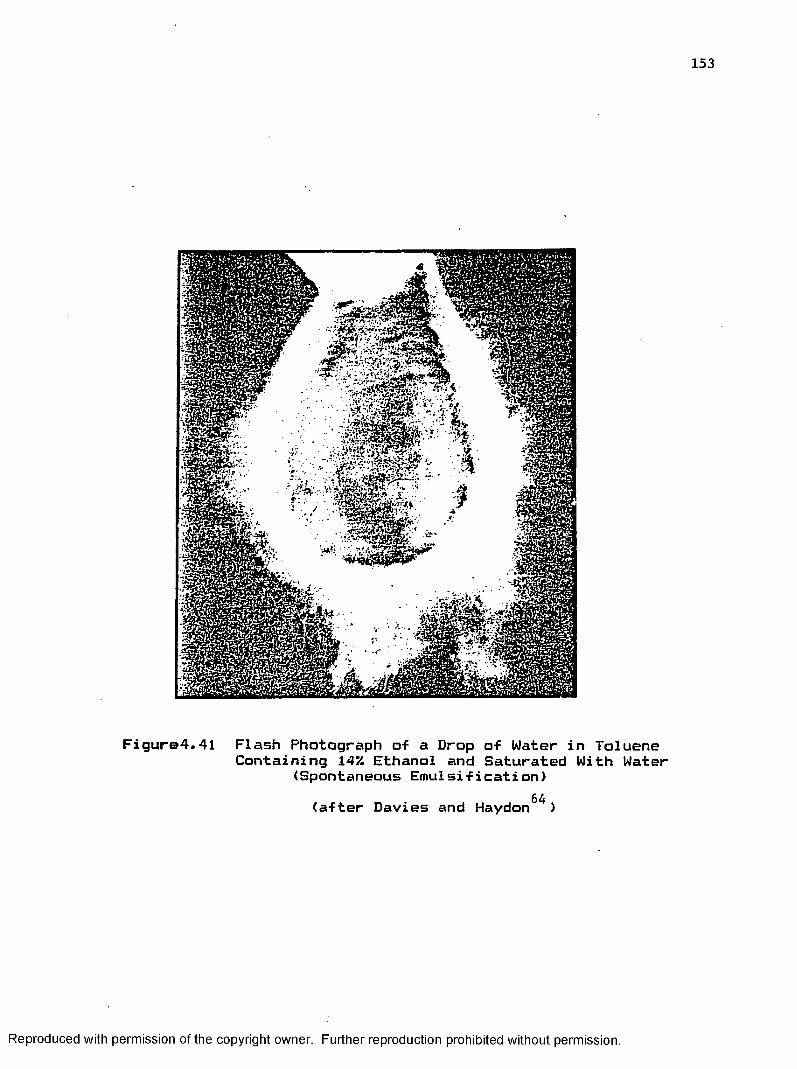
Figure4.41 Flash Photograph of a Drop of Water in Toluene Containing 14"/. Ethanol and Saturated With Water
(Spontaneous Emulsification)64(after Davies and Haydon )
Reproduced with permission of the copyright owner. Further reproduction prohibited without permission.
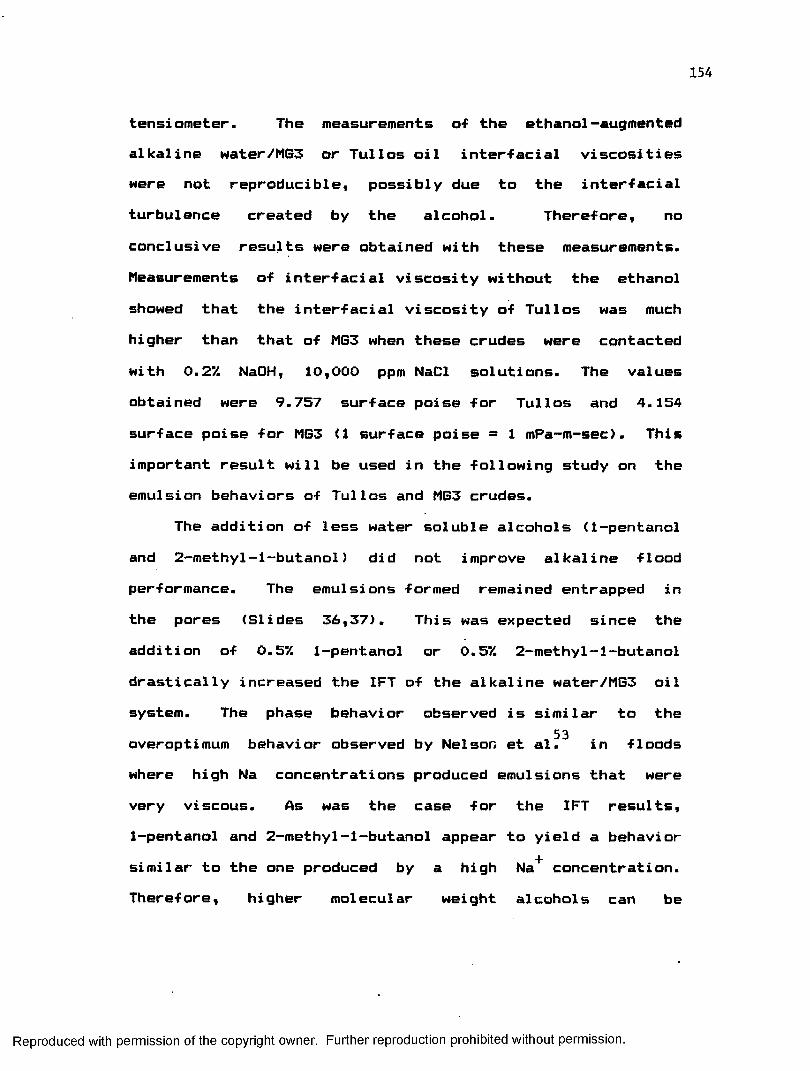
154
tensiometer. The measurements of the ethanol-augmentedalkaline water/MG3 or Tullos oil interfacial viscosities were not reproducible, possibly due to the interfacial turbulence created by the alcohol. Therefore, noconclusive results were obtained with these measurements. Measurements of interfacial viscosity without the ethanol showed that the interfacial viscosity of Tullos was much higher than that of MG3 when these crudes were contacted with 0.27. NaOH, 10,000 ppm NaCl solutions. The values obtained were 9.757 surface poise for Tullos and 4.154 surface poise for MG3 (1 surface poise - 1 mPa-m-sec). This important result will be used in the following study on the emulsion behaviors of Tullos and MG3 crudes.
The addition of less water soluble alcohols (1-pentanol and 2-methyl-1-butanol) did not improve alkaline flood performance. The emulsions formed remained entrapped in the pores (Slides 36,37). This was expected since the addition of 0.5% 1-pentanol or 0.5% 2-methy1-1-butanol drastically increased the IFT of the alkaline water/MG3 oilsystem. The phase behavior observed is similar to the
53overoptimum behavior observed by Nelson et al. in floods where high Na concentrations produced emulsions that were very viscous. As was the case for the IFT results, 1-pentanol and 2-methyl-1-butanol appear to yield a behavior similar to the one produced by a high Na+ concentration. Therefore, higher molecular weight alcohols can be
Reproduced with permission of the copyright owner. Further reproduction prohibited without permission.
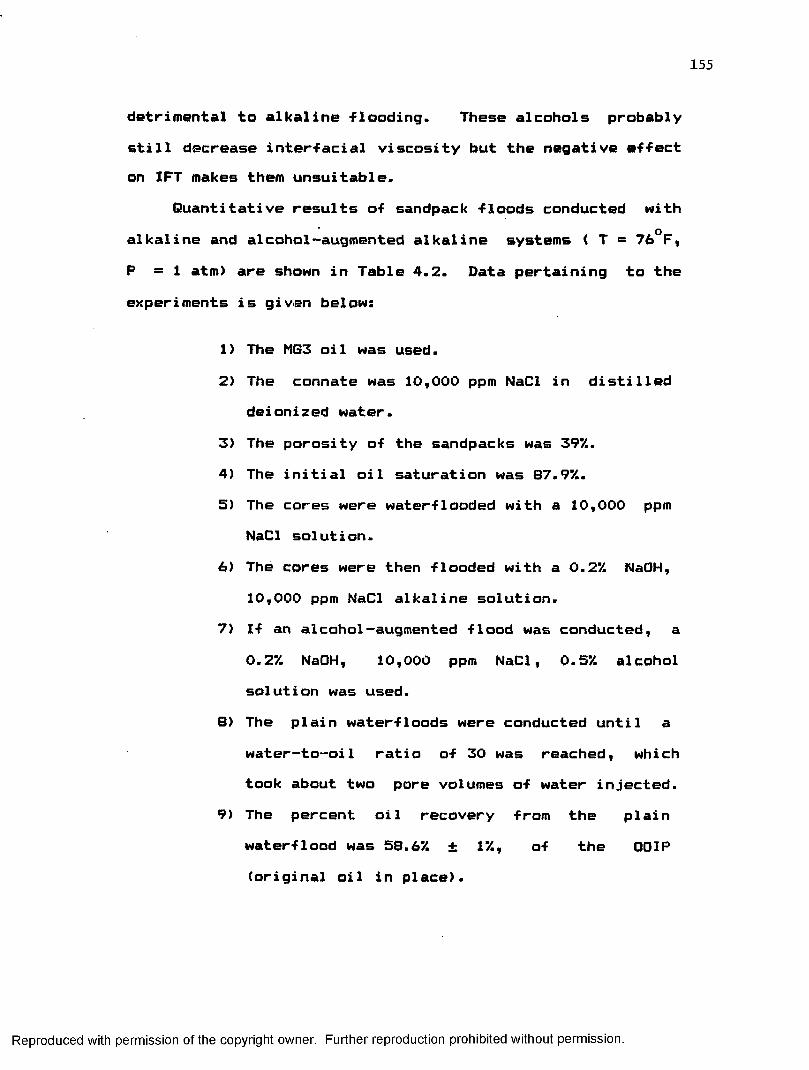
155
detrimental to alkaline flooding. These alcohols probably still decrease interfacial viscosity but the negative effect on IFT makes them unsuitable.
Quantitative results of sandpack floods conducted with alkaline and alcohol-augmented alkaline systems ( T = 76° F, P = 1 atm) are shown in Table 4.2. Data pertaining to the experiments is given below:
1) The MG3 oil was used.2) The connate was 10,000 ppm NaCl in distilled
deionized water.3) The porosity of the sandpacks was 39%.4) The initial oil saturation was 87.9%.5) The cores were waterflooded with a 10,000 ppm
NaCl solution.6) The cores were then flooded with a 0.2% NaOH,
10,000 ppm NaCl alkaline solution.7) If an alcohol-augmented flood was conducted, a
0.2% NaOH, 10,000 ppm NaCl, 0.5% alcoholsolution was used.
8) The plain waterfloods were conducted until a water— to-oil ratio of 30 was reached, which took about two pore volumes of water injected.
9) The percent oil recovery from the plainwaterflood was 58.6% ± 1 % , of the 00IP(original oil in place).
Reproduced with permission of the copyright owner. Further reproduction prohibited without permission.

Table 4.2 Sandpack Flood Recovery Results on MG3 Oil
Type of alcohol Solubility in Mater□□IP
Total '/. Recovery, X
7. improvement in recovery Mith alcohol X - 72.1V.
Methanol Ethanol
IPA 1-propanol 1-butanol t-butanol 3-pentanol
2-methyl—1 butanol1-pentanol
miscible
5.5g/100g water 0 30 C3.6g/100g water @ 30°C2.7g/100g water @ 22°C
78.179.981.9 79.0 83.3 84. &83.2
74.7
68.6
6.07.8 9.'56.9 11.2 12.5 10.1
2.6
-3.5
* X " Plain waterflood followed by alcohol augmented alkaline flood** 72.17. ° X recovery after plain waterflood and plain alkaline flood•a# December 1986 bulk alcohol prices were used
Additional coat incurred by alcohol7bbl of incremental oil <*/bbl> ***
0.731.37
1.48
Reproduced with permission of the copyright owner. Further reproduction prohibited without permission.
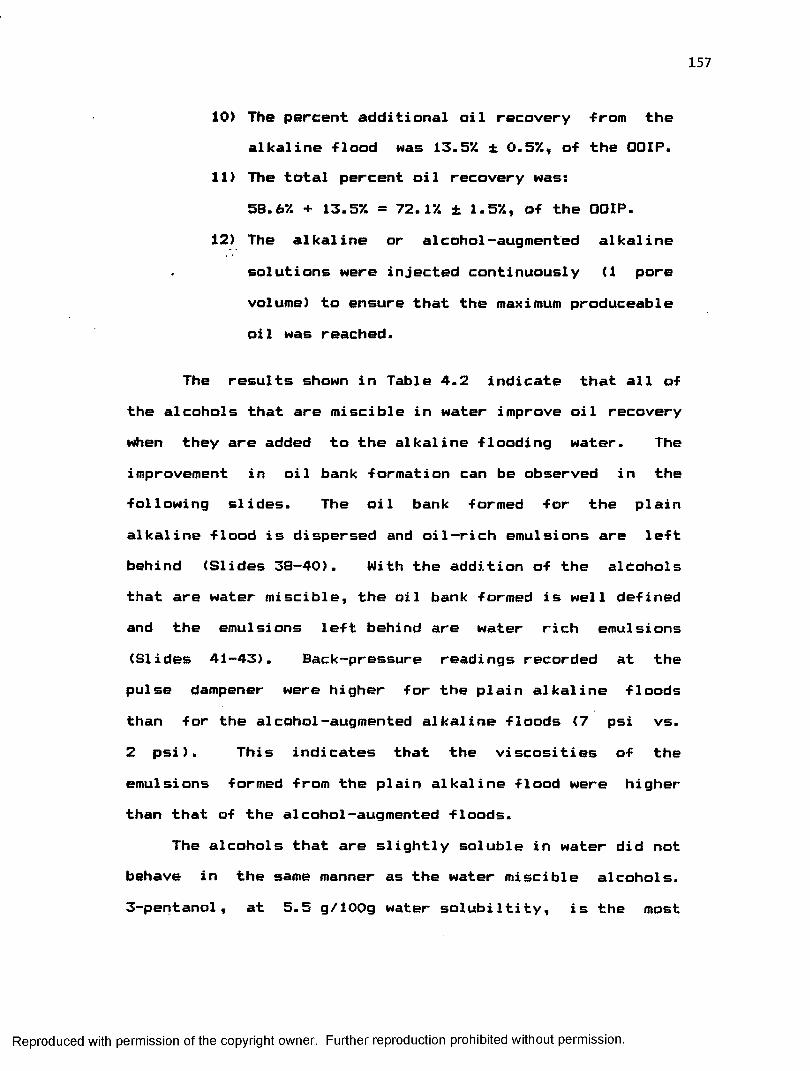
157
10) The percent additional oil recovery from the alkaline flood was 13.5% ± 0.5%, of the ODIP.
11) The total percent oil recovery was:58.6*/. + 13.57. = 72.17. ± 1.57., of the 001P.
12) The alkaline or alcohol-augmented alkalinesolutions were injected continuously (1 porevolume) to ensure that the maximum produceable oil was reached.
The results shown in Table 4.2 indicate that all of the alcohols that are miscible in water improve oil recovery when they are added to the alkaline flooding water. The improvement in oil bank formation can be observed in the following slides. The oil bank formed for the plain alkaline flood is dispersed and oil-rich emulsions are left behind (Slides 38-40). With the addition of the alcohols that are water miscible, the oil bank formed is well defined and the emulsions left behind are water rich emulsions (Slides 41-43). Back-pressure readings recorded at the pulse dampener were higher for the plain alkaline floods than for the alcohol-augmented alkaline floods (7 psi vs. 2 psi). This indicates that the viscosities of the emulsions formed from the plain alkaline flood were higher than that of the alcohol-augmented floods.
The alcohols that are slightly soluble in water did not behave in the same manner as the water miscible alcohols.3-pentanol, at 5.5 g/lOOg water solubiltity, is the most
Reproduced with permission of the copyright owner. Further reproduction prohibited without permission.
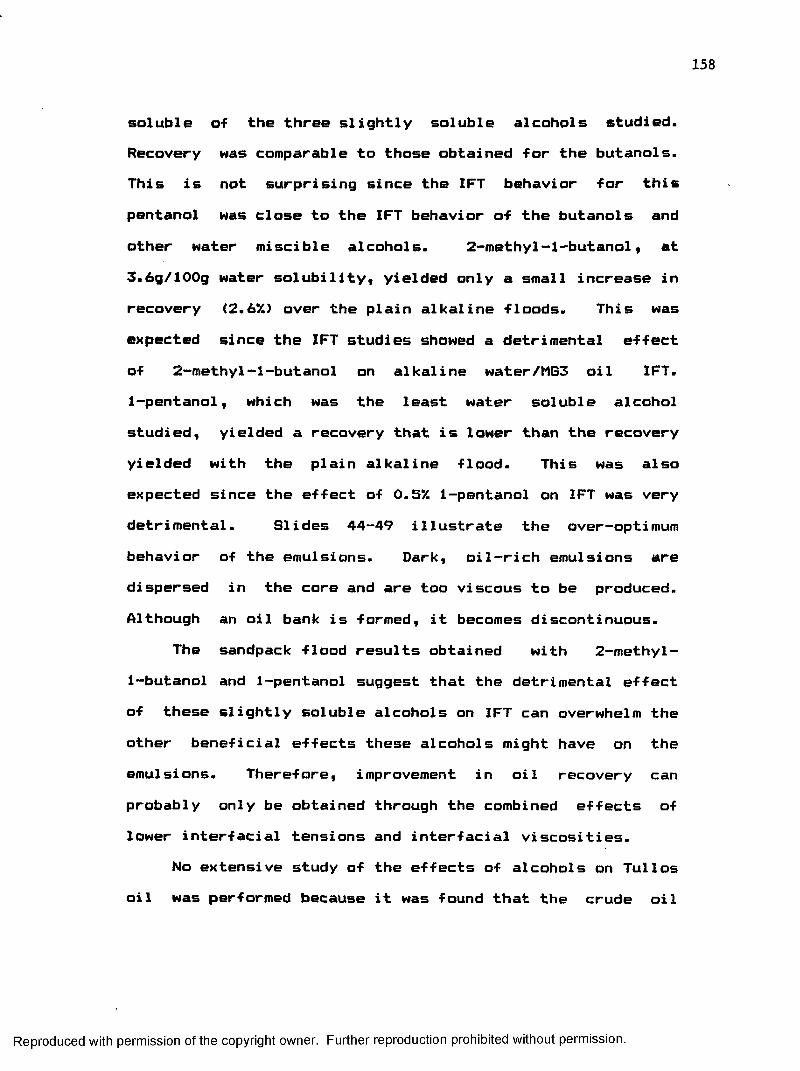
158
soluble of the three slightly soluble alcohols studied. Recovery was comparable to those obtained for the butanols. This is not surprising since the IFT behavior for this pentanol was close to the IFT behavior of the butanols and other water miscible alcohols. 2-methyl-1-butanol, at 3.6g/100g water solubility, yielded only a small increase in recovery (2.6%) over the plain alkaline floods. This was expected since the IFT studies showed a detrimental effect of 2-methyl-1-butanol on alkaline water/MB3 oil IFT. 1-pentanol, which was the least water soluble alcohol studied, yielded a recovery that is lower than the recovery yielded with the plain alkaline flood. This was also expected since the effect of 0.5% 1-pentanol on IFT was very detrimental. Slides 44-49 illustrate the over— optimum behavior of the emulsions. Dark, oil-rich emulsions are dispersed in the core and are too viscous to be produced. Although an oil bank is farmed, it becomes discontinuous.
The sandpack flood results obtained with 2-methyl- 1-butanol and 1-pentanol suggest that the detrimental effect of these slightly soluble alcohols on IFT can overwhelm the other beneficial effects these alcohols might have on the emulsions. Therefore, improvement in oil recovery can probably only be obtained through the combined effects of lower interfacial tensions and interfacial viscosities.
No extensive study of the effects of alcohols on Tullos oil was performed because it was found that the crude oil
Reproduced with permission of the copyright owner. Further reproduction prohibited without permission.
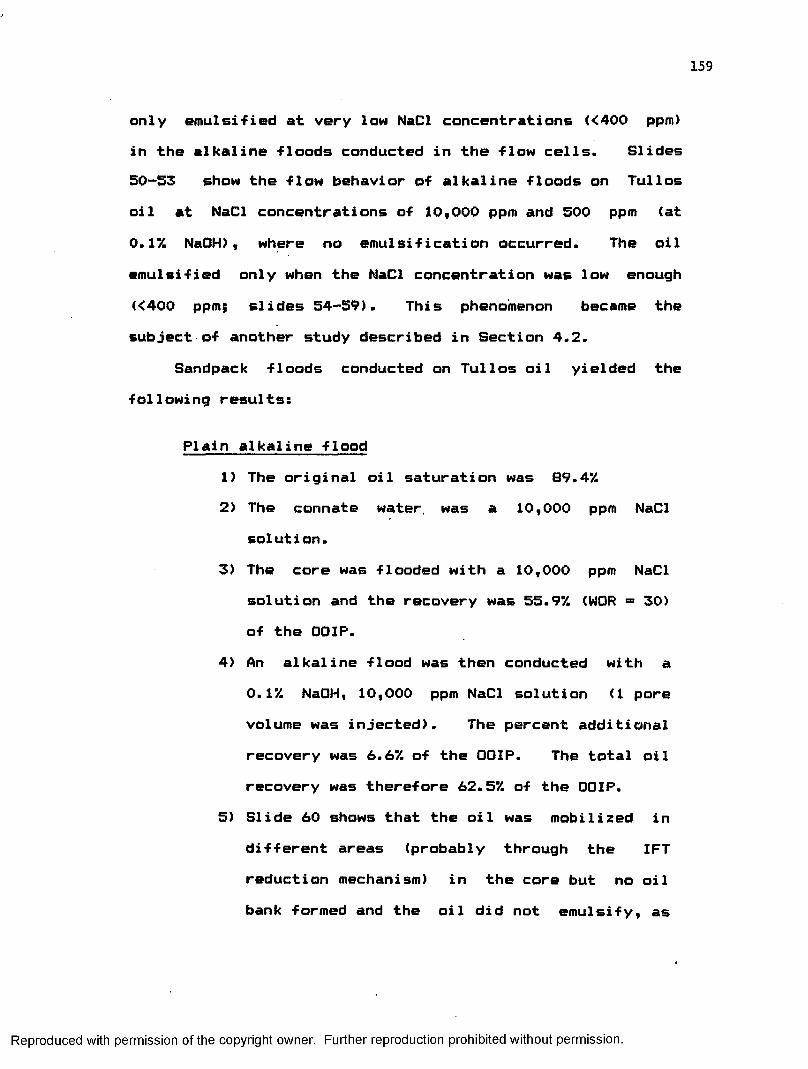
159
only emulsified at very low NaCl concentrations (<400 ppm) in the alkaline -Floods conducted in the -Flow cells. Slides 50-53 show the -Flow behavior of alkaline floods on Tullos oil at NaCl concentrations of 10,000 ppm and 500 ppm (at 0.151 NaOH), where no emulsification occurred. The oil emulsified only when the NaCl concentration was low enough (<400 ppm; slides 54-59). This phenomenon became the subject of another study described in Section 4.2.
Sandpack floods conducted on Tullos oil yielded the following results:
Plain alkaline flood1) The original oil saturation was 89.4%2) The connate water, was a 10,000 ppm NaCl
solution.3) The core was flooded with a 10,000 ppm NaCl
solution and the recovery was 55.9% (W0R = 30) of the 00IP.
4) An alkaline flood was then conducted with a 0.1% NaOH, 10,000 ppm NaCl solution (1 pore volume was injected). The percent additional recovery was 6.6% of the 00IP. The total oil recovery was therefore 62.5% of the 00IP.
5) Slide 60 shows that the oil was mobilized in different areas (probably through the IFT reduction mechanism) in the core but no oil bank farmed and the oil did not emulsify, as
Reproduced with permission of the copyright owner. Further reproduction prohibited without permission.
160
the -flow cell experiments predicted.
Ethanol-augmented alkaline -floods <0.5%)To determine whether or not alcohol improves the
recovery of crude oils that do not emulsify readily when contacted with alkaline solutions, ethanol-augmented floods on the Tullos oil were also conducted. The plain waterflood recovery was 55.8% of the OOIP and the percent additionalrecovery from ethanol was 7.4% of the OOIP as compared tothe 6.6% of the OOIP obtained with a plain alkaline flood. The incremental recovery of the ethanol-augmented flood over the plain alkaline waterflood was therefore only 0.8%, which is not a significant increase in recovery. The oil was mobilized in different areas in the core but no oil bank was formed and the oil did not emulsify, which negated the effect of alcohol. Therefore, the addition of alcohols tonon-emulsifying crude oils is probably of no benefit inalkaline flooding. To further prove this point, alkaline floods and ethanol-augmented alkaline floods were conducted on Tullos oil at low NaCl concentrations <400 ppm NaCl). The following data was obtained from the alkaline flood:
1) The initial oil saturation was 89.4%.2) The connate water was a 400 ppm NaCl solution.3) The core was waterflooded with a 400 ppm NaCl
solution and the percent oil produced was 53.4% of the 00IP.
Reproduced with permission of the copyright owner. Further reproduction prohibited without permission.
161
4) An alkaline flood was then attempted with a 0.1% NaOH, 400 ppm NaCl solution.
5) The percent additional oil recovery was 10.1% of the □□IP, and therefore the total oil recovery was 63.5% of the OOIP.
Data for the ethanol-augmented flood was as follows:
1) The percent oil produced from the plain waterflood was 53.5% of the OOIP.
2) The core was then flooded with a 0.1% NaOH, 400 ppm NaCl, 0.5% ethanol solution.
3) The percent additional oil recovery was 15.3% of the OOIP, and total oil recovery was 68.8% of the 00IP.
Therefore, an improvement of 5.3% in recovery was recorded when ethanol was added. This shows again that an alcohol miscible with water can improve oil recovery if emulsification occurs. On the other hand, the least water soluble alcohol studied, 1-pentanol yielded no improvement in recovery (at 0.1% NaOH, 400 ppm NaCl) when 0.5% of this alcohol was added, as was the case for the MG3 oil. Again, the very detrimental effect of 1-pentanol on Tullos oil/alkaline water IFT may have overwhelmed the beneficial effects the alcohols may have had on the emulsions.
Another crude oil, the MB4 oil, also from the Vinton Field in Louisiana (specific gravity = 0.855; V = 1.91 cp; acid number = 0.216 mg of KOH/g of oil), did not emulsify at
Reproduced with permission of the copyright owner. Further reproduction prohibited without permission.
162
moderate NaCl concentrations (10,000 ppm). Corefloods conducted to determine i-f alcohol-augmented floods (0.2% NaOH, 10,000 ppm NaCl, 0.5% IPA) improved oil recovery over plain alkaline floods for MG4 showed that the addition of IPA did not improve the recovery. 88.5% of the OOIP was produced from the plain alkaline flood vs. 88.2% for the IPA-augmented alkaline flood. These high recoveries were attributed to the low viscosity of the oil.
The Bayou Bleu crude, from Plaquemine, Louisiana, emulsified readily when contacted by an alkaline solution (0.2% NaOH, 10,000 ppm NaCl). Flow cell studies showed an improvement in oil bank formation when 0.5% ethanol wasadded to the alkaline solution. However, due to the high
oviscosity of the crude (V = 13.40 cp at 210 F), the oil bank quickly became discontinuous and beneficial effects of alcohols were overwhelmed by the detrimental effect of high crude oil viscosity. In such a case, a mobility control agent must be added to the flooding water to prevent the dispersion of the oil bank. Coreflood results on Bayou Bleu oil were erratic due to the high viscosity of the crude, which made the reproducibility of the floods impossible to achieve.
4. Summary of the Flow Cell and Coreflood studiesThe addition of water miscible alcohols (methanol,
ethanol, IPA, 1-propanol, 1-butanol, t-butanol) improved the oil bank formation during alkaline flooding by helping
Reproduced with permission of the copyright owner. Further reproduction prohibited without permission.
163
in the coalescence o-f oil droplets after they have been emulsified and entrained. The alcohols that partition at the interface probably decrease the interfacial viscosity which helps the oil droplets to coalesce and form an oil bank. Interfacial viscosity measurements of ethanol- augmented systems were not reproducible, for reasons yet to be determined. A possible reason is the increased interfacial turbulence created by the addition of the alcohol. The water miscible alcohols also improved the phase behavior of crude/alkaline water systems. The dark viscous emulsions became light mobile emulsions when the alcohols were added.
Emulsion screening tests similar to those used by53Nelson et al. were conducted, but the results obtained were
inconclusive. Flow cell tests, on the other hand, represented flow behaviors more accurately, due to the fact that a more realistic flow environment is provided. Flow cell screening tests could therefore be very useful in determining the suitability of certain crudes for alkaline and alcohol-augmented alkaline floods. Sandpack floods conducted with the addition of the water miscible alcohols mentioned above showed a marked improvement in oil recovery (up to 12.5%) over the plain alkaline floods.
The addition of the less water soluble alcohols (1-pentanol and 2-methyl-l-butanol) did not improve the alkaline floods. Heavy emulsions were farmed and remained
Reproduced with permission of the copyright owner. Further reproduction prohibited without permission.
164
entrapped in the pores. This was expected since the addition of 0.5 7. 1-pentanol or 2-methyl-l— butanol drastically increased the IFT of the alkaline water/crude oil systems. These alcohols probably still decrease inter-facial viscosities, but their negative e-f-fect on IFT makes them unsuitable -for caustic -flooding.
Crude oils that did not emulsi-fy readily when contacted with caustic were not a-f-fected by alcohol, which indicates that alcohol can only improve recovery o-f crude oils that emulsi-fy. This theory was proven when the Tullos oil was used. Improvement in recovery was -found only when it emulsi-fied (at low NaCl concentrations, 400 ppm or less>. At 10,000 ppm NaCl concentrations, Tullos oil did not emulsi-fy and no improvement in recovery was observed.
For oils that are very viscous and emulsi-fy, alcohol alone will not be su-f-ficient for improving oil recovery. Oil banks that are formed will still disperse, as the floods on the Bayou bleu crude showed. Therefore, a mobility control agent is needed to prevent the oil bank formed from becoming dispersed in this type of system.
4.2 Effect of Crude Oil Composition on Flow Behavior When Tullos and MG3 crudes were contacted by alkaline
solutions, MG3 emulsified readily even at very high NaCl concentrations 050,000 ppm), whereas Tullos only emulsified at very low NaCl concentrations (< 400 ppm). The IFTbehavior of MG3 and Tullos crudes also differed. To explain
Reproduced with permission of the copyright owner. Further reproduction prohibited without permission.
165
these differences, the physical and chemical properties of these crudes would need to be determined. Studies of this nature would aid in developing screening criteria for future caustic flooding field projects.
Some of the physical and chemical properties of Tullos and MG3 crudes are listed in Table 4.3. The major difference noted in the properties listed is the acid number. Although the acid number of Tullos is lower thanMG3f it is significantly above what is considered adequate
42for alkaline floodingA difference in the bulk viscosities of the two oils
was also noted. The viscosity of Tullos was reduced to 6.15 cp (similar to M63) by adding 11.63% by weight decane. Thin cell floods indicated that the lower viscosity Tullos oil was more efficiently swept by alkaline flooding but emulsification was not observed. This indicates that the phase behavior was not affected by bulk viscosity. In addition, infrared (IR) and nuclear magnetic resonance (NMR) spectra as well as gas chromatography separations indicated that the two crudes were chemically very similar^. Since the differences in behavior between Tullos and MG3 could not be attributed to the bulk physical or chemical properties of the crudes, the properties of the caustic/crude interface were more closely studied.
The interfacial behavior of Tullos and MG3 were compared since recovery efficiency and emulsion formation have been
Reproduced with permission of the copyright owner. Further reproduction prohibited without permission.

Table 4.3 Physical and Chemical Properties of MG3 and Tullos Oils
MG3Viscosity, cpat 210'F 6.64Density, g/ccat 74*F 0.931P = 1 atmAcid Numbermg KOH/g oil 3.50MolecularWei ght 248-258Range,g/gm-mole
Tullos
10.18
0.930
1.84
255-265
Reproduced with permission of the copyright owner. Further reproduction prohibited without permission.
167
related to caustic/crude oil inter-facial properties. The IFT o-f Tullos was -found to be slightly lower than that o-f MG3 at comparable NaCl and NaOH concentrations, indicating that Tullos should be more ef-ficiently recovered. IFT vs. time measurements (Figures 4.1,2 and Tables A.1,2) were described earlier (section 4.1.1 (1)) at various NaOHconcentrations (0.2-1.05£ with 10,000 ppm NaCl). The results showed that the IFT's o-f both MG3 and Tullos increased with increasing NaOH concentrations, but the range spanned by MG3 at 10 min. (0.1142-0.3288 dynes/cm) was much larger than that spanned by Tullos (0.0749-0.1155 dynes/cm). The IFT vs. time curve of Tullos was also found to be more stable than that of MG3; i.e., the Tullos IFT vs. time curveremained at low IFT's longer without a dramatic upswing for
3a wider range of NaOH and NaCl concentrations. Yenreported that the interfacial activity of lower molecular weight petroleum acids was less sensitive to baseconcentration than that of higher molecular weight acids(average MW of 340 vs. 260). A difference in the molecular weight of Tullos and MG3 acids could therefore account for the difference in their interfacial behavior. Extraction and analysis of the acids in the crude would be necessary in order to prove this theory.
For this purpose, Tullos and MG3 crudes were fractionated by Wolcott and Constant ^ using the procedure described in Section 3.2.5 of Chapter III. The fractions
Reproduced with permission of the copyright owner. Further reproduction prohibited without permission.
168
obtained were the -followings- Pentane (fraction A)- Toluene (fraction B)- 10% IPA/toluene (fraction C>- 257. MeOH/toluene (fraction D)- 0. IN HC1 in 507. MeOH/toluene followed by 0.2N HC1
in MeOH (fraction E)
The analysis of the fractions yielded the following.. 96results t
Fraction AIR and NMR spectra were similar to the whole crudes.
The elemental analyses for C,H,N,Q,S were similar to the whole crudes except that the oxygen content was reduced. The acid number of the fraction was less than 0.1 mg of KOH/g of oil. No interfacial activity was noticed when fraction A was contacted with aqueous NaOH solutions. It was therefore concluded that fraction A consists of the bulk of the crude with the acidic components removed.
Fraction BIR spectra of both MG3 and Tullos showed an OH" band
in the 3250-3380 cm Vange and several peaks which can be attributed to aromatic structures. The spectra are indicative of phenols and no carbonyl stretch was observed.
The NMR spectra show aliphatic and aromatic protons. The IFT of aqueous NaOH solutions/fraction B was lower than
Reproduced with permission of the copyright owner. Further reproduction prohibited without permission.

169
the IFT of -Fraction A but it was much higher than the whole crude 01.0 dynes/cm). The acid number, as expected, was still low (<10). It was concluded therefore that fraction B was predominantly phenols.
Fraction CIR spectra showed the presence of phenols similar to
fraction B, but they also showed a small C=0 stretch near 1700 cm The NMR spectra were similar to that of fraction B. The IFT behavior was intermediate between Fractions B and the acidic fractions D and E and the acid number was also intermediate (acid number approximately equal to 30). It was concluded that fraction C contained phenols and carboxylic acids.
Fractions D and EIR and NMR spectra were characteristic of aliphatic
carboxylic acids. Aromatic protons were present but were in smaller concentrations than in other fractions or in the whole crudes. The IFT was initially very low but increased rapidly with time. The acid numbers were very high (> 50). Therefore, these fractions contain carboxylic acids, mostly of the aliphatic type.
It is important to note that the fractions of MS3 were found to be very similar to the fractions of Tullos. Also, when the acid numbers of all the fractions were added, the values obtained were very close to the actual acid number
Reproduced with permission of the copyright owner. Further reproduction prohibited without permission.
170
values o-f the original crudes. This means that negligible amounts of acids, if any, Mere lost during the separation procedure. Also, since the molecular weight ranges of the E fractions of both crudes (MG3 and Tullos) were found to be very close <258 for MG3; 272 for Tullos), it should be noted
3that Yen's theory of similar molecular weight acids in crude oil yielding similar IFT responses to caustic concentration does not apply in this case; as IFT and emulsion behaviors of MG3 and Tullos are completely different. Also, as explained earlier in this section, bulk viscosities of the crudes cannot account for this difference in emulsion behavior. Therefore, the focus is now to determine which fractions of the crudes are responsible for emulsification or non-emulsification.
For this purpose, each fraction from the MG3 and Tullos crudes were analyzed in the visual flow cells. Each fraction was dissolved in toluene (0.020 g/5 ml of toluene). The fractions were injected in brine saturated flow cells <10,000 ppm NaCl solutions as connate water) until the cells were saturated with the fractions. Each cell with its respective fraction was then alkaline flooded with a 0.2V. NaOH, 10,000 ppm NaCl solution to determine if emulsification occurred. The results are shown in Table 4.4.
As expected, fractions A and B of both crudes did not emulsify (Slides 61-65) as these fractions contained little
Reproduced with permission of the copyright owner. Further reproduction prohibited without permission.
171
or no carboxyl ic acids. Fractions C,D,E o-f both crudes emulsified as expected since they contained substantial amounts of carboxylic acids (slides 66-72).
The next step was to combine fractions that did and did not emulsify. First, fractions A and E were combined. Approximate concentrations of these fractions in their respective crudes were measured and appropriate quantities were mixed. The same flooding procedure outlined above was used. As Table 4.4 shows, fractions A for both Tullos and MG3 crudes did not inhibit emulsification (Slides 73 and 74 for Tullos A + E; Slides 75 and 76 for MG3 A + E). Cross combinations of fractions A and E from each crude (fraction A of Tullos + fraction E of MG3 (Slides 77,78), and fraction A of MG3 + fraction E of Tullos (Slides 79,80)) yielded similar results, proving again that there are no fundamental differences between fractions A or E of each crude.
When fractions A,B and E of Tullos were mixed at concentrations similar to the concentrations of these fractions in the whole Tullos crude, no emulsification occurred (slides 81-84). This proves that fraction B is the emulsion inhibitor of the Tullos crude. Comparison of the amount of fraction B obtained from each crude shows that much larger amounts of fraction B were extracted from the Tullos crude than from the MG3 crude. It was also noticed that fraction B was much more viscous (tar— like material) than the other fractions. Interfacial viscosities of MG3
Reproduced with permission of the copyright owner. Further reproduction prohibited without permission.

Table 4.4 Flow Behavior of Crude Oil Fractions
Crude Oil Fraction EmulsificationType TypeMG3 A noII nB no" C yes" D yes" E yes" A + E yes
Tullos A noB no
" C yesD yes
" E yes" A + E yes
Tullos AMG3 E yesMG3 A
Tullos E yesTullos A + B + E no
Reproduced with permission of the copyright owner. Further reproduction prohibited without permission.

173
97and Tullos crudes conducted by Cambridge' showed that the interfacial viscosity of Tullos was much higher than that of MG3 (9.757 ± 0.66 vs. 4.154 ± 1.305 surface poise).Moreover, interfacial viscosities of the combination of fractions A,B and E of Tullos were found to be much higher than those of the combination of fractions A and E alone (11.73 ± 2.94 vs. 3.29 ± 1.575 surface poise). Thissuggests that fraction B material, which is mainly composed of phenols that do not reduce IFT, is responsible for the increase in interfacial viscosity. This contribution would have the effect of preventing the emulsification of Tullos oil. This effect is much weaker for the MG3 oil since the quantity of fraction B available in MG3 is much less than in Tullos, which allows the MG3 oil to emulsify readily when contacted with alkaline solutions. These results have shown that the viscous fraction B (mainly composed of phenols) of crude oils plays an important role in emulsion behavior.
i
4.3 Oxidation Studies85 67Studies conducted by Dahmani and Cambridge found
that the acid numbers of low acidity crudes can bedramatically increased by in-situ air oxidation inunconsolidated cores. As expected, acid numbers were foundto increase with increasing temperature, pressure, airflowrate, and reaction time. Adequate oxidation could
Reproduced with permission of the copyright owner. Further reproduction prohibited without permission.
174
therefore be produced at various typical reservoir conditions by adjusting the reaction time.
The caustic/crude oil interfacial tensions of oxidized crudes were found to be much lower than those of the parent crudes (Table 4.5). This indicates that the oxidation process resulted in the formation of chemical species which are capable of forming beneficial surfactants. Unoxidized crudes which were dissolved in toluene and subjected to rotary evaporation had IFT's similar to the ones of theuntreated crudes, which indicated that the IFT of the crude
99was not affected by the extraction processAs an extension of the previous studies, this study
serves to determine whether chemical species formed in oxidation are capable of forming beneficial surfactants and improving oil recovery. Sandpack flooding experiments were conducted on unoxidized and oxidized crudes.
Results of the floods conducted on the Oklahoma I crude are shown in Table 4.6. These results indicate that the oxidized oil yielded a higher recovery efficiency than the unoxidized oil even though no attempts were made to optimize the IFT for the floods. This shows that air oxidation of crude oil can result in higher oil recovery, and proves that chemical species capable of forming beneficial surfactants have been produced in the crude oil.
Alkaline floods were not conducted on the Texas and Oklahoma II crudes because the residual oil left after plain
Reproduced with permission of the copyright owner. Further reproduction prohibited without permission.
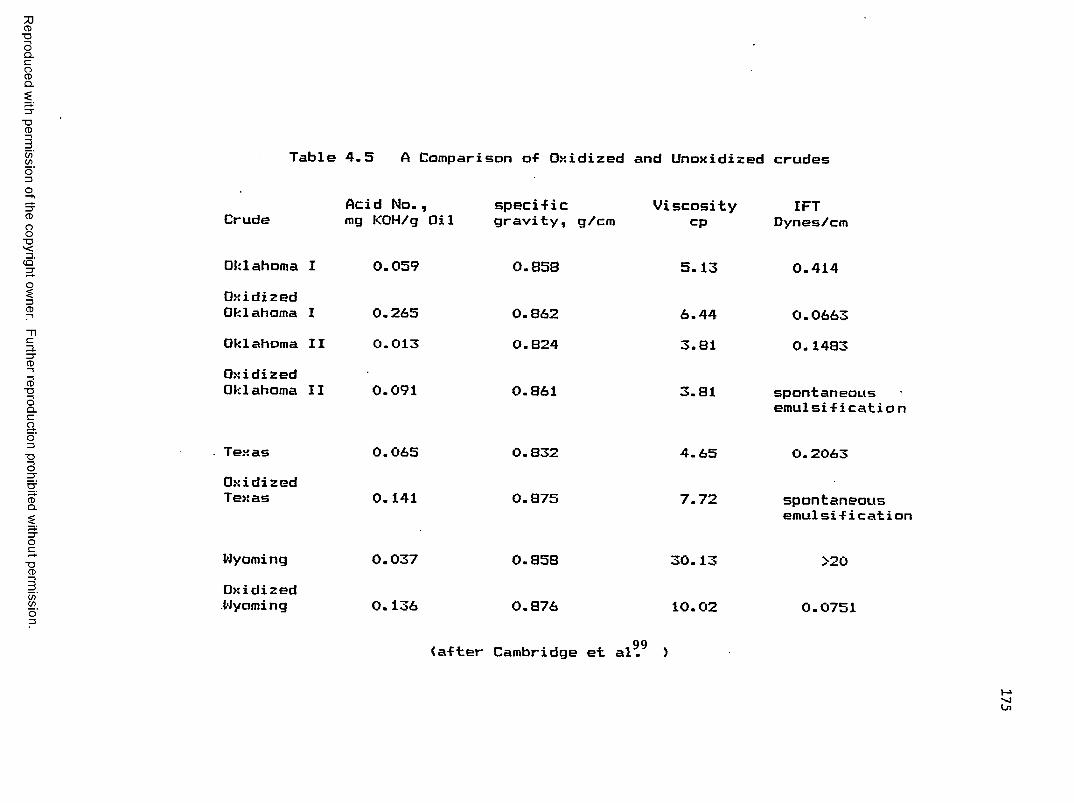
Reproduced
with perm
ission of the
copyright owner.
Further reproduction prohibited
without perm
ission.
Table 4.5 A Comparison of Oxidized and Unoxidized crudes
CrudeAcid No., mg KOH/g Oil
specific gravity, g/cm
ViscosityCP
IFTDynes/cm
Oklahoma IOxidized Oklahoma IOklahoma IIOxidized Oklahoma II
0.059
0.2650.013
0.091
0.858
0.8620.824
0.861
5.13
6.443.81
3.81
0.414
0■0663 0.1483
spontaneous emulsif i cation
TexasOxidizedTexas
0.065
0.141
0.832
0.875
4.65
7.72
0.2063
spontaneous emulsifi cation
WyomingOxidizedWyoming
0.037
0.136
0.858
0.876
30. 13
10.02
>20
0.0751
9 9(after Cambridge et al. )
175
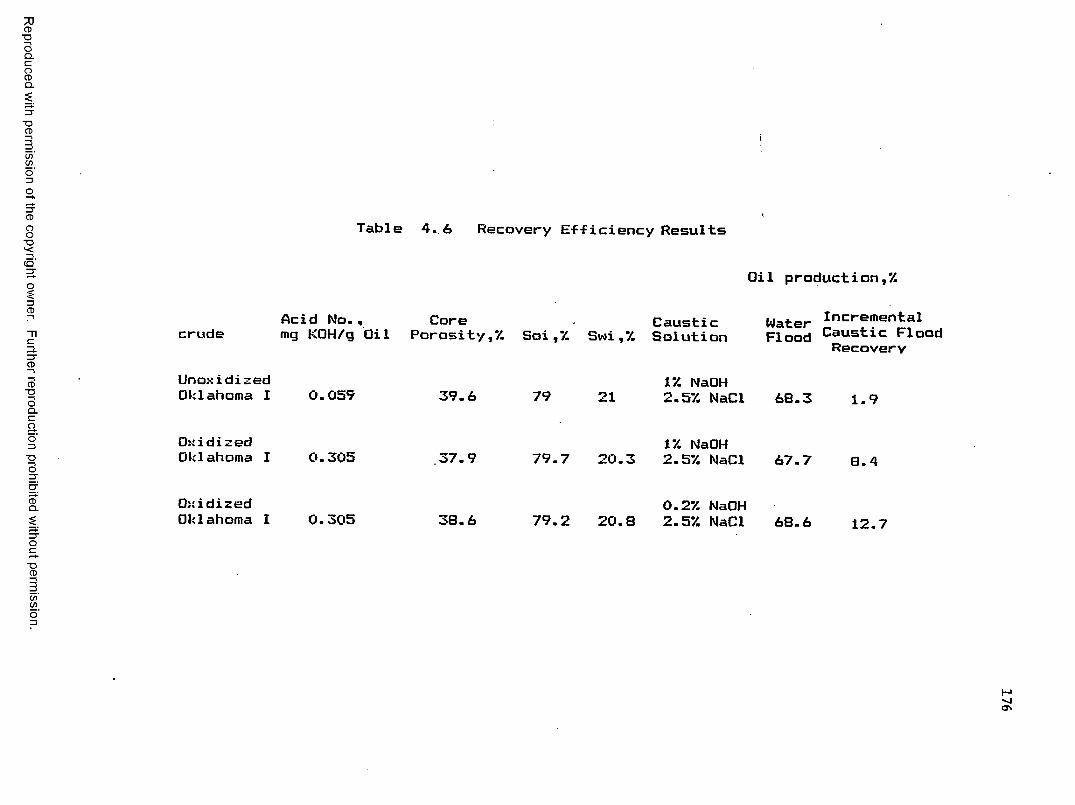
Reproduced
with perm
ission of the
copyright owner.
Further reproduction prohibited
without perm
ission.
I
Table 4..6 Recovery E-f-ficiency Results
Oil production,/1!
Acid No., Core Caustic Water *ncremer,,fcalcrude mg KQH/g Oil Porosity,*/. Soi ,7. Swi,*/. Solution Flood Causti<= FloodRecoveryUnoxidized jy. NaOHOklahoma I 0.059 39.6 79 21 2.57. NaCl 68.3 1.9
Oxidized 1% NaOHOklahoma I 0.305 .37.9 79.7 20.3 2.57. NaCl 67.7 8.4
Oxidized 0.27. NaOHOklahoma I 0.305 38.6 79.2 20.8 2.5% NaCl 68.6 12.7
176
177
water-floods (25,000 ppm NaCl -floods) was too low (< 10% o-F the 00IP) to justify the use of alkaline flooding.
For the Wyoming crude, a much lower viscosity of the oxidized oil was obtained (1/3 of the viscosity of the unoxidized crude). This was due to the addition of toluene during extraction procedures. Even though most of the toluene was removed with, the rotary evaporator, the quantity of toluene left in the crude was enough to drastically change the viscosity of this higher viscosity crude. The differences in viscosity between the oxidized and unoxidized Wyoming crudes resulted in large mobility ratio differences during the sandpack floods, which in turn made comparison between recoveries of oxidized and unoxidized Wyoming oil impossible.
The flooding results obtained with Oklahoma I crude are encouraging. However, more data on other crudes is needed to confirm the results. IFT data on Texas, Oklahoma II and Wyoming crudes is promising (much lower IFT's of the oxidized crudes were recorded) and it is suspected that alkaline floods on these oxidized crudes could definitely yield better results than if those crudes were not oxidized.
Reproduced with permission of the copyright owner. Further reproduction prohibited without permission.
CHAPTER V
CONCLUSIONS AND RECOMMENDATIONS
5.1 ConclusionsAlkaline flooding -for enhanced oil recovery has been
experimentally investigated and methods were developed to improve the efficiency and predictability of the process. The problems associated with current alkaline flooding technology were addressed in three ways. The phase behavior of the flood medium was optimized by the addition of alcohol co-surfactants. Crude oil composition was correlated with flood behavior to provide predictive methods of alkaline flood performance. Finally, alkaline flood recovery efficiencies of oxidized crudes were measured to determine the benefits of in-situ air oxidation for improving the surfactant content of low acidity crudes.Water miscible alcohol additives (methanol, ethanol, IPA,
1-propanol, 1-butanol, t-butanol> were found to significantly improve the alkaline recovery of certain crudes. Flood performance was found to depend on the water solubility of alcohol as well as the phase behavior of the crude/alkaline water system. Oil recovery decreased as the solubility of the alcohol in water decreased, and crudes which did not readily emulsify on contact with alkaline water did not show enhanced recovery with alcohol addition.
178
Reproduced with permission of the copyright owner. Further reproduction prohibited without permission.
179
The relationship of oil recovery with water solubility of alcohol was shown to be due to the effect of alcohol on the alkaline water/crude oil interfacial tension. Water miscible alcohols had little effect on the crude oil/water interfacial tension; whereas, less soluble alcohols caused a dramatic upswing in the IFT which was detrimental to oil recovery. This increase in IFT was attributed to partitioning of the more oil soluble alcohols at the crude oil/alkaline water interface. The IFT behavior of alcohol additives was similar to that of higher concentrations of NaOH or brine which is to reduce the interfacial area available to active surfactant species. Therefore, it is proposed that as the concentration of alcohol at the interface increases, less space is available for interfacially active species to decrease interfacial tension.
Microscopic studies of alcohol-augmented alkaline floods showed that alcohol changed the phase behavior of the flood medium. Dark, viscous emulsions became light-colored and flowed freely upon the addition of water miscible alcohols. The reduction in emulsion viscosity resulted in improved sweep efficiency. The water miscible alcohols also destabilized emulsions and improved oil drop coalescence, which aided in the formation of an oil bank. The faster rate of coalescence was attributed to a reduction in the crude oil/alkaline water interfacial viscosity.
Reproduced with permission of the copyright owner. Further reproduction prohibited without permission.
180
Two acidic crude oils (Tullos and MG3), which represented extremes in emulsion behavior, were -fractionated by ion exchange chromatography and the chemical compositions of the fractions were determined. Tullos and MG3 fractions were found to have similar chemical compositions. The interaction of the fractions with alkaline water was observed in thin flow cells. Only the carboxylic acid fractions were found to form emulsions. The Tullos phenolic fraction was found to be responsible for the lack of emulsification noted for the Tullos crude. This viscous phenolic fraction may be accumulating at the crude oil/alkaline water interface and hampering emulsification. Measurements of oil drop coalescence rates showed that the addition of the phenolic fraction caused a dramatic increase in the alkaline water/crude oil interfacial viscosity which would be expected to reduce emulsification.
In continuation of the oxidation studies conducted by Dahmani and Cambridge*^ , recovery results obtained by alkaline flooding Oklahoma I crude in sandpacks showed that the oxidized oil yielded 10% higher recovery than the unoxidized oil. Therefore, interfacially active species capable of improving oil recovery were produced through the oxidation of the crude by air injection.
These studies have shown that alkaline flooding technology can be improved with a clearer understanding of the chemistry and mechanisms involved. The alcohol assisted
Reproduced with permission of the copyright owner. Further reproduction prohibited without permission.
181
alkaline flood and in-situ oxidation technique extend the range of conditions under which alkaline flooding procedures can be applied. The fractionation studies have aided in identifying which components in crude oil affect oil recovery. Microscopic studies contributed to theunderstanding of the mechanisms of alkaline flooding, and sandpack floods provided useful data for the eventual transfer of this technology to field operations.
5.2 Recommendations1. The effect of water miscible alcohols on other
crude oils that emulsify when contacted with alkaline solutions should be determined to further confirm the present results. The effect of other slightly water soluble high molecular weight alcohols should also be investigated to further prove the negative impact of these alcohols on alkaline flooding. Other acidic crudes that do not emulsify readily on contact with alkaline solutions containing sodium chloride should be studied to confirm the negligible effect of alcohols on non-emulsifying crudes.
2. The effect of alcohols on highly viscous crudes should be investigated when mobility control agents are added to the alkaline floodwater.
3. The effect of varying the concentrations of the phenolic fraction in crude oil must be checked to determine whether emulsification of crude oil is dependent on the concentration of this fraction. A more detailed
Reproduced with permission of the copyright owner. Further reproduction prohibited without permission.
182
characterization of the phenolic fraction is also needed to determine the specific components responsible for thealteration of emulsion behavior.
4. Chemical composition and viscosity studies of the crude oil/alkaline water interface should be undertaken to determine the contributions of the different crude oil fractions to interfacial properties.
5. More crudes should be oxidized and sandpack floods of these crudes should be conducted to confirm the positive effect of oxidation on the recovery of crude oil by alkaline flooding.
Reproduced with permission of the copyright owner. Further reproduction prohibited without permission.
REFERENCES
1- J. C. Melrose and C. F. Brandner: "Role o-f CapillaryForces in Determining Microscopic Displacement Efficiency for Oil Recovery by Waterflooding", Journal of Canadian Petroleum Technology (Dec., 1974) 13, 54-62.2. Donnan, Zeit Fhysikal. Chem., 51, 43 (1899)3. T. F. Yen: "Correlation of Petroleum Components Properties for Improved Waterflooding", DOE report No. 12382-11, (Aug., 1982).4. H. Hartridge and R. Peters, Proceedings of Royal Society (London), A101, 348 (1922).5. H. Atkinson: "Recovery of Petroleum from Oil BearingSands", U.S. patent No. 1, 651, 311. (Nov., 1927).6. D. J. Graue and C. E. Johnson Jr.: "Field Trial of Caustic Flooding Process", Journal of Petroleum Technology (Dec., 1974) 1353-1357.7. P. Raimondi, B. J. Gallagher, R. Ehrlich, J. H.Messner, and G. S. Bennett: "Alkaline Waterflooding: Designand Implementation of a Field Pilot", SPE paper No. 5831 presented at the SPE-AIME Improved Oil Recovery Symposium, Tulsa, OK, (March, 1976).8. R. 0. Leach, 0. R. Wagner, H. W. Wood, and C. F.Harpke: "A Laboratory and Field Study of WettabilityAdjustment in Waterflooding", Journal of Petroleum Technology (Feb., 1962) 206-212, Trans. AIME, 225.9. L. W. Emery, N. Mungan, and R. W. Nicholson: "Caustic Slug Injection in the Singleton Field", Journal of Petroleum Technology (Dec., 1970) 1569-1576.10. V. S. Breit, and E. H. Mayer: "Caustic Flooding inthe Wilmington field, California, Modeling and Field Results", 1981 European Symposium on EDR, Bournemouth, England (Sept., 1981).11. B. Sloat and D. Zlomke: "The Isenhour Unit — A UniquePolymer Augmented Alkaline Flood", SPE paper No. 17019 presented at the 3rd D0E/SPE E0R Symposium, Tulsa, OK, (April, 1982).
183
Reproduced with permission of the copyright owner. Further reproduction prohibited without permission.

184
12. R. J. Robinson: "A caustic Steamflood Pilot - KernRiver Field", SPE paper No. 6523 presented at the 47th Annual California Regional Meeting, Bakersfield, CA, (April, 1977).13. D. T. Konopnicki and L. G. Zambrano: "Application of the Alkaline Flooding Process in the Torrance Field", SPE paper No. 11701 presented at the 4th SPE/DOE Symposium, Tulsa, OK, (April, 19B4).14. R. S. Boardman: " Design and Implementation of FourEnhanced Recovery Projects in Bay Fields of South Louisiana", SPE paper No.10697 presented at the 3rd SPE/DOE Symposium, Tulsa, OK, (april, 1982).15. J.J. Taber: "Dynamic and Static Forces Required to Remove a Discontinuous Oil Phase from Porous Media Containing both Oil and Water", Journal of Petroleum Technology (March, 1969).16. N. R. Morrow, and I. Chatzis: "Measurements and Correlation of Conditions for Entrapment and Mobilization of Residual Oil", Final Report to the U.S. DOE, Report No. DOE/BETC/3251-12 (Oct., 19B1).17. L. Cuiec: "Rock/Crude Oil Interactions andWettability: An Attempt to Understand their Interrelation",SPE paper No. 13211 presented at the 58th Ann. Tech. Conf. and Exhib. , Houston, TX (Sept., 1984).18. L. E. Treiber, D. L. Archer, and W. W. Owens: "A Laboratory Evaluation of the Wettability of Fifty Oil- Producing Reservoirs", Society of Petroleum Engineers Journal, Trans. AIME (1972), 253.19. Adam: "The Physics and Chemistry of Surfaces", 3rd ed. (Oxford, 1941) p. 179.20. 0. R. Wagner and R. 0. Leach: "Improving OilDisplacement by Wettability Adjustment", Trans. AIME (1959) 216, 65-72.21. R. Ehrlich and R. J. Wygal Jr.: "Interrelation of Crude Oil and Rock Properties with the Recovery of Oil by Caustic Waterflooding", paper No. 5830, Improved Oil Recovery Symposium of the Society of Petroleum Engineers of AIME, Tulsa, OK, (March 22-24, 1976).22. P. Brauer and D. T. Wasan: "Microwave Spectroscopic Analysis of Caustic Waterflooding of Heavy Crude Oil", in Annual Proceedings of Heavy Oil/EOR Contractor Presentation- Conference - 800750, (Sept., 1980).
Reproduced with permission of the copyright owner. Further reproduction prohibited without permission.
185
23. W. R. Foster: "A Low Tension Waterflooding Process",Journal of Petroleum Technology (Feb., 1973).24. C. E. Cooke Jr., R. E. Williams and P. A. Kolodzie:"Oil Recovery by Alkaline Waterflooding", Journal of Petroleum Technology (dec., 1974) 1365-1374.25. R. Ehrlich and F. E. Crane: "A Model for Two Phase Flowin Consolidated Materials", Society of Petroleum Engineers Journal (June, 1969) 221-231, Trans. AIME, 246.26. R. Ehrlich, H. H. Hasiba, and P. Raimondi: "Alkaline Waterflooding for Wettability Alteration - Evaluating a Potential Field Application", Journal of Petroleum Technology, (Dec., 1974).27. C. E. Johnson, Jr., Chevron Oil Field Research Co.: "Status of Caustic and Emulsion Methods", Journal ofPetroleum Technology (Jan., 1976) 87-88.28. P. Subkow: "Process for the Removal of Bitumen fromBituminous Deposits", U.S. Patent No. 2,288,857 (July 7, 1942).29. J. Reisberg and T. M. Dosher:"Interfacial Phenomena in Crude Oil/Water Systems", Prod. Monthly (Nov., 1956) 43-50.30. H. Y. Jennings, Jr., C. E. Johnson, Jr., and C. D. McAuliffe: "A Caustic Waterflooding Process for HeavyOils", Journal of Petroleum Technology (Dec., 1974), 1344-1352. '31. H. Soo.: "Dilute, Stable Emulsion Flow in PorousMedia", PhD. Thesis, U. of California (1983).32. 0. K. Kimbler: "Physical Characteristics of NaturalFilms Formed at Crude Oi1-Water Interfaces", PhD. Dissertation, University of Texas, Austin (Jan., 1970).33. H. N. Dunning, and N. A. Rabon: "Porphyrin-Metal Complexes in Petroleum Stacks", Ind. Eng. Chem. (1956) 48, 951.34. A. T. Bourgoyne: "The Effect of Interfacial Films onthe Displacement of Oil by Water in Porous Media", PhD. Dissertation, University of Texas, Austin (Aug., 1964).35. N. Mungan: "Enhanced Oil Recovery Using Water as aDriving Fluid", World Oil (Feb.-Oct., 1981).
Reproduced with permission of the copyright owner. Further reproduction prohibited without permission.
186
36. G. G. Bernard: "Has Caustic Consumption BeenUnderestimated in Field Caustic Floods?11, SPE paper No. 8789, (April, 1980).37. T. C. Campbell: “Chemical Flooding: A ComparisonBetween Alkaline and Soft Preflush Systems", paper No. 7873, SPE International Symposium on Oilfield and Geothermal Chemistry, Houston, Texas, (Jan. 22-24, 1979).38. Z. Novosad, and J. Novosad: "The Effect of Hydrogen Ion Exchange on Alkalinity Loss in Alkaline Flooding", SPE paper No. 10605, presented at the SPE Sixth International Symposium on Oilfield and Geothermal Chemistry, Dallas, TX, (Jan. 25-27, 1982).39. A. C. Bunge and C. J. Radke: "Migration of AlkalinePulses in Reservoir Sands", SPE paper No. 10288, presented at the 56th Annual Fall Technical Conference and Exhibition of the Society of Petroleum Engineers of AIME, San-antonio, TX, (Oct. 5-7, 1981).40. R. B. Sydansk: "Elevated Temperature Caustic-SandstoneInteraction— Implications for Improving Oil Recovery", SPE/DOE paper No. 9810, presented at the 1981 SPE/DOE Second Joint Symposium on Enhanced Oil Recovery of the Society of Petroleum Engineers, Tulsa, OK, (April 5-8, 1981).41. W. H. Somerton and C. H. Radke: "Role of Clay in theEnhanced Recovery of Petroleum from some California Sands",Journal of Petroleum Technology (March, 1983).42. E. H. Mayer, R. L. Berg, J. D. Carmichael, and R. M. Weinbrandt: "Alkaline Injection for Oil recovery-A Status Report", Journal of Petroleum Technology (Jan., 1983).43. P. H. Krumrine: "Alkaline Flooding Under Adverse Conditions with Higher Ratio Sodium Silicates", presented at the New-Orleans Oil Show and Conference, New-Orleans, LA, (March 29-31, 1983).44. J. G. Southwick: "Solubility of Silica in Alkaline Solutions, Implications for Alkaline Flooding", SPE paper No. 12771, presented at the California Regional Meeting, Long Beach, Ca, (April 11-13, 1984).45. E. H. Mayer, et al.: "Alkaline Flooding—Its Theory, Application and Status", Trans. Second European Symposium On Enhanced Oil Recovery, Paris, (Nov. 8-10, .1982) 191-201.
Reproduced with permission of the copyright owner. Further reproduction prohibited without permission.
187
46. J. H. Burk: "Comparison of Sodium Carbonate, Sodium Hydroxide and Sodium Crthosilicate -for EOR", SPE paper No. 12039, presented at the 58th Annual Technical Conference and Exhibition, San-Francisco, CA, (Oct. 5-8, 1983).47. M. M. Chang and D. T. Wasan: "Emulsion Characteristics Associated with an Alkaline Waterflooding Process ", SPE paper No. 9001, presented at the SPE Fifth International Symposium on Oilfield and Geothermal Chemistry, Stanford,CA, <May 28-30, 1980).48. T. C. Campbell: "The Role of Alkaline Chemicals in theRecovery of Low-Gravity Crude Oils", Journal of PetroleumTechnology (Nov., 1982).49. P. H. Krumrine, T. C. Campbell, and J. S. Falcone Jr. : "Surfactant Flooding I: The Effect of Alkaline Additives onIFT, Surfactant Adsorption, and Recovery Efficiency", SPE paper No. 8998, presented at the SPE Fifth International Symposium on Oilfield and Geothermal Chemistry, Stanford,CA, (may 28-30, 1980).50. E. M. Trujillo: "The Static and Dynamic InterfacialTensions Between Crude Oils and Caustic Solutions", Society of Petroleum Engineers Journal (Aug., 1983).51. H. Y. Jennings Jr.: "A Study of Caustic Solution-CrudeOil Interfacial Tensions", Society of Petroleum EngineersJournal (June, 1975) Trans. AIME (1975), P. 259.52. J. T. Ball, and D. P. Stewart: "Polymers in AlkalineFlooding", Polymer Preprints, 22, 92 (1981).53. R. C. Nelson, J. B. Lawson, D. R. Thigpen, and G. L.Stegemeier: "Cosurfactant Enhanced Alkaline Flooding", SPEpaper No. 12672, presented at the 4th SPE/DOE Symposium, Tulsa, OK, (April 15-18, 1984).54. T. F. Yen, M. Chan, and L. K. Jang: “Some Useful Concepts Derived from Petroleum Component Properties for Improved Waterflooding Studies", DOE contract No. DE-AS19- 78ET12382, U. of Southern California, Chemical Engineering Department, Los angeles, CA, (1980).55. W. K. Seifert: "Carboxylic Acids in Petroleum andSediments", Fortshritte. D. Chem. Org. Naturst., 32, 1(1975).56. W. K. Seifert: "Effect of Phenols on the InterfacialActivity of California Crude Oil. Carboxylic Acids and theIdentification of Carbazoles and Indoles", Anal. Chem., Vol. 41, No. 4, (April, 1969).
Reproduced with permission of the copyright owner. Further reproduction prohibited without permission.
188
57. V. K. Bansal, K. S. ChanT R. McCallough and D. 0. Shahi "The Effect of Caustic Concentration on Interfacial Charge, Interfacial Tension and Droplet Size: A Simple Test for Optimum Caustic Concentration for Crude Oils", Journal of Canadian Petroleum Technology (Jan-March, 1978) 69-72.58. C. J. Radke and W. H. Somerton: "Enhanced Recovery with Mobility and Reactive Tension Agents", U.S. DOE Quaterly Progress Report, DOE BETC Eng. 48-1, (Jan. 1, 1979).59. C. H. Pasquarelli and D. T. Wasan: "The Effect of Film Forming Materials on the Dynamic Interfacial Properties in Crude Oil-Aqueous Systems", presented at the Third International Conference on Surface and Colloid Science. Surface Phenomena in Enhanced Oil Recovery Section, Stockholm, (Aug. 20-25, 1979).60. D. T. Wasan, S. M. Shah, M. Chan, K. Sampath, And R. Shah: “Spontaneous Emulsification and the Effect of Interfacial Fluid Properties on Coalescence and Emulsion Stability in Caustic Flooding", The Chemistry of Oil Recovery, ACS Symposium Series No. 91 (1979).61. J. C. Slattery: "Interfacial Effects in the Recovery ofResidual Oil by Displacement", DOE contract No. DE-AC19- 80BC10068, Northwestern University, Evanston, 111., (April 1-June 30, 1981).62. D. England, J. C. Berg: "Transfer of Surface Active Agents across a Liquid-Liquid Interface ", AlChe Journal. Vol. 17, (March, 1971), 313-322.63. E. Rubin, C. J. Radke: "Dynamic Interfacial Tension Minima in Finite Systems", Chem. Eng. Science Vol. 35. 1129- 113B (1981).64. J. T. Davies and E. K. Rideal: "Interfacial Phenomena". 2nd Edition , Academic press, New York, (1963).65. M. M. Sharma, L. K. Jang and T. F. Yen: "TransientInterfacial Tension Behavior of Crude Oil/Caustic Inter—faces", SPE/DOE Fourth Symposium on Enhanced Oil Recovery, Vol. 1, (April, 1984).66. I. Langmuir, J. Am. Chem. Soc.. 40. 1361 (1918).67. V. J. Cambridge: "Interfacial Effects in Caustic-CrudeOil Systems", M. S. Thesis, Louisiana State University,(Dec., 1984).
Reproduced with permission of the copyright owner. Further reproduction prohibited without permission.

189
68. E. F. Dezabala, C. J. Radke: "The Role of Interfacial Resistances in Alkaline Waterflooding of Acidic Oils", SPE Paper No. 11213 (1982).69. 0. T. Wasan: "The Mechanism of Oil Bank Formation and Coalescence in Porous Media"t Summary of DOE Project, Reporting Period : (Oct. 1-Dec. 31, 1978).70. D. T. Wasan: "The Mechanism of Oil Bank Formation, Coalescence in Porous Media and Emulsion Stability-II", DOE/BETC/IC-BO/3, Vol.2, Annual Report to DOE, 1980.71. D. T. Wasan, K. Sampath, J. J. McNamara: "The Mechanism of Oil Bank Formation, Coalescence in Porous Media and Emulsion Stability", Proceedings of the Fourth DOE Symposium on Enhanced Oil and Gas Recovery and Improved Drilling Methods, Tulsa, OK, (Aug. 29-31, 1978).72. 0. K. Kimbler and B. H. Caudle:"New Technique for Study of Fluid Flow and Phase Distribution in Porous Media", Oi1 and Gas Journal (Dec. 16, 1957) 55, 85.73. R. L. Sykes:"A Visual Observation of the Effect of Injection Water Rate and Viscosity on Residual oil Saturation", M. S. Thesis, University of Texas, Austin (June, 1967).74. I. Chatzis, N. R. Morrow and H. T. Lim:"Magnitude and Detailed Structure of Residual Oil Saturation", Society of Petroleum Engineers Journal (April, 1983), 311-26.75. D. T. Wasan, F. S. Milos and P. E. Di nardo:"0il Banking Phenomena in Surfactant/Polymer and Caustic Flooding: Droplet Coalescence and Entrapment Processes", AIChE Symposium Series No. 212, Vol. 78, 105-112, (1982).76. J. L. Salager, J. C. Morgan, R. S. Schechter, and W. H. Wade:"Optimum Formulation of Surfactant—Water— Oil Systems for Minimum Interfacial Tension or Phase Behavior", SPEPaper No. 7054, presented at the Fifth Symposium on Improved Methods for Oil Recovery of the SPE of AIME, Tulsa, OK,(April 16-19, 1978).77. S. C. Jones and K. D. Dreher:"Cosurfactants in Micellar Systems Used for Tertiary Oil Recovery", Society ofPetroleum Engineers Journal (June, 1976).78. W. B. Gogarty and W. C. Tosh:"Miscible-typeWaterflooding: Oil Recovery With Micellar Solutions",Journal of Petroleum Technology (Dec., 1968).
Reproduced with permission of the copyright owner. Further reproduction prohibited without permission.

190
79. S. J. Salter:"The Influence of Type and Amount of Alcohol on Surfactant-Oil-Brine Phase Behavior and Properties", SPE Preprint 6B43, presented at Annual Fall Meeting, Denver, (1977).80. C. A. Miller and P. Neoqi:"Interfacial Phenomena, Equilibrium and Dynamic Effects", Surfactant Science Series Voi. 17, edited by Marcel Dekker, Inc., New York and Basel, (1985).81. M. Baviere, W. H. Wade and R. S. Schechter:"The Effectof Salt, Alcohol, and Surfactant on Optimum Middle Phase Composition", in Surface Phenomena in Enhanced Oil Recovery. D. 0. Shah (ed), Plenum, New york,p. 117, (19B1).82. M. Y. Chiang and D. 0. Shah:"The Effect of Alcohol onSurfactant Mass Transfer across the Oil/Brine Interface and Related Phenomena", SPE Paper No.8988, presented at the SPE Fifth Internatinal Symposium on Oilfield and Geothermal Chemistry, Stanford, CA, (May 28-30, 1980).83. M. K. Dabbous and P. F. Fulton: "Low TemperatureOxidation Reaction Kinetics and Effects on the In-situCombustion Process", paper No. 4143, SPE 47th AnnualMeeting, San Antonio, TX, (Oct. 8-11, 1972).84. D. Sihi: "Sulfonation and Oxidation of Crude Oil asPossible Enhanced Recovery Techniques", M. S. Thesis,Louisiana State University, Baton-Rouge, (Aug., 1980).85. M. A. Dahmani: "Low Temperature Oxidation of Oil inPorous Media", M. S. Thesis, Louisiana State University, Baton Rouge, (Aug., 1983).86. E. C. Donaldson, G. V. Chilingarian, and T. F. Yen:" Enhanced Oi1 Recovery I, Fundamentals and Analyses", Elsevier Science Publishers B.V., (1985).87. J. L. Cayias, R. S. Schechter, and W. H. Wade: "TheMeasurement of Low Interfacial Tension via the Spinning Drop Technique", Adsorption at Interfaces, American Chemical Society Symposium Series No. 8, (1975).88. C. D. Manning, C. V. Pesheck, J. E. Puig, Y. Seeto,H. T. Davies, L. El Scrivens " Measurement of Interfacial tensions", DOE Report No. 10116-12, (Nov., 1983).89. G. L. Mathews: "A Microscopic Investigation of the Use of Preferentially Oil-Soluble Surface Active Agents to Enhance Oil Recovery", M. S. Thesis, Louisiana State University, Baton-Rouge, (May, 1977).
Reproduced with permission of the copyright owner. Further reproduction prohibited without permission.
191
90. B. C. Craft and M. F. Hawkins: "Applied PetroleumReservoir Engineering", Prentice-Hal1 Chemical Engineering Series, Prentice-Hall, Inc., Englewood Cliffs, N.J., (1959).91. T. E. Doll: “An Update of the Polymer— Augmented Alkaline Flood at the Isenhour Unit, Sublette County, Wyoming", SPE/DOE paper No. 14954, presented at the SPE/DOE Fifth Symposium on Enhanced Oil Recovery, Tulsa, OK, (April 20-23, 1906).92. V. A. Kuuskraa: "The Status and Potential of Enhanced Oil Recovery", SPE/DOE paper No. 14951, presented at the SPE/DOE Fifth Symposium on Enhanced Oil Recovery of the SPE and The DOE, Tulsa, OK, (April 20-23, 1986).93. A. S. Michaels, and R. S. Timmins: "Chromatographic Transport of Reverse-Wetting Agents and its Effects on Oil Displacement in Porous Media", Trans. AIME, (1960).94. Z. Novosad, and F. 6. McCaffery: "Laboratory Evaluation of Sodium Hydroxide and Sodium Orthosilicate for Tertiary Oil Recovery in an Alberta Reservoir", SPE paper No. 10734, presented at the 1982 California Regional Meeting of the Society of Petroleum Engineers, San Francisco, CA, (March 24-26, 1982).95. R. D. Sydansk: "Stabilizing Clays with PotassiumHydroxide", SPE paper No. 11721, presented at the California Regional Meeting, Ventura, CA, (March 23-25), 1983.96. J. M. Wolcott and W. D. Constant: " The Isolation and Identification of Acidic Crude Oil Components", in preparation.97. V. J. Cambridge, D. W. Constant, and J. M. Wolcott: " transient Interfacial Rheological Properties of Crude Oil/Caustic Interfaces", in preparation.98. Y. H. Kim, and K. Y. Li: "Prediction of theInterfacial Stability in Liquid-liquid Systems", Presented at the AIChE National Meeting, Houston, (1985).99. V. J. Cambridge, W. D. Constant, M. A. Dahmani, C. A. Whitehurst, and J. M. Wolcott: "In-situ Oxidation of Crude Oils for Enhanced Recovery by Alkaline Flooding", FUEL, Volume 65, (Sept. 1986).
Reproduced with permission of the copyright owner. Further reproduction prohibited without permission.
192
100. E. C. Donaldson: “Enhanced Oi1 Recovery I,Fundamentals and Analyses”. Edited by Elsevier Science Publishers B. V., Amsterdam, The Netherlands, (1985).
Reproduced with permission of the copyright owner. Further reproduction prohibited without permission.

APPENDICES
193
Reproduced with permission of the copyright owner. Further reproduction prohibited without permission.
APPENDIX A Crude Oil/Water Inter-facial
Tension Data
194
Reproduced with permission of the copyright owner. Further reproduction prohibited without permission.
Interfacial Tension Data
The data shown in the following tables was obtained for the interfacial tension measurements of crude oil/alkaline water and crude oil/alcohol-augmented alkaline water systems.
195
Reproduced with permission of the copyright owner. Further reproduction prohibited without permission.
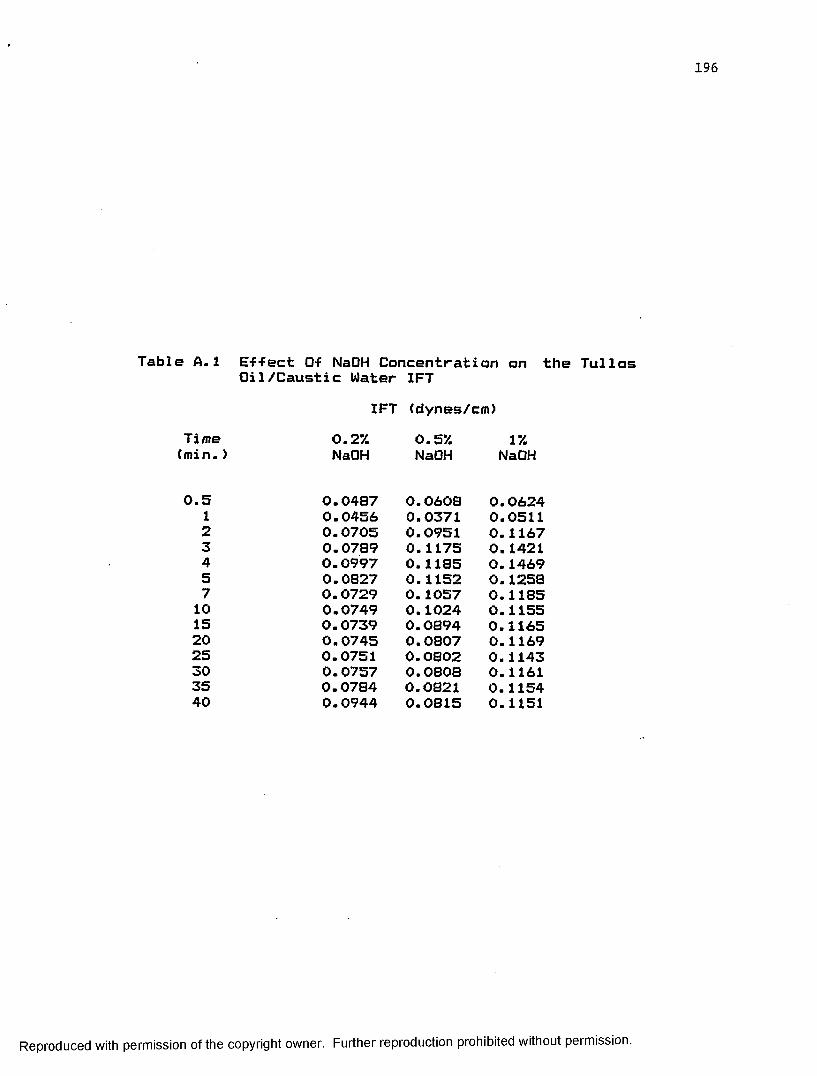
Table A. 1 Ef-fect 0-f NaOH Concentration on the TullosOil/Caustic Water IFT
IFT (dynes/cm)Time 0.27. 0.57. 17(min.) NaOH NaOH NaOH
0.5 0.0487 0.0608 0.06241 0.0456 0.0371 0.05112 0.0705 0.0951 0.11673 0.0789 0.1175 0.14214 0.0997 0.1185 0.14695 0.0827 0.1152 0.12587 0.0729 0.1057 0.118510 0.0749 0.1024 0.115515 0.0739 0.0894 0.116520 0.0745 0.0807 0.116925 0.0751 0.0802 0.114330 0.0757 0.0808 0.116135 0.0784 0.0821 0.115440 0.0944 0.0815 0.1151
Reproduced with permission of the copyright owner. Further reproduction prohibited without permission.

Table A.2 Effect of NaOH Concentration on the MG3Oil/Caustic Water IFT
IFT <dynes/cm)Time 0.2'/. 0.57. 17.(min.) NaOH NaOH NaOH
0.5 0.0566 0.0584 0.08431 0.0S19 0.1254 0.26312 0.1271 0.2281 0.33513 0.1287 0.2041 0.38354 0.1145 0.1972 0.36315 0.1095 0.2023 0.36027 0.1095 0.2281 0.343210 0.1142 0.2318 0.328815 0.1157 0.2355 0.344420 0.1151 0.2321 0.340825 0.1162 0.2335 0.3358
30 0.1191 0.2325 0.338133 0.2151 0.2342 0.340145 0.4981 0.2363 0.3391
Reproduced with permission of the copyright owner. Further reproduction prohibited without permission.

Table A. 3 Effect of NaCl Concentration on IFTfor MS3 Oil
IFT (dynes/cm)Time 17. 5 V.(min.) NaCl NaCl
0.5 0.0599 0.12521 0.0671 0.17462 0.0972 0.17313 0.1185 0.15384 0.1127 0.15015 0.1028 0.15117 0.1002 0.148810 0.1085 0.149615 0.1044 0.152120 0.1089 0.167125 0.1098 0.177730 0.1134 0.183335 0.2142 0.218945 0.4862 0.2262
Reproduced with permission of the copyright owner. Further reproduction prohibited without permission.

Table A.4 Effect of NaCl Concentration on IFTfor Tullos Oil
IFT (Dynes/cm>time 17. 5 7.(min.) NaCl NaCl
0.5 0.0534 0.09711 0.0379 0.15252 0.0527 0.15683 0.0563 0.15544 0.0534 0.15425 0.0545 0.15357 0.0537 0.151110 0.0521 0.149815 0.0555 0.149420 0.0513 0.150825 0.0516 0.151130 0.0548 0.152135 0.0604 0.151840 0.1035 0.1514
Reproduced with permission of the copyright owner. Further reproduction prohibited without permission.
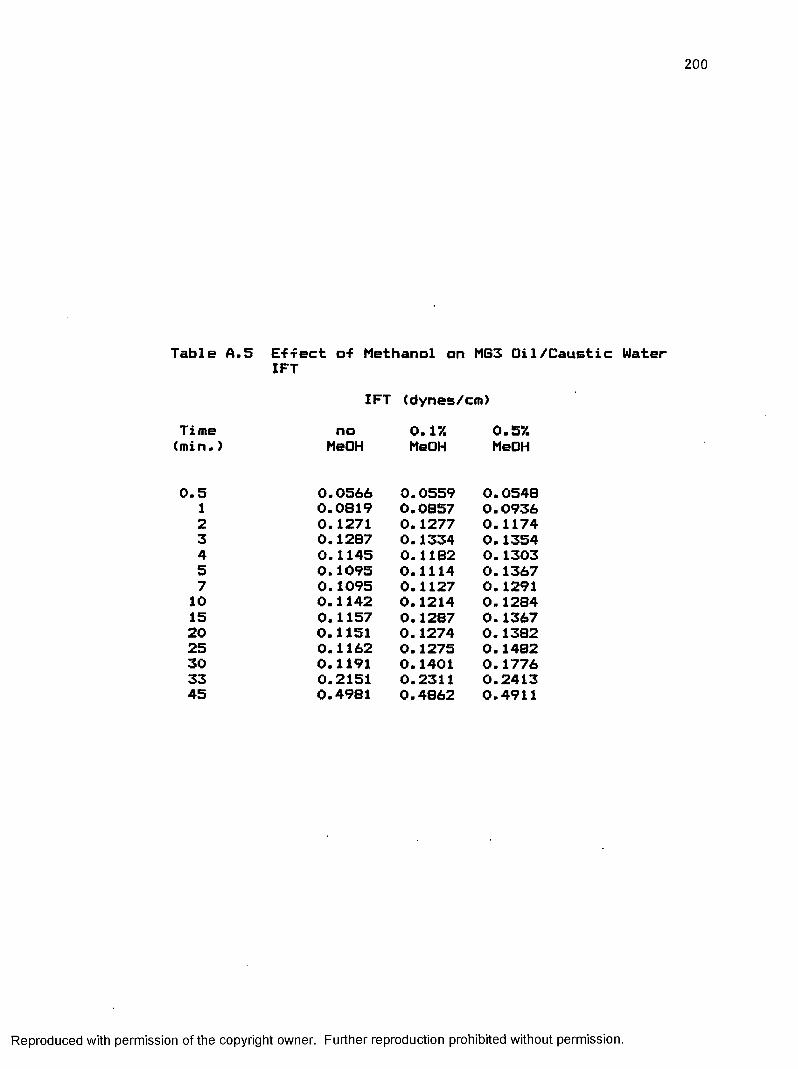
200
Table A. 5 E-f-fect o-f Methanol on MG3 Oil /Caustic Water IFT
IFT (dynes/cm)Time no 0.17. 0.57.(min.) MeOH MeOH MeOH
0.5 0.0566 0.0559 0.05481 0.0819 0.0857 0.09362 0.1271 0.1277 0.11743 0.1287 0.1334 0.13544 0.1145 0.1182 0.13035 0.1095 0.1114 0.13677 0.1095 0.1127 0.129110 0.1142 0.1214 0.128415 0.1157 0.1287 0.136720 0.1151 0.1274 0.138225 0.1162 0.1275 0.148230 0.1191 0.1401 0.177633 0.2151 0.2311 0.241345 0.4981 0.4862 0.4911
Reproduced with permission of the copyright owner. Further reproduction prohibited without permission.
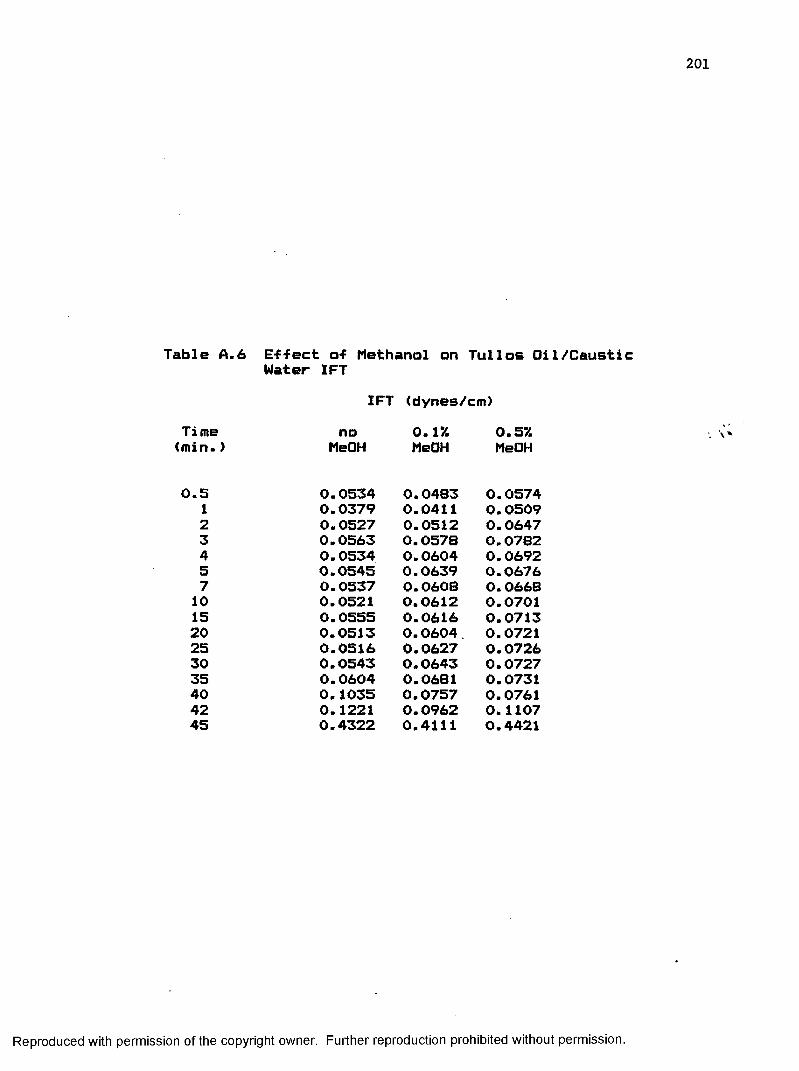
Table A.6 Effect of Methanol on Tullos Oil/CausticWater IFT
IFT (dynes/cm)Time no 0.17. 0.5%(min.) MeOH MeOH MeOH
0.5 0.0534 0.04B3 0.05741 0.0379 0.0411 0.05092 0.0527 0.0512 0.06473 0.0563 0.0578 0.07824 0.0534 0.0604 0.06925 0.0545 0.0639 0.06767 0.0537 0.0608 0.066810 0.0521 0.0612 0.070115 0.0555 0.0616 0.071320 0.0513 0.0604. 0.072125 0.0516 0.0627 0.072630 0.0543 0.0643 0.072735 0.0604 0.0681 0.073140 0.1035 0.0757 0.076142 0.1221 0.0962 0.110745 0.4322 0.4111 0.4421
Reproduced with permission of the copyright owner. Further reproduction prohibited without permission.

Table A.7 E-f-fect o-f Ethanol on MG3 Oil/Caustic WaterIFT
IFT <dynes/cm>Time no 0.1% 0.3% 0.5%(min.> EtOH EtOH EtOH EtOH
0.5 0.0566 0.0496 0.0588 0.05231 0.0819 0.0805 0.0809 0.10752 0.1271 0.10B7 0.0994 0.11383 0.1287 0.1203 0.1093 0.11914 0.1145 0.1162 0.1132 0.11975 0.1095 0.1121 0.1092 0.11867 0.1095 0.1132 0.1135 0.119110 0.1142 0.1142 0.1127 0.116215 0.1157 0.1125 0.1153 0.112120 0.1151 0.1133 0.1127 0.108125 0.1162 0.1167 0.1201 0.111530 0.1191 0.1211 0.1265 0.120333 0.2151 0.3101 0.3321 0.248545 0.4981 0.4865 0.4906 0.4716
Reproduced with permission of the copyright owner. Further reproduction prohibited without permission.
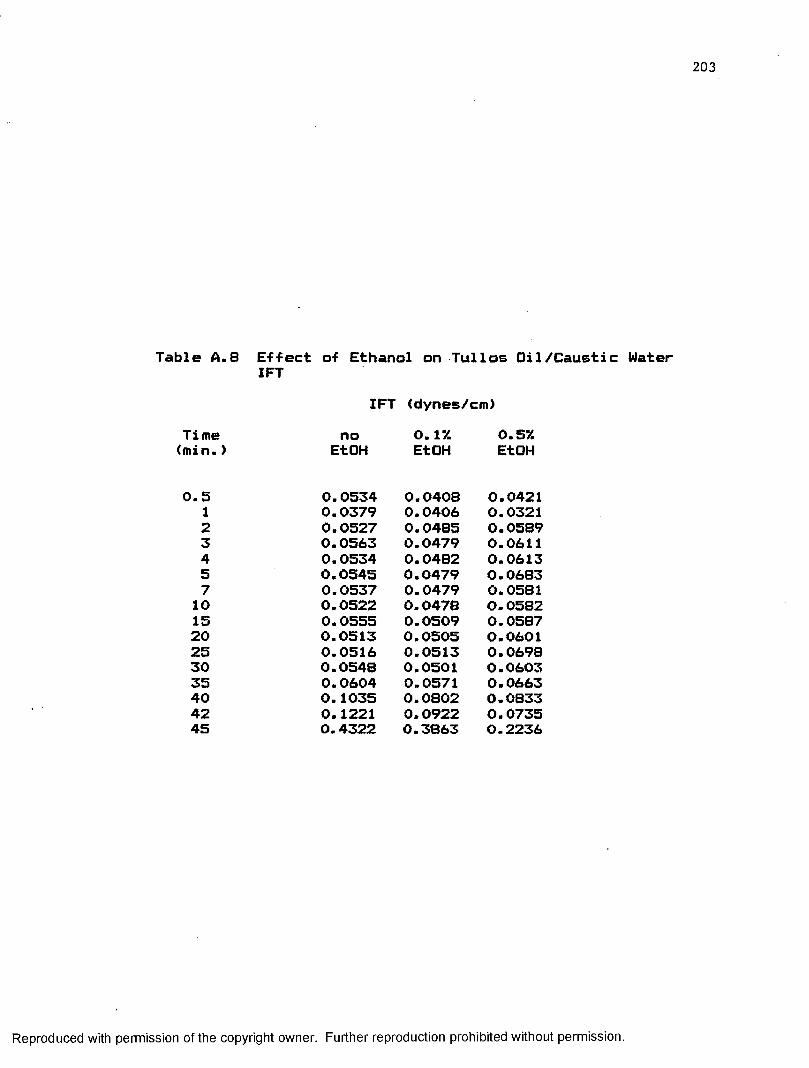
203
Table A.8 Effect of Ethanol on Tullos Oil/Caustic Water IFT
IFT (dynes/cm)Time no 0.17. 0.5%(min.) EtOH EtOH EtOH
0.5 0.0534 0.0408 0.04211 0.0379 0.0406 0.03212 0.0527 0.0485 0.05893 0.0563 0.0479 0.06114 0.0534 0.0482 0.06135 0.0545 0.0479 0.06837 0.0537 0.0479 0.058110 0.0522 0.0478 O.058215 0.0555 0.0509 0.058720 0.0513 0.0505 0.060125 0.0516 0.0513 0.069830 0.0548 0.0501 0.060335 0.0604 0.0571 0.066340 0.1035 0.0802 0.083342 0.1221 0.0922 0.073545 0.4322 0.3863 0.2236
Reproduced with permission of the copyright owner. Further reproduction prohibited without permission.
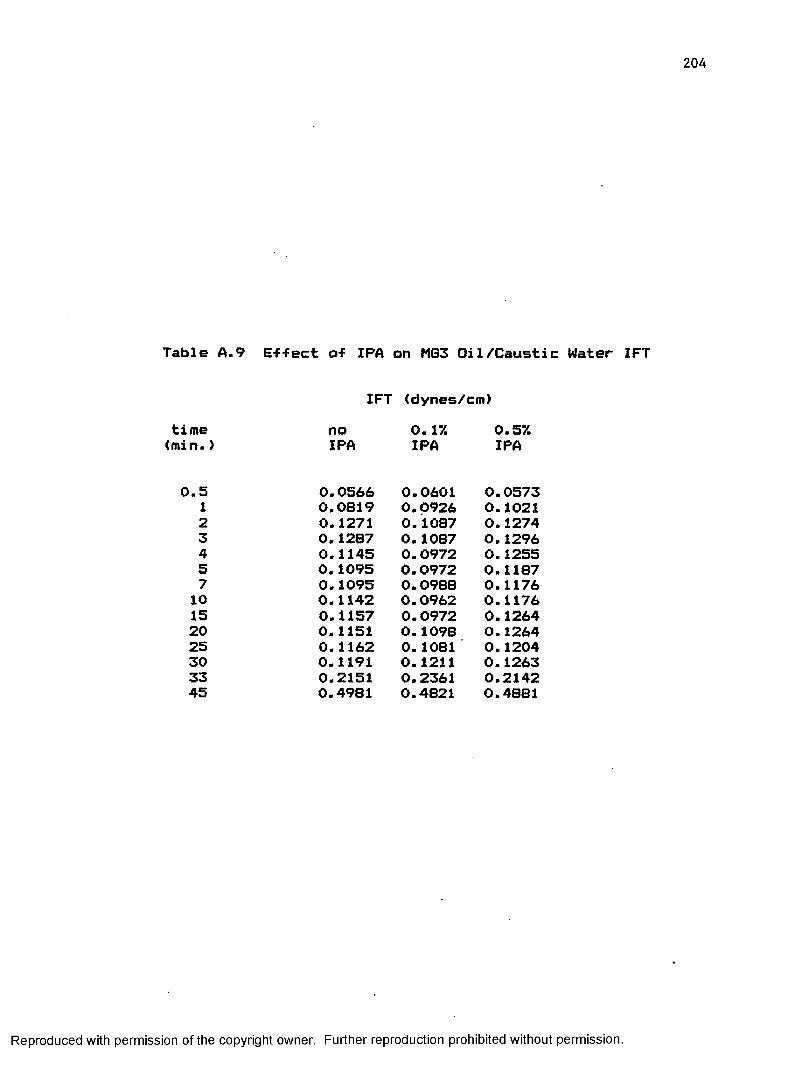
Table A.9 Effect of IPA on MG3 Oil/Caustic Water IFT
IFT (dynes/cm)time no 0.1% 0.5%(min.) IPA IPA IPA
0.5 0.0566 0.0601 0.05731 0.0819 0.0926 0.10212 0.1271 0.1087 0.12743 0.1287 0.1087 0.12964 0.1145 0.0972 0.12555 0.1095 0.0972 0.11877 0.1095 0.0988 0.117610 0.1142 0.0962 0.117615 0.1157 0.0972 0.126420 0.1151 0.1098 0.126425 0.1162 0.1081 0.120430 0.1191 0.1211 0.126333 0.2151 0.2361 0.214245 0.4981 0.4821 0.4881
Reproduced with permission of the copyright owner. Further reproduction prohibited without permission.
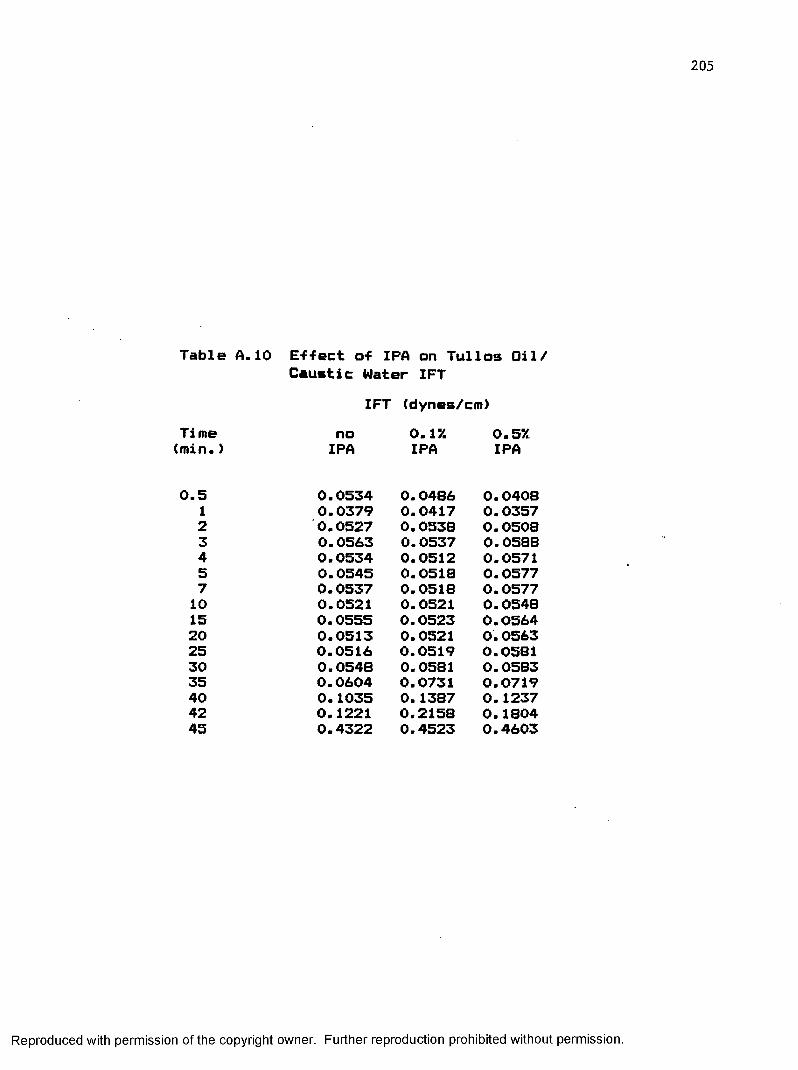
Table A.10 Effect of IPA on Tullos Oil/Caustic Water IFT
IFT (dynes/cm)Time no 0.1% 0.5%(min.) IPA IPA IPA
0.5 0.0534 0.0486 0.04081 0.0379 0.0417 0.03572 0.0527 0.0538 0.05083 0.0563 0.0537 0.058B4 0.0534 0.0512 0.05715 0.0545 0.0518 0.05777 0.0537 0.0518 0.057710 0.0521 0.0521 0.054B15 0.0555 0.0523 0.056420 0.0513 0.0521 0.056325 0.0516 0.0519 0.058130 0.0548 0.0581 0.058335 0.0604 0.0731 0.071940 0.1035 0.1387 0.123742 0.1221 0.2158 0.180445 0.4322 0.4523 0.4603
Reproduced with permission of the copyright owner. Further reproduction prohibited without permission.

Table A.11 Effect Of 1-Propanol on MG3 Oil/CaustiWater IFT
IFT (dynes/cm)Time no 0.17. 0.57.(min.> 1-propa. 1-propa. 1-propa
0.5 0.0566 0.0562 0.04661 0.0819 0.0931 0.05592 0.1271 0.1031 0.10373 0.1287 0.1104 0.10854 0.1145 0.1144 0.11685 0.1095 0.1228 0.11867 0.1095 0.1211 0.119110 0.1142 0.1181 0.124115 0.1157 0.1181 0.126120 0.1151 0.1227 0.125325 0.1162 0.1215 0.123330 0.1191 0.1461 0.134833 0.2151 0.1771 0.167145 0.4981 0.4662 0.4739
Reproduced with permission of the copyright owner. Further reproduction prohibited without permission.
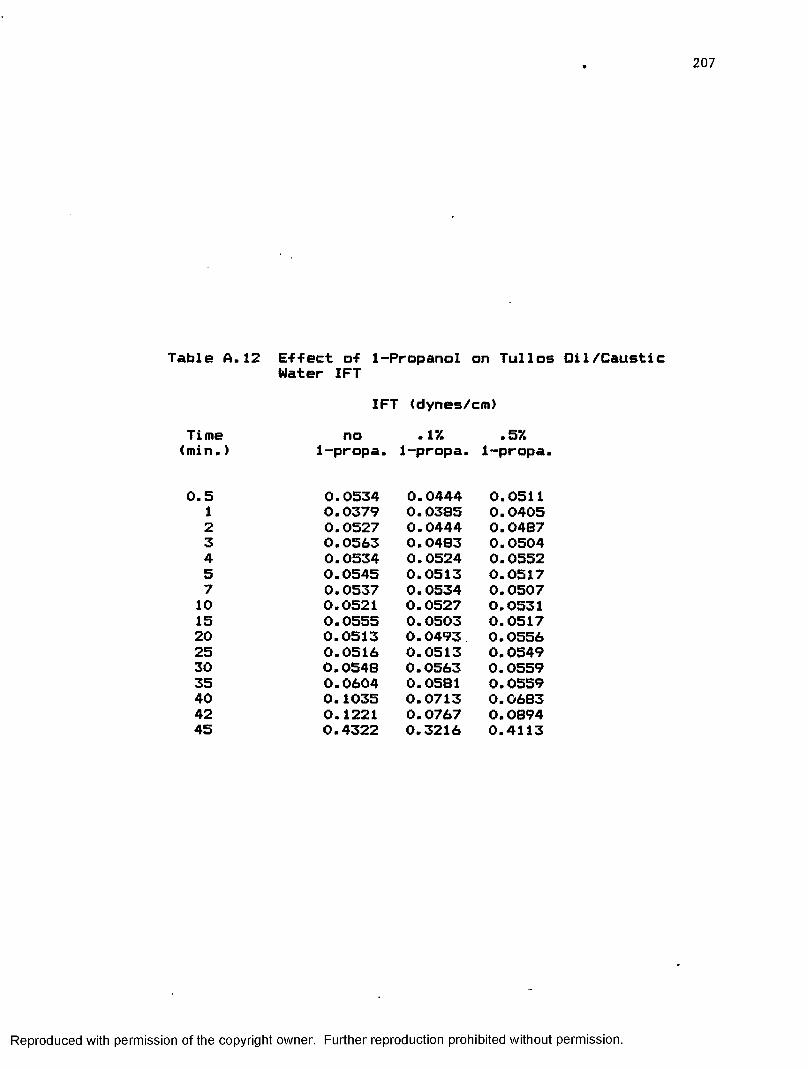
Table A. 12 Effect of 1-Propanol on Tull os Oil /CausticWater IFT
IFT (dynes/cm)Time no .17. .5%<min.) 1-propa. 1-propa. 1-propa.
0.5 0.0534 0.0444 0.05111 0.0379 0.0385 0.04052 0.0527 0.0444 0.04873 0.0563 0.0483 0.05044 0.0534 0.0524 0.05525 0.0545 0.0513 0.05177 0.0537 0.0534 0.050710 0.0521 0.0527 0.053115 0.0555 0.0503 0.051720 0.0513 0.0493 0.055625 0.0516 0.0513 0.054930 0.0548 0.0563 0.055935 0.0604 0.0581 0.055940 0.1035 0.0713 0.068342 0.1221 0.0767 0.089445 0.4322 0.3216 0.4113
Reproduced with permission of the copyright owner. Further reproduction prohibited without permission.

Table A. 13 E-f-fect of t-Butanol on MG3 Oil/CaustiWater IFT
IFT <dynes/cm)Time no 0.17. 0.5%<min.) t-buta. t-buta. t-buta
0.5 0.0566 0.0751 0.09161 0.0819 0.0886 0.11332 0.1271 0.1265 0.14123 0.1287 0.1284 0.14414 0.1145 0.1328 0.13615 0.1095 0.1292 0.13747 0.1095 0.1309 0.135210 0.1142 0.1328 0.135215 0.1157 0.1312 0.138320 0.1151 0.1313 O'. 139225 0.1162 0.1328 0.142830 0.1191 0.1313 0.146833 0.2151 0.2345 0.310245 0.4981 0.4863 0.4962
Reproduced with permission of the copyright owner. Further reproduction prohibited without permission.
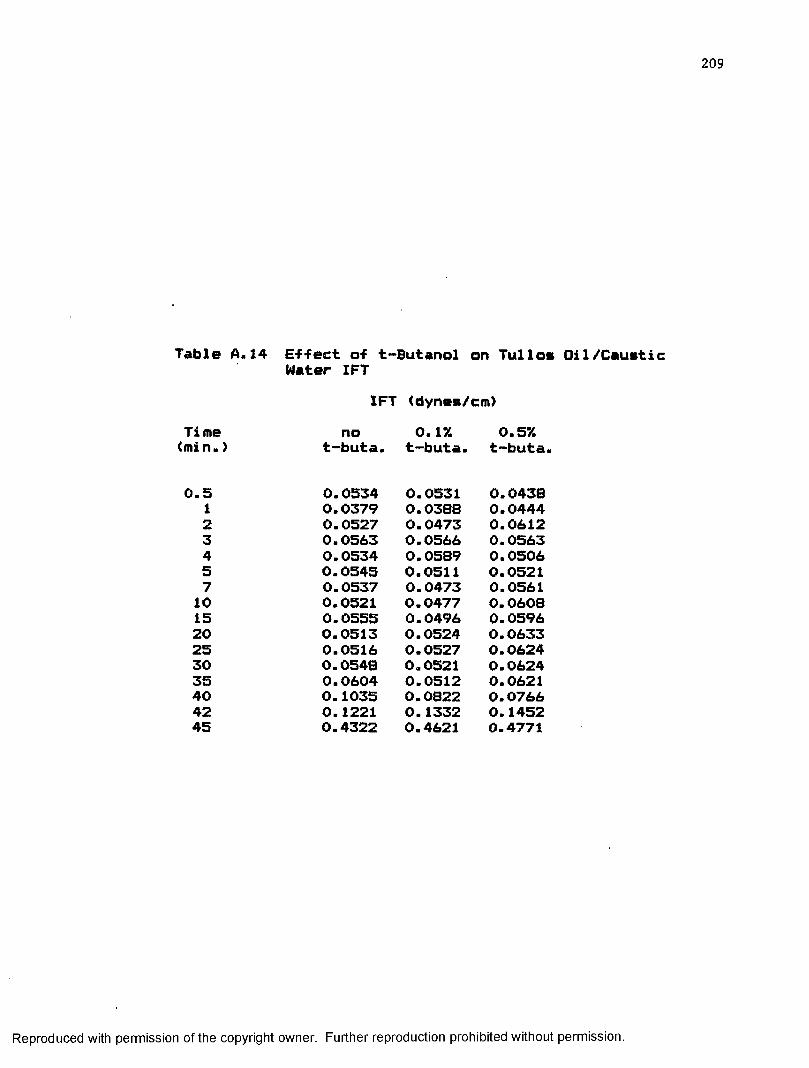
Table A.14 Effect of t-Butanol on Tulloa Oil/CauatiWater IFT
IFT <dynea/cm)Time no 0.1% 0.5%<min.) t-buta. t-buta. t-buta.
0.5 0.0534 0.0531 0.04381 0.0379 0.0388 0.04442 0.0527 0.0473 0.06123 0.0563 0.0566 0.05634 0.0534 0.0589 0.05065 0.0545 0.0511 0.05217 0.0537 0.0473 0.056110 0.0521 0.0477 0.060815 0.0555 0.0496 0.059620 0.0513 0.0524 0.063325 0.0516 0.0527 0.062430 0.0548 0.0521 0.062435 0.0604 0.0512 0.062140 0.1035 0.0822 0.076642 0.1221 0.1332 0.145245 0.4322 0.4621 0.4771
Reproduced with permission of the copyright owner. Further reproduction prohibited without permission.
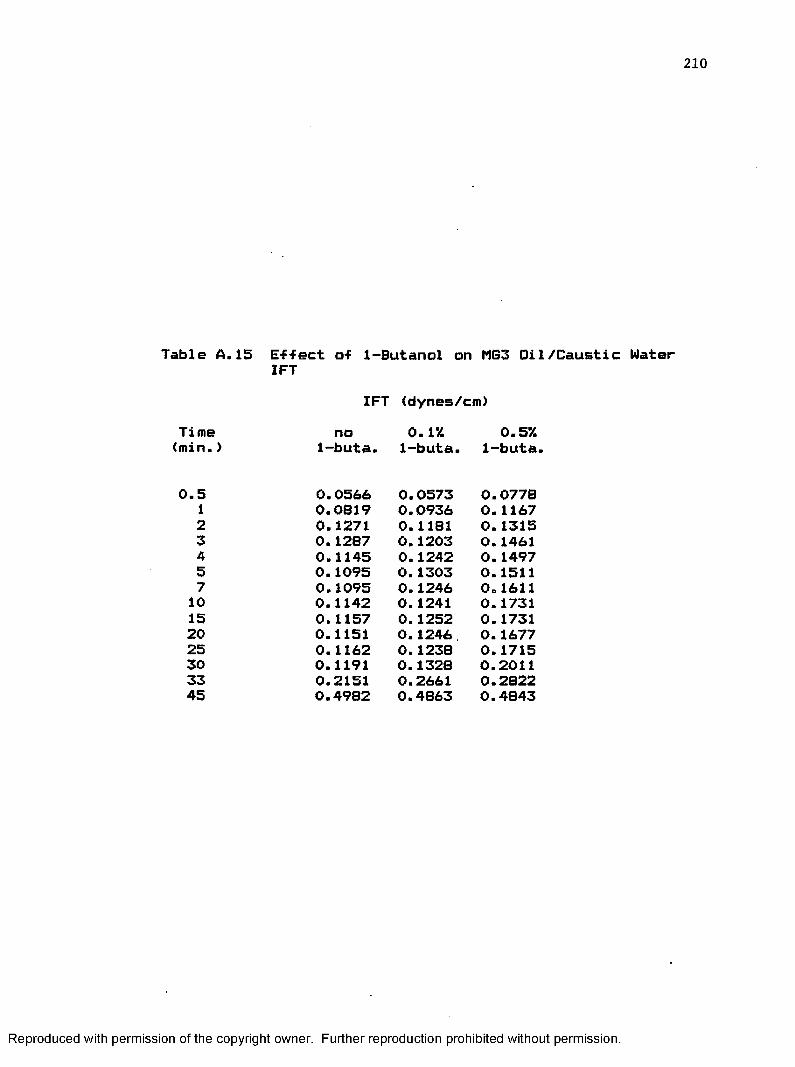
210
Table A.15 E-f-Fect o-F 1-Butanol on MG3 Oil /Caustic Water IFT
IFT <dynes/cm)Time no 0.1% 0.5%(min.> 1-buta. 1-buta. 1-buta
0.5 0.0566 0.0573 0.077B1 0.0819 0.0936 0.11672 0.1271 0.1181 0.13153 0.1287 0.1203 0.14614 0.1145 0.1242 0.14975 0.1095 0.1303 0.15117 0.1095 0.1246 0.161110 0.1142 0.1241 0.173115 0.1157 0.1252 0.173120 0.1151 0.1246 0.167725 0.1162 0.1238 0.171530 0.1191 0.1328 0.201133 0.2151 0.2661 0.282245 0.4982 0.4863 0.4843
Reproduced with permission of the copyright owner. Further reproduction prohibited without permission.
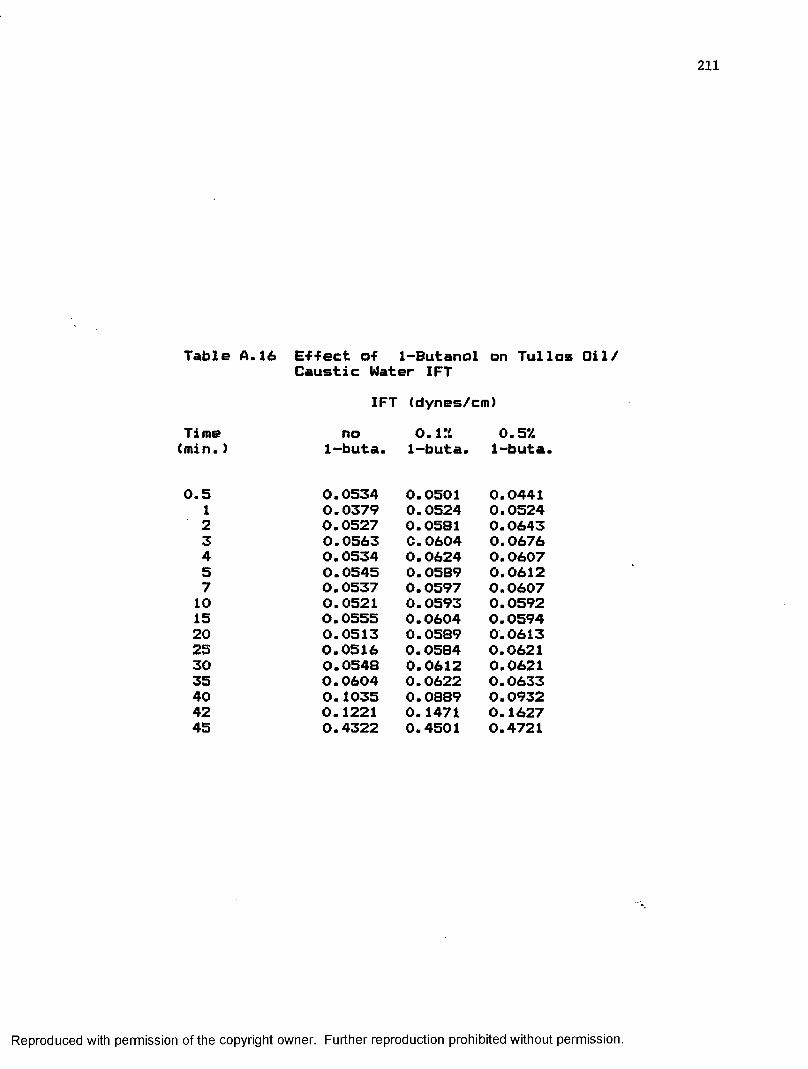
Table A.16 Effect of 1-Butanol on Tullos Oil/Caustic Water IFT
IFT <dynes/cm)Time no 0. IV. 0.57.(min.) 1-buta. 1-buta. 1-buta
0.5 0.0534 0.0501 0.04411 0.0379 0.0524 0.0524
' 2 0.0527 0.0581 0.06433 0.0563 C.0604 0.06764 0.0534 0.0624 0.06075 0.0545 0.05B9 0.06127 0.0537 0.0597 0.060710 0.0521 0.0593 0.059215 0.0555 0.0604 0.059420 0.0513 0.05B9 0.061325 0.0516 0.0584 0.062130 0.0548 0.0612 0.062135 0.0604 0.0622 0.063340 0.1035 0.0889 0.093242 0.1221 0.1471 0.162745 0.4322 0.4501 0.4721
Reproduced with permission of the copyright owner. Further reproduction prohibited without permission.
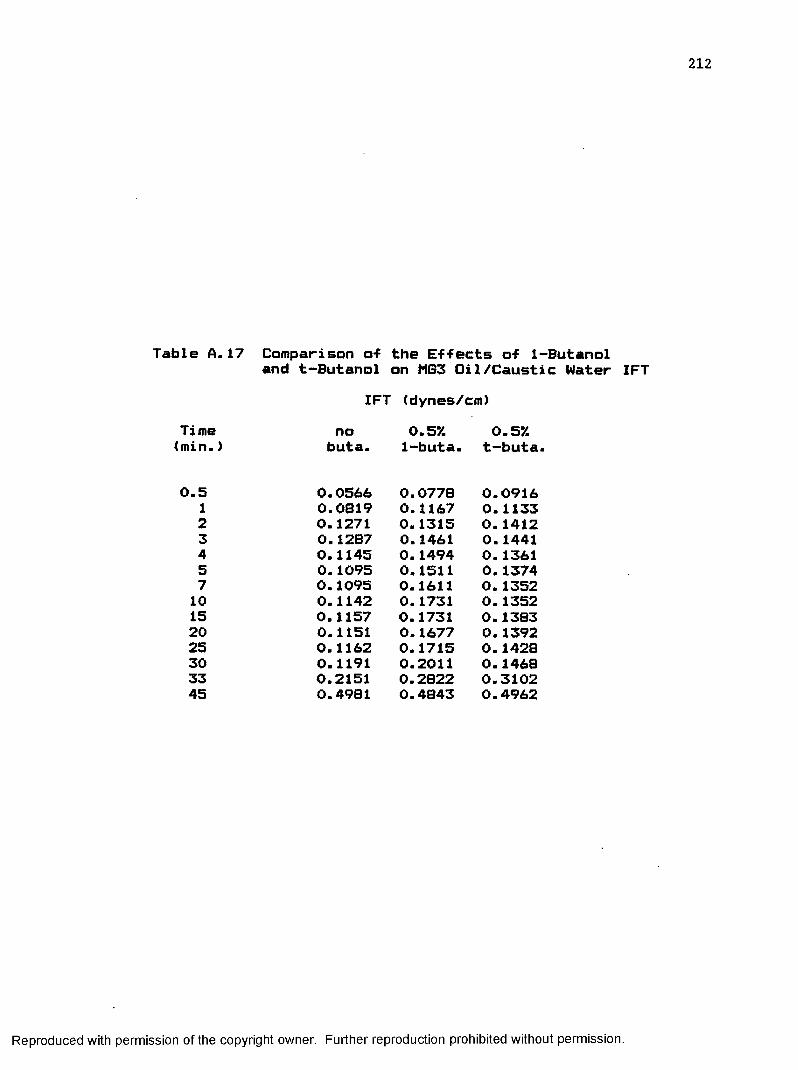
Table A. 17 Comparison of the Effects of 1-Butanoland t-Butanol on MG3 Oil/Caustic Water IFT
IFT (dynes/cm)Time no 0.5*/. 0.57.(min.) buta. 1-buta. t-buta
0.5 0.0566 0.0778 0.09161 0.0819 0.1167 0.11332 0.1271 0.1315 0.14123 0.1287 0.1461 0.14414 0.1145 0.1494 0.13615 0.1095 0.1511 0.13747 0.1095 0.1611 0.135210 0.1142 0.1731 0.135215 0.1157 0.1731 0.138320 0.1151 0.1677 0.139225 0.1162 0.1715 0.142830 0.1191 0.2011 0.146833 0.2151 0.2822 0.310245 0.4981 0.4843 0.4962
Reproduced with permission of the copyright owner. Further reproduction prohibited without permission.
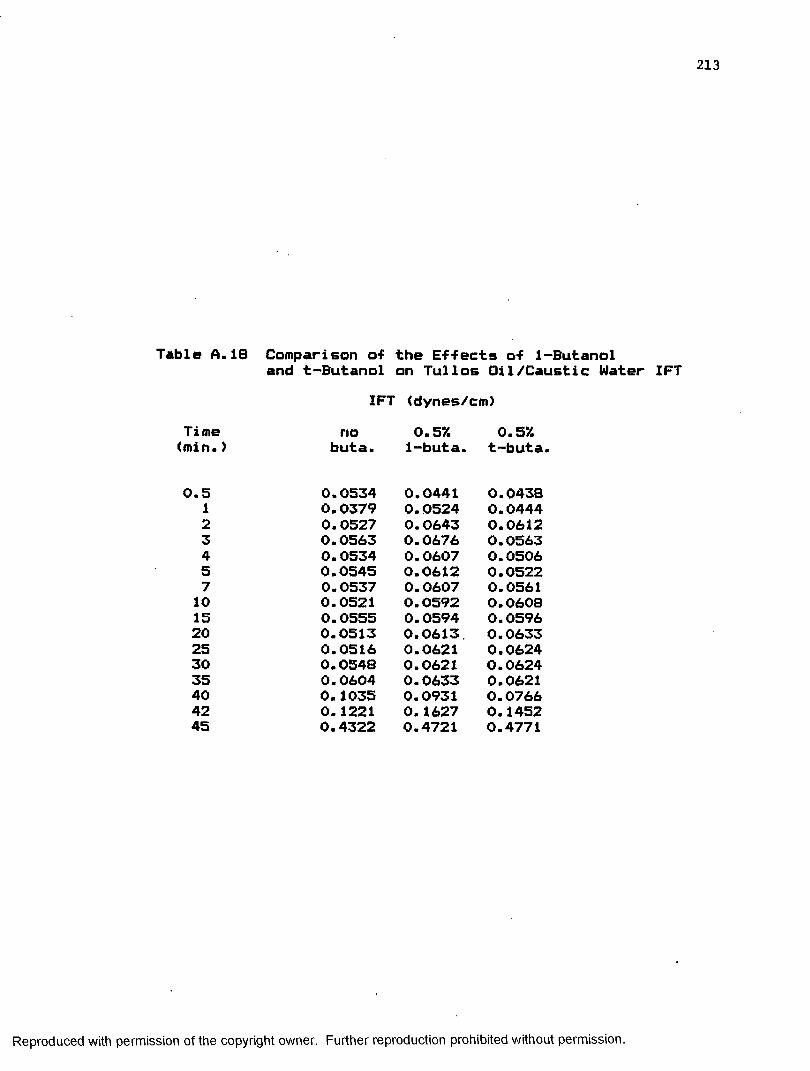
213
Table A.18 Comparison of the Effects of 1-Butanoland t-Butanol on Tullos Oil/Caustic Water IFT
IFT <dynes/cm)Time no 0.57. 0.57.(min.) buta. 1-buta. t-buta
0.5 0.0534 0.0441 0.04381 0.0379 0.0524 0.04442 0.0527 0.0643 0.06123 0.0563 0.0676 0.05634 0.0534 0.0607 0.05065 0.0545 0.0612 0.05227 0.0537 0.0607 0.056110 0.0521 0.0592 0.060815 0.0555 0.0594 0.059620 0.0513 0.0613 0.063325 0.0516 0.0621 0.062430 0.0548 0.0621 0.062435 0.0604 0.0633 0.062140 0.1035 0.0931 0.076642 0.1221 0.1627 0.145245 0.4322 0.4721 0.4771
Reproduced with permission of the copyright owner. Further reproduction prohibited without permission.

Table A.19 Effect of 1-Pentanol on MG3 Oil/CausticWater IFT
IFT (dynes/cm)Time no 0.1*/. 0.57.(min.> 1-penta. 1-penta. 1-penta
0.5 0.0566 0.0762 0.15241 0.0819 0.1015 0.19062 0.1271 0.1168 0.25913 0.1287 0.1215 0.27334 0.1145 0.1233 0.25895 0.1095 0.1259 0.26117 0.1095 0.1284 0.278510 0.1142 0.1322 0.320715 0.1157 0.1482 0.428320 0.1151 0.1448 O'. 429825 0.1162 0.1503 0.431130 0.1191 0.4246 0.429733 0.2151 0.4466 0.450245 0.4981 0.4792 0.4821
Reproduced with permission of the copyright owner. Further reproduction prohibited without permission.
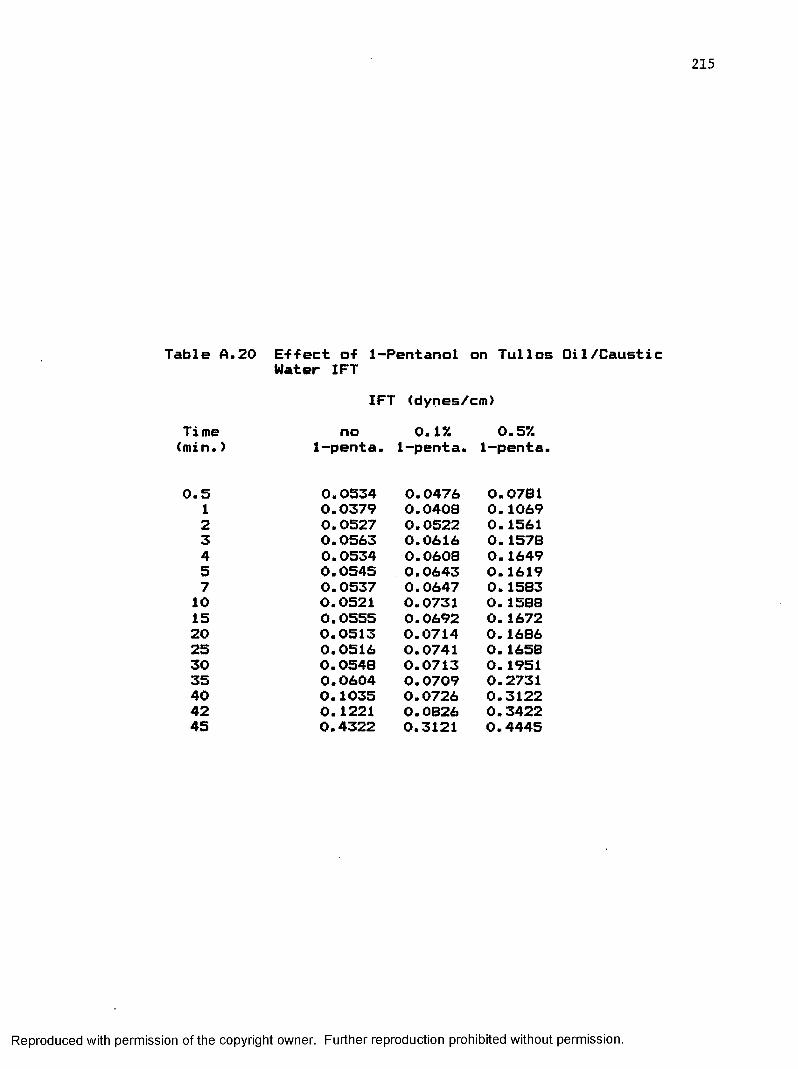
Table A. 20 Effect of 1-Pentanol on Tull os Oil /CausticWater IFT
IFT (dynes/cm)Time no 0.1% 0.5%(min.) 1-penta. 1-penta. 1-penta.
0.5 0.0534 0.0476 0.07811 0.0379 0.0408 0.10692 0.0527 0.0522 0.15613 0.0563 0.0616 0.15784 0.0534 0.0608 0.16495 0.0545 0.0643 0.16197 0.0537 0.0647 0.158310 0.0521 0.0731 0.158815 0.0555 0.0692 0.167220 0.0513 0.0714 0.168625 0.0516 0.0741 0.165830 0.0548 0.0713 0.195135 0.0604 0.0709 0.273140 0.1035 0.0726 0.312242 0.1221 0.0826 0.342245 0.4322 0.3121 0.4445
Reproduced with permission of the copyright owner. Further reproduction prohibited without permission.
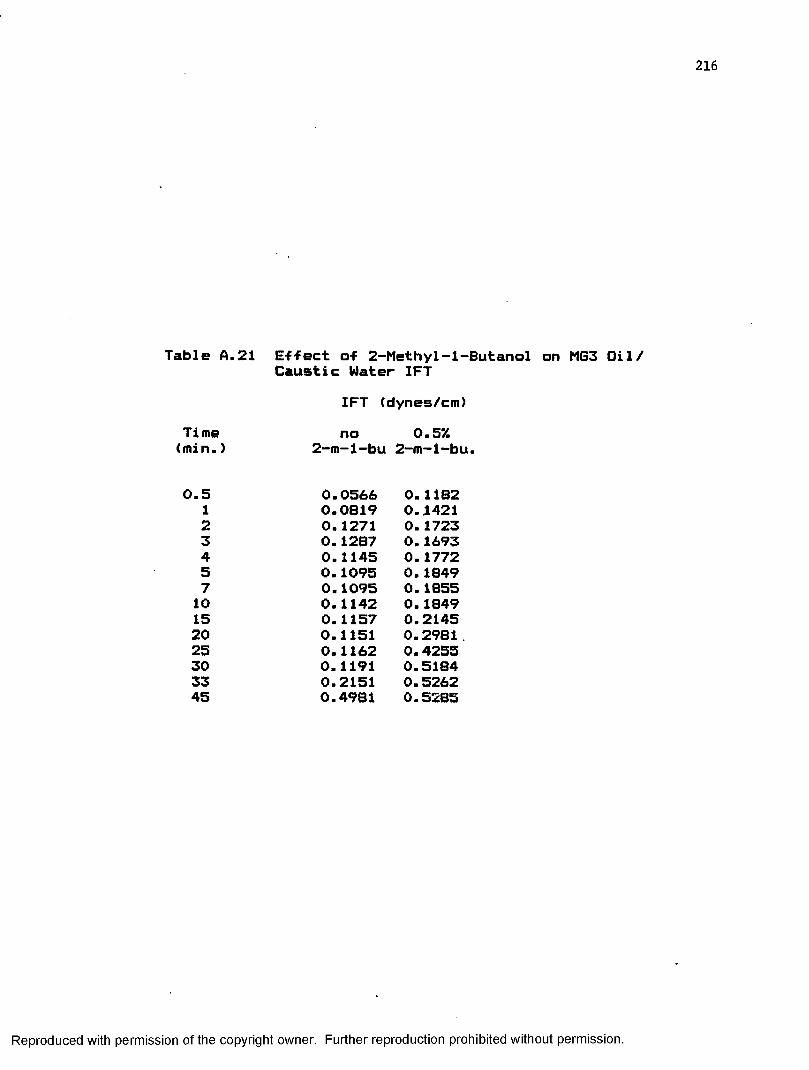
Table A.21 Effect of 2-Methyl-1-Butanol on MG3 Oil/Caustic Water IFT
IFT (dynes/cm)Time no 0.5%(min.) 2-m-l-bu 2-m-l-bu.
0.5 0.0566 0.11B21 0.0819 0.14212 0.1271 0.17233 0.1287 0.16934 0.1145 0.17725 0.1095 0.18497 0.1095 0.185510 0.1142 0.184915 0.1157 0.214520 0.1151 0.2981,25 0.1162 0.425530 0.1191 0.518433 0.2151 0.526245 0.4981 0.5285
Reproduced with permission of the copyright owner. Further reproduction prohibited without permission.

Table A. 22 E-f-fect of 3-Pentanol on M63 Oil /CausticWater IFT
Time (min.>
0.512345 710152025303345
IFT (dynes/cm)no
3-penta.
0.0566 0.0B19 0.1271 0.1287 0.1145 0.1095 0.1095 0.1142 0.1157 0.1151 0.1162 0.1191 0.2151 0.4982
0.57.3-penta.
0.0988 0.1222 0.1374 0.1374 0.1441 0.1414 0.1332 0.1321 0.1567 0.2318 0.4689 0.4786 0.48B1 0.4963
Reproduced with permission of the copyright owner. Further reproduction prohibited without permission.
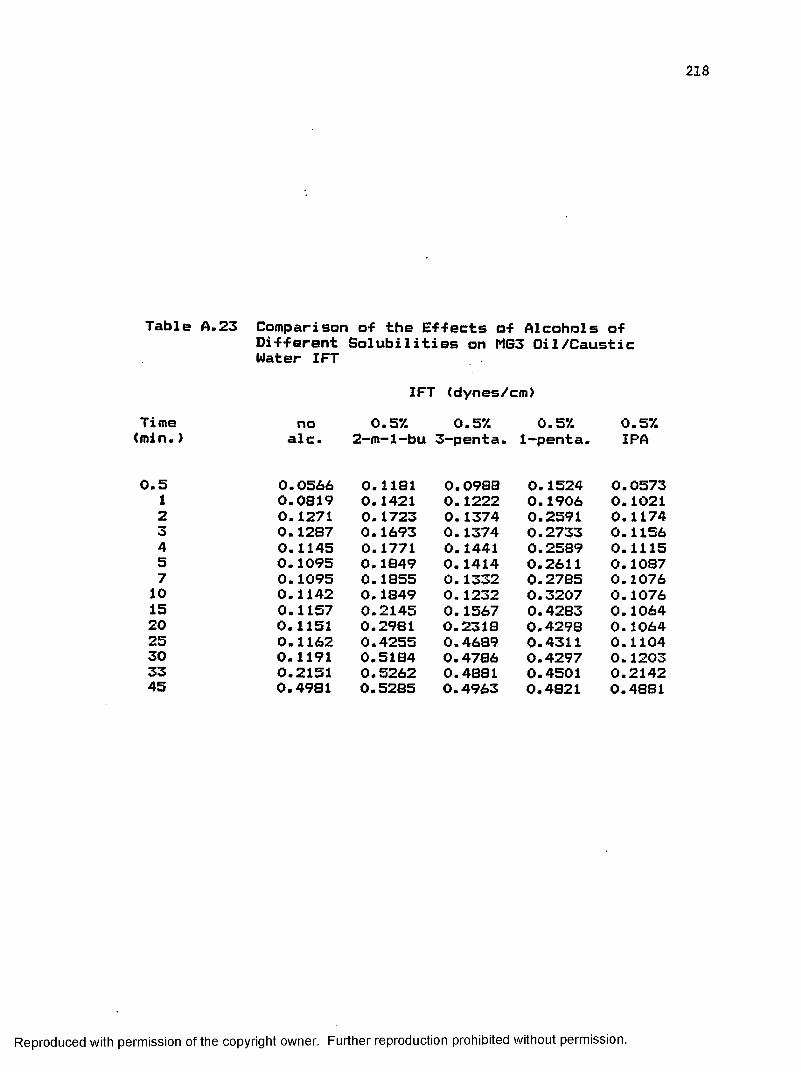
218
Table A.23 Comparison of the Effects of Alcohols of Different Solubilities on MG3 Oil/Caustic Water IFT
IFT (dynes/cm)Time no 0.5’/. 0.5*/. 0.5*/. 0.57.(min.> ale. 2-m-l-bu 3-penta. 1-penta. IPA
0.5 0.0566 0.1181 0.0988 0.1524 0.05731 0.0819 0.1421 0.1222 0.1906 0.10212 0.1271 0.1723 0.1374 0.2591 0.11743 0.1287 0.1693 0.1374 0.2733 0.11564 0.1145 0.1771 0.1441 0.2589 0.11155 0.1095 0.1849 0.1414 0.2611 0.10877 0.1095 0.1855 0.1332 0.2785 0.107610 0.1142 0.1849 0.1232 0.3207 0.107615 0.1157 0.2145 0.1567 0.4283 0.106420 0.1151 0.2981 0.2318 0.4298 0.106425 0.1162 0.4255 0.4689 0.4311 0.110430 0.1191 0.5184 0.4786 0.4297 0.120333 0.2151 0.5262 0.4881 0.4501 0.214245 0.4981 0.5285 0.4963 0.4821 0.4881
Reproduced with permission of the copyright owner. Further reproduction prohibited without permission.
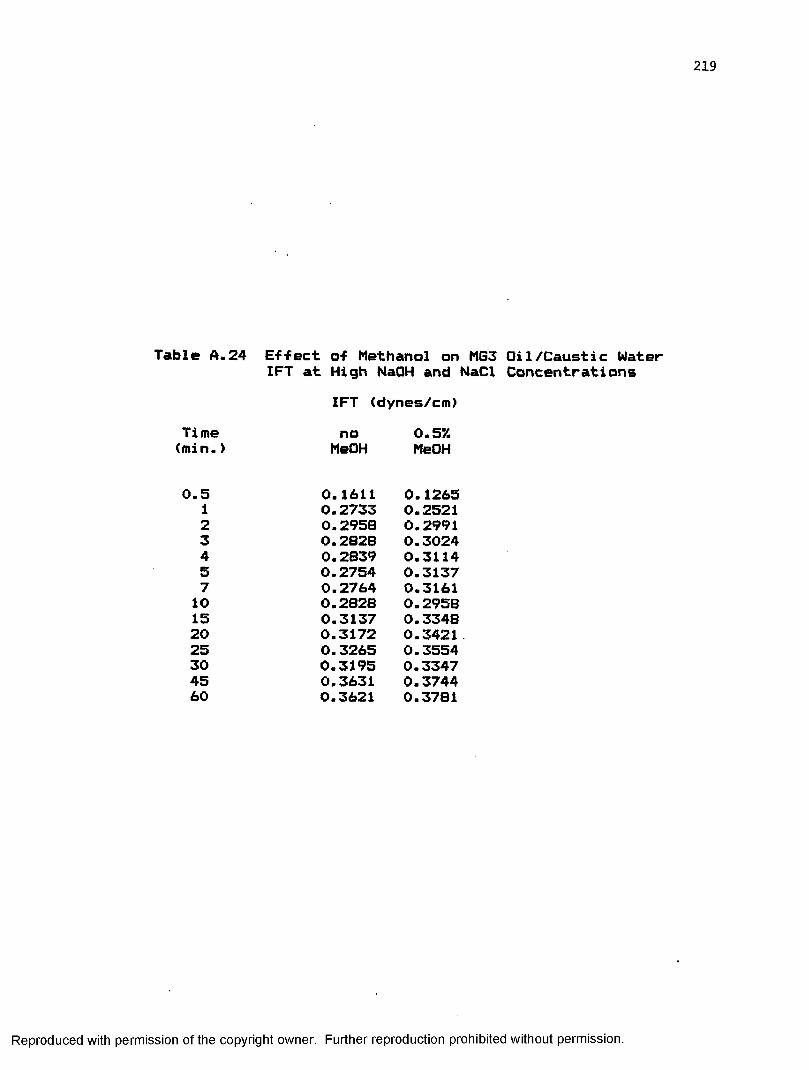
Table A.24 E-f-fect o-f Methanol on MG3 Oil/Caustic WaterIFT at High NaQH and NaCl Concentrations
IFT (dynes/cm)Time no 0.5%(min.) MeOH MeOH
0.5 0.1611 0.12651 0.2733 0.25212 0.2958 0.29913 0.2828 0.30244 0.2839 0.31145 0.2754 0.31377 0.2764 0.316110 0.2828 0.295815 0.3137 0.334820 0.3172 0.3421.25 0.3265 0.355430 0.3195 0.334745 0.3631 0.374460 0.3621 0.3781
Reproduced with permission of the copyright owner. Further reproduction prohibited without permission.

Table A. 25 Effect of Ethanol on MG3 Oil/Caustic WaterZFT at High NaOH and NaCl Concentrations
IFT (dynes/cm)Time no 0.5% 0 .1%(min.) EtOH EtOH EtOH
0.5 O.1611 0.2271 0.15221 0.2733 0.2881 0.24032 0.2958 0.3161 0.31213 0.2828 0.2991 0.30114 0.2839 0.2981 0.30955 0.2754 0.2981 0.30187 0.2764 0.3114 0.318410 0.2828 0.3142 0.300315 0.3137 0.3204 0.301120 0.3172 0.3231 0.313725 0.3265 0.3331 0.318130 0.3195 0.3142 0.344245 0.3631 0.3961 0.355560 0.3621 0.4002 0.3901
Reproduced with permission of the copyright owner. Further reproduction prohibited without permission.
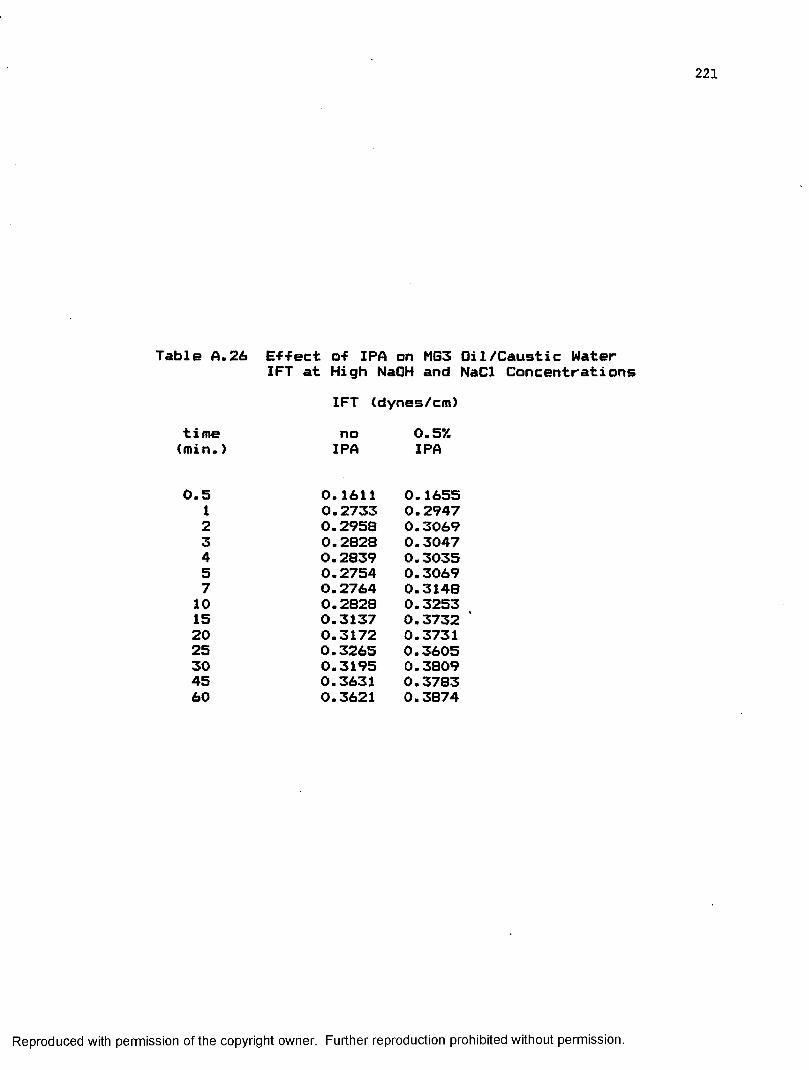
Table A. 26 E-f-fect o-f IPA on MG3 Oil /Caustic WaterIFT at High NaOH and NaCl Concentrations
IFT (dynes/cm)time no 0.5X(min.) IPA IPA
0.5 0.1611 0.16551 0.2733 0.29472 0.295B 0.30693 0.2828 0.30474 0.2839 0.30355 0.2754 0.30697 0.2764 0.314810 0.2828 0.325315 0.3137 0.373220 0.3172 0.373125 0.3265 0.360530 0.3195 0.380945 0.3631 0.378360 0.3621 0.3874
Reproduced with permission of the copyright owner. Further reproduction prohibited without permission.
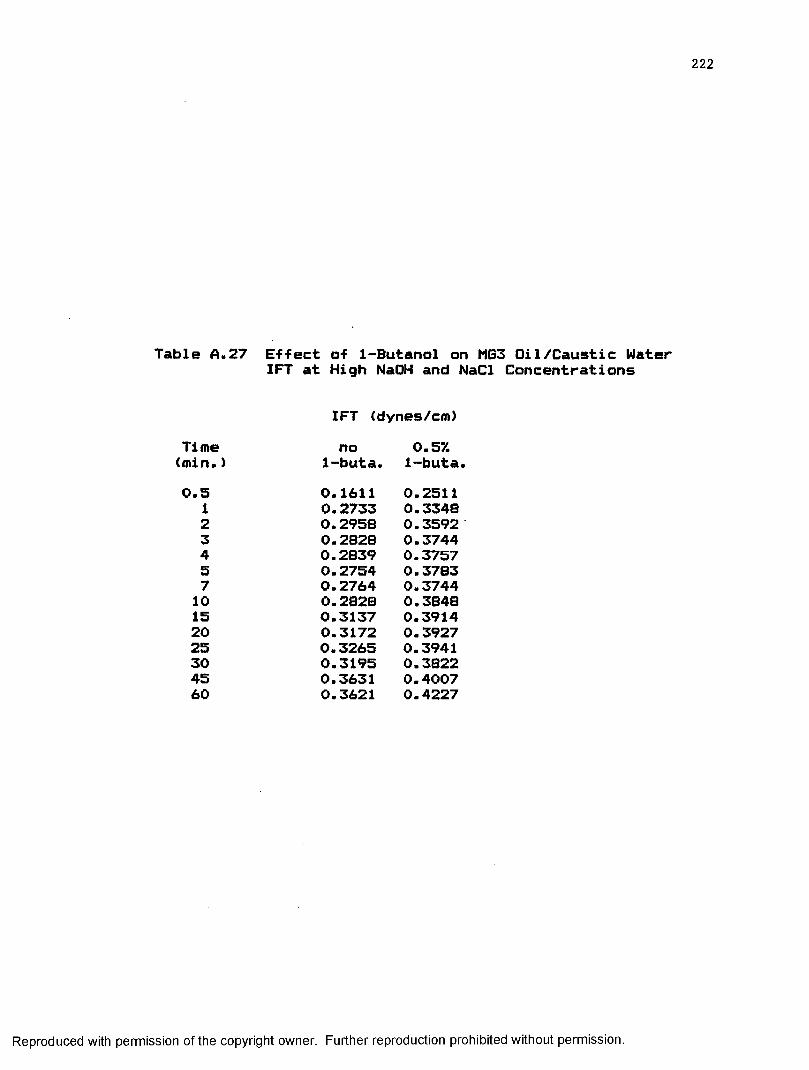
222
Table A.27 E-f-fect o-f 1-Butanol on MG3 Oil /Caustic Water IFT at High NaOH and NaCl Concentrations
IFT (dynes/cm)Time no 0.5'/.(min.) 1-buta. 1-buta.0.5 0.1611 0.2511
1 0.2733 0.33482 0.2958 0.35923 0.2828 0.37444 0.2839 0.37575 0.2754 0.37837 0.2764 0.374410 0.2828 0.384815 0.3137 0.391420 0.3172 0.392725 0.3265 0.394130 0.3195 0.382245 0.3631 0.400760 0.3621 0.4227
Reproduced with permission of the copyright owner. Further reproduction prohibited without permission.
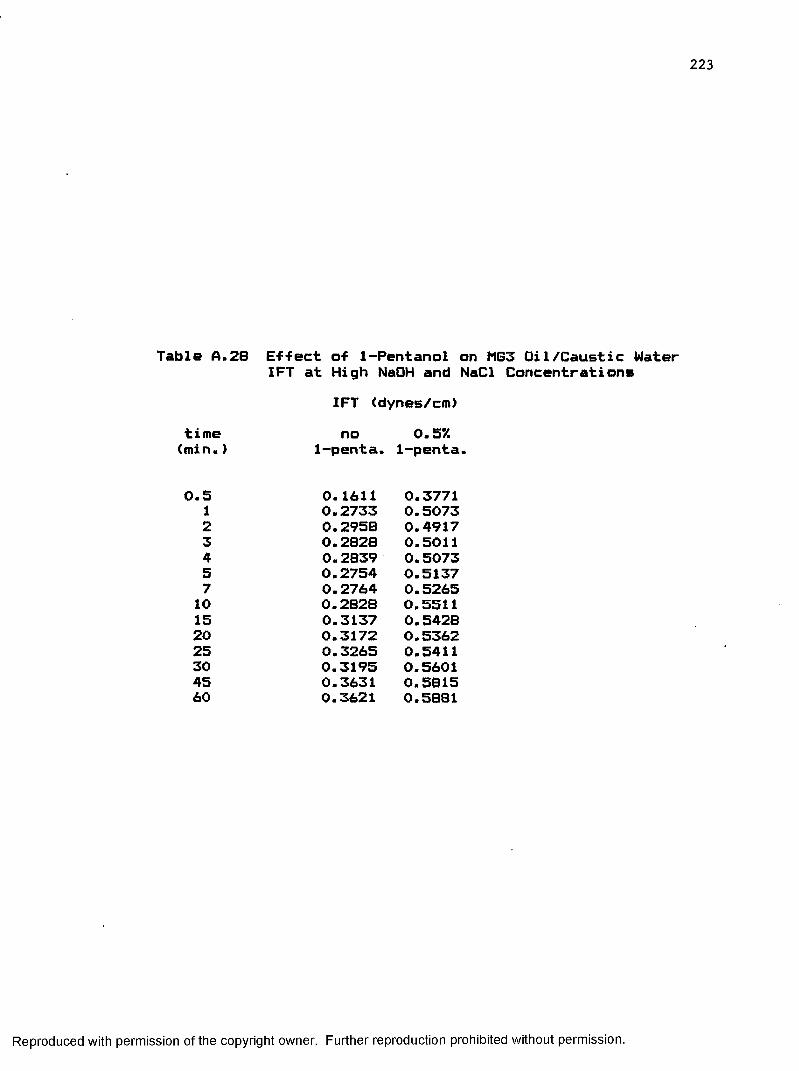
223
Table A.28 E-f-fect o-f 1-Pentanol on MG3 Oil/Caustic Water IFT at High NaOH and NaCl Concentrations
IFT <dynes/cm)time no 0.5%(min.) 1-penta. 1-penta.
0.5 0.1611 0.37711 0.2733 0.50732 0.2958 0.49173 0.2828 0.50114 0.2839 0.50735 0.2754 0.51377 0.2764 0.526510 0.2828 0.551115 0.3137 0.542820 0.3172 0.536225 0.3265 0.541130 0.3195 0.560145 0.3631 0.581560 0.3621 0.5881
Reproduced with permission of the copyright owner. Further reproduction prohibited without permission.

Table A. 29 E-f-fect of Ethanol and 1-Pentanol onTull os Oil/Caustic Water IFT at High NaOHand NaCl Concentrations
IFT (dynes/cm>time no 0.5'/. 0.57.(min.) ale. 1-penta. EtOH
0.5 0.1081 0.2783 0.10411 0.1374 0.4622 0.14682 0.1546 0.5591 0.16053 0.1497 0.5507 0.15914 0.1455 0.5676 0.15835 0.1428 0.5953 0.15327 0.1428 0.5951 0.161910 0.1411 0.5948 0.161215 0.1435 0.5971 0.156820 0.1418 0.5961 0.159125 0.1428 0.5965 0.156930 0.1435 0.5967 0.157245 0.1425 0.5971 0.156360 0.1431 0.5966 0.1568
Reproduced with permission of the copyright owner. Further reproduction prohibited without permission.
APPENDIX B
Slides Of Flow Behavior Studies
225
Reproduced with permission of the copyright owner. Further reproduction prohibited without permission.
Slides of Flow Behavior Studies
The slides shown in the appendix were obtained from the microphotographic analysis of the flow behavior of crude oil/alkaline water and crude oil/alcohol-augmented alkaline water systems. Slides of the flow behavior of these systems in corefloods are also included as well as slides showing the flow behavior in thin flow cells of crude oil fractions contacted with alkaline water solutions.
226
Reproduced with permission of the copyright owner. Further reproduction prohibited without permission.
PLEASE NOTE:
Slides in this dissertation, pages 227-232, have not been filmed They are available for consultation, however, at Louisiana State University.
University Microfilms International
Reproduced with permission of the copyright owner. Further reproduction prohibited without permission.
VITA
Mohamed Amine Dahmani is the son of Kouider Dahmani and Fadila Seri. He Mas born in Dely-Ibrahim, Algeria on December 16, 1957. He graduated from El-Mokrani HighSchool, Algiers, Algeria in 1976. He received an Algerian Oil Company Scholarship to study at Louisiana State University, Baton-Rouge, LA where he enrolled in August 1977. In May 19B1, he received a Bachelor of Science degree in Petroleum Engineering. In August, 19S1 he enrolled in the Graduate School of Louisiana State University to work toward the degree of Master of Science in Petroleum Engineering which he obtained in August, 1983. In the Fall of 1983, he enrolled in the Graduate School of Louisiana State University to pursue the degree of Ph.D in Petroleum Engineering.
233
Reproduced with permission of the copyright owner. Further reproduction prohibited without permission.
DOCTORAL EXAM INATIO N AND DISSERTATION REPORT
Candidate: Mohamed Amine Dahmani
Major Field: Petroleum Engineering
Title of Dissertation: The Effects of Alcohols and Crude Oil Composition on the Performance and Mechanisms of Alkaline Flooding of Oil Reservoirs
Approved:
Major Professor and Chairman
eairof the Grad
MINING COMMITTEE:
L
Date of Examination:
November 20, 1986
Reproduced with permission of the copyright owner. Further reproduction prohibited without permission.