Embed Size (px)
Citation preview
1
Influence of the crude oil and water composition
on the quality of synthetic produced water.
Marcin Dudek1, Eugénie Kancir2 and Gisle Øye*,1
1 Ugelstad Laboratory, Department of Chemical Engineering, Norwegian University of
Science and Technology (NTNU), Sem Sælandsvei 4, 7491 Trondheim, Norway
2 National Graduate School of Engineering (ENSICAEN), 6 Boulevard Maréchal Juin, 14000
Caen, France
Keywords: Produced water, crude oil, water quality, water characterization, oil
characterization.
ABSTRACT
Produced water originates from the crude oil production. It is a mixture of organic and
inorganic compounds and its composition is highly oilfield-dependent. The present study was
carried out to increase the understanding of the relations between the crude oil properties and
the composition of the aqueous phase on the produced water quality. Brines with different
compositions and pH levels were mixed with five crude oils. Initially, the physicochemical
properties and composition of the crude oils were determined, while the quality of the synthetic
produced water samples were described by parameters such as the total oil concentration and
organic carbon, pH, the drop size distribution and the Sauter mean diameter. The
characterization part revealed that crude oils fell into two categories: light and heavier oils.

2
Most parameters like density, viscosity, total acid number (TAN) or composition reflected this
division. A similar pattern was sustained for the water quality analyses. Water produced with
heavier crude oils generally contained higher concentration of emulsified oil with the biggest
and most polydispersed droplets. Light oils had a tendency to create water-in-oil emulsion
between the oil and water phase, which impeded the phase separation, resulting in less free
water. The Sauter mean drop diameters increased with pH of the water phase. However, the
presence of calcium at the highest pH decreased the droplet size and the amount of free water,
compared to the brine without divalent ions, which is in agreement with the interfacial role of
the naphthenic acids in the crude oil emulsions. The results showed the significance of both the
water and oil composition on the quality of the produced water. This can lead to improved
fundamental perception of the produced water treatment process.

3
Introduction
During crude oil and gas production, the largest by-product during the extraction process is
produced water. The water cut depends on the location of the reservoir and the age of the
production wells. It can vary from a few percent in the beginning of the exploitation to more
than 95% in the last phases of the production. Global estimates say that for every barrel of
crude oil, three barrels of water are produced1.
There are two main paths for disposal of the produced water. One is discharge of the water
to the sea. Before the water can be disposed of, it needs to undergo treatment processes to reach
a certain quality level, specified by local environmental regulations. Depending on the location,
the maximum average oil in water (OIW) content for disposal is between 30 and 40 ppm2. The
second disposal option, reinjection, can be carried out by pumping the water into a disposal or
a production reservoir. The latter would be more desired from a technological and economical
point of view, as it can sustain the production pressure of the reservoir3. Produced water
reinjection is also likely to be preferred way of handling the water in subsea production and
processing facilities. However, the process also carries several risks, for instance reservoir
souring or formation damage due to injectivity decline. Furthermore, emulsified oil droplets
and suspended solid particles in the produced water can block the pores in the reservoir and
decrease the permeability of the formation. This means that the requirements for the quality of
the produced water are strict both for the reinjection and discharge options4.
The produced water treatment methods can be divided into three types. The primary
separation relies on the bulk phase separation of gas, crude oil and water, using a conventional
or modified gravity separator. In this step, the OIW concentration in the outlet water can range
from 100 ppm to 1000 ppm5. The secondary treatment usually consists of hydrocyclones or gas
flotation units. Both those processes are capable of lowering the oil in water concentration
below the discharge limit6-8. A tertiary treatment (or water polishing step) can be performed to
4
reduce the concentration of dissolved components through media filtration or adsorption
processes6, 9-10 . Novel techniques such as ultrafiltration11, nanofiltration and reversed
osmosis12-13 or biological treatment1, 14 are also considered to be promising water polishing
methods.
The produced water contains dissolved salts, dispersed solids, dissolved and dispersed crude
oil components, as well as traces of heavy metals and radioactive materials9. Additionally,
chemicals added during different stages of the production affect the quality and properties of
the produced water15-16. The composition of the produced water is field-dependent, as the
location of the reservoir determines its conditions (pressure, temperature), reservoir rock and
the type of the produced oil. The conditions of the reservoir will mostly affect the water
solubility of salts dissolved from the rock formation, gases and indigenous crude oil
compounds. What is more, the conditions of the reservoir also change with the progress of the
oil production, especially when seawater is injected or enhanced oil recovery techniques are
employed.
The chemical composition of the crude oil has an effect on the produced water quality, with
respect to both dispersed and dissolved components. Typically, crude oil is characterized by
physical properties like density and viscosity, and chemical properties, such as the total acid
and base number and SARA (Saturates, Aromatics, Resins, Asphaltenes) composition. The
interfacial activity of components in the crude oils will be affected by these parameters and can
lead to increased emulsion stability and problems with separation17-18. It has been shown that
the interfacial properties can influence the coalescence of oil droplets19 and the stability of oil-
in-water emulsions20-21. Once in contact with an aqueous phase, water-soluble hydrocarbons in
the crude oil will partition into the water phase22-24, adsorb at the gas-water interfaces and
influence the oil removal efficiency by gas flotation25-26. The characteristics of the produced
5
water also depends on the properties, like pH27-28, ionic strength29 and the presence of divalent
ions30.
The aim of this work was to investigate the effect of the water and crude oil properties on the
quality of produced water. First, the physicochemical and interfacial properties of five crude
oils were studied. Then the oils were mixed with water with different pH and ionic composition.
After separation, the quality of the synthetic produced water (i.e. free water) was determined
in terms of the total organic carbon, pH, the total oil concentration and the drop size
distributions of the dispersed oil. The preparation conditions were kept the same for all the
samples in order to enhance the influence of the crude oil properties and the water composition
on the synthetic produced water quality.

6
Materials and methods
Crude oil characterization.
Crude oils. Five dead (i.e. stored at ambient pressure and temperature) crude oils from the
Norwegian Continental Shelf were analyzed and used as received.
Density measurements. The density of the crude oils was measured at 20°C, using a DMA
5000 laboratory density meter (Anton Paar, Austria).
Viscosity measurements. The viscosity of the crude oils was measured at 20°C, using a MCR
301 laboratory rheometer (Anton Paar, Austria) with a cylindrical geometry (CC-27).
Total acid and base number measurements. The analysis of the total acidic number (TAN)
was performed according to the D664-95 ASTM method31. The total base number (TBN) was
evaluated with a similar method to the one presented by Dubey and Doe32. Both methods were
described in details previously33. In short, TAN was determined by titrating the solution of
crude oil in a 100:99:1 (v/v) mixture of toluene/isopropanol/water with 0.1 M solution of
tetrabutylammonium hydroxide in a 10:1 mixture of isopropanol and methanol (Sigma-
Aldrich). To measure the TBN, the solution of crude oil dissolved in methylisobutyl ketone
was titrated with 0.025 M solution of perchloric acid in acetic acid. In both cases the titration
was controlled by a Titrando unit (Metrohm, Switzerland), connected to a 6.0229.100 LL
solvotrode.
HPLC fractionation. The procedure for fractionation of the crude oils into saturates,
aromatics, resins and asphaltenes (SARA) was previously reported by Hannisdal et al.34. 4 g of
crude oil were dissolved in 160 ml of n-hexane (Chromanorm®for HPLC, VWR). The
mixtures were mixed overnight and then filtered with a 0.45 µm membrane filter (Millipore
HVLP) to isolate the asphaltene fraction. A HPLC system with two columns (unbounded silica
and amino) was used to fractionate the filtered maltenes into saturate, aromatic and resin

7
fractions. After controlled evaporation of the solvent in N2 atmosphere, the weight percentages
of the fractions were determined gravimetrically.
Interfacial tension measurements. The interfacial tension (IFT) measurements were
performed using a pendant drop tensiometer (PAT-1M, Sinterface Technologies, Germany).
Images of a crude oil drop, immersed in a brine solution were recorded over time. The
measurements lasted until the near-equilibrium values were reached. This usually took less
than 7 hours for the light oils, while often exceeded 16 hours for the heavier crude oils (an
example of the dynamic interfacial tension evolution was shown in Figure S1 in Supporting
Information). The interfacial tensions were calculated by fitting the drop profiles to the Young-
Laplace equation. The reported IFT values were an average of at least two measurements. All
the measurements were performed at room temperature (22°C).
Elemental composition analysis. The content of carbon, hydrogen, nitrogen, oxygen and
sulphur was determined for the crude oils and each of their SARA fractions. The analyses were
performed using an elemental analyser EA 1108 (Fisons Instruments) at the Oil and Gas
Institute – National Research Institute in Cracow (Poland).
Water content. The amount of water in the as-received crude oils was analysed by Karl
Fischer titration, using a KF Coulometer 831 (Metrohm, Switzerland).
Preparation and characterization of synthetic produced water.
Brine solutions. Two types of brines were used during this study in order to simulate high
salinity conditions and to study the influence of divalent ions on the produced water quality.
The first contained only NaCl (Emsure®, Merck Millipore) and is referred to as Na-Brine. The
other was a mix of NaCl and CaCl2·2H2O (p.a., Sigma-Aldrich), with a molar ratio of sodium
to calcium equal to 35:1, and is referred to as NaCa-Brine. The ionic strength was kept the
same in both the brines (I=0.59 M). The salt concentration was similar to the seawater
conditions, however the produced waters from the Norwegian Continental Shelf were reported

8
to be of comparable salinity35. The solutions were adjusted to pH 3 and 10, using solutions of
diluted HCl (AnalaR, VWR) and dissolved NaOH (AnalaR, VWR). The natural pH of the
brines ranged from 5,9 to 6,4 and is later referred to as pH 6. Deionized water (Millipore
Simplicity Systems, Germany) was used to prepare all solutions.
Produced water preparation. 100 ml brine and 100 ml crude oil were poured into a 250 ml
aspirator bottle and mixed for 8 min at 20 000 rpm, using an Ultra-Turrax S25N-10G
homogenizer (IKA, Germany). The samples were left to phase separate for two hours, before
the water phase was collected through the bottom outlet of the aspirator bottle. The amount of
free water after 2 hours was recorded. From the collected water phase (later referred to as the
synthetic produced water), the drop size distributions, the total oil concentration and pH in this
synthetic produced water were determined. Each sample was prepared and analyzed at least
three times. All of the steps were performed at room temperature (22°C).
Drop size measurements. The drop sizes in the water phase were analyzed within 5 minutes
after sampling, using a Nikon LV 100D microscope. 10 to 12 pictures were captured per sample
and the Image-Pro Plus 5.0 software was used to determine drop size distributions and the
Sauter mean diameters, which were calculated according to Equation 1:
𝑑32 =∑𝑑𝑖
3
∑𝑑𝑖2 (1)
where d32 is the Sauter mean diameter and di is the diameter of the drop, detected by the
software. Only drops below 30 µm were considered.
Total oil concentration. Appropriate amount of methylene chloride (HiPerSolv
CHROMANORM for HPLC, VWR) was added to the water phase and shaken, in order to
extract the dispersed and dissolved crude oil components into the organic phase. The two
phases were then separated in a separation funnel. The organic phase was collected and UV
analysis was performed to determine the amount of oil, using UV-VIS spectrophotometer (UV-
9
2401PC, Shimadzu, Japan). Calibration curves, prepared individually for each crude oil, were
used to calculate the oil concentration from the absorbance at 259 nm.
pH measurements. The pH of the water phases were measured using a pH meter (SevenEasy
pH, Mettler Toledo, Switzerland). Prior to the measurements, the oil drops were removed by
centrifugation (Heraeus Multifuge X3R, Thermo Scientific, USA).
Total Organic Carbon (TOC) analysis. Approximately 50 ml of brine and 50 ml of crude oil
were poured into Schott bottles and put on a vertical shaker (200 rpm) for 24 hours in order to
saturate the water phase with the water-soluble oil components. Subsequently, the aqueous
phase was sampled, centrifuged (Heraeus Multifuge X3R, Thermo Scientific, USA) and
acidified to pH<2 with sulphuric acid (95-97% p.a., Sigma-Aldrich). The TOC analyses were
then determined using a TOC-LCPH Analyser (Shimadzu, Japan). The analyses were performed
at GIG Research Institute in Katowice (Poland).

10
Results and discussion
Crude oil characterization.
The physicochemical properties and the composition of the crude oils are presented in Table
1. Based on the API gravities, the crude oils were divided into light oils, with the API values
ca. 36-38 (B,D,E), and heavier oils with the API values 19.2 and 23 (A,C). The heavier oils
were characterized by significantly lower saturate fraction and higher TAN numbers (above 2
mg KOH/g oil) than the other oils. Furthermore, their substantial content of polar components
(resins and asphaltenes) provided higher density and viscosity. The light oils consisted of low
amounts of acidic and basic components. In addition, they had similar values of the density and
the viscosity, the lowest water content and some variations in the saturate, aromatic and resin
contents.
More detailed insight into crude oils composition was provided by the elemental analysis of
all the fractions, as previously demonstrated by Gawel et al.33. The C/H atomic ratios of the
crude oils are shown in Fig. 1. The division into light and heavier crude oils was also noticed
here, as crude oils A and C had higher C/H ratio (0.62 and 0.59 respectively) than the remaining
crude oils (ca. 0.55). The C/H atomic ratio in the saturate fractions was slightly higher for the
heavier crude oils (0.52-0.53) than for the light oils (ca. 0.5). The saturate fractions are usually
expected to contain straight-chained, branched or cyclic aliphatic hydrocarbons, but this could
suggest that the heavier crude oils also contained some compounds with unsaturated moieties.
The aromatics and resins fractions had comparable values of the C/H ratio in most of the oils,
which indicated similar aromacity with an analogous extent of methylene moieties in both
fractions. The biggest variation was observed for the asphaltenes. Crude oils A and C had the
highest aromaticity in this fraction, while it was lower for the lighter crudes. The surprisingly
low value for crude oil E may be due to oxidation of the sample (see below).
11
Fig. 2 shows the amount of nitrogen, oxygen and sulphur in the complete crude oils and their
SARA fractions. The amount of nitrogen in the crude oil D was considerably higher than for
the rest of the oils (Fig. 2A). No nitrogen was detected in the saturate fractions of the crude
oils, whereas the aromatic and resin fractions contained similar amounts of nitrogen. The
asphaltene fractions contained the highest nitrogen amounts for crude oil A and C. For the
lighter oils, however, the highest nitrogen content was seen in the resin fraction. The oxygen
content was similar in all the crude oils (Fig. 2B). Furthermore, the saturate and aromatic
fractions had comparable and relatively low amounts of oxygen, while the two most polar
fractions contained significantly more of this element. Most of the light crude oils had higher
amount of oxygen in the asphaltenes than in the resin fractions, which agrees with observations
made by Gawel et al.33. The crude oils with the highest viscosity (A and C) tended to have
larger amounts of sulphur (Fig. 2C). This trend was also seen in the SARA fractions, where all
fractions of the heavier crudes contained more sulphur, with an exception of crude oil B, which
had very high content of sulphur in the aromatics fraction. Similarly to nitrogen, no sulphur
was detected in the saturate fractions of all of the crude oils.
The IFT values of the crude oils varied from 19 to 20.5 mN/m against the Na-Brine and from
16.2 to 19.9 mN/m for the NaCa-Brine. The lowering of the IFT when calcium was present in
the aqueous phase suggested that acidic components played some role for the interfacial
properties, as dissociated acids can form complexes with Ca2+ 36-37. However, no quantitative
relations were found between the IFT and the TAN. The asphaltenes are also known to reduce
the IFT38. An interesting observation in this respect was that slightly lower interfacial tension
values were obtained for the two crude oils (D, E) with the highest content of nitrogen. These
crude oils also had significantly higher share of oxygen in their asphaltene fractions. An
inversed dependence was observed for sulphur, as crude oils A, B and C had the highest values
of the IFT. These observations were in agreement with previous findings39.

12
Separation
Fig. 3 displays that the total amount of free water after two hours of gravity separation varied
between the samples, but generally increased when the initial pH of the Na-Brine increased. A
similar trend was noticed for the NaCa-Brine (Figure S2 in Supporting Information). The
amount of recovered water was higher for the samples with heavier crudes than for the samples
prepared from the lighter crude oils at the two lowest pHs. This was likely due to the formation
of stable water-in-oil emulsion layers that reduced the amount of recovered water in the latter
samples, however size distributions of the water drops might also have played a role. A similar
trend was not seen at the highest pH, where the difference in the amount of recovered water
varied less between the samples. Furthermore, while the amount of recovered water was more
or less independent of the ionic composition at the lowest pHs, the amount of recovered water
decreased in the presence of calcium ions at pH 10, as seen in Table 2. The reduction ranged
from a few (A, D) to almost 30 percent (C, E).
The higher water-in-oil emulsion stability for the systems with the lighter crude oils was
explained by the high saturate and low aromatic contents in these oils. This can facilitate
increased interfacial activity, as well as the aggregation of asphaltenes, resulting in rigid
interfacial layers that enhanced the emulsion stability19, 38, 40. It was also argued by other authors
that wax particles, often found in light crude oils, can increase the emulsion stability41. pH of
the aqueous phase also influenced the rigidity or viscoelasticity of the interfacial films and
thereby the emulsion stability. At low pH, competitive adsorption of protonated naphthenic
acids and molecules of resins and asphaltenes had been reported to form rigid interfacial layers
that oppose the coalescence of crude oil drops42. Increased pH caused dissociation of the
naphthenic acids, which enhanced their interfacial activity and their water solubility.
Replacement of molecules causing interfacial rigidity by dissociated naphthenic acids has been
proposed as a reason for decreased emulsion stability42. Furthermore, partitioning of the

13
naphthenic acids into the aqueous phase has also been found to reduce interfacial film
stability43. Here, the presence of divalent ions increased the emulsion stability at the highest
pH. This indicated that sufficient dissociated acids at the interface underwent complexation
with calcium and strengthened the interfacial film. As mentioned above, another contributing
factor for the differences in the stability of water-in-oil emulsions might have been the size
distribution of water droplets. Crude oils with higher viscosity require longer mixing time, in
comparison with less viscous oils, to reach a comparable water droplet size distribution44. As
the mixing time here was constant for all of the samples, it is possible that large enough water
droplets were present in the heavier crude oils to give higher amount of recovered water due to
faster sedimentation.
Produced water quality
The total organic carbon content, representing the water soluble crude oil components, in the
synthetic produced water from NaCa-Brine varied from about 20 to 70 ppm between the
samples, as seen in Fig. 4. Similar trends, with slightly lower TOC values, were observed in
the samples from the Na-Brine (Figure S3 in Supporting Information). The highest values of
TOC were found in the synthetic produced water prepared from crude oil D and E. Notably,
those crude oils stood out with a considerably higher oxygen content in the asphaltene fractions
than the other oils. This could suggest improved water solubility of the smallest compounds in
the asphaltene fractions21. Similar observations were made previously45, where the amount of
oxygen in the asphaltene fraction affected their water solubility.
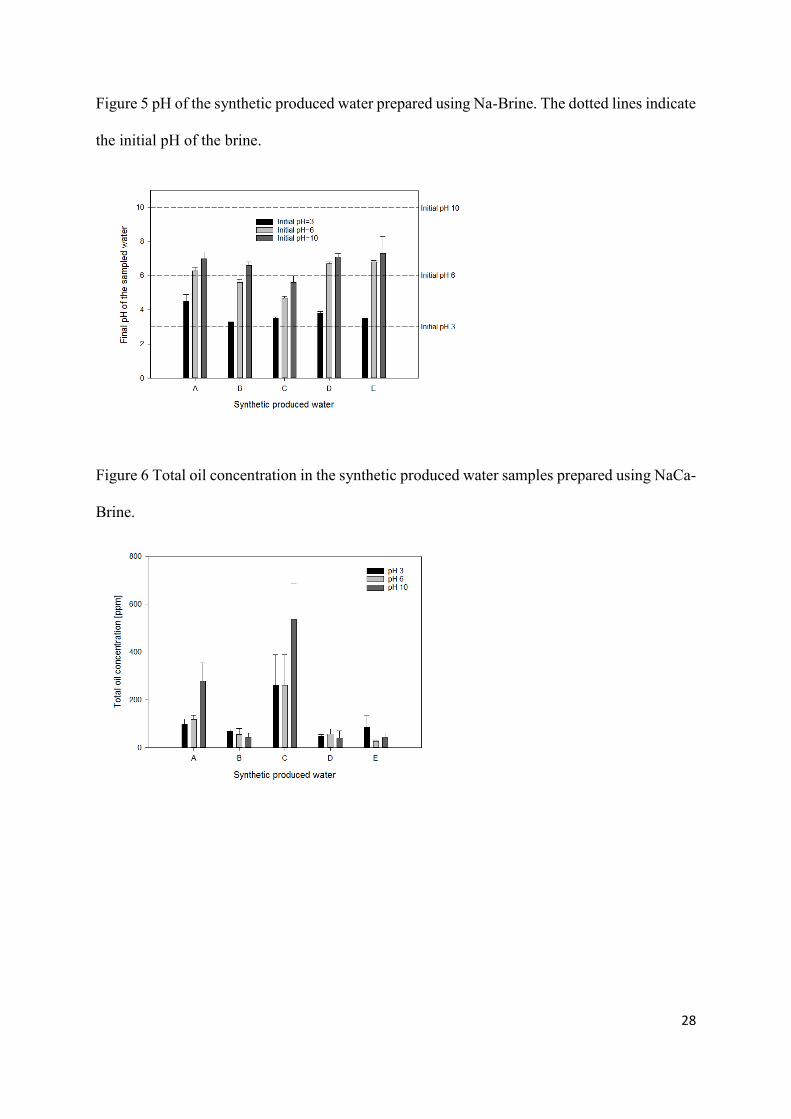
The composition of the crude oil also had an impact on the pH of the synthetic produced
water (Fig. 5). When the initial pH of the brine was 3, most of the samples displayed a slight
increase of the pH. For the produced water from crude oil A, however, the pH was noticeably
higher. The significantly higher TBN in the corresponding crude oil may promote more
extensive partitioning of the basic components into the aqueous phase. When the initial pH of
14
the brine was 6, the produced water samples experienced either a small decline or a small
increase of the final pH value. However, in this pH range even the smallest concentration of
dissociated species can cause a noticeable change in the pH. The effect of the dissolved CO2
would also be most noticeable in this range. All water samples experienced a considerable
decrease of pH (down to 6-7), when the brine was initially at pH 10. This agrees with the higher
water solubility of the acidic components in the crude oils27. It is worth pointing out that the
water produced with crude oil C showed a lower pH value than the other samples with brines
pH 6 and 10, corresponding with a high TAN value for this crude oil. Overall, these results
showed that the type of compounds that partitioned into the aqueous phase depended on the
initial pH of the brine for all the crude oils. When the pH was low, the solubility of the basic
components increased, while the brines with higher pH levels raised the water-solubility of the
molecules with acidic groups. The results also resembled a study on the mass transfer between
crude oil and water performed by Hutin et al24. The authors introduced a model for quantifying
the effect of the acidic and basic components partitioning from the oil phase, on the final pH
of the aqueous phase. Generally, the results indicated that acidic components were more water-
soluble in the tested pH range and were in agreement with the mentioned paper. Even when
the TAN values of the crude oils were low (0.5 mg/KOH or less), the final pH of aqueous phase
dropped from 10 to 6-7. Similar observations were not made for the TBN values. At the low
initial pH only crude oil A had significant partitioning of basic components into the aqueous
phase. This crude oil not only had the highest TBN value, but also contained the highest amount
of asphaltenes and resins. Furthermore, it had the highest nitrogen content in the asphaltene
fraction, which could explain the increase in pH.
As seen in Fig. 6, a marked difference in the oil in water concentration was observed between
the produced waters from the light and heavier oils. The water from the heavier crude oils
usually contained between 100 and 500 ppm of oil, while the light crude oils gave water with

15
less than 100 ppm of oil. The increased amount of oil in the produced water from the heaviest
crude oils was only seen at high pH when calcium was present. Both of those crude oils had
significantly higher TAN, traditionally used as an indicator of the naphthenic acids content. As
discussed previously, increased pH causes dissociation of the naphthenic acids and their
enhanced interfacial activity. The presence of calcium enabled the formation of complexes,
which could accumulate at the oil/water interface and stabilize the system. The relatively high
standard deviations in the produced water samples from the heavier oils (A, C) was due to
difficulties when sampling the water phase after separation. The viscous crude oils tended to
get stuck in the outlet and distorted the oil in water concentration results.
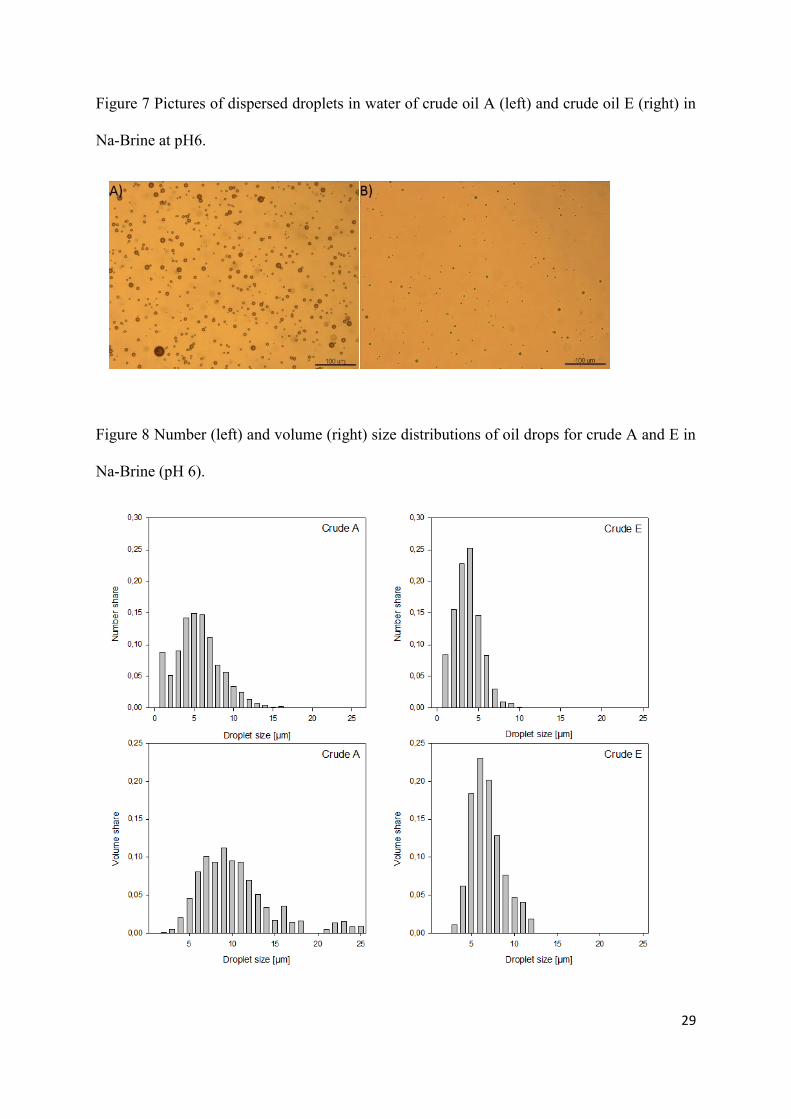
Representative microscopy pictures of selected produced water samples are shown in Figure
7. The produced water sample prepared from the heavy crude oil A (Figure 7A) contained more
and larger drops than the sample produced from the light crude oil E (Figure 7B). This also
represented the major difference between the produced water samples from the heavy and light
crude oils.
The corresponding drop size distributions are shown in Figure 8. The drop size distribution
in the synthetic produced water from the crude oil A was broad. Even though the overall
number of drops bigger than 10 µm is low (less than 10% of the total number of detected drops),
they had a considerable contribution in the volume distribution (ca. 50%). The water samples
produced with crude oil E had a narrower size distribution, where the great majority of drops
(number-wise, more than 70%) were smaller or equal to 5 µm. Furthermore, the volume
contribution of drops larger than 10 µm was negligible. The increased polydispersity in the
emulsions, when the viscosity of the dispersed phase was higher, agreed with other reports20,
46, even though the measurements were done subsequent to two hours of gravity separation.
When the viscosity of the dispersed phase increases, the drop breakage regime may shift from
bursting to stretching, which may lead to broadening of the size distribution46, observed in this

16
study. Additionally, the increased content of polar components in the oils A and C could have
played a role in the stabilization of larger crude oil droplets in the water phase.
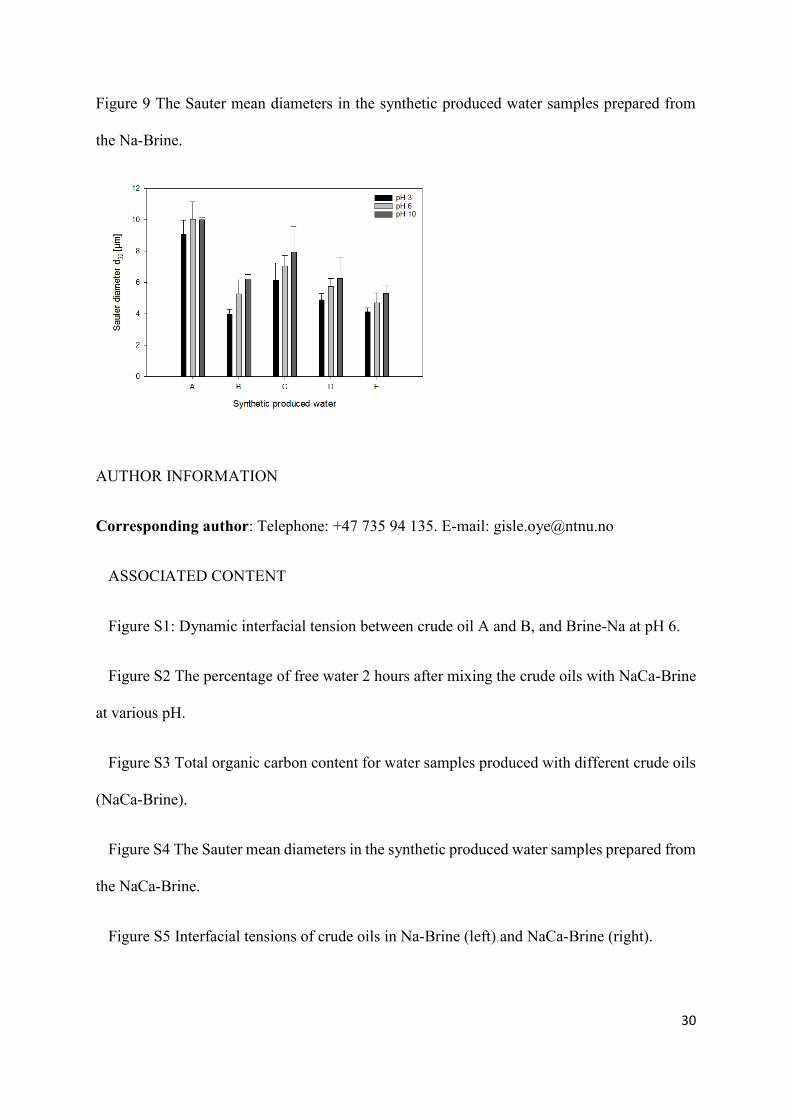
The Sauter mean diameters of the oil drops were generally lowest in the synthetic produced
water at low pH and increased with pH, as seen in Figure 9. This trend was less clear for the
samples prepared with the NaCa-Brine (Figure S4 in Supporting Information). The average
Sauter diameter of drops in the produced water from the heaviest crude oils (A and C) was 20-
50% larger than for the samples prepared with the light oils. Higher creaming velocity of drops
created with the light crude oils (due to the higher density difference between the dispersed and
continuous phases) could have contributed to that difference. Furthermore, as mentioned
previously, at higher pH levels naphthenic acids are deprotonated and govern the interfacial
activity of the crude oils, resulting in significantly lower values of IFT (Figure S5 in Supporting
Information). The less clear trend with NaCa-Brine could be further evidence for the role of
calcium in the interfacial film rigidity. Samples with calcium in most samples experienced a
drop of the Sauter mean diameter between pH 6 and 10. Moreover, when comparing the Sauter
mean diameter values between brines at pH 10, for most of the oils one could notice smaller
droplets, when calcium was in the system. Possibly, the accumulation of the hydrophobic
complexes of calcium at the oil/water interface negatively influenced the coalescence, resulting
in smaller sized drops.
Conclusions
17
The influence of the properties of crude oils and water composition on the synthetic produced
water quality was studied. The quality of the synthetic produced water samples was highly
dependent on the composition and the properties of the crude oils. The light crude oils gave
higher water quality in terms of the total oil concentration, even though the amount of free
water obtained from the samples was significantly lower. Additionally, the initial pH was of
importance to the properties of the synthetic produced water. The amount of free water was
lowest at low pH and increased with the pH. What is more, the size of the emulsified droplets
increased with the initial pH of the brines. The effect of calcium was mostly seen at the highest
pH, where it created complexes with dissociated naphthenic acid molecules and stabilized
emulsions. The results indicated the complexity of the crude oil emulsions and the severity of
the separation issues that may occur during the produced water treatment. The interfacially
active components found in the crudes may experience different behavior, e.g. increased water
solubility or interfacial rigidity that can affect phenomena such as creaming or coalescence and
in the end lead to differences in the quality of the produced water.
Acknowledgements
This work was carried out as a part of SUBPRO, a Research-based Innovation Centre within
Subsea Production and Processing. The authors gratefully acknowledge the financial support
from SUBPRO, which is financed by the Research Council of Norway, NTNU and major
industrial partners (ABB, Aker Solutions, DNV GL, ENGIE, Lundin, Shell and Statoil). We
additionally thank ENGIE, Shell and Statoil for providing us with crude oil samples.
18
References
1. Fakhru'l-Razi, A.; Pendashteh, A.; Abdullah, L. C.; Biak, D. R.; Madaeni, S. S.; Abidin,
Z. Z., Review of technologies for oil and gas produced water treatment. J Hazard Mater 2009,
170 (2-3), 530-51.
2. Igunnu, E. T.; Chen, G. Z., Produced water treatment technologies. International
Journal of Low-Carbon Technologies 2014, 9 (3), 157-177.
3. Muggeridge, A.; Cockin, A.; Webb, K.; Frampton, H.; Collins, I.; Moulds, T.; Salino,
P., Recovery rates, enhanced oil recovery and technological limits. Philosophical Transactions
of the Royal Society A: Mathematical, Physical and Engineering Sciences 2014, 372 (2006).
4. Paige, R. W., Sweeney, F.M., Produced Water Re-Injection: Understanding the
Problems. In Water Management Offshore Conference, Aberdeen, 1993.
5. Arthur, J. D.; Langhus, B. G.; Patel, C. Technical Summary of Oil & Gas Produced
Water Treatment Technologies; ALL Consulting, LLC.: 2005.
6. Technical Assessment of Produced Water Treatment Technologies; Colorado School of
Mines: Golden, CO, 2009.
7. Rawlins, C. H., Flotation of Fine Oil Droplets in Petroleum Production Circuits. Recent
Advances in Mineral Processing Plant Design 2009, 232.
8. Saththasivam, J.; Loganathan, K.; Sarp, S., An overview of oil–water separation using
gas flotation systems. Chemosphere 2016, 144, 671-680.
9. Hansen, B. R.; Davies, S. H., Review of potential technologies for the removal of
dissolved components from produced water. Chemical Engineering Research and Design
1994, 72 (A2), 176-188.
19
10. Dastgheib, S. A.; Knutson, C.; Yang, Y.; Salih, H. H., Treatment of produced water
from an oilfield and selected coal mines in the Illinois Basin. International Journal of
Greenhouse Gas Control 2016, 54, Part 2, 513-523.
11. Li, Y. S.; Yan, L.; Xiang, C. B.; Hong, L. J., Treatment of oily wastewater by organic–
inorganic composite tubular ultrafiltration (UF) membranes. Desalination 2006, 196 (1), 76-
83.
12. Xu, P.; Drewes, J. E., Viability of nanofiltration and ultra-low pressure reverse osmosis
membranes for multi-beneficial use of methane produced water. Separation and Purification
Technology 2006, 52 (1), 67-76.
13. Piemonte, V.; Prisciandaro, M.; Mascis, L.; Di Paola, L.; Barba, D., Reverse osmosis
membranes for treatment of produced water: a process analysis. Desalination and Water
Treatment 2015, 55 (3), 565-574.
14. Berdugo-Clavijo, C.; Gieg, L. M., Conversion of crude oil to methane by a microbial
consortium enriched from oil reservoir production waters. Frontiers in Microbiology 2014, 5
(197).
15. Veil, J. A.; Puder, M. G.; Elcock, D.; Redweik, R. J., Jr. A white paper describing
produced water from production of crude oil, natural gas, and coal bed methane; Argonne
National Laboratory for the U.S. Department of Energy, National Energy Technology
Laboratory: 2004.
16. Dickhout, J. M.; Moreno, J.; Biesheuvel, P. M.; Boels, L.; Lammertink, R. G. H.; de
Vos, W. M., Produced water treatment by membranes: A review from a colloidal perspective.
Journal of Colloid and Interface Science 2017, 487, 523-534.

20
17. Sjöblom, J.; Aske, N.; Harald Auflem, I.; Brandal, Ø.; Erik Havre, T.; Sæther, Ø.;
Westvik, A.; Eng Johnsen, E.; Kallevik, H., Our current understanding of water-in-crude oil
emulsions.: Recent characterization techniques and high pressure performance. Advances in
Colloid and Interface Science 2003, 100–102, 399-473.
18. Zolfaghari, R.; Fakhru’l-Razi, A.; Abdullah, L. C.; Elnashaie, S. S. E. H.; Pendashteh,
A., Demulsification techniques of water-in-oil and oil-in-water emulsions in petroleum
industry. Separation and Purification Technology 2016, 170, 377-407.
19. Gaweł, B.; Lesaint, C.; Bandyopadhyay, S.; Øye, G., Role of Physicochemical and
Interfacial Properties on the Binary Coalescence of Crude Oil Drops in Synthetic Produced
Water. Energy & Fuels 2015, 29 (2), 512-519.
20. Silset, A.; Flåten, G. R.; Helness, H.; Melin, E.; Øye, G.; Sjöblom, J., A Multivariate
Analysis on the Influence of Indigenous Crude Oil Components on the Quality of Produced
Water. Comparison Between Bench and Rig Scale Experiments. Journal of Dispersion Science
and Technology 2010, 31 (3), 392-408.
21. Poteau, S.; Argillier, J.-F.; Langevin, D.; Pincet, F.; Perez, E., Influence of pH on
Stability and Dynamic Properties of Asphaltenes and Other Amphiphilic Molecules at the
Oil−Water Interface†. Energy & Fuels 2005, 19 (4), 1337-1341.
22. Faksness, L.-G.; Grini, P. G.; Daling, P. S., Partitioning of semi-soluble organic
compounds between the water phase and oil droplets in produced water. Marine Pollution
Bulletin 2004, 48 (7–8), 731-742.
23. Stanford, L. A.; Kim, S.; Klein, G. C.; Smith, D. F.; Rodgers, R. P.; Marshall, A. G.,
Identification of Water-Soluble Heavy Crude Oil Organic-Acids, Bases, and Neutrals by
Electrospray Ionization and Field Desorption Ionization Fourier Transform Ion Cyclotron

21
Resonance Mass Spectrometry. Environmental Science & Technology 2007, 41 (8), 2696-
2702.
24. Hutin, A.; Argillier, J.-F.; Langevin, D., Mass Transfer between Crude Oil and Water.
Part 1: Effect of Oil Components. Energy & Fuels 2014, 28 (12), 7331-7336.
25. Eftekhardadkhah, M.; Øye, G., Induction and Coverage Times for Crude Oil Droplets
Spreading on Air Bubbles. Environmental Science & Technology 2013, 47 (24), 14154-14160.
26. Eftekhardadkhah, M.; Aanesen, S. V.; Rabe, K.; Øye, G., Oil Removal from Produced
Water during Laboratory- and Pilot-Scale Gas Flotation: The Influence of Interfacial
Adsorption and Induction Times. Energy & Fuels 2015, 29 (11), 7734-7740.
27. Havre, T. E.; Sjöblom, J.; Vindstad, J. E., Oil/Water‐Partitioning and Interfacial
Behavior of Naphthenic Acids. Journal of Dispersion Science and Technology 2003, 24 (6),
789-801.
28. Hutin, A.; Argillier, J.-F.; Langevin, D., Influence of pH on Oil-Water Interfacial
Tension and Mass Transfer for Asphaltenes Model Oils. Comparison with Crude Oil Behavior.
Oil Gas Sci. Technol. – Rev. IFP Energies nouvelles 2016, 71 (4), 58.
29. Nour, A. H., Yunus R. M., Stability Investigation of Water-in-Crude Oil Emulsion.
Journal of Applied Sciences 2006, 6 (14), 6.
30. Brandal, Ø.; Hanneseth, A. M. D.; Hemmingsen, P. V.; Sjöblom, J.; Kim, S.; Rodgers,
R. P.; Marshall, A. G., Isolation and Characterization of Naphthenic Acids from a Metal
Naphthenate Deposit: Molecular Properties at Oil‐Water and Air‐Water Interfaces. Journal of
Dispersion Science and Technology 2006, 27 (3), 295-305.
22
31. ASTM D664-95 Standard Test Method for Acid Number of Petroleum Products by
Potentiometric Titration. ASTM International: West Conshohocken, PA, 2001.
32. Dubey, S. T.; Doe, P. H., Base Number and Wetting Properties of Crude Oils. 1993.
33. Gaweł, B.; Eftekhardadkhah, M.; Øye, G., Elemental Composition and Fourier
Transform Infrared Spectroscopy Analysis of Crude Oils and Their Fractions. Energy & Fuels
2014, 28 (2), 997-1003.
34. Hannisdal, A.; Hemmingsen, P. V.; Sjöblom, J., Group-Type Analysis of Heavy Crude
Oils Using Vibrational Spectroscopy in Combination with Multivariate Analysis. Industrial &
Engineering Chemistry Research 2005, 44 (5), 1349-1357.
35. Produced Water: Technological/Environmental Issues and Solutions. Springer US:
1992; Vol. 46, p 632.
36. Tichelkamp, T.; Teigen, E.; Nourani, M.; Øye, G., Systematic study of the effect of
electrolyte composition on interfacial tensions between surfactant solutions and crude oils.
Chemical Engineering Science 2015, 132, 244-249.
37. Farooq, U.; Simon, S.; Tweheyo, M. T.; Øye, G.; Sjöblom, J., Interfacial Tension
Measurements Between Oil Fractions of a Crude Oil and Aqueous Solutions with Different
Ionic Composition and pH. Journal of Dispersion Science and Technology 2013, 34 (5), 701-
708.
38. Langevin, D.; Argillier, J.-F., Interfacial behavior of asphaltenes. Advances in Colloid
and Interface Science 2016, 233, 83-93.

23
39. Eftekhardadkhah, M.; Øye, G., Correlations between crude oil composition and
produced water quality: A multivariate analysis approach. Industrial and Engineering
Chemistry Research 2013, 52 (48), 17315-17321.
40. Spiecker, P. M.; Gawrys, K. L.; Kilpatrick, P. K., Aggregation and solubility behavior
of asphaltenes and their subfractions. Journal of Colloid and Interface Science 2003, 267 (1),
178-193.
41. Stockwell, A.; Taylor, A. S.; Thompson, D. G., The Rheological Properties of Water-
in-Crude-Oil Emulsions. In Surfactants in Solution: Volume 6, Mittal, K. L.; Bothorel, P., Eds.
Springer US: Boston, MA, 1986; pp 1617-1632.
42. Arla, D.; Flesisnki, L.; Bouriat, P.; Dicharry, C., Influence of Alkaline pH on the
Rheology of Water/Acidic Crude Oil Interface. Energy & Fuels 2011, 25 (3), 1118-1126.
43. Brandal, Ø.; Sjöblom, J., Interfacial Behavior of Naphthenic Acids and Multivalent
Cations in Systems with Oil and Water. II: Formation and Stability of Metal Naphthenate Films
at Oil‐Water Interfaces. Journal of Dispersion Science and Technology 2005, 26 (1), 53-58.
44. Clark, P. E.; Pilehvari, A., Characterization of crude oil-in-water emulsions. Journal of
Petroleum Science and Engineering 1993, 9 (3), 165-181.
45. Eftekhardadkhah, M.; Kløcker, K. N.; Trapnes, H. H.; Gaweł, B.; Øye, G., Composition
and Dynamic Adsorption of Crude Oil Components Dissolved in Synthetic Produced Water at
Different pH Values. Industrial & Engineering Chemistry Research 2016, 55 (11), 3084-3090.
46. Calabrese, R. V.; Chang, T. P. K.; Dang, P. T., Drop breakup in turbulent stirred-tank
contactors. Part I: Effect of dispersed-phase viscosity. AIChE Journal 1986, 32 (4), 657-666.

24
Legend of Tables and Figures
Table 1: Physicochemical properties and composition of crude oils
Table 2: The amount of recovered water after mixing crude oils and brines at pH 10.
Figure 1: C/H atomic ratio of the crude oils and their fractions.
Figure 2: Nitrogen (A), oxygen (B) and sulphur (C) content in complete crude oils and SARA
fractions.
Figure 3: The percentage of free water 2 hours after mixing the crude oils with Na-Brine at
various pH.
Figure 4: Total organic carbon content for water samples produced with different crude oils
(NaCa-Brine).
Figure 5: pH of the synthetic produced water prepared using Na-Brine. The dotted lines indicate
the initial pH of the brine.
Figure 6: Total oil concentration in the synthetic produced water samples prepared using NaCa-
Brine.
Figure 7: Pictures of dispersed droplets in water of crude oil A (left) and crude oil E (right) in
Na-Brine at pH6.
Figure 8: Number (left) and volume (right) size distributions of oil drops for crude A and E in
Na-Brine (pH 6).
Figure 9: The Sauter mean diameters in the synthetic produced water samples prepared from
the Na-Brine.

25
TABLES
Table 1: Physicochemical properties and composition of crude oils
Crude oil A B C D E
API gravity [°] 19.2 35.8 23.0 36.3 37.9
Density at 20°C [g/cm3] 0.935 0.841 0.911 0.839 0.831
Viscosity at 20°C [mPa*s] 354.4 14.2 74.4 10.3 8.3
TAN [mg KOH/g oil] 2.2 <0.1 2.7 0.2 0.5
TBN [mg KOH/g oil] 2.8 1.0 1.1 1.1 0.4
SA
RA
Saturates [% (w/w)] 50.6 84.0 64.9 71.5 74.8
Aromatics [% (w/w)] 31.2 13.4 26.3 23.1 23.2
Resins [% (w/w)] 15.7 2.3 8.4 5.1 1.9
Asphaltenes [% (w/w)] 2.5 0.3 0.4 0.3 0.1
Water content [ppm] 590.9 85.4 535.8 202.4 333.4
IFT
[mN/m]
Na-Brine (pH 6) 20.4 ±0.6 20.5 ±0.2 22.2 ±0.6 19.0 ±0.5 19.9 ±0.1
NaCa-Brine (pH 6) 18.6 ±0.8 19.9 ±0.2 18.9 ±0.7 16.2 ±0.4 17.4 ±0.4
Table 2: The amount of recovered water after mixing crude oils and brines at pH 10.
Recovered water [%]
A B C D E
Bri
ne Na 83.3% ±4.7% 70.0% ±0% 66.7% ±4.7% 56.7% ±9.4% 70.0% ±16.3%
NaCa 76.7% ±4.7% 56.7% ±17% 43.3% ±4.7% 46.7% ±9.4% 46.7% ±12.5%

26
FIGURES
Figure 1: C/H atomic ratio of the crude oils and their fractions.
Figure 2: Nitrogen (A), oxygen (B) and sulphur (C) content in complete crude oils and SARA
fractions.

27
Figure 3: The percentage of free water 2 hours after mixing the crude oils with Na-Brine at
various pH.
Figure 4: Total organic carbon content for water samples produced with different crude oils
(NaCa-Brine).
28
Figure 5 pH of the synthetic produced water prepared using Na-Brine. The dotted lines indicate
the initial pH of the brine.
Figure 6 Total oil concentration in the synthetic produced water samples prepared using NaCa-
Brine.
29
Figure 7 Pictures of dispersed droplets in water of crude oil A (left) and crude oil E (right) in
Na-Brine at pH6.
Figure 8 Number (left) and volume (right) size distributions of oil drops for crude A and E in
Na-Brine (pH 6).
30
Figure 9 The Sauter mean diameters in the synthetic produced water samples prepared from
the Na-Brine.
AUTHOR INFORMATION
Corresponding author: Telephone: +47 735 94 135. E-mail: [email protected]
ASSOCIATED CONTENT
Figure S1: Dynamic interfacial tension between crude oil A and B, and Brine-Na at pH 6.
Figure S2 The percentage of free water 2 hours after mixing the crude oils with NaCa-Brine
at various pH.
Figure S3 Total organic carbon content for water samples produced with different crude oils
(NaCa-Brine).
Figure S4 The Sauter mean diameters in the synthetic produced water samples prepared from
the NaCa-Brine.
Figure S5 Interfacial tensions of crude oils in Na-Brine (left) and NaCa-Brine (right).