Embed Size (px)
Citation preview
Journal of Agricultural Technology 2012, Vol. 8(2): 443-452
443
Crop planning in relation to climate change in rain fed regions Bhale Vilas M.1*, Tupe Arvind R.1, Karmore Jayashri, V.1 and Kale Manoj A.2 1Department of Agronomy, Dr. PDKV, Akola-444 101 (MS), India, 2Department of Land and Water Resources Engineering, Royal Institute of Technology (KTH), Teknikringen 76, SE-100 44 Stockholm, Sweden Bhale Vilas M., Tupe Arvind R., Karmore Jayashri V. and Kale Manoj A. (2012) Crop planning in relation to climate change in rain fed regions. Journal of Agricultural Technology 8(2): 443-452. Uncertainty and variability of rains both space and time is the major constraints affecting agricultural production in rain fed farming. Scientific study on the quantum and distribution of rainfall would enable to farming community and researcher to adjust or modify the cropping pattern as well as the cultural operation to utilize the actual moisture available in the field for profitable crop production. The daily rainfall data for last 39 year were analyzed to study its variability and probability. In rain fed farming rainfall is the primary and most important factor affecting productivity and it is mostly uncertain and erratic. Thus, the change in the rainfall pattern and amount suggests adjusting or modifying the cropping pattern and cultural practices of agricultural crops in the region for achieving the sustainable productivity. Under short break of monsoon, repeated hoeing to prevent soil moisture loss and under long dry spell, agronomic management like mulching, relay cropping or re-sowing are advocated. Key words: rainfall variability, dry spell, CDS, crop planning: India Introduction
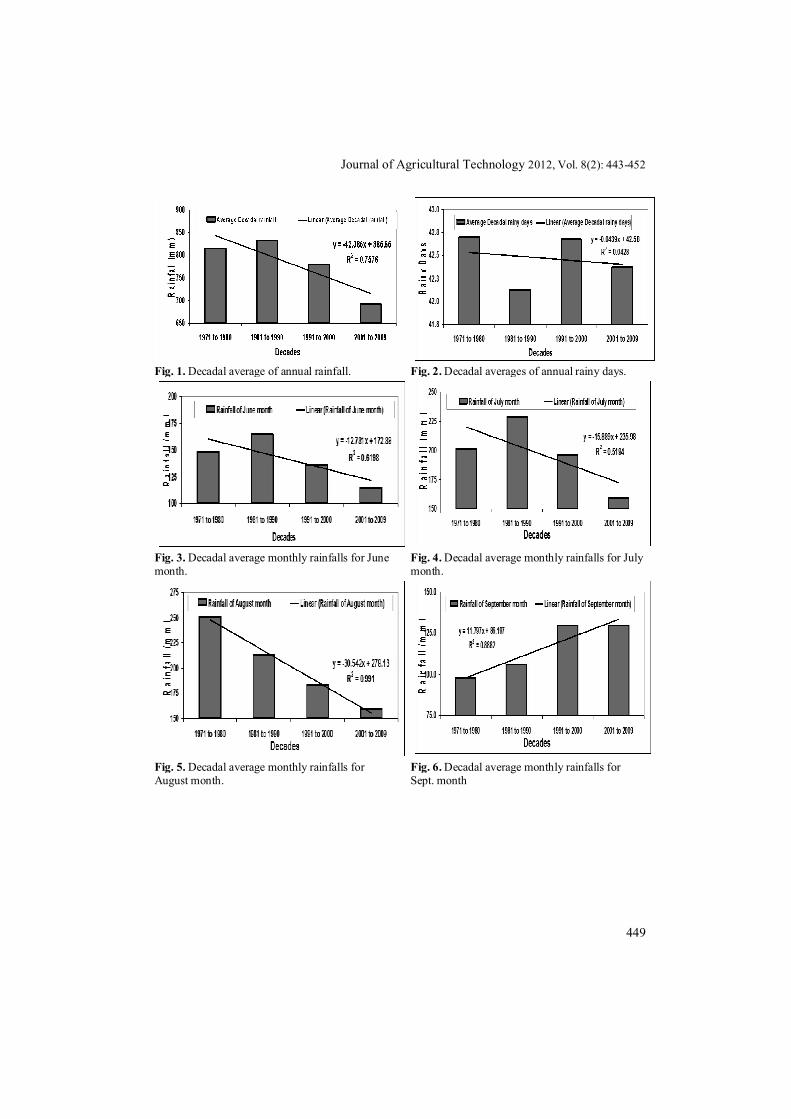
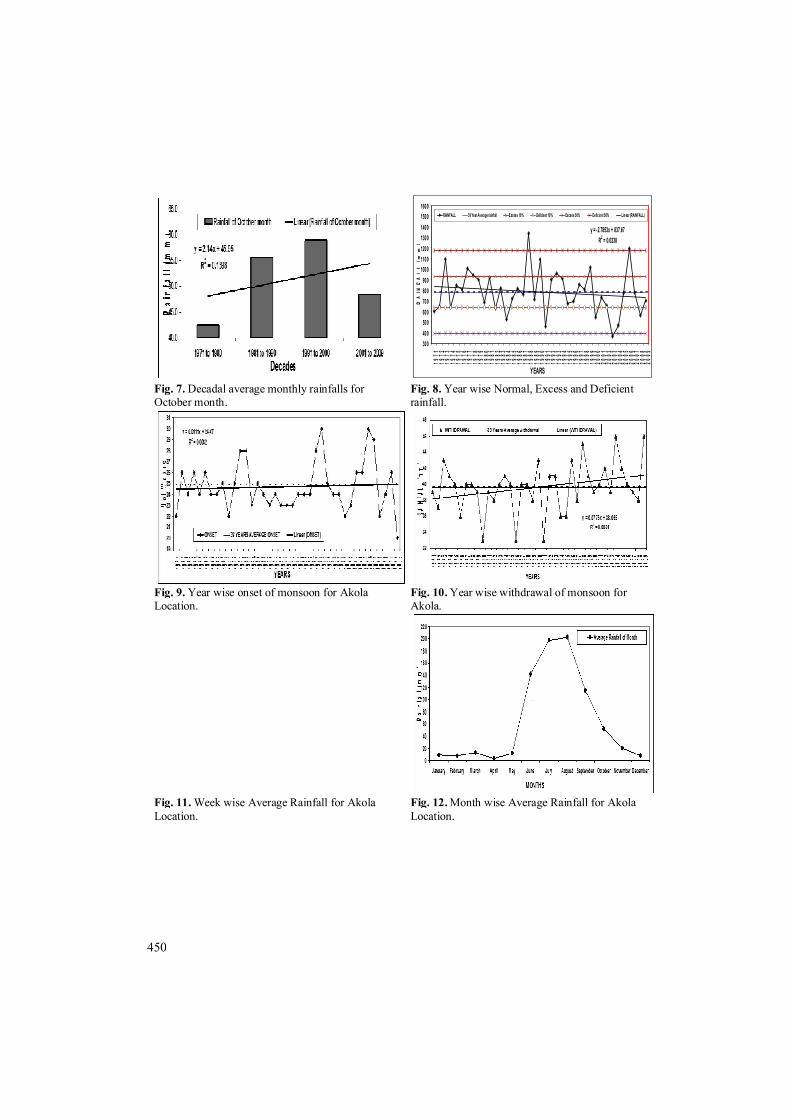
Amount, distribution and intensity of rainfall mainly determine the choice of any particular crop and agronomic practices in the rain fed agriculture. Study indicated that the mean annual rainfall for Akola location was 782 mm in 42 rainy days with 26 percent variability. More than 50 % of the years were observed to have less than normal rains and linear trend showed a decline trend in respect of annual rainfall. Decadal analysis of monthly rainfall shows curtailment in amount of rainfall in June, July and August while increasing in September and October month clearly indicates change in amount and pattern of rainfall. The annual rainfall received was based on the IMD specifications as Normal (particular year that received ± 19 per cent of mean annual rainfall), Excess (Year that received more than 19 per cent of mean annual rainfall) and
* Corresponding author: Bhale Vilas M; e-mail: [email protected]
Journal of Agricultural Technology 2012 Vol. 8(2): 443-452 Available online http://www.ijat-aatsea.com
ISSN 1686-9141
444
Deficit (Year that received less than 19 per cent of the mean annual rainfall). An early recognition of risk and implementation of adaptation strategies is crucial as anticipatory and precautionary adaptation is more effective and less costly than forced, last minute, emergency adaptation or retrofitting (Eitzinger et al., 2007). Hence, a study of rainfall pattern was undertaken at Akola to understand the rainfall variability so as to identify suitable crops and varieties for early normal and later commencement of sowing rains. It could also help to identify and match intercropping system with the rain fed pattern and to determine optimum sowing period for different crops and cropping system. Materials and methods
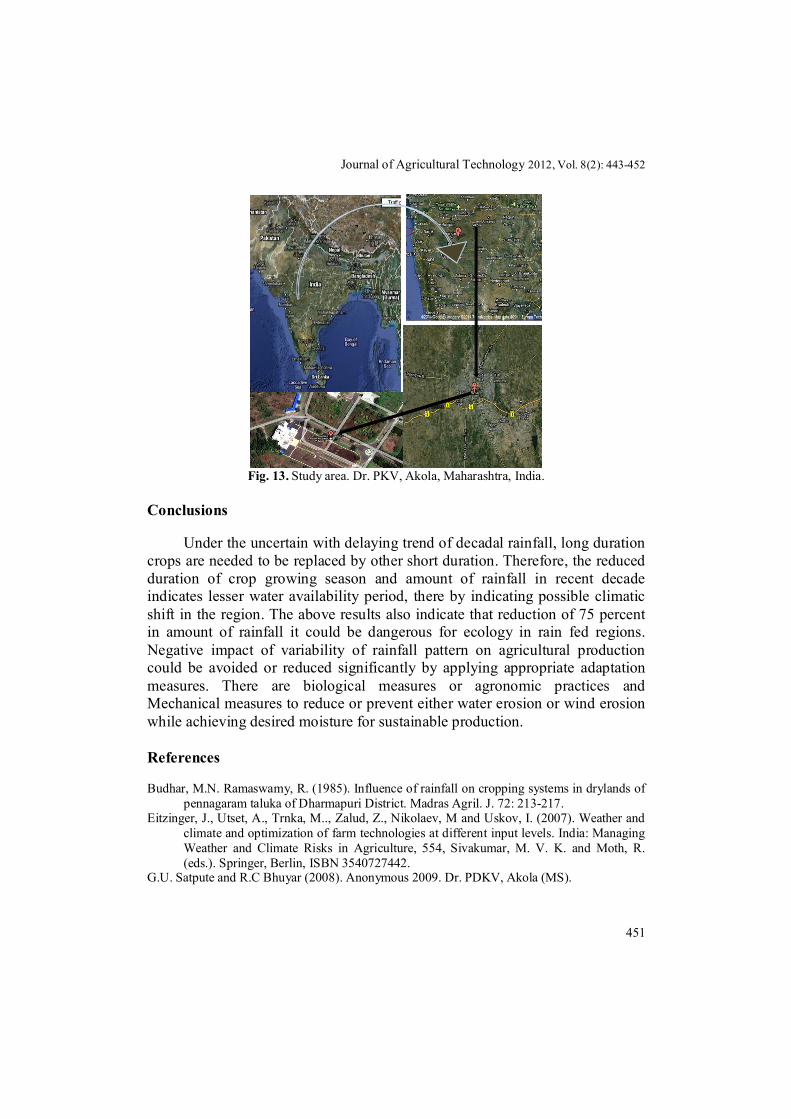
Daily rainfall data for 39 years (1971-2009) from Agromet observatory located at Gudhadhi block, Dr. Panjabrao Deshmukh Krishi Vidyapeeth, Akola (20o 42’ N latitude, 77o 02’ E longitude an and altitude 282 meter (MSL)) were used for analysis of variability . The data were aggregated to weekly and annual totals and also for the mean rainfall, standard deviation and coefficient of variation for annual period were worked out as reported by Kulandaivelu et al. (1979 and 1980), Budhar and Ramasamy (1985) and P. Parasuraman et al. (2002). The annual rainfall received was classified based on the IMD specifications as
Normal (particular year that received ± 19 per cent of mean annual rainfall), Excess (Year that received more than 19 per cent of mean annual rainfall) and Deficit (Year that received less than 19 per cent of the mean annual rainfall).
As suggested by Dr. Pawade (1981) the critical value for Amravati station was considered as 10 days. Subsequent critical dry spells are also defined in a similar fashion. Critical dry spells were worked out as reported by Satpute et al (Anonymous 2008). Probable distribution of dry spells during rainy season will help for crop planning in rainfed region. To minimize the risk of dry spells during crop growing period, suitable crop sowing time can be identified and proper crop planning was based on the findings.
Classified based on the IMD specifications ± 19 =Actual (Rainfall) – Normal (Rainfall)
Normal (Rainfall) × 100

Journal of Agricultural Technology 2012, Vol. 8(2): 443-452
445
Results and discussions Trends of rainfall variation
The rainfall showed a decreasing trend in annual (Y = -2.7853x + 837.67) R2 = 0.0238. Therefore, the annual trend analysis of over past 39 years reflects that a considerable decreasing trend. It is observed from Table 1 that earliest onset of monsoon is on 20th week (in 2009) while late onset is on 30th MW (in 2004) and on an average Southwest monsoon starts on 25th MW. It could be observed that there are variation in normal date of onset and withdrawal of monsoon in Akola and monsoon having 2 to 3 critical dry spells.
Table 1. Variability in onset and withdrawal of monsoon for Year 1971 to 2009
Onset of Monsoon Withdrawal of Monsoon
Earliest Late Mean Earliest Late Mean 20th M.W 30th M.W 25th M.W 33rd M.W 46th M.W 40th M.W
While in case of withdrawal of rainfall it early ceases as early as on 33rd
MW (in 1981, 1986 and 1991) while it could be remain up to 46th MW (in 2004) on an average withdrawal of monsoon is on 40th MW.
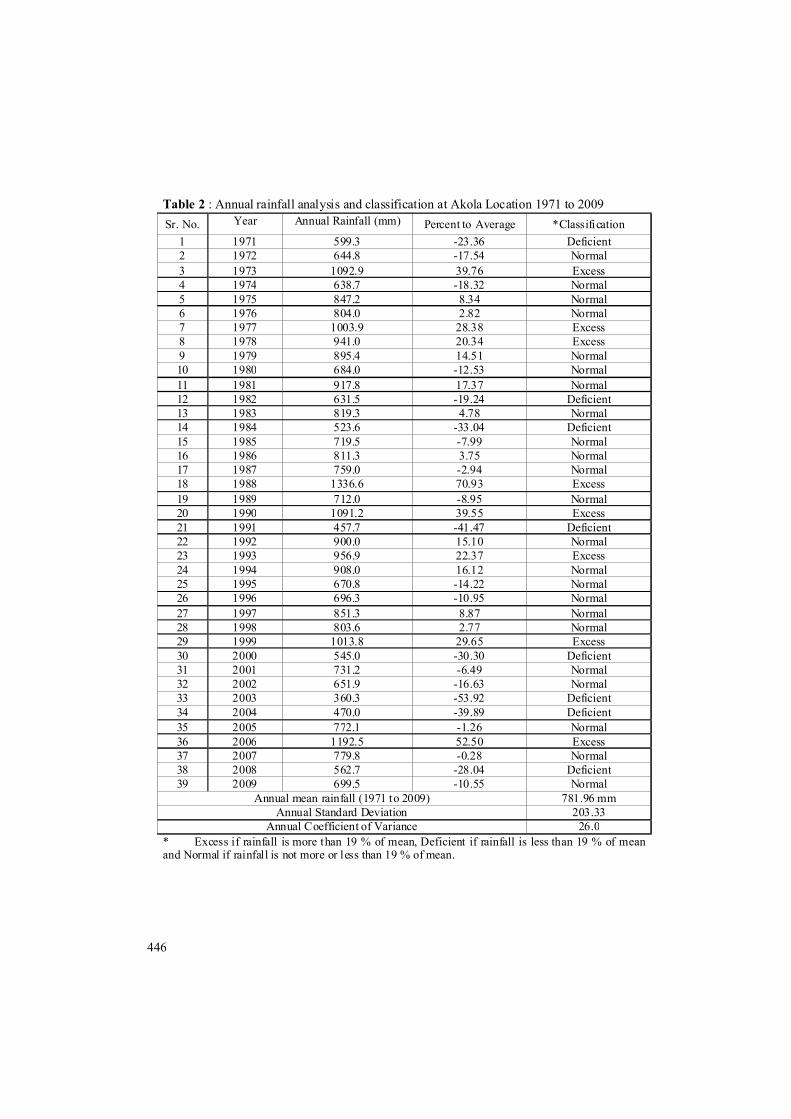
The data on mean annual rainfall, coefficient of variation, probability and its classification are given in table 2. The mean annual rainfall was 782 mm with coefficient variation of 26 per cent. Out of 39 years of study, the rainfall was normal for 23 years and for another 8 years was deficit and for the remaining eight years it was excess (Parasuraman and Suresh, 2002).
446
Table 2 : Annual rainfall analysis and classification at Akola Location 1971 to 2009 Sr. No. Year Annual Rainfall (mm) Percent to Average *Classification
1 1971 599.3 -23.36 Deficient 2 1972 644.8 -17.54 Normal 3 1973 1092.9 39.76 Excess 4 1974 638.7 -18.32 Normal 5 1975 847.2 8.34 Normal 6 1976 804.0 2.82 Normal 7 1977 1003.9 28.38 Excess 8 1978 941.0 20.34 Excess 9 1979 895.4 14.51 Normal 10 1980 684.0 -12.53 Normal 11 1981 917.8 17.37 Normal 12 1982 631.5 -19.24 Deficient 13 1983 819.3 4.78 Normal 14 1984 523.6 -33.04 Deficient 15 1985 719.5 -7.99 Normal 16 1986 811.3 3.75 Normal 17 1987 759.0 -2.94 Normal 18 1988 1336.6 70.93 Excess 19 1989 712.0 -8.95 Normal 20 1990 1091.2 39.55 Excess 21 1991 457.7 -41.47 Deficient 22 1992 900.0 15.10 Normal 23 1993 956.9 22.37 Excess 24 1994 908.0 16.12 Normal 25 1995 670.8 -14.22 Normal 26 1996 696.3 -10.95 Normal 27 1997 851.3 8.87 Normal 28 1998 803.6 2.77 Normal 29 1999 1013.8 29.65 Excess 30 2000 545.0 -30.30 Deficient 31 2001 731.2 -6.49 Normal 32 2002 651.9 -16.63 Normal 33 2003 360.3 -53.92 Deficient 34 2004 470.0 -39.89 Deficient 35 2005 772.1 -1.26 Normal 36 2006 1192.5 52.50 Excess 37 2007 779.8 -0.28 Normal 38 2008 562.7 -28.04 Deficient 39 2009 699.5 -10.55 Normal
Annual mean rainfall (1971 to 2009) 781.96 mm Annual Standard Deviation 203.33
Annual Coefficient of Variance 26.0 * Excess if rainfall is more than 19 % of mean, Deficient if rainfall is less than 19 % of mean and Normal if rainfall is not more or less than 19 % of mean.
Journal of Agricultural Technology 2012, Vol. 8(2): 443-452
447
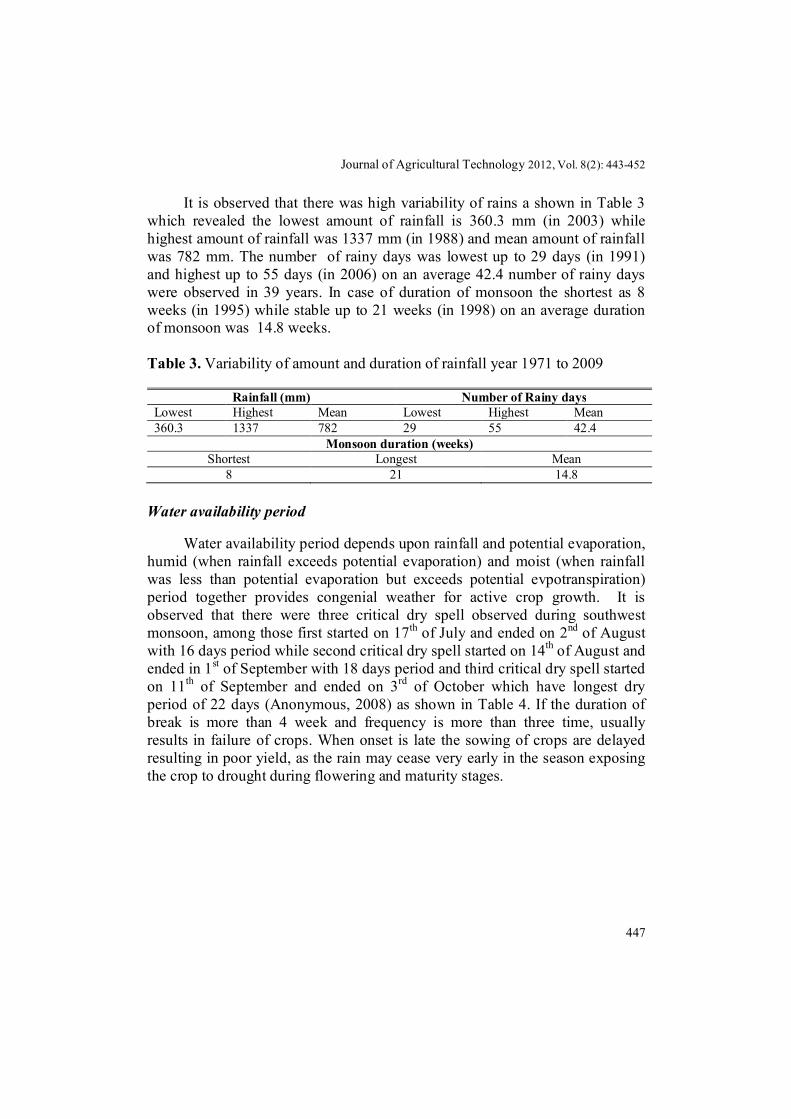
It is observed that there was high variability of rains a shown in Table 3 which revealed the lowest amount of rainfall is 360.3 mm (in 2003) while highest amount of rainfall was 1337 mm (in 1988) and mean amount of rainfall was 782 mm. The number of rainy days was lowest up to 29 days (in 1991) and highest up to 55 days (in 2006) on an average 42.4 number of rainy days were observed in 39 years. In case of duration of monsoon the shortest as 8 weeks (in 1995) while stable up to 21 weeks (in 1998) on an average duration of monsoon was 14.8 weeks.
Table 3. Variability of amount and duration of rainfall year 1971 to 2009
Rainfall (mm) Number of Rainy days Lowest Highest Mean Lowest Highest Mean 360.3 1337 782 29 55 42.4
Monsoon duration (weeks) Shortest Longest Mean
8 21 14.8
Water availability period
Water availability period depends upon rainfall and potential evaporation, humid (when rainfall exceeds potential evaporation) and moist (when rainfall was less than potential evaporation but exceeds potential evpotranspiration) period together provides congenial weather for active crop growth. It is observed that there were three critical dry spell observed during southwest monsoon, among those first started on 17th of July and ended on 2nd of August with 16 days period while second critical dry spell started on 14th of August and ended in 1st of September with 18 days period and third critical dry spell started on 11th of September and ended on 3rd of October which have longest dry period of 22 days (Anonymous, 2008) as shown in Table 4. If the duration of break is more than 4 week and frequency is more than three time, usually results in failure of crops. When onset is late the sowing of crops are delayed resulting in poor yield, as the rain may cease very early in the season exposing the crop to drought during flowering and maturity stages.
448
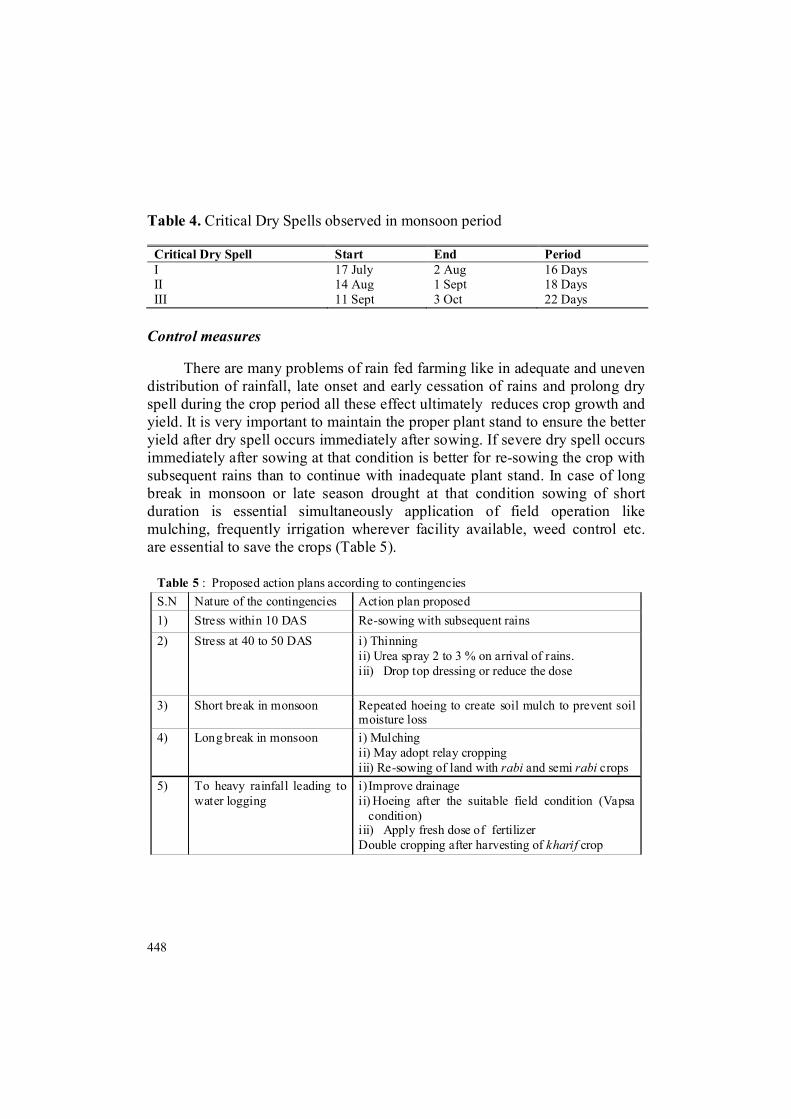
Table 4. Critical Dry Spells observed in monsoon period
Critical Dry Spell Start End Period I 17 July 2 Aug 16 Days II 14 Aug 1 Sept 18 Days III 11 Sept 3 Oct 22 Days
Control measures
There are many problems of rain fed farming like in adequate and uneven distribution of rainfall, late onset and early cessation of rains and prolong dry spell during the crop period all these effect ultimately reduces crop growth and yield. It is very important to maintain the proper plant stand to ensure the better yield after dry spell occurs immediately after sowing. If severe dry spell occurs immediately after sowing at that condition is better for re-sowing the crop with subsequent rains than to continue with inadequate plant stand. In case of long break in monsoon or late season drought at that condition sowing of short duration is essential simultaneously application of field operation like mulching, frequently irrigation wherever facility available, weed control etc. are essential to save the crops (Table 5).
Table 5 : Proposed action plans according to contingencies S.N Nature of the contingencies Action plan proposed 1) Stress within 10 DAS Re-sowing with subsequent rains 2) Stress at 40 to 50 DAS i) Thinning
ii) Urea spray 2 to 3 % on arrival of rains. iii) Drop top dressing or reduce the dose
3) Short break in monsoon Repeated hoeing to create soil mulch to prevent soil moisture loss
4) Long break in monsoon i) Mulching ii) May adopt relay cropping iii) Re-sowing of land with rabi and semi rabi crops
5) To heavy rainfall leading to water logging
i) Improve drainage ii) Hoeing after the suitable field condition (Vapsa
condition) iii) Apply fresh dose of fertilizer Double cropping after harvesting of kharif crop
Journal of Agricultural Technology 2012, Vol. 8(2): 443-452
449
Fig. 1. Decadal average of annual rainfall. Fig. 2. Decadal averages of annual rainy days.
Fig. 3. Decadal average monthly rainfalls for June month.
Fig. 4. Decadal average monthly rainfalls for July month.
Fig. 5. Decadal average monthly rainfalls for August month.
Fig. 6. Decadal average monthly rainfalls for Sept. month
450
Fig. 7. Decadal average monthly rainfalls for October month.
Fig. 8. Year wise Normal, Excess and Deficient rainfall.
Fig. 9. Year wise onset of monsoon for Akola Location.
Fig. 10. Year wise withdrawal of monsoon for Akola.
Fig. 11. Week wise Average Rainfall for Akola Location.
Fig. 12. Month wise Average Rainfall for Akola Location.
y = -2.7853x + 837.67R2 = 0.0238
300400500600700800900
1000110012001300140015001600
1971
1972
1973
1974
1975
1976
1977
1978
1979
1980
1981
1982
1983
1984
1985
1986
1987
1988
1989
1990
1991
1992
1993
1994
1995
1996
1997
1998
1999
2000
2001
2002
2003
2004
2005
2006
2007
2008
2009
YEARS
RA
INFA
LL (m
m)
RAINFALL 39 Year Average rainfall Excess 19% Deficient 19% Excess 50% Deficient 50% Linear (RAINFALL)
Journal of Agricultural Technology 2012, Vol. 8(2): 443-452
451
Fig. 13. Study area. Dr. PKV, Akola, Maharashtra, India.
Conclusions
Under the uncertain with delaying trend of decadal rainfall, long duration crops are needed to be replaced by other short duration. Therefore, the reduced duration of crop growing season and amount of rainfall in recent decade indicates lesser water availability period, there by indicating possible climatic shift in the region. The above results also indicate that reduction of 75 percent in amount of rainfall it could be dangerous for ecology in rain fed regions. Negative impact of variability of rainfall pattern on agricultural production could be avoided or reduced significantly by applying appropriate adaptation measures. There are biological measures or agronomic practices and Mechanical measures to reduce or prevent either water erosion or wind erosion while achieving desired moisture for sustainable production. References Budhar, M.N. Ramaswamy, R. (1985). Influence of rainfall on cropping systems in drylands of
pennagaram taluka of Dharmapuri District. Madras Agril. J. 72: 213-217. Eitzinger, J., Utset, A., Trnka, M.., Zalud, Z., Nikolaev, M and Uskov, I. (2007). Weather and
climate and optimization of farm technologies at different input levels. India: Managing Weather and Climate Risks in Agriculture, 554, Sivakumar, M. V. K. and Moth, R. (eds.). Springer, Berlin, ISBN 3540727442.
G.U. Satpute and R.C Bhuyar (2008). Anonymous 2009. Dr. PDKV, Akola (MS).

452
Kulandaivelu, R.R., Kumpuchetty, N., Rajendran, P. and Morachan, Y.B. (1979). Rainfall pattern and cropping system in Kinathukkadavu block, Coimbatore district. Madras Agril. J. 66:520-525.
Kulandaivelu, R.R., Kumpuchetty, N. and Morachan, Y.B. (1980). Rainfall pattern and cropping system in Coimbatore district . Madras Agril. J. 67: 171-176.
P. Parasuraman and M. Suresh (2002). Study on the rianfall climatology of regional research station, Prier for planning Madras Agril. J. 89 (7-9): 469-473.
(Published in March 2012)