Embed Size (px)
Citation preview

1
Presenter:Denny SmithDirector, Corporate Development
Credit Suisse First Boston
February 4, 2005

2
Strong financial position
Broad global infrastructure
Extensive global experience and expertise
Large and diverse asset base with significant available capacity
NABORS COMPETITIVE STRENGTHS

3
Balance Sheet Data as of December 31, 2004
A CONSERVATIVE AND FLEXIBLE FINANCIAL POSITION
(1) Some debt issues are unrated
ActualCash & Marketable Securities 1,263Accounts Receivable 540Working Capital 386Property, Plant and Equipment, Net 3,273Total Assets 5,850Total Debt 2,006Stockholders’ Equity 2,923Total Debt to Total Capitalization 41%Net Debt to Capitalization 20%Weighted Average Shares Outstanding 165Moody’s Rating (1) A3Standard & Poors A-Indexes S&P 500, OSX
($ in millions)

4
Improved balance in our operating income stream– Strong growth in Canada– Consistent growth internationally– Growth less reliant on US land business– US land pricing and volume momentum is here– Good outlook in US Gulf of Mexico
Lower “Below the Line” cost– Reduced cost of capital– Lower diluted share count– Improved tax position
A MORE BALANCED BUSINESS

5
Drilling Working Ready-to-Run Inventory TotalNorth AmericaAlaska 10 8 2 20US 48 Drilling 223 48 100 371GOM Offshore 15 25 0 40Canada 73 4 6 83InternationalInt’l Land (1) 61 19 16 96Int’l Offshore (1) 20.5 1 1 22.5
Total Drilling 402.5 105 125 628.5W.O./Well Servicing
US Lower 48 (2) 435 35 203 668Canada 161 9 46 216
Total W.O./Well Servicing 596 44 249 884
FLEET STATUS AS OF JANUARY 28, 2005
(1) Represents Nabors’ Net Interest in J.V. Rigs in Saudi @ 50%, operating rig count includes those leased from GOM Offshore(2) Decommissioning 75 rigs in 3Q and 4Q 2004 with $1.8 Million net book value

6
North American gas decline rates imply 20+ BCFPD/year
Timing of the supply impact of stranded and imported gas
Additional drilling is required in US & Canadian Basins
Longer term, LNG will ultimately become the marginal supply
Global oil supply challenges and increasing demand
STRONG FUNDAMENTALS UNDERPIN POSITIVE OUTLOOK
Supply challenges point to a more orderly and sustainable cycle
7
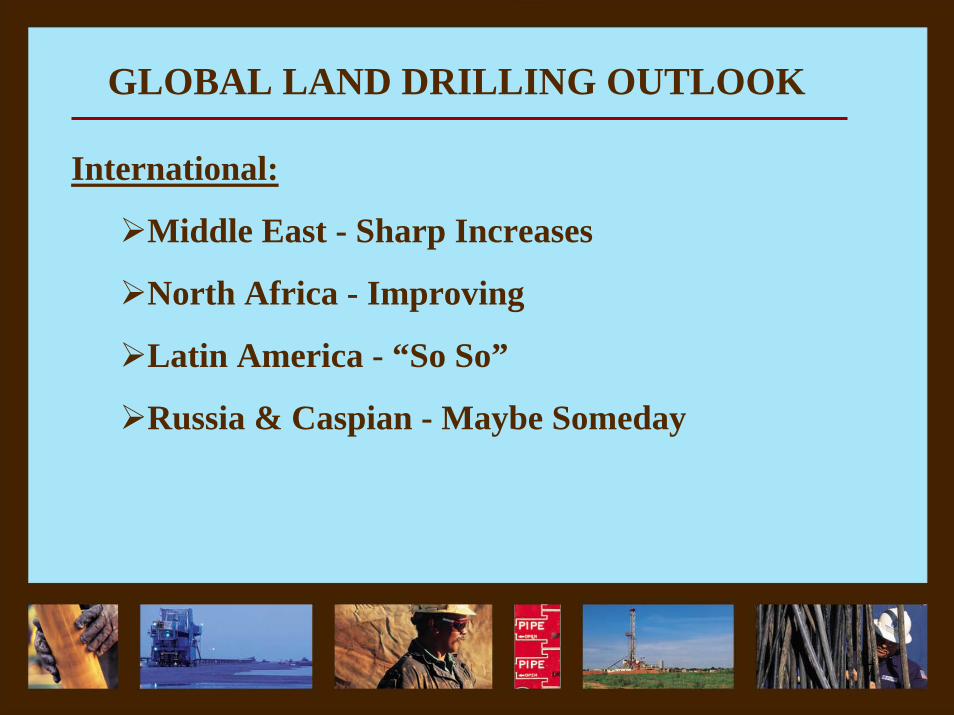
International:
Middle East - Sharp Increases
North Africa - Improving
Latin America - “So So”
Russia & Caspian - Maybe Someday
GLOBAL LAND DRILLING OUTLOOK

8
North America:
Effectively at full capacity utilization of available rigs
Rates & Margins moving up sharply
Demand appears to be continuing at a “Goldilocks” pace
This cycle will likely last throughout the decade and beyond with more moderate volatility
GLOBAL LAND DRILLING OUTLOOK
9
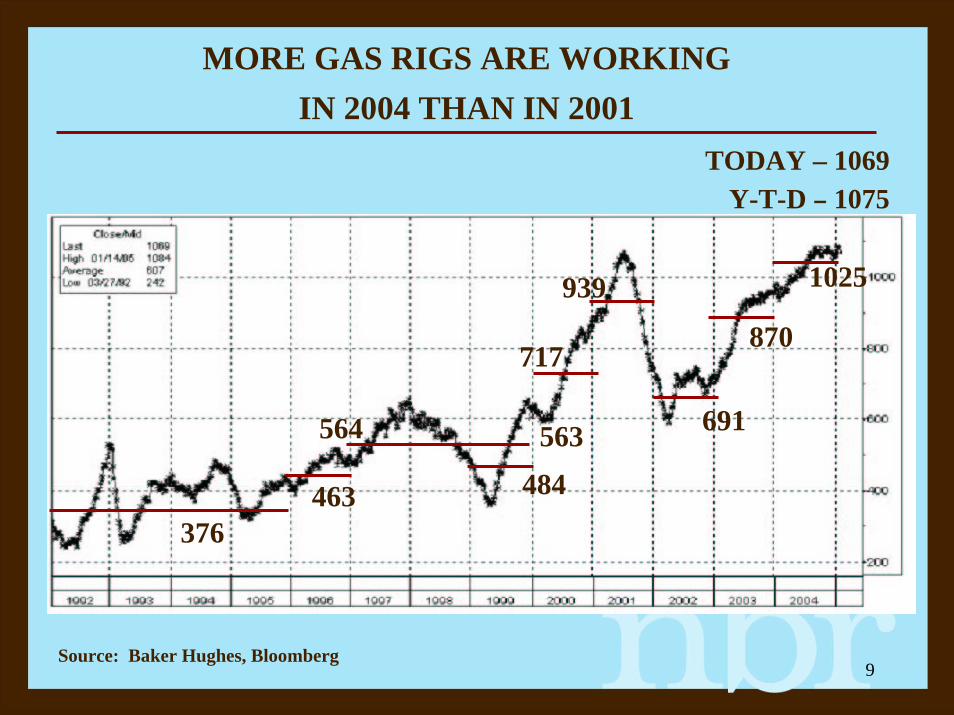
MORE GAS RIGS ARE WORKINGIN 2004 THAN IN 2001
TODAY – 1069Y-T-D – 1075
Source: Baker Hughes, Bloomberg
376463
564 563484
717
691
939
870
1025

10
ADDED VALUE THROUGH DRILLING EFFECIENCY IMPROVEMENTS
Shorter moving times, higher hydraulic horsepower and other rig technologies are enabling lower drilling costs
Bossier Conventional 12,500’ TD2001 2004
Average days on well 30 days 22 daysDrilling costs $0.8 $0.5Completion costs 0.2 0.4Total well cost $1.0 $0.9
Cotton Valley – Carthage 9,200’ – 10,200’ TDAverage days on well 20 days 12 daysDrilling costs $0.6 $0.4Completion costs 0.2 0.4Total well cost $0.8 $0.8
Average Henry Hub Cash Price $3.96 $5.90
$millions $millions

11
Barnett Shale Area2001 2004
Well type Vertical Horizontal
Average days on well 15 days 25 daysDrilling costDrilling cost $0.4 $1.1Typical well cost $0.8 $2.5
Production/day 1.0 mcf 3.5 mcfCapital cost/mcfpd $0.8 $0.7
Average Henry Hub $/mcf $3.96 $5.90
$millions $millions
ADDED VALUE THROUGH MORE CAPABLE RIGSShorter moving times and higher hydraulic horsepower are facilitating
improved economics with horizontal wells

12
600650700750800850900950
100010501100
1/3/031/24/032/14/03
3/7/033/28/034/18/03
5/9/035/30/036/20/037/11/03
8/1/038/22/039/12/0310 /3/0310 /24 /0 311 /14 /0 3
12 /5/0312 /26 /03
1/16/042/6/042/27/043/19/04
4/9/044/30/045/21/046/11/04
7/2/047/23/048/13/04
9/3/049/24/0410 /15 /0 4
11 /5/0411 /26 /0412 /17 /04
1/14/05
90100110120130140150160170180190200210220230
BHI NBR AREA NBR RIGS
NABORS HAS GAINED WITH INCREASED HORIZONTAL DRILLING AND A ROBUST MARKET IN THE ROCKIES
1/3/03 01/28/05 Increase
BHI 675 1007 332 49%
NBR 108 223 115 106%
NBR Incremental Share = 35% since 1/3/03
Source: Baker Hughes – Excludes N.E. States, California and Alaska

13
INTERNATIONAL ACTIVITY IS HEATING UP, ESPECIALLY ON LAND, WITH 45-60 INCREMENTAL RIGS OVER NEXT 24 MONTHS
Algeria OmanColombia MexicoEcuador Russia
Egypt Saudi ArabiaIndia VenezuelaLibya Yemen

14
SAUDI ARABIA RIG ACTIVITY INCREASINGNabors adding 10 of the expected rig increase
May 2004 Est. 2Q 2005Oil Gas Total Oil Gas Total
Rigs Working (1) 24 20 44 46 30 76
NaborsWholly-Owned 4 4 8 14 4 18Joint Venture (2) 4 4 8 4 4 8Total (3) 8 8 16 18 8 26
Market ShareNabors & J.V. 33% 40% 36% 40% 27% 34%
(1) 31 rigs drilling plus 13 drilling rigs doing re-entry, sidetracks, re-drilling and workovers (does not include 6 Aramco owned rigs)
(2) Nabors has 50% interest in these rigs(3) In addition, Nabors also owns and operates three accommodation jack-ups
Source: BHI Saudi rig count , Nabors

15
INTERNATIONALLY – STRONG OIL FUNDAMENTALS ALSO POINT TO AND INCREASINGLY STRONG OUTLOOK
Supply - Increasing more difficult and rig intensive
Aging and declining fields
New supply limited after 2006
(MMBOPD)2003 2004 2005 2006 2007 2008
Mega projects 7 11 18 11 3 3Est. Peak 1.2 2 3 2 >1 >1
Saudi Appears to be putting the “pedal-to-the-metal”
Demand – Staying strong despite higher pricesWTI average for 2002 & 2003 ⇒$28.27
2003 & 2004 ⇒$34.152004 Y.T.D. ⇒$38.62
Source: OADC Organization and Bloomberg

16
DRILLING EFFICIENCY INITIATIVES ENABLE LOWER CYCLE TIMES AND COSTS PER WELL
Safety and Training – Further initiatives
Moving times reduced (30 – 70%) on conventional fleet
Capacity upgrades to existing fleet
•Higher hydraulic horsepower (psi x gpm)•Increased engine power and electronic controls
Technology adoption where cost effective
•Auto driller•Top Drives
17
DRILLING EFFICIENCY INITIATIVES ENABLE LOWER CYCLE TIMES AND COSTS PER WELL
Innovative new rig configurations
•Pad development (lift and roll moving system)
•Fast moving (1.5 – 2 days) “Commander” Class AC/PLC
•New A/C Coiled Tubing/STEM Drilling Rig
•MODS (modular Offshore Dynamics Series) Platform Rig for deepwater SPAR & TLP platforms
•New generation workover rig – 500 horsepower “Millennium” rig
18
LOWER CYCLE TIME PER WELLLess days per well requires shorter moving times
Nabors is cutting 30-70% off move times with simplelow cost initiatives:
– 24 hour moves– Better pre-planning and sequencing
• Less dead time• Less cost for cranes and trucking
– More optimal unitization of modules• Modest structural changes to minimize loads• Less labor intensive disconnect/reconnect
– Nabors’ controlled trucking resource

19
INCREASED USE OF HORTIZONTAL& MULTILATERAL WELLS
HIGHER SPECIFICATION RIGS YIELD IMPROVED EFFICIENCY
Increased hydraulic horsepower (psi x gpm) to facilitate optimalbit and mud motor performance7,500 psi pump pressure capabilityTop drives facilitate directional orientationOpti-Drill™ automatic driller with proprietary Drill Smart™Algorithms– Continuous analysis of drilling conditions to maximize ROP– Improved directional motor life– Maximize benefit of rotary steerable drilling

20
INCREASED INTEREST IN PAD DRILLINGMultiple wells drilling directionally from sites
in environmentally sensitive areas
Nabors pioneered pad drilling in the 1970’s – 1990’s on the North Slope of AlaskaAdapting new generation “Lift and Roll” skid systems from North Slope applicationsApplications:– McKenzie Delta– Tar Sands– US Rocky Mountains – Various International venues
Advantages:– Faster moves– Smaller environmental impact– Faster field development

21
EFFICIENCY EMPHASIS LEADSTO LAND RIG INNOVATION
Building leading edge rigs, utilizing existing components, yields favorable returns
• Fast moving “Commander” class rigs
• 800–2,000 horsepower electric A/C drive
• Four currently working,10 under construction
• PLC (Programmable Logic Controls)
• Modularized skidded rigs for pad drilling
• New A/C coiled tubing/stem drilling rig under construction with term contract

22
INCREASED DEEPWATER DEVELOPMENTA NEW DEEPWATER CLASS PLATFORM RIG AT FAVORABLE COSTS
MODS (Modular Offshore Dynamic Series)– A/C drives based on Commander
class drilling rig design– PLC controls provide extra safety
features to protect crews and equipment
The only A/C platform rigs in the Gulf of MexicoCapable of rigging up on conventional platforms, TLPs and Spars

23
WORKOVER WELL SERVICINGMORE EMPHASIS ON HARVESTING OIL RESOURCES
Nabors is pushing an old industry forward
New generation 500 HP PLC rigs
Make up torque monitor
Rig Instrumentation– Monitor on going operations in real-time via internet.– Built in safety alerts and hazardous operations monitoring

24
-
50.0
100.0
150.0
200.0
250.0
300.0
$-
$1,000
$2,000
$3,000
$4,000
$5,000
$6,000
$7,000NABORS' RIG COUNT AVG MARGIN PER RIG DAY
1999 2003 2004 2005 20062000 2001 2002
WE ARE FASTLY APPROACHING DEJAVU 2001MARGINS VS. RIGS WORKING
NABORS US LOWER 48 DRILLING
Add 2 rigs per month

25
First Call EstimatesOperating Unit EBITBefore Corp & Consolidation
Actual2001
Mean2004
Mean2005
$1.86 $2.74
$120125140
220$605
US Lower 48 Metrics
GM/Rig/Day $4,840 $2,700 $3,700 $4,500Average Rig Years 210 197 240 240
Canada $30 $92 $1208898
92$370
High2005
Earnings Per Share $2.24 $3.00
International 58 125Other US Businesses 211 140
US Lower 48 Drilling 286 290Total $585 $675
A MORE BALANCED BUSINESSHigher earnings at less U.S. land drilling activity