Embed Size (px)
Citation preview

BY DESIGNOutperform in 2004 and Beyond
Credit Suisse First Boston
2004 Insurance Seminar

2
Nasdaq:CINF
• Today’s presentation contains forward-looking statements that involve risks and uncertainties. Please refer to our various filings with the Securities and Exchange Commission for factors that could cause results to materially differ from those discussed.
• Reconciliations of non-GAAP and non-statutory data are available at www.cinfin.com

3
Structured for Strength and Stability
• 19th largest publicly traded insurer based on revenues
• 30th largest property casualty insurer by premium volume
• Market capitalization of $7 billion (3/16/2004)
• Strong growth and underwriting profit in 2002 and 2003
• Well capitalized and highly rated

4
Enhancing Return to Shareholders
• Philosophy leads to long-term shareholder value
• 11.3% 10-year compound growth in paid dividends
• 10.0% increase in 2004 indicated annualized cash dividend– 44th consecutive increase
• 5% stock dividend declared

5
Focus on Shareholder Value
$0.00
$0.50
$1.00
$1.50
$2.00
$2.50
$3.00
1999 2000* 2001 2002 2003*
Operating Income Net Income Dividends Paid* See the Operations section of the Investors page of www.cinfin.com for non-GAAP and non-statutory reconciliation information.

6
Outperform in 2004 and Beyond
• Generate strong growth and above-average profitability by leveraging regional franchise and proven agency-centered business strategy
• Obtain strong investment income growth and capital appreciation through equity-focused investment strategy
• Maintain financial strength

BY DESIGNLeverage Regional Franchise and Proven Agency-centered Business Strategy
J.F. Scherer
Senior Vice President
Sales & Marketing

8
At Home on Main Street
• Regional carrier– Main Street property casualty business – 963 local independent insurance agencies in
31 states– Market for about 75% of agency’s typical risks– Approximately 90% of property casualty
policies less than $10,000 premium
• Agents in Main Street markets place value on claims service, market stability, access to executives– CIC was No. 1 or No. 2 carrier in 71% of agency
locations in 2002

9
Market for 75% of Agency’s Typical Risks
Other Liability13%Other
10%
Workers' Comp11%
Personal Auto9%
Life4%
Commercial Auto16%
Commercial Multi-Peril
25%Homeowner
16%
Commercial Lines69%
Property Casualty
Personal Lines27%
2003 Net Earned Premium
Consolidated$2.749 Billion
Property Casualty$2.653 Billion
10
Serving Select Group of 963 Independent Agencies in 31 States
Headquarters (no branches)
Actively Marketing

11
0%
5%
10%
15%
20%
1999 2000* 2001* 2002* 2003*
Cincinnati
Estimated Industry (A.M. Best)
Opportunities for Continued Strong Property Casualty Premium Growth
• Room to grow in marketplace
• Continue to subdivide territories to improve service
• Increase penetration of each agency’s business
• Selectively appoint new agencies
* See the Operations section of the Investors page of www.cinfin.com for non-GAAP and non-statutory reconciliation information.
Net Written Premium Growth

12
Potential in the Marketplace
2002 Statutory Direct Written Premiums
(Dollars in millions)Cincinnati
Total P/C Industry
Cincinnati Market
Penetration
Ohio $ 651 $ 16,882 3.9%
Illinois 280 19,058 1.5
Indiana 221 8,802 2.5
Pennsylvania 156 16,807 0.9
Michigan 157 14,840 1.1
Georgia 161 10,764 1.5
All Active States $ 2,894 $ 247,359 1.2
13
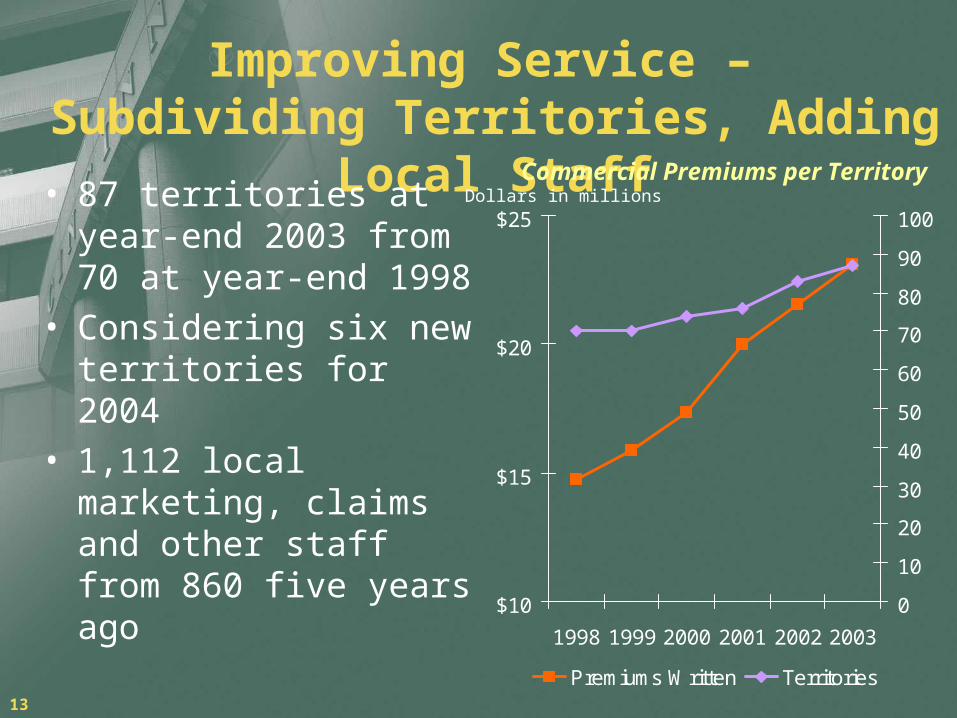
Improving Service – Subdividing Territories, Adding Local Staff
• 87 territories at year-end 2003 from 70 at year-end 1998
• Considering six new territories for 2004
• 1,112 local marketing, claims and other staff from 860 five years ago
$10
$15
$20
$25
1998 1999 2000 2001 2002 2003
0
10
20
30
40
50
60
70
80
90
100
Premiums Written Territories
Dollars in millionsCommercial Premiums per Territory
14
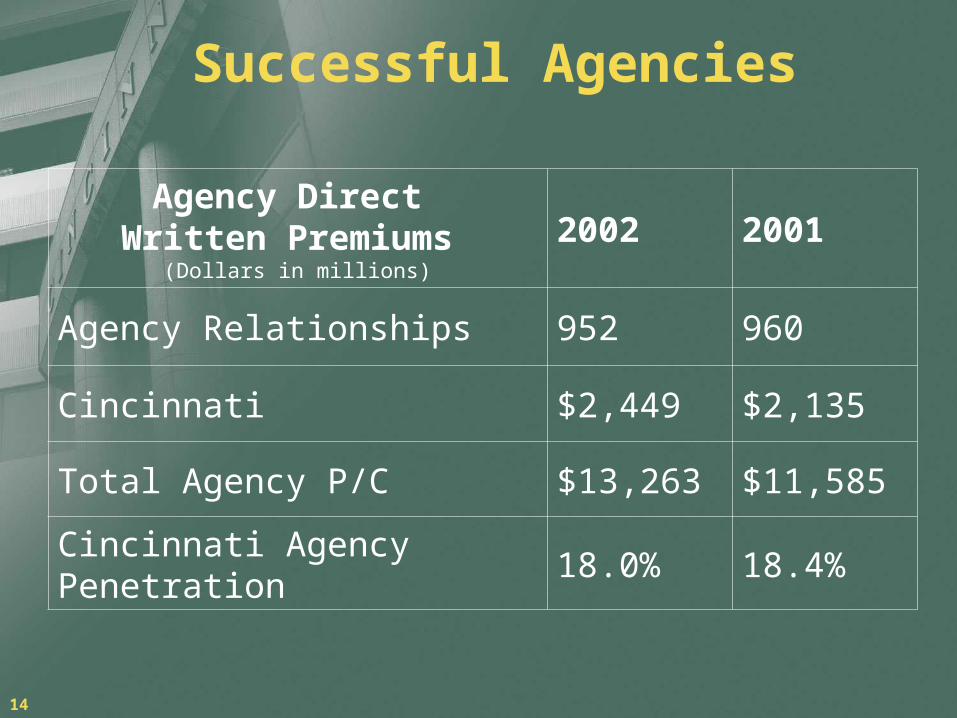
Successful Agencies
Agency Direct Written Premiums
(Dollars in millions)
2002 2001
Agency Relationships 952 960
Cincinnati $2,449 $2,135
Total Agency P/C $13,263 $11,585
Cincinnati Agency Penetration 18.0% 18.4%

15
Selectively Appoint New Agencies
• Tap growth opportunities within existing states– Familiar turf
• Maintain franchise value• Investigate stagnant areas• 28 new agency relationships in 2003• 150 appointments projected 2004–2006
16
Life Insurance Opportunities
• Diversify revenue stream for property casualty agencies
• Expand product portfolio to meet needs of agency clients
• Add stable business that reduces impact of property casualty cycles

17
Further Improvement Balancing Growth with Profitability
• Anticipate FY 2004 statutory combined ratio of approximately 94.5%– Assumes catastrophe
losses in 3% to 3.5% range
• Leverage local knowledge/underwriting
• Maintain low-cost structure
90%
100%
110%
120%
1999 2000* 2001* 2002* 2003*
Cincinnati
Estimated Industry (A.M. Best)
Post-dividend statutory combined ratio
* See the Operations section of the Investors page of www.cinfin.com for non-GAAP and non-statutory reconciliation information.
18
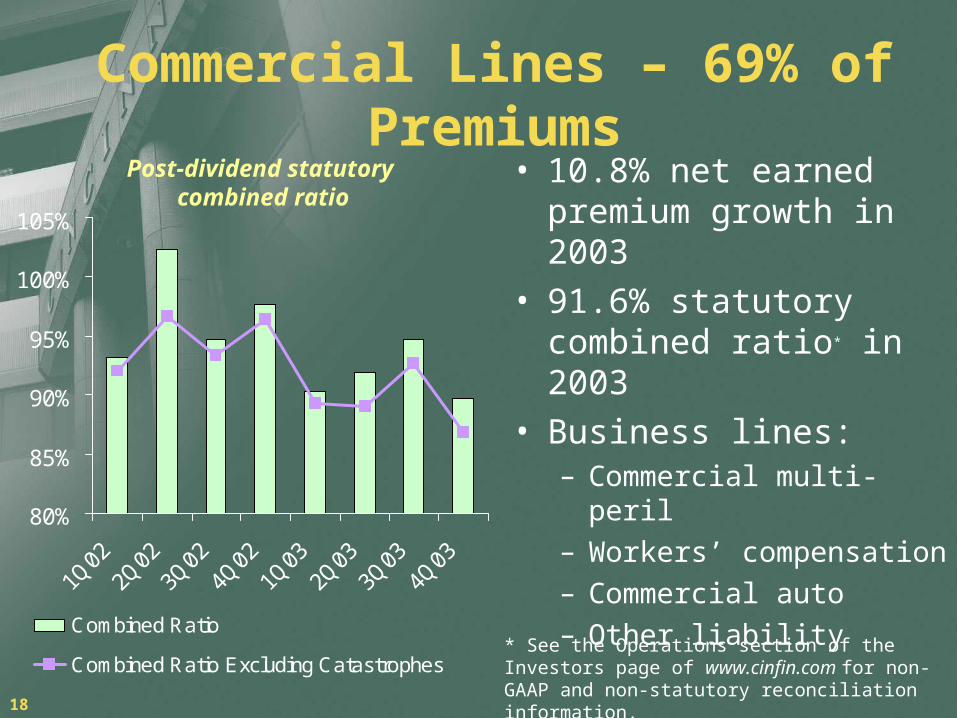
Commercial Lines – 69% of Premiums
• 10.8% net earned premium growth in 2003
• 91.6% statutory combined ratio* in 2003
• Business lines:– Commercial multi-peril– Workers’ compensation– Commercial auto– Other liability
* See the Operations section of the Investors page of www.cinfin.com for non-GAAP and non-statutory reconciliation information.
80%
85%
90%
95%
100%
105%
Combined Ratio
Combined Ratio Excluding Catastrophes
Post-dividend statutory combined ratio
19
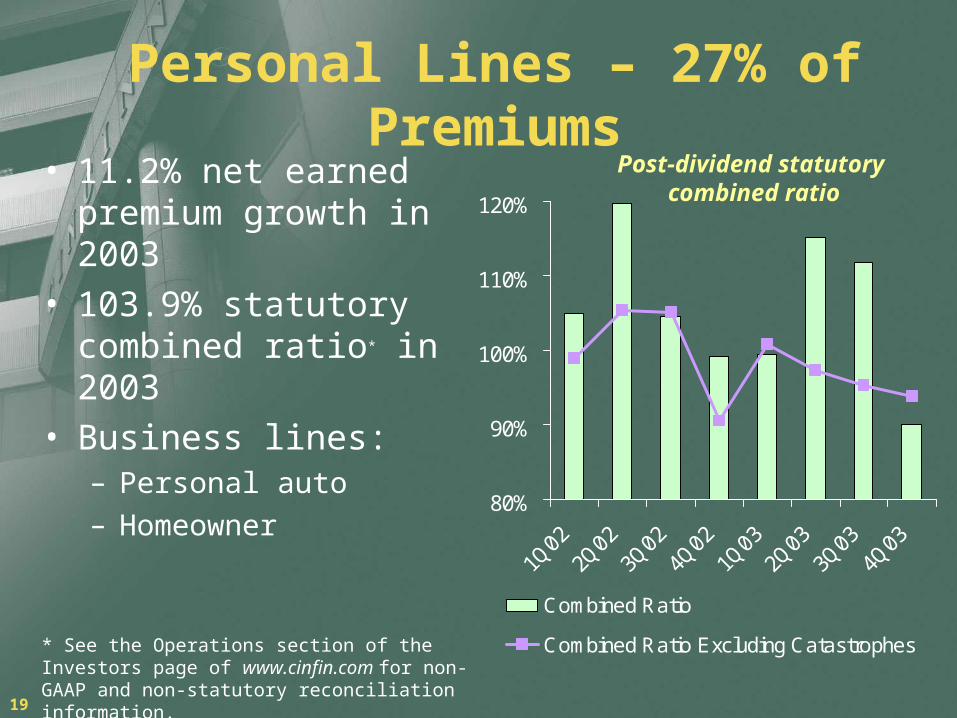
Personal Lines – 27% of Premiums
• 11.2% net earned premium growth in 2003
• 103.9% statutory combined ratio* in 2003
• Business lines:– Personal auto– Homeowner
80%
90%
100%
110%
120%
Combined Ratio
Combined Ratio Excluding Catastrophes
Post-dividend statutory combined ratio
* See the Operations section of the Investors page of www.cinfin.com for non-GAAP and non-statutory reconciliation information.

20
Focus on Homeowner
• Targeting quarterly loss and loss expense ratio in 72% to 74% range by the end of 2005
• Improve profitability through:– Rate changes– Insurance-to-value– Changes in policy terms
and conditions – water damage, others
– Re-underwriting programs
30%
50%
70%
90%
110%
130%
Loss & LAE Ratio
Loss & LAE Ratio Excluding Catastrophes

BY DESIGNEquity-focused Investment Strategy
Michael R. Abrams
Assistant Vice President
Investments

22
Equity-focused Investment StrategyPortfolio Goals: Growth and Income
• Growth• Long-term investment
horizon• Increases surplus• Enhances book value
and financial strength• Primarily achieved
with common and convertible securities
• Income• Achieved with interest
and dividends • Bond quality rising;
municipals, agency paper
• Large, long-term positions in proven, dividend-paying companies
• Reinvest coupon payments
• Compounding

23
Investment Portfolio – Equity-focused
• $6.293 billion in unrealized appreciation
• $607 million in net new invested assets in 2003
• Focus on equity-linked securities and high-quality fixed income with intermediate maturities
9%
7%19%
35%30%
66%
16%
4%
10%
Book Value: $6.156 billion
Market Value: $12.449 billion
At December 31, 2003
Common Stocks
Investment-Grade Bonds
High-Yield Bonds
Municipal Bonds
Convertible Securities

24
Investment Philosophy:Bonds
• Focus on cash-flow yield• Compounding interest on cash flows• Diversity of holdings • Taxable bonds
– Investment-grade (agency/corporate)– High-yield
• Tax-exempt– Municipal bonds

25
Investment Philosophy:Convertible Securities
• Hybrid security with fixed income and equity characteristics
• Equity-like returns with bond-like risks– Stable income stream – Potential for capital appreciation associated
with underlying common stock– Downside protection
• Favorable risk-based capital treatment

26
Investment Philosophy:Common Stocks
• Focus on equities– With the ability and commitment to grow
earnings and dividends
• Buy companies that have– Strong and proven management teams– Clean balance sheets– Understandable product– Favorable outlook
• Purchase at reasonable levels (value)• Invest long term

27
Core Equity Holdings
Source: Bloomberg L.P. as of December 31, 2003
Holdings(Dollars in millions)
Cost Market Value
Dividend Increases
Earned Dividend Income
P/E
Fifth Third $283 $4,301 11.5% $82 19.6
ALLTEL 119 614 5.7 19 15.2
National City 255 418 4.9 15 9.9
ExxonMobil Corp 133 367 8.7 9 16.8
P&G 94 279 11.0 5 23.7
Wyeth 115 265 - 6 17.4
PNC 62 258 4.2 9 14.1
First Merit 95 201 4.0 8 19.0
Merck 144 158 2.8 5 14.0
US Bancorp 91 149 23.1 4 14.8
Sky Financial Group 91 121 5.0 4 14.7
Piedmont Natural Gas 51 110 3.8 4 19.5
Wells Fargo & Company 44 108 60.7 2 16.1
Johnson & Johnson 101 107 17.1 1 19.5
Alliance Capital 53 107 - 6 17.2

28
Focus on Compounding of Cash Flows Over the Long-term
• Investment income provides primary source of profits – 2003 dividend increases
from 29 of 51 = $16 million in annualized investment income
• Surplus contributes to financial strength
• Drives book value growth
$200
$250
$300
$350
$400
$450
$500
1998 1999 2000 2001 2002 2003
Based on pro forma data. See www.cinfin.com, Investors, Operations for reconciliation information.

BY DESIGNMaintain Financial Strength
Kenneth W. Stecher
Chief Financial Officer
30
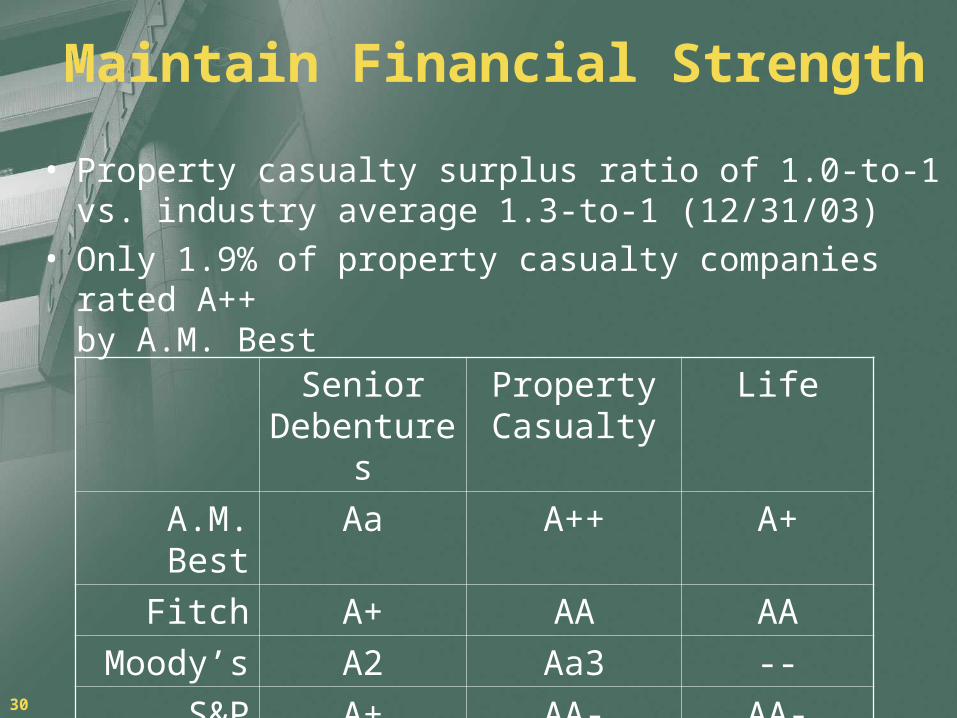
Maintain Financial Strength
• Property casualty surplus ratio of 1.0-to-1 vs. industry average 1.3-to-1 (12/31/03)
• Only 1.9% of property casualty companies rated A++ by A.M. Best
Senior Debenture
s
Property Casualty
Life
A.M. Best Aa A++ A+
Fitch A+ AA AA
Moody’s A2 Aa3 --
S&P A+ AA- AA-
31
Balance Sheet and Risk Management
• High-quality investment portfolio• Loss reserve adequacy• Low-risk reinsurance recoverables • Strong cash flow and liquidity
– Modest indebtedness of $603 million or 9.7% of shareholders’ equity
– Unchanged from prior year
• Effective oversight

32
Total Statutory Reserve BalanceObjective: Modestly Redundant Reserves
$1,932
$2,182
$2,352
$2,608
$2,845
1999 2000 2001 2002 2003
Property CasualtyIn millions
33
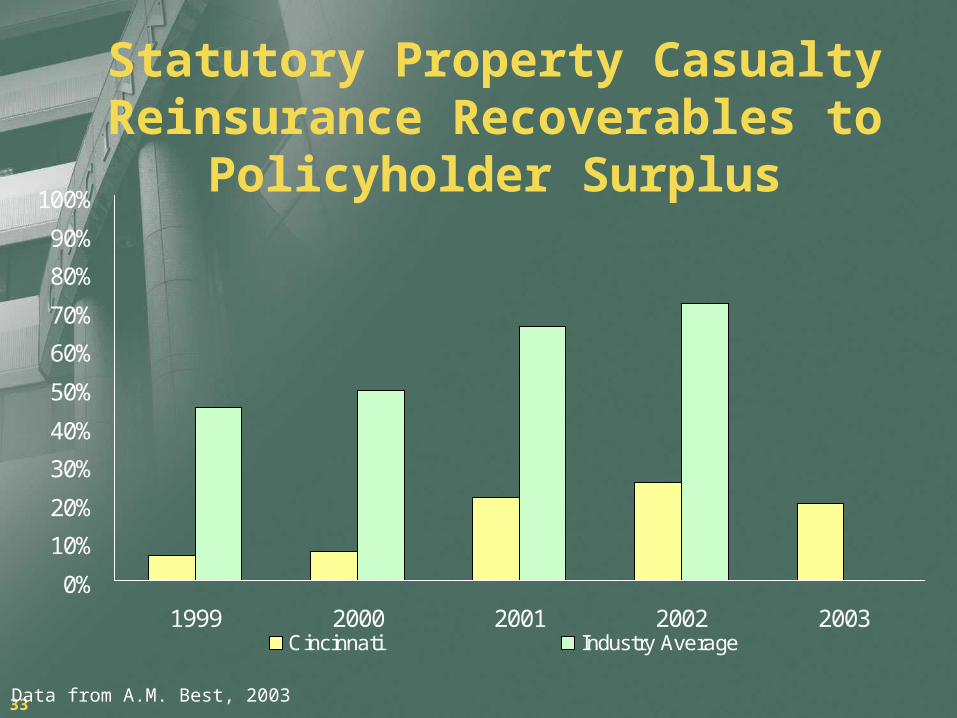
Statutory Property Casualty Reinsurance Recoverables to Policyholder Surplus
0%
10%
20%
30%
40%
50%
60%
70%
80%
90%
100%
1999 2000 2001 2002 2003Cincinnati Industry Average
Data from A.M. Best, 2003

34
$0
$100
$200
$300
$400
$500
$600
$700
$800
$900
1999 2000 2001 2002 2003
Operating Cash Flow BOLI
Strong Cash Flow and Liquidity
In millions

BY DESIGNConclusion
Credit Suisse First Boston
2004 Insurance Seminar

36
A Look Ahead – Our View
• Outperform in 2004 – High single-digit written premium growth– 95% GAAP combined ratio– 3.5% to 4.5% investment income growth
• And beyond– Sustain steady growth– Further improve combined ratio– Accelerate investment income growth– Bring results to bottom line– Equity portfolio performance ahead of S&P 500
– resumption of book value growth

BY DESIGNCincinnati Financial Corporation
Credit Suisse First Boston
2004 Insurance Seminar


![OUTPERFORM [V] INITIATION](https://img.dokumen.tips/doc/110x75/6189e5c61eda5f71d25deb98/outperform-v-initiation.jpg)