Embed Size (px)
Citation preview
CRECIMIENTO DE LA CONCHA DE ABANICO A DIFERENTES DENSIDADES
EN AREAS DE REPOBLAMIENTO DE BAHIA SECHURA
Bach: RONALD LEÓN QUIROZ
Sustainability analysis of scallop culture in Sechura bay

Sustainability Analysis of Scallop Culture in Sechura bay, Peru
OBJETIVO PRINCIPAL Y ESPECIFICOS

Determinar y comparar las tasas de crecimiento de la concha de abanico en cuatro áreas de
repoblamiento de Bahía Sechura
Determinar la densidad adecuada de cultivo para el engorde de concha de abanico para cada área de repoblamiento trabajada
Sustainability Analysis of Scallop Culture in Sechura bay, Peru
Metodología

Sustainability Analysis of Scallop Culture in Sechura bay, Peru

Sustainability Analysis of Scallop Culture in Sechura bay, Peru
RESULTADOS PRELIMINARES INVIERNO 2014(Julio-Setiembre)
Sustainability Analysis of Scallop Culture in Sechura bay, Peru
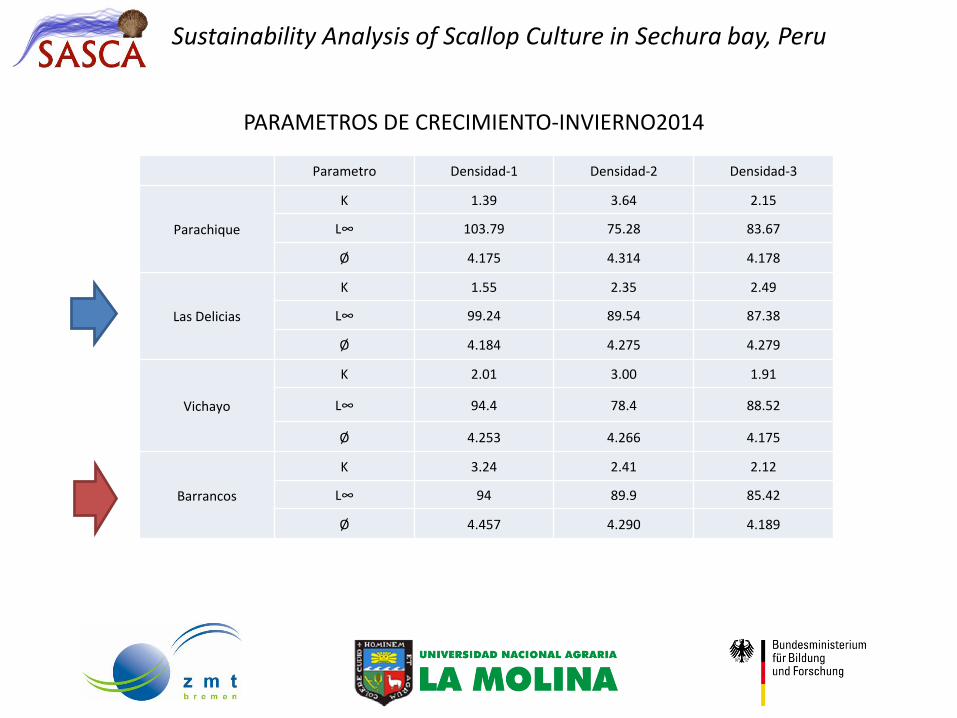
PARAMETROS DE CRECIMIENTO-INVIERNO2014
Parametro Densidad-1 Densidad-2 Densidad-3
Parachique
K 1.39 3.64 2.15
L∞ 103.79 75.28 83.67
Ø 4.175 4.314 4.178
Las Delicias
K 1.55 2.35 2.49
L∞ 99.24 89.54 87.38
Ø 4.184 4.275 4.279
Vichayo
K 2.01 3.00 1.91
L∞ 94.4 78.4 88.52
Ø 4.253 4.266 4.175
Barrancos
K 3.24 2.41 2.12
L∞ 94 89.9 85.42
Ø 4.457 4.290 4.189

0.000
20.000
40.000
60.000
80.000
100.000
0.00 0.50 1.00 1.50 2.00 2.50 3.00
Alt
ura
(m
m)
Edad (años)
CURVAS DE CRECIMIENTO OBTENIDAS DE UN EXPERIMENTO CON CONCHA ABANICO EN EL AREA DE BARRANCOS DURANTE JULIO-SETIEMBRE 2014
DENSIDAD 50 ind/m2
DENSIDAD 100 ind/m2.
DENSIDAD 200 ind/m2
Sustainability Analysis of Scallop Culture in Sechura bay, Peru
K
Densidad-1 3.24
Densidad-2 2.41
Densidad-3 2.12

Sustainability Analysis of Scallop Culture in Sechura bay, Peru
Pequeños 50-60 Grandes 80-90Medianos 60-70

Sustainability Analysis of Scallop Culture in Sechura bay, Peru
Pequeños 50-60 Grandes 80-90Medianos 60-70

Sustainability Analysis of Scallop Culture in Sechura bay, Peru
LAS DELICIAS
y = 1.276e0.0414x
R² = 0.932
y = 0.3631e0.0443x
R² = 0.8723
6.00
11.00
16.00
21.00
26.00
31.00
45 50 55 60 65 70 75 80 85 90 95
Pes
o (
gram
os)
Altura
Relacion (Peso vs Talla)
DENSIDAD 50
DENSIDAD 100
DENSIDAD 200
D1
D2
D3
d1
d3
d2
Series10
Exponencial (Series10)
Sustainability Analysis of Scallop Culture in Sechura bay, Peru
CONCLUSIONES

Sustainability Analysis of Scallop Culture in Sechura bay, Peru
No existe diferencia significativa entre los cultivos enBarrancos para las densidades trabajadas


![Proyecto de Exportacion de Concha de Abanico[1]](https://img.dokumen.tips/doc/110x75/55cf9a0e550346d033a0489e/proyecto-de-exportacion-de-concha-de-abanico1.jpg)


