Embed Size (px)
Citation preview
Coleman
Bob Judge, Government Loan Solutions, Editor
Bob Judge is a partner atGovernment Loan Solutions.
Government Loan Solutions is aprovider of valuation services, pre-payment analytics and operationalsupport for the SBA marketplace.
Bob has 25 years of experience inthe fixed income markets. He holdsa B.A. in Economics from VassarCollege and an M.B.A. in Financefrom NYU Stern School of Busi-ness.
Government Loan Solutions’ CPR ReportProviding the most detailed monthly SBA 7(a) and 504 prepayment, default and market information
© 2011 Coleman and Government Loan Solutions. All Rights Reserved.
S MA U P D A T E : G O O D T I M I N G F O R A N
FMP E X T E N S I O N ?
By Jordan Blanchard
With persistent unemploymentand an apparent weakening ofthe economy, it makes sense forthe SBA and Congress to con-sider extending the FMP pro-gram beyond its statutory dead-line.
Businesses looking to purchaseor construct buildings helpscreate jobs and stimulate eco-nomic development. Businessesusually purchase buildings to
After two months of in-
creasing prepayment
speeds, May brought with
it a welcome decrease.
While overall speeds did
fall, it was not without
cost. While voluntary
prepayments fell to the
lowest level since last Oc-
tober, defaults edged up
for the fourth month in a
row.
Last month, overall
speeds came in at 6.22%,
a slight decrease from
April’s reading of 6.70%
and the eighth month in
a row of sub-7% prepay-
ment rates.
One thing that does con-
cern us is the impact of
slowing economic growth
on SBA default rates.
The last few years have
shown us how sensitive
small businesses are to
the state of the economy.
As if on cue, defaults
have been rising steadily
since the beginning of
2011 when economic
Continued on page 2
expand their operations whichcreates jobs. Construction ofnew facilities is a double eco-nomic victory because jobs arecreated to build the facility, andnew jobs are created when thebusiness moves into the facility.But businesses can only expandinto new buildings if they haveaccess to credit. Since SBA 504is one of the most used financ-ing options available for fixedasset acquisition, it is imperativethat as many qualifying smallbusinesses have access to theSBA 504 program as possible.
Why the FMP program isimportant…
A healthy secondary market isimportant to all types of loanprograms including home loans,car loans, student loans, corpo-rate debt, etc. Small businessloans are no exception. TheSBA 7A program provides for ahealthy secondary market forgeneral purpose business loans,but the secondary market forSBA 504 first mortgage loans isonly now recovering – and thatis due primarily to FMP.
Continued on page 4
Volume 5, Issue #6
P R E PA Y M E N T S P E E D S F A L L B A C K
T OW A R D 6%
June, 2011
Special points of interest:
• Prepayments Fall Back
• SMA Update: Good Timing?
• Default Rate Up a Bit
• Value Indices Mostly Higher
I N S I D E T H I S I S S U E :
Prepayment Speeds 1-2, 18-20
SMA 1, 4-9
Sale & Settle Tip 11
Value Indices 13, 15-17
Default Rate 14
Default Curtailment Ratios 14 & 23
The Legal Beat 10
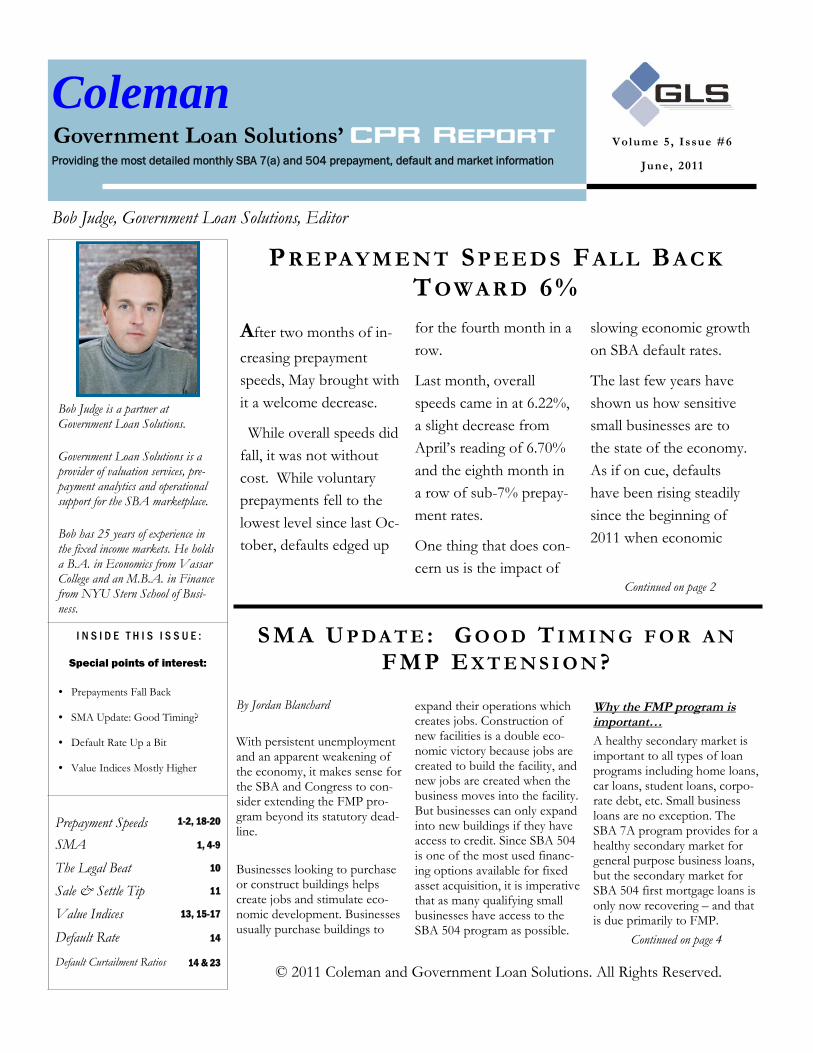
(red line) rose last month,
reaching 4.09% from 3.81%.
Last month, prepayment
speeds fell in three out of the
six maturity categories. De-
creases were seen, by order of
magnitude, in the 10-13 sector
(-40% to CPR 5.61%), 13-16
(-30% to CPR 4.11%) and <8
(-19% to CPR 9.52%).
Increases were seen, also by
order of magnitude, in 16-20
(+56% to CPR 6.39%), 20+
(+15% to CPR 5.98%) and 8-
10 (+.07% to CPR 11.76%).
For further information on the
terminology and concepts used in this
article, please refer to the “Glossary
and Definitions” at the end of the
report.
Coleman
Bob Judge can be reached at
(216) 456-2480 ext. 133 [email protected]
“The last few
years has shown
us how sensitive
small businesses
are to the state of
the economy. As
if on cue, defaults
have been rising
steadily since the
beginning of 2011
when economic
growth began to
ebb.”Data on pages 18-20
Government Loan Solutions’ CPR Report
growth began to ebb. While we
are only talking about a move-
ment from the low 3’s to near
4%, that does represent a near
1/3rd increase in defaults since
the beginning of the year.
Turning to specifics, defaults
ticked up by 7% to 4.09% from
3.81% the previous month.
This reading represents the first
time defaults have exceeded 4%
since last September when it
was in a downward trend from
nearly 8% in early 2010.
As for voluntary prepayments,
they fell by 26% to 2.13%, re-
maining below 3% once again.
As for next month, preliminary
data from Colson suggests a
significant decrease in in overall
prepayments, perhaps even
below 5%. As for how the
breakdown between defaults
and voluntary prepayments
shook out, we will have to wait
until next month’s report.
The YOY comparison to 2010
continues to show 2011 signifi-
cantly below last year, with
YTD prepayment speeds in
2011 at 6.24% versus 2010 at
8.00%.
Turning to the default/
voluntary prepayment break-
down, the Voluntary Prepay
CPR (green line) fell to 2.13%
from 2.89%, remaining in a
stable trend between 2% and
3% for yet another month.
While the VCPR remained
below 3%, the Default CPR
Page 2
PR E PAYM EN T SP EE DS . . .CO NT I NU ED

Page 3Coleman Government Loan Solutions’ CPR Report
Page 4Coleman Government Loan Solutions’ CPR Report
Because the eligibility requires that the Debenture be funded bySeptember of 2012, no ground up construction or heavy tenantimprovement transactions are being considered if the FMP pro-gram is the long term financing option. There is not enough timefor most ground up construction transactions to start in the next60 days and be completed by June. And if construction is delayedfor any reason past June of 2012, the construction lender can nolonger access FMP.
An extension to the expiration date will alleviate both of theseissues.
What can SBA do…
Congress allowed SBA to determine the eligibility criteria of theFMP program. SBA determined that the Debenture has to fund bythe statutory program termination date of September, 2012. It iswithin SBA’s power to amend the eligibility criteria to allow for theDebenture to simply be approved by the statutory program termi-nation date. This would immediately allow for all constructiontransactions relying on the FMP program to proceed. This coulddouble the usage of the FMP program overnight. Would there beprocedural issues for SBA and Colson to work through? Yes. But itwould be a worthwhile endeavor to help foster more businesslending through the utilization of dollars already appropriated. Andimagine the job creation effect if more construction transactionsare facilitated.
What can Congress do…
Congress can consider an extension that allows for the full utiliza-tion of the $3B allocation. Or best case scenario, Congress canconsider a permanent extension. After all, it is a zero subsidy pro-gram with no legislated subsidy cap.
What can you do…
Talk to NADCO, NAGGL, SBA and your Congressional repre-sentative whenever possible. Point out that FMP has essentiallydoubled the size of the 504 first mortgage secondary market in a
The FMP program has facilitated the sale of rough-ly $150MM of 504 first mortgages since the firstpool was issued in late September. NADCO’s thirdparty lender list notes Zions’ first mortgage loanvolume at roughly $115MM. That figure does notcount the loans purchased by Zions, but it is safe tosay that Zions’ overall volume is somewherearound $150MM – in roughly the same time periodthat FMP has been operational. Since Zions was theonly secondary market buyer in FY2010 and theprimary buyer in FY 2011, it can be shown that theFMP program has already doubled the size of 504first mortgage secondary market during the firstfew months of program operation. That is a signifi-cant accomplishment for a brand new and somewhat complexgovernment guaranteed loan program. After all, how long did ittake the SBA 7A program to achieve $150MM in activity? Or 504?Or USDA B&I? Probably longer than 8 months.
As buyers and sellers learn about, and learn how to utilize, theFMP program, the volume is bound to increase.
Why we need an extension…
Part of the reason the FMP program was created was to bridge thegap between the cessation of all CMBS issuances (late 2008) to atime where CMBS once again became an option for 504 first mort-gage securitizations (201?). There has been zero CMBS activity forsmall balance commercial real estate loans, and very little CMBSactivity overall. The return of a fully functioning CMBS market ispotentially years away. Without the SBA’s assistance during thistime period, the secondary market for SBA 504 loans will onceagain shrink to a relatively insignificant amount of the overall firstmortgage market.
Why an extension make sense…
Congress authorized $3B in FMP guarantee allocation. To date,less than $150MM has been utilized. This is a zero subsidy pro-gram, meaning that all losses of the program are covered by exist-ing and future borrowers benefiting from the program. If there isno cost to the tax payer in the event of losses, and there is $2.9B ofallocation remaining, it makes sense to extend the program to al-low the allocation to be utilized.d?
Why has volume been limited…
This issue was addressed in depth in a prior CPR Report article,but the two primary reasons that volume has been limited are:
The pending expiration of the program in September of 2012. Buy-ers and sellers are resistant to deploy the necessary resources for aprogram where the first mortgage has to be funded by June of2012 in order for the Debenture to fund by September of 2012(the program termination date). That leaves roughly 11 months ofactivity.
Continued on next page
S E C O N DA R Y M A R K E T A C C E S S . . . C O N T I N U E D
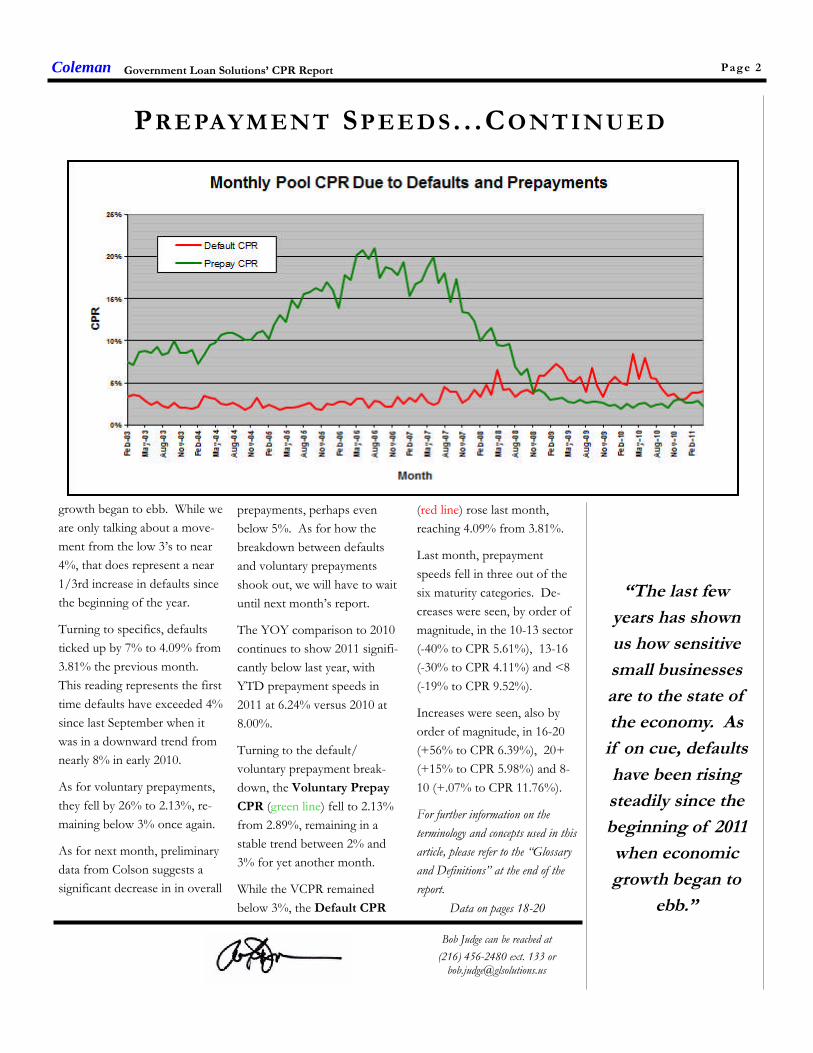
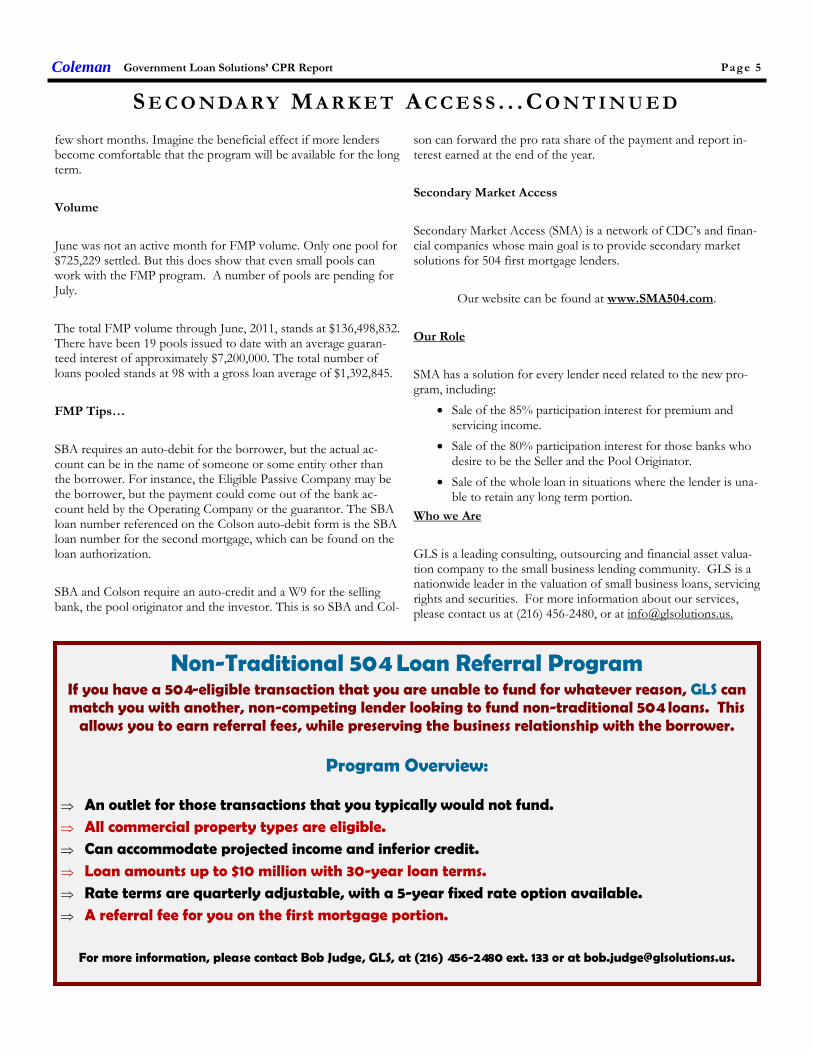
5%
95%
First Mortgage Pool ProgramThrough June, 2011
Fundings To Date
Remaining Allocation
Page 5Coleman Government Loan Solutions’ CPR Report
S E C O N DA R Y M A R K E T A C C E S S . . . C O N T I N U E D
son can forward the pro rata share of the payment and report in-terest earned at the end of the year.
Secondary Market Access
Secondary Market Access (SMA) is a network of CDC’s and finan-cial companies whose main goal is to provide secondary marketsolutions for 504 first mortgage lenders.
Our website can be found at www.SMA504.com.
Our Role
SMA has a solution for every lender need related to the new pro-gram, including:
Sale of the 85% participation interest for premium andservicing income.
Sale of the 80% participation interest for those banks whodesire to be the Seller and the Pool Originator.
Sale of the whole loan in situations where the lender is una-ble to retain any long term portion.
Who we Are
GLS is a leading consulting, outsourcing and financial asset valua-tion company to the small business lending community. GLS is anationwide leader in the valuation of small business loans, servicingrights and securities. For more information about our services,please contact us at (216) 456-2480, or at [email protected].
few short months. Imagine the beneficial effect if more lendersbecome comfortable that the program will be available for the longterm.
Volume
June was not an active month for FMP volume. Only one pool for$725,229 settled. But this does show that even small pools canwork with the FMP program. A number of pools are pending forJuly.
The total FMP volume through June, 2011, stands at $136,498,832.There have been 19 pools issued to date with an average guaran-teed interest of approximately $7,200,000. The total number ofloans pooled stands at 98 with a gross loan average of $1,392,845.
FMP Tips…
SBA requires an auto-debit for the borrower, but the actual ac-count can be in the name of someone or some entity other thanthe borrower. For instance, the Eligible Passive Company may bethe borrower, but the payment could come out of the bank ac-count held by the Operating Company or the guarantor. The SBAloan number referenced on the Colson auto-debit form is the SBAloan number for the second mortgage, which can be found on theloan authorization.
SBA and Colson require an auto-credit and a W9 for the sellingbank, the pool originator and the investor. This is so SBA and Col-
Non-Traditional 504 Loan Referral ProgramIf you have a 504-eligible transaction that you are unable to fund for whatever reason, GLS canmatch you with another, non-competing lender looking to fund non-traditional 504 loans. This
allows you to earn referral fees, while preserving the business relationship with the borrower.
Program Overview:
An outlet for those transactions that you typically would not fund.
All commercial property types are eligible.
Can accommodate projected income and inferior credit.
Loan amounts up to $10 million with 30-year loan terms.
Rate terms are quarterly adjustable, with a 5-year fixed rate option available.
A referral fee for you on the first mortgage portion.
For more information, please contact Bob Judge, GLS, at (216) 456-2480 ext. 133 or at [email protected].
Page 6Coleman Government Loan Solutions’ CPR Report
Secondary Market AccessSecondary Market AccessSecondary Market Access
Providing expertise in all areas of the new SBA 504 First Lien PoolProviding expertise in all areas of the new SBA 504 First Lien PoolProviding expertise in all areas of the new SBA 504 First Lien Pool
Guaranty program, including:Guaranty program, including:Guaranty program, including:
Pricing bids for existing loans
Pricing strategies for new loans
Accepting loan tapes for bid on 85% of eligible loans
Whole loan sale option
Assistance with becoming a Pool Originator
If you are 504 lender and wish to discuss how we can help youIf you are 504 lender and wish to discuss how we can help youIf you are 504 lender and wish to discuss how we can help you
access the 504 secondary market, please contact:access the 504 secondary market, please contact:access the 504 secondary market, please contact:
Rob Herrick, GLS, at (216) 456-2480 ext. 144 or via e-mail at
“The source for accessing the SBA 504 Secondary
Market Pooling Program.”
www.SMA504.com
Page 7Coleman Government Loan Solutions’ CPR Report
Page 8Coleman Government Loan Solutions’ CPR Report

Page 9Coleman Government Loan Solutions’ CPR Report
Page 10Coleman Government Loan Solutions’ CPR Report
THE LEGAL BEATA V O I D I N G R E PA I R S T H R O U G H P R O P E R
S E R V I C I N G
By Ethan W. Smith, Esp.
The burden of compliance with the myriad SBA regulations,
statutes and standard operating procedures can sometimes
seem daunting to SBA lenders. Often lenders focus their SBA
compliance efforts on underwriting and closing related issues -
indeed many SBA lenders have devoted a great deal of time
and resources to setting up entire SBA departments to origi-
nate, underwrite and close their SBA loans. But what happens
after the closing? Many of these same lenders will then transfer
their SBA loans to their servicing departments to be serviced
with the rest of their commercial loan portfolio. While the
SBA loans may have been properly originated, underwritten
and closed, the servicing department's unfamiliarity with the
nuances of SBA servicing requirements can lead to costly guar-
anty repairs, or in some instances, denials.
Many of the top reasons for servicing-related repairs are not
specific to SBA, and rather reflect a general weakness in a lend-
er's servicing policies and procedures. Issues such as failing to
renew a UCC lien on business personal property pursuant to
the requirements of Article 9 of the Uniform Commercial Code
(financing statements must be continued within 6 months of
their lapse), or failing to ensure that business liability and haz-
ard insurance remain in full force and effect, are not unique to
the SBA world. Yet, these issues are often the basis for recom-
mendations for repairs or denials.
Other, more SBA-specific servicing related issues that fre-
quently result in repairs include:
Lender's release or subordination of its lien on collateral
without a sufficiently documented business justification;
Lender's release of a guarantor without SBA approval
Lender's failure to monitor, and if needed, to maintain life
insurance on a key individual that subsequently dies
Lender's servicing actions that create a preference for its
non-SBA guaranteed loan(s) to a borrower, which act to
the detriment of its SBA guaranteed loans to the same
borrower (i.e.: preferred collateral positions on non-SBA
loans, preferred application of payments to conventional
financing over SBA financing, etc.).
One way for lender's to minimize their risk of repairs and denials
from servicing related actions is to make sure their servicing depart-
ments have copies of, and are familiar with, the SBA 7(a) Servicing
and Liquidation Action Matrix (the "Matrix") which can be found
here. The Matrix is designed to address the most common servicing
and liquidation related issues and to provide instruction and guidance
to lenders as to what notice to, or approval from, SBA, if any, is
required for a particular action. The most important issue to remem-
ber in using the Matrix is that even when a servicing action is delegat-
ed to the lender and does not require notice to the SBA, this does not
mean that the lender can do whatever it wants with regard to the
contemplated action. The lender must still follow prudent lending
standards and must document and justify each material servicing ac-
tion it takes. Failure to do so will expose the lender's actions to scru-
tiny by the SBA and can lead to costly repairs.
Preserve and protect your SBA guaranty through all phases of your
SBA loan and remember that a lender's obligation to comply with
SBA regulations does not end at the closing table. For more infor-
mation on SBA-related servicing issues, contact Ethan at:
[email protected] or 267-470-1186.
Page 11Coleman Government Loan Solutions’ CPR Report
GLS 7(a) Sale & Settlement Tip # 34— Not all data is created equal...
While it’s good, no, imperative, to have good intuition when it comes to evaluating loan sales, nothingreplaces fact when it comes to the data supporting post-sale accounting and the valuation of the ser-vicing assets created by the sale. Be sure to have defensible data to back up your analysis and conclu-
sions.
After all, any cash flow model is only as good as the data driving it. Solid data beyond sound modelingmethodology is one of the quickest ways to get auditors comfortable with the servicing portfolio of a
lender who sells their government guaranteed originations.
Scott Evans is a partner at GLS. Mr. Evans has over 18 years of trading experience and has been involved in the SBA secondary markets for the last eightof those years. Mr. Evans has bought, sold, settled, and securitized nearly 20,000 SBA loans and now brings some of that expertise to the CPR Report ina recurring article called Sale and Settlement Tip of the Month. The article will focus on pragmatic tips aimed at helping lenders develop a more con-
sistent sale and settlement process and ultimately deliver them the best execution possible.
Increase your premium dollars by eliminating brokerage feesand selling your SBA and USDA Loans “Investor Direct” to
Thomas USAF, America’s largest direct investor.
Contact Mike or Vasu at 404-365-2040

Page 12Coleman Government Loan Solutions’ CPR Report
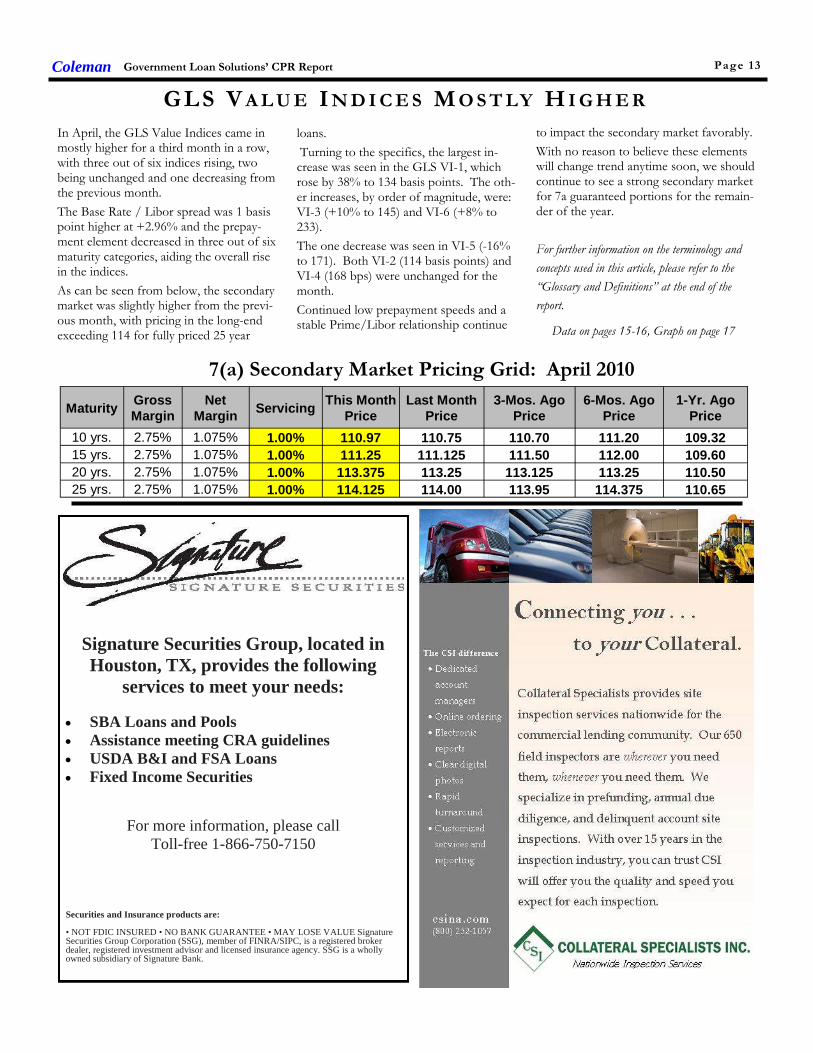
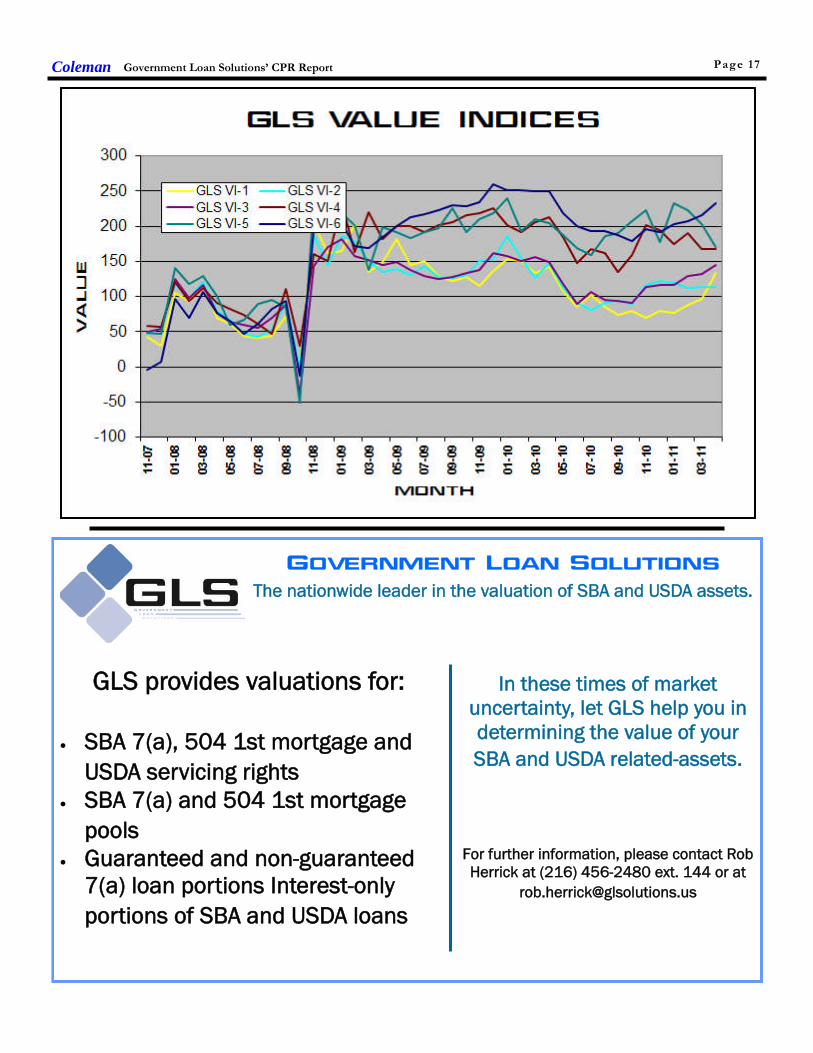
GLS V A L U E I N D I C E S M O S T LY H I G H E R
In April, the GLS Value Indices came inmostly higher for a third month in a row,with three out of six indices rising, twobeing unchanged and one decreasing fromthe previous month.
The Base Rate / Libor spread was 1 basispoint higher at +2.96% and the prepay-ment element decreased in three out of sixmaturity categories, aiding the overall risein the indices.
As can be seen from below, the secondarymarket was slightly higher from the previ-ous month, with pricing in the long-endexceeding 114 for fully priced 25 year
loans.
Turning to the specifics, the largest in-crease was seen in the GLS VI-1, whichrose by 38% to 134 basis points. The oth-er increases, by order of magnitude, were:VI-3 (+10% to 145) and VI-6 (+8% to233).
The one decrease was seen in VI-5 (-16%to 171). Both VI-2 (114 basis points) andVI-4 (168 bps) were unchanged for themonth.
Continued low prepayment speeds and astable Prime/Libor relationship continue
to impact the secondary market favorably.
With no reason to believe these elementswill change trend anytime soon, we shouldcontinue to see a strong secondary marketfor 7a guaranteed portions for the remain-der of the year.
For further information on the terminology and
concepts used in this article, please refer to the
“Glossary and Definitions” at the end of the
report.
Data on pages 15-16, Graph on page 17
Coleman Government Loan Solutions’ CPR Report Page 13
MaturityGrossMargin
NetMargin
ServicingThis Month
Price1-Yr. Ago
Price
10 yrs. 2.75% 1.075% 1.00% 110.97 109.32
15 yrs. 2.75% 1.075% 1.00% 111.25 109.60
20 yrs. 2.75% 1.075% 1.00% 113.375 110.50
25 yrs. 2.75% 1.075% 1.00% 114.125 110.65
Last MonthPrice
110.75
111.125
113.25
114.00
3-Mos. AgoPrice
110.70
111.50
113.125
113.95
6-Mos. AgoPrice
111.20
112.00
113.25
114.375
7(a) Secondary Market Pricing Grid: April 2010
Signature Securities Group, located inHouston, TX, provides the following
services to meet your needs:
SBA Loans and Pools Assistance meeting CRA guidelines USDA B&I and FSA Loans Fixed Income Securities
For more information, please callToll-free 1-866-750-7150
Securities and Insurance products are:
• NOT FDIC INSURED • NO BANK GUARANTEE • MAY LOSE VALUE SignatureSecurities Group Corporation (SSG), member of FINRA/SIPC, is a registered brokerdealer, registered investment advisor and licensed insurance agency. SSG is a whollyowned subsidiary of Signature Bank.
Government Loan Solutions’ CPR ReportColeman
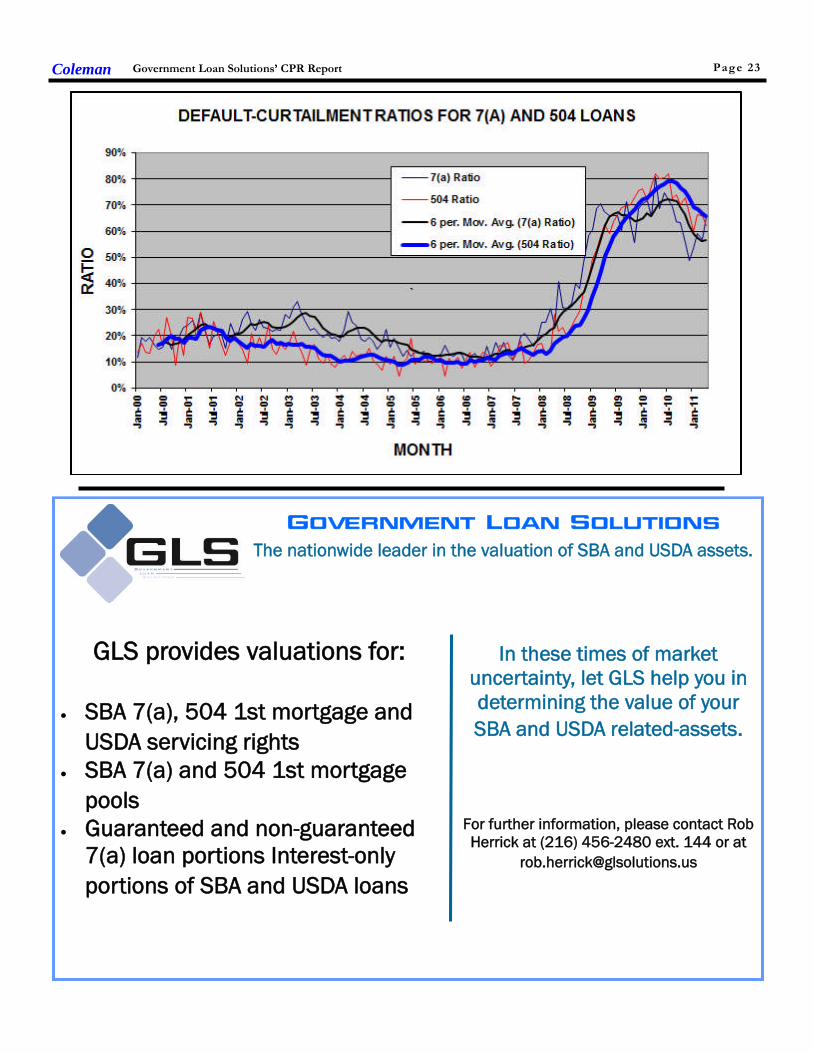
D E FA U L T - C U R TA I L M E N T R A T I O S
In our Default-Curtailment Ratios (DCR)we saw the 7a ratio exceed the 504 one forthe first time since September, 2009.
Please note that an increase in the DCRdoes not necessarily mean that the defaultrate is rising, only that the percentage ofearly curtailments attributable to defaultshas increased.
SBA 7(a) Default Ratios
After five months of sub-60% 7a DCRs,the ratio jumped above this key level, ris-ing 16% to 65.78% from 56.90% lastmonth.
A small rise in defaults, combined with asignificant decrease in the voluntary pre-payment component, led to the double-digit increase in the ratio this month.
Turning to actual dollar amounts, defaultsrose by 10% to $132 million from $120million. As for voluntary prepayments,they fell by 24% to $69 million versus $91million the previous month.
SBA 504 Default Ratios
For the 504 DCR, we recorded a 6% de-crease in the ratio to 62.09% this monthfrom 65.99% previously. Both voluntaryprepayments and defaults increased, withprepayments rising defaults by a greaterpercentage than defaults, lowering the 504DCR.
Specifically, the dollar amount of defaultsincreased by $23 million to $136 million(+20%). As for voluntary prepayments,they also rose, increasing $25 million to$83 million (+42%).
Summary
The rise in the 7a DCR comes as a bit of asurprise, after seeing 6 months of stable todeclining numbers. Next month, we’ll seeif this rise was an anomaly.
As for the 504 DCR the overall trend con-tinues to be favorable, reflecting lowerratios since the all-time high of 82% inJune of last year.
Graph on page 23
D E FA U L T R A T E R I S E S T O 5 . 9 6 %
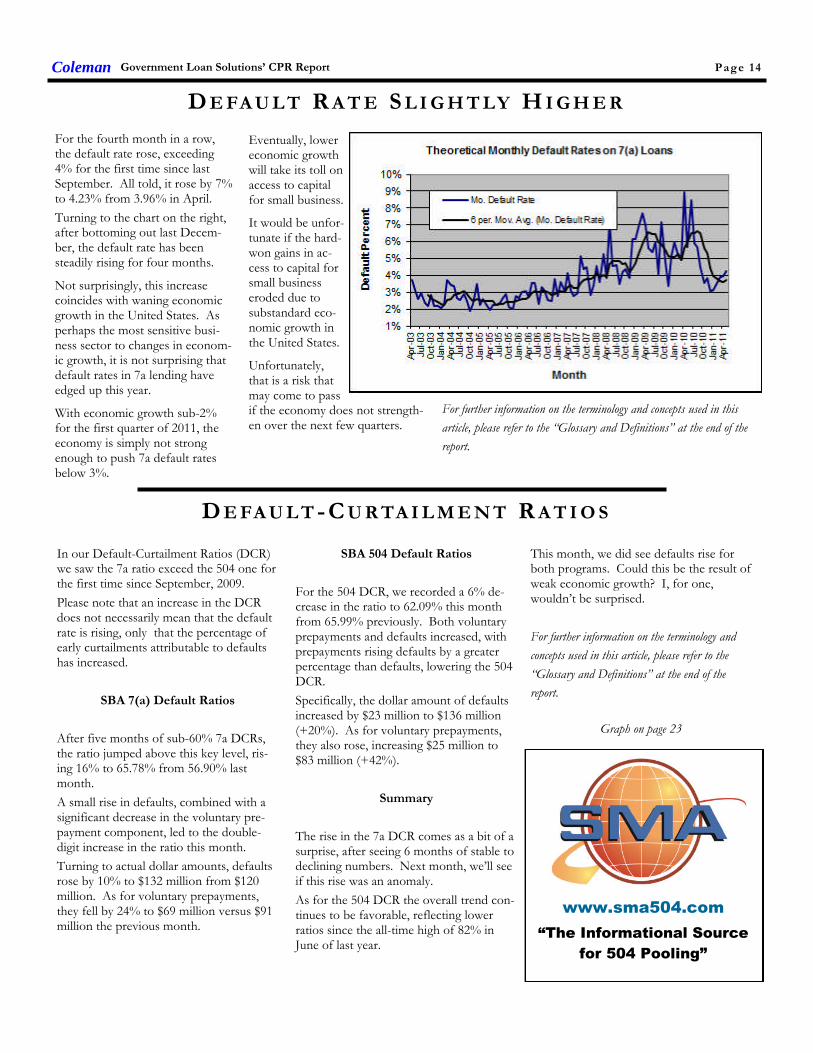
For the fourth month in a row,the default rate rose, exceeding4% for the first time since lastSeptember. All told, it rose by 7%to 4.23% from 3.96% in April.
Turning to the chart on the right,after bottoming out last Decem-ber, the default rate has beensteadily rising for four months.
Not surprisingly, this increasecoincides with waning economicgrowth in the United States. Asperhaps the most sensitive busi-ness sector to changes in econom-ic growth, it is not surprising thatdefault rates in 7a lending haveedged up this year.
With economic growth sub-2%for the first quarter of 2011, theeconomy is simply not strongenough to push 7a default ratesbelow 3%.
For further information on the terminology and concepts used in this
article, please refer to the “Glossary and Definitions” at the end of the
report.
Page 14
D E FA U L T R A T E S L I G H T LY H I G H E R
This month, we did see defaults rise forboth programs. Could this be the result ofweak economic growth? I, for one,wouldn’t be surprised.
For further information on the terminology and
concepts used in this article, please refer to the
“Glossary and Definitions” at the end of the
report.
www.sma504.com
“The Informational Source
for 504 Pooling”
Eventually, lowereconomic growthwill take its toll onaccess to capitalfor small business.
It would be unfor-tunate if the hard-won gains in ac-cess to capital forsmall businesseroded due tosubstandard eco-nomic growth inthe United States.
Unfortunately,that is a risk thatmay come to passif the economy does not strength-en over the next few quarters.
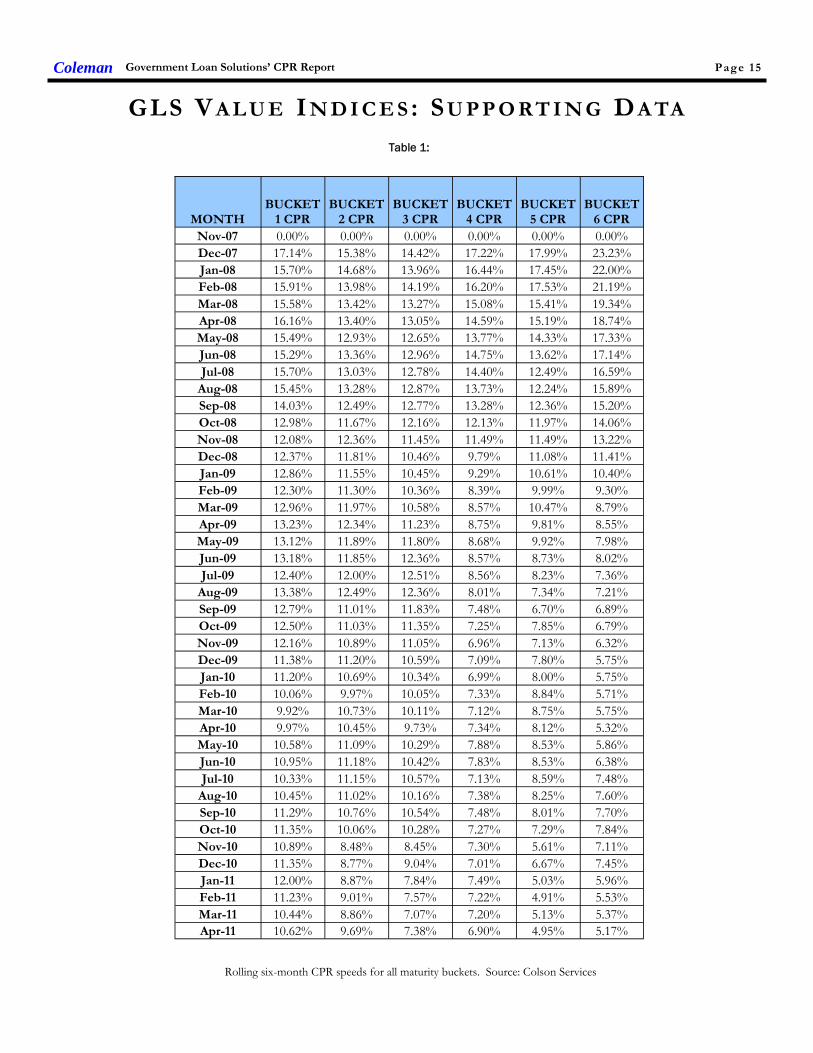
Table 1:
Rolling six-month CPR speeds for all maturity buckets. Source: Colson Services
GLS VA L U E I N D I C E S : SU P P O RT I N G DA TA
Government Loan Solutions’ CPR ReportColeman Page 15
MONTHBUCKET
1 CPRBUCKET
2 CPRBUCKET
3 CPRBUCKET
4 CPRBUCKET
5 CPRBUCKET
6 CPR
Nov-07 0.00% 0.00% 0.00% 0.00% 0.00% 0.00%
Dec-07 17.14% 15.38% 14.42% 17.22% 17.99% 23.23%
Jan-08 15.70% 14.68% 13.96% 16.44% 17.45% 22.00%
Feb-08 15.91% 13.98% 14.19% 16.20% 17.53% 21.19%
Mar-08 15.58% 13.42% 13.27% 15.08% 15.41% 19.34%
Apr-08 16.16% 13.40% 13.05% 14.59% 15.19% 18.74%
May-08 15.49% 12.93% 12.65% 13.77% 14.33% 17.33%
Jun-08 15.29% 13.36% 12.96% 14.75% 13.62% 17.14%
Jul-08 15.70% 13.03% 12.78% 14.40% 12.49% 16.59%
Aug-08 15.45% 13.28% 12.87% 13.73% 12.24% 15.89%
Sep-08 14.03% 12.49% 12.77% 13.28% 12.36% 15.20%
Oct-08 12.98% 11.67% 12.16% 12.13% 11.97% 14.06%
Nov-08 12.08% 12.36% 11.45% 11.49% 11.49% 13.22%
Dec-08 12.37% 11.81% 10.46% 9.79% 11.08% 11.41%
Jan-09 12.86% 11.55% 10.45% 9.29% 10.61% 10.40%
Feb-09 12.30% 11.30% 10.36% 8.39% 9.99% 9.30%
Mar-09 12.96% 11.97% 10.58% 8.57% 10.47% 8.79%
Apr-09 13.23% 12.34% 11.23% 8.75% 9.81% 8.55%
May-09 13.12% 11.89% 11.80% 8.68% 9.92% 7.98%
Jun-09 13.18% 11.85% 12.36% 8.57% 8.73% 8.02%
Jul-09 12.40% 12.00% 12.51% 8.56% 8.23% 7.36%
Aug-09 13.38% 12.49% 12.36% 8.01% 7.34% 7.21%
Sep-09 12.79% 11.01% 11.83% 7.48% 6.70% 6.89%
Oct-09 12.50% 11.03% 11.35% 7.25% 7.85% 6.79%
Nov-09 12.16% 10.89% 11.05% 6.96% 7.13% 6.32%
Dec-09 11.38% 11.20% 10.59% 7.09% 7.80% 5.75%
Jan-10 11.20% 10.69% 10.34% 6.99% 8.00% 5.75%
Feb-10 10.06% 9.97% 10.05% 7.33% 8.84% 5.71%
Mar-10 9.92% 10.73% 10.11% 7.12% 8.75% 5.75%
Apr-10 9.97% 10.45% 9.73% 7.34% 8.12% 5.32%
May-10 10.58% 11.09% 10.29% 7.88% 8.53% 5.86%
Jun-10 10.95% 11.18% 10.42% 7.83% 8.53% 6.38%
Jul-10 10.33% 11.15% 10.57% 7.13% 8.59% 7.48%
Aug-10 10.45% 11.02% 10.16% 7.38% 8.25% 7.60%
Sep-10 11.29% 10.76% 10.54% 7.48% 8.01% 7.70%
Oct-10 11.35% 10.06% 10.28% 7.27% 7.29% 7.84%
Nov-10 10.89% 8.48% 8.45% 7.30% 5.61% 7.11%
Dec-10 11.35% 8.77% 9.04% 7.01% 6.67% 7.45%
Jan-11 12.00% 8.87% 7.84% 7.49% 5.03% 5.96%
Feb-11 11.23% 9.01% 7.57% 7.22% 4.91% 5.53%
Mar-11 10.44% 8.86% 7.07% 7.20% 5.13% 5.37%
Apr-11 10.62% 9.69% 7.38% 6.90% 4.95% 5.17%
Page 16
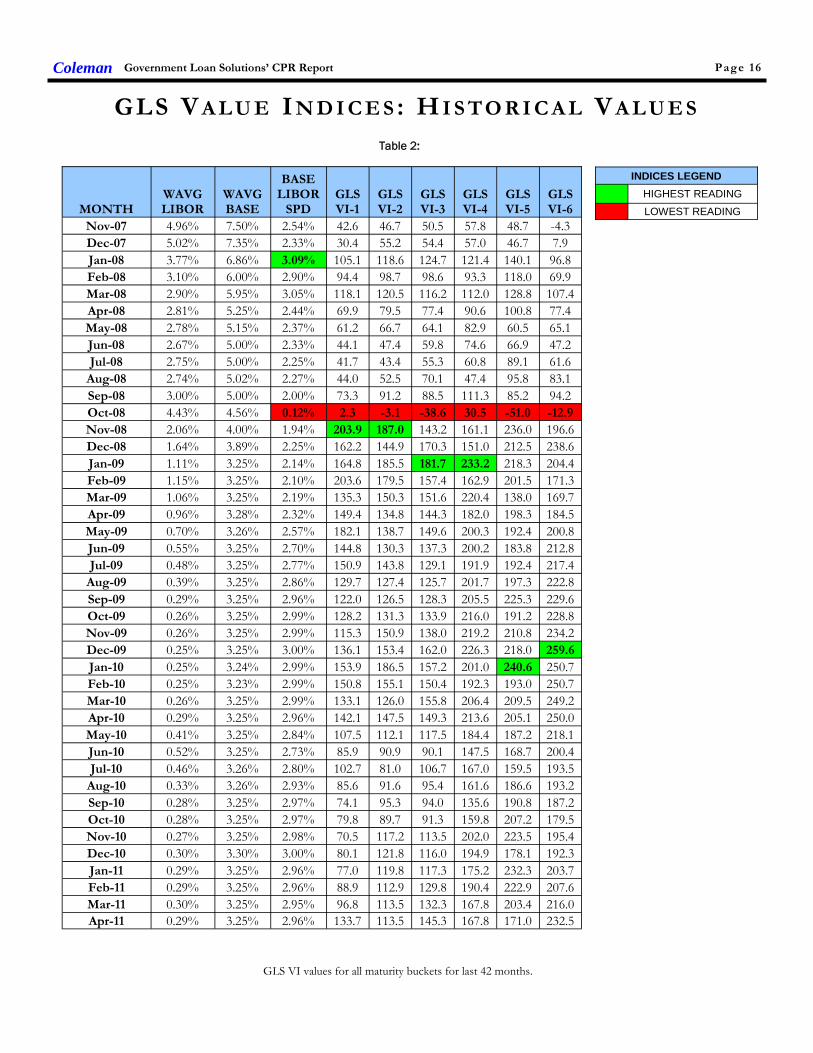
Table 2:
GLS VI values for all maturity buckets for last 42 months.
GLS VA L U E I N D I C E S : H I S TO R I C A L VA L U E S
INDICES LEGEND
HIGHEST READING
LOWEST READING
Government Loan Solutions’ CPR ReportColeman
MONTHWAVGLIBOR
WAVGBASE
BASELIBOR
SPDGLSVI-1
GLSVI-2
GLSVI-3
GLSVI-4
GLSVI-5
GLSVI-6
Nov-07 4.96% 7.50% 2.54% 42.6 46.7 50.5 57.8 48.7 -4.3
Dec-07 5.02% 7.35% 2.33% 30.4 55.2 54.4 57.0 46.7 7.9
Jan-08 3.77% 6.86% 3.09% 105.1 118.6 124.7 121.4 140.1 96.8
Feb-08 3.10% 6.00% 2.90% 94.4 98.7 98.6 93.3 118.0 69.9
Mar-08 2.90% 5.95% 3.05% 118.1 120.5 116.2 112.0 128.8 107.4
Apr-08 2.81% 5.25% 2.44% 69.9 79.5 77.4 90.6 100.8 77.4
May-08 2.78% 5.15% 2.37% 61.2 66.7 64.1 82.9 60.5 65.1
Jun-08 2.67% 5.00% 2.33% 44.1 47.4 59.8 74.6 66.9 47.2
Jul-08 2.75% 5.00% 2.25% 41.7 43.4 55.3 60.8 89.1 61.6
Aug-08 2.74% 5.02% 2.27% 44.0 52.5 70.1 47.4 95.8 83.1
Sep-08 3.00% 5.00% 2.00% 73.3 91.2 88.5 111.3 85.2 94.2
Oct-08 4.43% 4.56% 0.12% 2.3 -3.1 -38.6 30.5 -51.0 -12.9
Nov-08 2.06% 4.00% 1.94% 203.9 187.0 143.2 161.1 236.0 196.6
Dec-08 1.64% 3.89% 2.25% 162.2 144.9 170.3 151.0 212.5 238.6
Jan-09 1.11% 3.25% 2.14% 164.8 185.5 181.7 233.2 218.3 204.4
Feb-09 1.15% 3.25% 2.10% 203.6 179.5 157.4 162.9 201.5 171.3
Mar-09 1.06% 3.25% 2.19% 135.3 150.3 151.6 220.4 138.0 169.7
Apr-09 0.96% 3.28% 2.32% 149.4 134.8 144.3 182.0 198.3 184.5
May-09 0.70% 3.26% 2.57% 182.1 138.7 149.6 200.3 192.4 200.8
Jun-09 0.55% 3.25% 2.70% 144.8 130.3 137.3 200.2 183.8 212.8
Jul-09 0.48% 3.25% 2.77% 150.9 143.8 129.1 191.9 192.4 217.4
Aug-09 0.39% 3.25% 2.86% 129.7 127.4 125.7 201.7 197.3 222.8
Sep-09 0.29% 3.25% 2.96% 122.0 126.5 128.3 205.5 225.3 229.6
Oct-09 0.26% 3.25% 2.99% 128.2 131.3 133.9 216.0 191.2 228.8
Nov-09 0.26% 3.25% 2.99% 115.3 150.9 138.0 219.2 210.8 234.2
Dec-09 0.25% 3.25% 3.00% 136.1 153.4 162.0 226.3 218.0 259.6
Jan-10 0.25% 3.24% 2.99% 153.9 186.5 157.2 201.0 240.6 250.7
Feb-10 0.25% 3.23% 2.99% 150.8 155.1 150.4 192.3 193.0 250.7
Mar-10 0.26% 3.25% 2.99% 133.1 126.0 155.8 206.4 209.5 249.2
Apr-10 0.29% 3.25% 2.96% 142.1 147.5 149.3 213.6 205.1 250.0
May-10 0.41% 3.25% 2.84% 107.5 112.1 117.5 184.4 187.2 218.1
Jun-10 0.52% 3.25% 2.73% 85.9 90.9 90.1 147.5 168.7 200.4
Jul-10 0.46% 3.26% 2.80% 102.7 81.0 106.7 167.0 159.5 193.5
Aug-10 0.33% 3.26% 2.93% 85.6 91.6 95.4 161.6 186.6 193.2
Sep-10 0.28% 3.25% 2.97% 74.1 95.3 94.0 135.6 190.8 187.2
Oct-10 0.28% 3.25% 2.97% 79.8 89.7 91.3 159.8 207.2 179.5
Nov-10 0.27% 3.25% 2.98% 70.5 117.2 113.5 202.0 223.5 195.4
Dec-10 0.30% 3.30% 3.00% 80.1 121.8 116.0 194.9 178.1 192.3
Jan-11 0.29% 3.25% 2.96% 77.0 119.8 117.3 175.2 232.3 203.7
Feb-11 0.29% 3.25% 2.96% 88.9 112.9 129.8 190.4 222.9 207.6
Mar-11 0.30% 3.25% 2.95% 96.8 113.5 132.3 167.8 203.4 216.0
Apr-11 0.29% 3.25% 2.96% 133.7 113.5 145.3 167.8 171.0 232.5
Coleman Government Loan Solutions’ CPR Report Page 17
GLS provides valuations for:
SBA 7(a), 504 1st mortgage and
USDA servicing rights SBA 7(a) and 504 1st mortgage
pools Guaranteed and non-guaranteed
7(a) loan portions Interest-only
portions of SBA and USDA loans
Government Loan Solutions
The nationwide leader in the valuation of SBA and USDA assets.
In these times of marketuncertainty, let GLS help you indetermining the value of your
SBA and USDA related-assets.
For further information, please contact RobHerrick at (216) 456-2480 ext. 144 or at
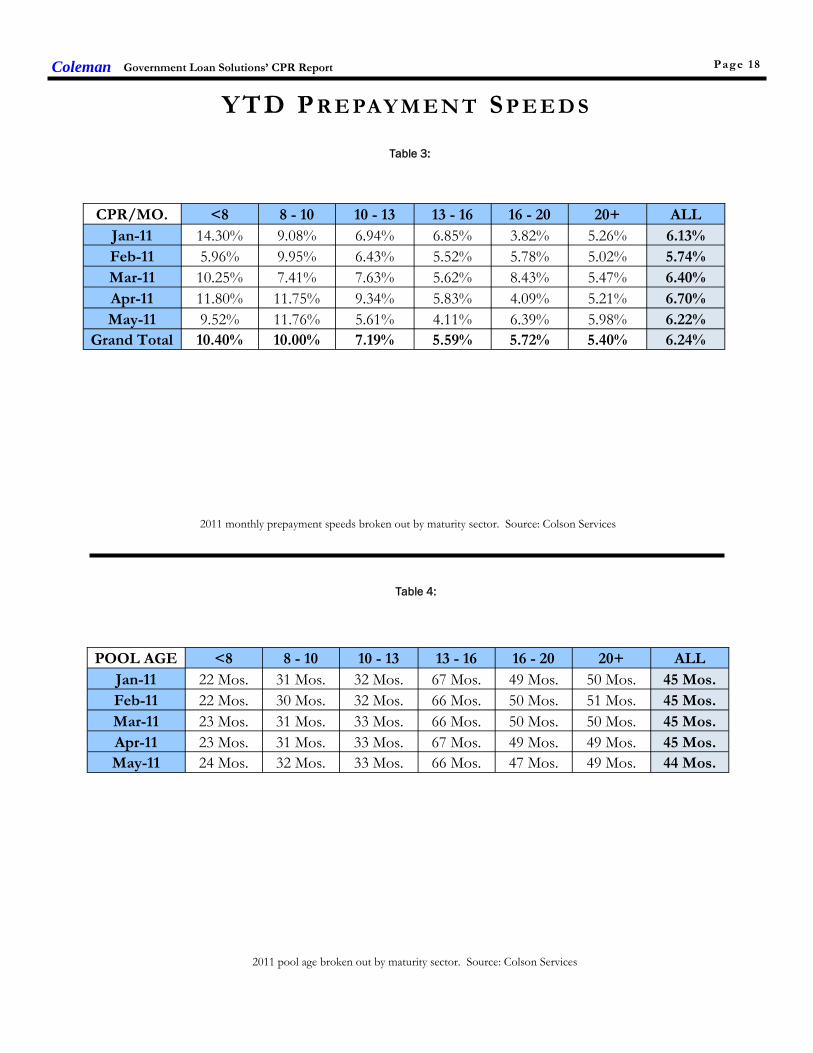
Table 3:
2011 monthly prepayment speeds broken out by maturity sector. Source: Colson Services
Table 4:
2011 pool age broken out by maturity sector. Source: Colson Services
YTD P R E PA Y M E N T S P E E D S
Coleman Government Loan Solutions’ CPR Report Page 18
CPR/MO. <8 8 - 10 10 - 13 13 - 16 16 - 20 20+ ALL
Jan-11 14.30% 9.08% 6.94% 6.85% 3.82% 5.26% 6.13%
Feb-11 5.96% 9.95% 6.43% 5.52% 5.78% 5.02% 5.74%
Mar-11 10.25% 7.41% 7.63% 5.62% 8.43% 5.47% 6.40%
Apr-11 11.80% 11.75% 9.34% 5.83% 4.09% 5.21% 6.70%
May-11 9.52% 11.76% 5.61% 4.11% 6.39% 5.98% 6.22%
Grand Total 10.40% 10.00% 7.19% 5.59% 5.72% 5.40% 6.24%
POOL AGE <8 8 - 10 10 - 13 13 - 16 16 - 20 20+ ALL
Jan-11 22 Mos. 31 Mos. 32 Mos. 67 Mos. 49 Mos. 50 Mos. 45 Mos.
Feb-11 22 Mos. 30 Mos. 32 Mos. 66 Mos. 50 Mos. 51 Mos. 45 Mos.
Mar-11 23 Mos. 31 Mos. 33 Mos. 66 Mos. 50 Mos. 50 Mos. 45 Mos.
Apr-11 23 Mos. 31 Mos. 33 Mos. 67 Mos. 49 Mos. 49 Mos. 45 Mos.
May-11 24 Mos. 32 Mos. 33 Mos. 66 Mos. 47 Mos. 49 Mos. 44 Mos.

Page 19
2011 YTD CPR by maturity and age bucket. Source: Colson Services
Table 5:
Y E A R -T O -DA T E CPR DA TA
Government Loan Solutions’ CPR ReportColeman
< 8 BY AGE 0-12 Mos. 13-24 Mos. 25-36 Mos. 37-48 Mos. 48+ Mos.Jan-11 8.14% 24.87% 18.55% 10.61% 14.45%Feb-11 6.33% 2.69% 5.40% 4.49% 12.63%Mar-11 10.15% 5.53% 11.73% 7.38% 19.55%Apr-11 5.53% 13.80% 17.17% 7.29% 21.62%May-11 14.98% 4.94% 12.68% 4.43% 6.04%
Grand Total 8.91% 10.22% 13.30% 6.91% 15.11%
10-13 BY AGE 0-12 Mos. 13-24 Mos. 25-36 Mos. 37-48 Mos. 48+ Mos.Jan-11 4.90% 6.31% 12.35% 6.54% 5.14%Feb-11 4.49% 10.85% 8.56% 4.39% 5.93%Mar-11 7.41% 10.03% 9.38% 7.84% 4.86%Apr-11 8.89% 8.78% 13.52% 9.57% 7.32%May-11 4.50% 7.16% 7.62% 6.84% 3.52%
Grand Total 6.05% 8.59% 10.34% 7.04% 5.34%
16-20 BY AGE 0-12 Mos. 13-24 Mos. 25-36 Mos. 37-48 Mos. 48+ Mos.Jan-11 0.00% 7.24% 8.01% 2.83% 2.85%Feb-11 0.00% 4.73% 9.77% 14.87% 1.78%Mar-11 3.22% 4.01% 19.91% 8.32% 7.84%Apr-11 0.00% 7.38% 4.96% 2.08% 5.51%May-11 4.45% 0.00% 14.05% 5.83% 7.33%
Grand Total 1.72% 4.67% 11.48% 6.95% 5.11%
Page 20
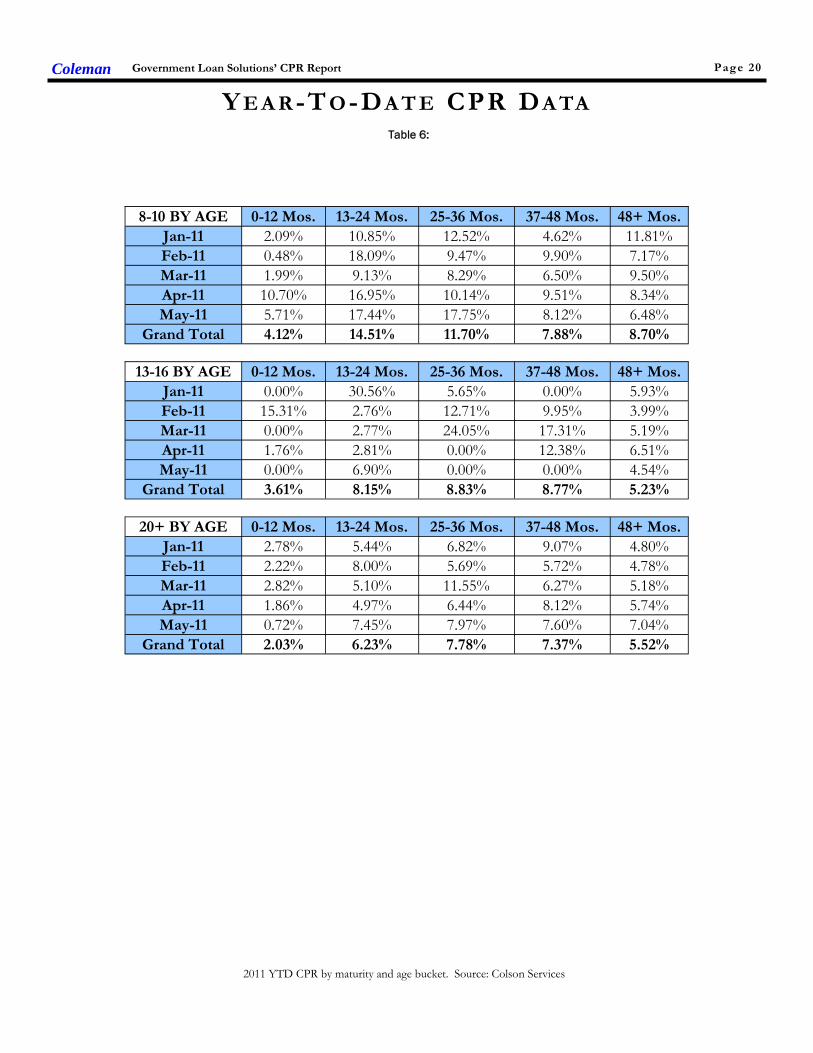
2011 YTD CPR by maturity and age bucket. Source: Colson Services
Table 6:
Y E A R -T O -DA T E CPR DA TA
Government Loan Solutions’ CPR ReportColeman
8-10 BY AGE 0-12 Mos. 13-24 Mos. 25-36 Mos. 37-48 Mos. 48+ Mos.Jan-11 2.09% 10.85% 12.52% 4.62% 11.81%Feb-11 0.48% 18.09% 9.47% 9.90% 7.17%Mar-11 1.99% 9.13% 8.29% 6.50% 9.50%Apr-11 10.70% 16.95% 10.14% 9.51% 8.34%May-11 5.71% 17.44% 17.75% 8.12% 6.48%
Grand Total 4.12% 14.51% 11.70% 7.88% 8.70%
13-16 BY AGE 0-12 Mos. 13-24 Mos. 25-36 Mos. 37-48 Mos. 48+ Mos.Jan-11 0.00% 30.56% 5.65% 0.00% 5.93%Feb-11 15.31% 2.76% 12.71% 9.95% 3.99%Mar-11 0.00% 2.77% 24.05% 17.31% 5.19%Apr-11 1.76% 2.81% 0.00% 12.38% 6.51%May-11 0.00% 6.90% 0.00% 0.00% 4.54%
Grand Total 3.61% 8.15% 8.83% 8.77% 5.23%
20+ BY AGE 0-12 Mos. 13-24 Mos. 25-36 Mos. 37-48 Mos. 48+ Mos.Jan-11 2.78% 5.44% 6.82% 9.07% 4.80%Feb-11 2.22% 8.00% 5.69% 5.72% 4.78%Mar-11 2.82% 5.10% 11.55% 6.27% 5.18%Apr-11 1.86% 4.97% 6.44% 8.12% 5.74%May-11 0.72% 7.45% 7.97% 7.60% 7.04%
Grand Total 2.03% 6.23% 7.78% 7.37% 5.52%
Coleman Government Loan Solutions’ CPR Report Page 21
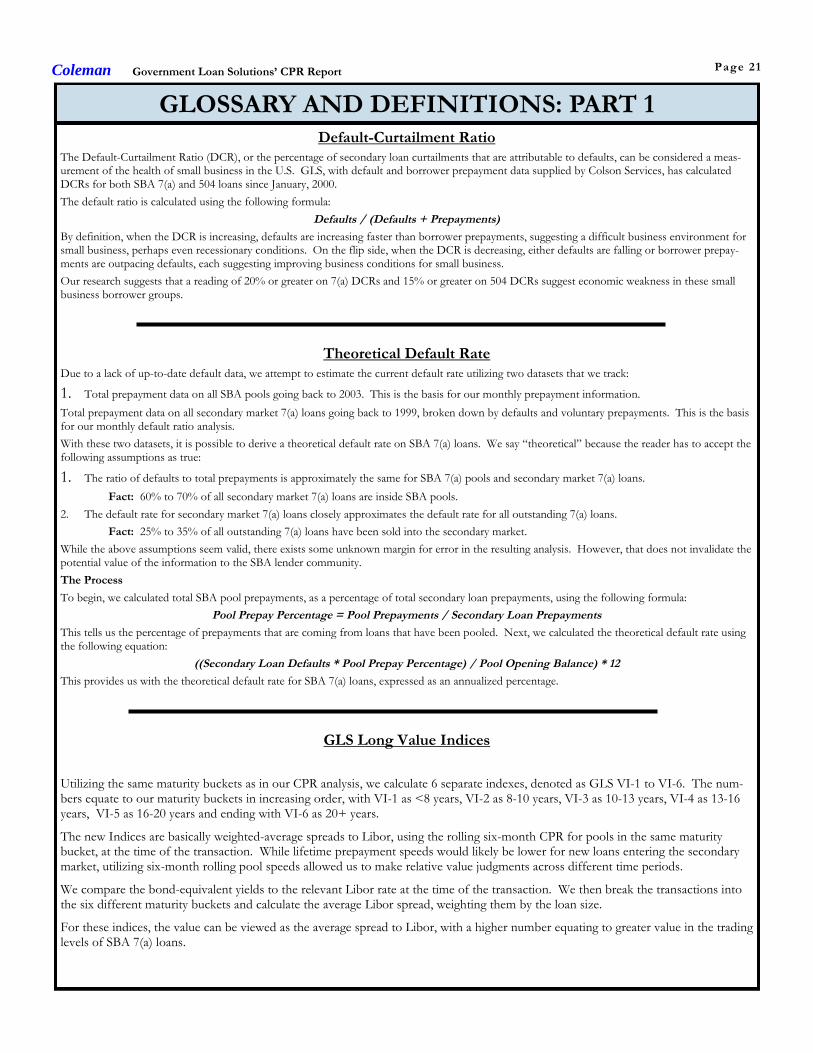
GLOSSARY AND DEFINITIONS: PART 1Default-Curtailment Ratio
The Default-Curtailment Ratio (DCR), or the percentage of secondary loan curtailments that are attributable to defaults, can be considered a meas-urement of the health of small business in the U.S. GLS, with default and borrower prepayment data supplied by Colson Services, has calculatedDCRs for both SBA 7(a) and 504 loans since January, 2000.
The default ratio is calculated using the following formula:
Defaults / (Defaults + Prepayments)
By definition, when the DCR is increasing, defaults are increasing faster than borrower prepayments, suggesting a difficult business environment forsmall business, perhaps even recessionary conditions. On the flip side, when the DCR is decreasing, either defaults are falling or borrower prepay-ments are outpacing defaults, each suggesting improving business conditions for small business.
Our research suggests that a reading of 20% or greater on 7(a) DCRs and 15% or greater on 504 DCRs suggest economic weakness in these smallbusiness borrower groups.
Theoretical Default RateDue to a lack of up-to-date default data, we attempt to estimate the current default rate utilizing two datasets that we track:
1. Total prepayment data on all SBA pools going back to 2003. This is the basis for our monthly prepayment information.
Total prepayment data on all secondary market 7(a) loans going back to 1999, broken down by defaults and voluntary prepayments. This is the basisfor our monthly default ratio analysis.
With these two datasets, it is possible to derive a theoretical default rate on SBA 7(a) loans. We say “theoretical” because the reader has to accept thefollowing assumptions as true:
1. The ratio of defaults to total prepayments is approximately the same for SBA 7(a) pools and secondary market 7(a) loans.
Fact: 60% to 70% of all secondary market 7(a) loans are inside SBA pools.
2. The default rate for secondary market 7(a) loans closely approximates the default rate for all outstanding 7(a) loans.
Fact: 25% to 35% of all outstanding 7(a) loans have been sold into the secondary market.
While the above assumptions seem valid, there exists some unknown margin for error in the resulting analysis. However, that does not invalidate thepotential value of the information to the SBA lender community.
The Process
To begin, we calculated total SBA pool prepayments, as a percentage of total secondary loan prepayments, using the following formula:
Pool Prepay Percentage = Pool Prepayments / Secondary Loan Prepayments
This tells us the percentage of prepayments that are coming from loans that have been pooled. Next, we calculated the theoretical default rate usingthe following equation:
((Secondary Loan Defaults * Pool Prepay Percentage) / Pool Opening Balance) * 12
This provides us with the theoretical default rate for SBA 7(a) loans, expressed as an annualized percentage.
GLS Long Value Indices
Utilizing the same maturity buckets as in our CPR analysis, we calculate 6 separate indexes, denoted as GLS VI-1 to VI-6. The num-bers equate to our maturity buckets in increasing order, with VI-1 as <8 years, VI-2 as 8-10 years, VI-3 as 10-13 years, VI-4 as 13-16years, VI-5 as 16-20 years and ending with VI-6 as 20+ years.
The new Indices are basically weighted-average spreads to Libor, using the rolling six-month CPR for pools in the same maturitybucket, at the time of the transaction. While lifetime prepayment speeds would likely be lower for new loans entering the secondarymarket, utilizing six-month rolling pool speeds allowed us to make relative value judgments across different time periods.
We compare the bond-equivalent yields to the relevant Libor rate at the time of the transaction. We then break the transactions intothe six different maturity buckets and calculate the average Libor spread, weighting them by the loan size.
For these indices, the value can be viewed as the average spread to Libor, with a higher number equating to greater value in the tradinglevels of SBA 7(a) loans.
GLOSSARY AND DEFINITIONS: PART 2Prepayment Calculations
SBA Pool prepayment speeds are calculated using the industry convention of Conditional Prepayment Rate, or CPR. CPR is the an-nualized percentage of the outstanding balance of a pool that is expected to prepay in a given period. For example, a 10% CPR sug-gests that 10% of the current balance of a pool will prepay each year.
When reporting prepayment data, we break it into seven different original maturity categories: <8 years, 8-10 years, 10-13 years, 13-16years, 16-20 years and 20+ years. Within these categories we provide monthly CPR and YTD values.
In order to get a sense as to timing of prepayments during a pool’s life, we provide CPR for maturity categories broken down by fivedifferent age categories: 0-12 months, 13-24 months, 25-36 months, 37-48 months and 48+ months.
As to the causes of prepayments, we provide a graph which shows prepayment speeds broken down by voluntary borrower prepay-ment speeds, denoted VCPR and default prepayment speeds, denoted as DCPR. The formula for Total CPR is as follows:
Total Pool CPR = VCPR + DCPR
SBA Libor Base RateThe SBA Libor Base Rate is set on the first business day of the month utilizing one-month LIBOR, as published in a national financialnewspaper or website, plus 3% (300 basis points). The rate will be rounded to two digits with .004 being rounded down and .005 be-ing rounded up.
Please note that the SBA’s maximum 7(a) interest rates continue to apply to SBA base rates: Lenders may charge up to 2.25% abovethe base rate for maturities under seven years and up to 2.75% above the base rate for maturities of seven years or more, with rates2% higher for loans of $25,000 or less and 1% higher for loans between $25,000 and $50,000. (Allowable interest rates are slightlyhigher for SBAExpress loans.)
Risk TypesThe various risk types that impact SBA pools are the following:
Basis Risk: The risk of unexpected movements between two indices. The impact of this type of risk was shown in the decrease inthe Prime/Libor spread experienced in 2007 and 2008.
Prepayment Risk: The risk of principal prepayments due to borrower voluntary curtailments and defaults. Overall prepayments areexpressed in CPR, or Conditional Prepayment Rate.
Interest Rate Risk: The risk of changes in the value of an interest-bearing asset due to movements in interest rates. For pools withmonthly or quarterly adjustments, this risk is low.
Credit Risk: Losses experienced due to the default of collateral underlying a security. Since SBA loans and pools are guaranteed bythe US government, this risk is very small.
Secondary Market First Lien Position 504 Loan Pool Guarantee ProgramAs part of the American Recovery and Reinvestment Act (AKA the Stimulus Bill), Congress authorized the SBA to create a temporaryprogram that provides a guarantee on an eligible pool of SBA 504 first liens. The program was authorized for a period of two yearsfrom the date of bill passage – February, 2009. The eligibility of each loan is dependent on the date of the SBA Debenture funding.To be eligible, the Debenture must have been funded on or after February 17, 2009, and prior to February 16, 2011. The total guar-antee allocation is $3 Billion. HR 5297 provides for a two-year extension from the first pooling month.
The SBA announced that they will begin issuing the first pool guarantees in September, 2010 for early October settlement.
For the purposes of the program, a pool is defined as 2 or more loans. A pool must be either fixed (for life) or adjustable (any periodadjustment including 5 or 10 years). If the pool is comprised of adjustable rate loans, all loans must have the same base rate (e.g.Prime, LIBOR, LIBOR Swaps, FHLB, etc.). Finally, each loan must be current for the lesser of 6 months or from the time of loanfunding. Congress mandated that this be a zero subsidy program to the SBA (and the US taxpayer). The SBA has determined theprogram cost (management and expected losses) can be covered by an ongoing subsidy fee of .167%.
Coleman Government Loan Solutions’ CPR Report Page 22
Coleman Government Loan Solutions’ CPR Report Page 23
GLS provides valuations for:
SBA 7(a), 504 1st mortgage and
USDA servicing rights SBA 7(a) and 504 1st mortgage
pools Guaranteed and non-guaranteed
7(a) loan portions Interest-only
portions of SBA and USDA loans
Government Loan Solutions
The nationwide leader in the valuation of SBA and USDA assets.
In these times of marketuncertainty, let GLS help you indetermining the value of your
SBA and USDA related-assets.
For further information, please contact RobHerrick at (216) 456-2480 ext. 144 or at
Powered By:
www.glsolutions.us
Government Loan Solutions’CPR Report is a monthly elec-tronic newsletter published by
Coleman Publishing.
The opinions, unless otherwisestated, are exclusively those of
the editorial staff.
This newsletter is not to bereproduced or distributed inany form or fashion, withoutthe express written consent ofColeman or Government Loan
Solutions.
Government Loan Solutions’CPR Report is distributed in
pdf format via e-mail. Spread-sheets relating to the presenteddata are available to paid sub-
scribers upon request.
The subscription to the Gov-ernment Loan Solutions’ “CPRReport” is free to all members
of the SBA Community.
To subscribe, please contactColeman at (800) 617-1380 or
via email at:[email protected]
Partners
Scott Evans
Bob Judge
Rob Herrick
Coleman Government Loan Solutions’ CPR Report Page 24
812 Huron RoadCleveland, OH 44115
Government Loan Solut ions
Phone: (216) 456-2480Fax: (216) 456-2481Web Site: www.glsolutions.usE-mail: [email protected]
Government Loan Solutions, Inc. (GLS) was founded by three former Bond Traders in
Cleveland, OH. Scott Evans, Rob Herrick and Bob Judge possess a combined 70 years experi-
ence in the institutional fixed income markets, 40 of which are in the loan securitization business.
GLS formally began operations in January, 2007. Our mission is as follows:
“The purpose of Government Loan Solutions is to bring greater efficiency, productivity
and transparency to the financial markets. Through the use of proprietary technology, we
intend to aid lenders in all aspects of their small business lending, help loan securitizers be
more productive in their operational procedures and provide quality research to the investor
community .”
Services available include:
Lenders:
Manage loan sales to the secondary market
Process loan settlements via our electronic platform, E-Settle
Third-Party servicing and non-guaranteed asset valuation
Model Validation
Specialized research projects
Mortgage Servicing Valuation
Loan Securitizers:
Manage loan settlements and pool formation
Loan and IO accounting
Loan, Pool and IO Mark-To-Market
Specialized research projects
Institutional Investors:
Loan, Pool, and IO Mark-To-Market
Specialized research projects
Portfolio consulting
For additional information regarding our products and capabilities, please contact us at:
Phone: (216)456-2480 E-mail at: [email protected] web: www.glsolutions.us
EDITORIAL DISCLAIMER
DISCLAIMER OF WARRANTIES – GOVERNMENT LOAN SOLUTIONS (GLS) MAKES NO REPRESENTATIONS OR WARRANTIES REGARD-ING THE ACCURACY, RELIABILITY OR COMPLETENESS OF THE CONTENT OF THIS REPORT. TO THE EXTENT PERMISSIBLE BY LAW,GLS DISCLAIMS ALL WARRANTIES, EXPRESS OR IMPLIED, INCLUDING BUT NOT LIMITED TO IMPLIED WARRANTIES OF MERCHANT-ABILITY AND FITNESS FOR A PARTICULAR PURPOSE.
Limitation of Liability - GLS shall not be liable for damages of any kind, including without limitation special or consequential damages, arising outof your use of, or reliance upon, this publication or the content hereof.
This Report may contain advice, opinions, and statements of various information providers and content providers. GLS does not represent orendorse the accuracy or reliability of any advice, opinion, statement or other information provided by any information provider or content provider,or any user of this Report or other person or entity. Reliance upon any such opinion, advice, statement, or other information shall also be at yourown risk.
Prior to the execution of a purchase or sale or any security or investment, you are advised to consult with investment professionals, as appropri-ate, to verify pricing and other information. Neither GLS, its information providers or content providers shall have any liability for investmentdecisions based upon, or the results obtained from, the information provided. Neither GLS, its information providers or content providers guaran-tee or warrant the timeliness, sequence, accuracy, or completeness of any such information. Nothing contained in this Report is intended to be,nor shall it be construed as, investment advice.
CPR Report Staff:
Robert E. Judge II, Production Assistant


![LWK 0-11 B4 - Startseite - [WSA Berlin] · ugm tca tem sba acm smm smm acm aam aam sba agm agm cbm qrm sbm sba sbm tma sba psm tma tca tma tcm sba pda sba sbm sbm sba tcm ara tmm](https://img.dokumen.tips/doc/110x75/5e04232e2810341c1c798ad3/lwk-0-11-b4-startseite-wsa-berlin-ugm-tca-tem-sba-acm-smm-smm-acm-aam-aam.jpg)