Embed Size (px)
Citation preview

Coleman
Bob Judge, Government Loan Solutions, Editor
Bob Judge is a partner atGovernment Loan Solutions.
Government Loan Solutions is aprovider of valuation services, pre-payment analytics and operationalsupport for the SBA marketplace.
Bob has 25 years of experience inthe fixed income markets. He holdsa B.A. in Economics from VassarCollege and an M.B.A. in Financefrom NYU Stern School of Busi-ness.
Government Loan Solutions’ CPR ReportProviding the most detailed monthly SBA 7(a) and 504 prepayment, default and market information
© 2011 Coleman and Government Loan Solutions. All Rights Reserved.
S MA U P D A T E : 504 R E F I N A N C E
E L I G I B I L I T Y C H A N G E D
By Jordan Blanchard
Volume
The total FMP volume throughFebruary, 2011, stands at$110,764,135. There have been12 pools issued to date with anaverage of just over $9,000,000per pool.
February’s volume was$18,479,352 comprised of 2pools. Pool sizes were$13.64MM and $4.83MM.
Continued good news
on the prepayment front
was seen in February,
with overall prepayments
once again dipping below
6%, falling 6.28% to
5.74% last month.
As we have witnessed
over much of the past 12
months, prepayment
speeds are at all time lows
and have only exceeded
8% once since last July.
For the fourth month in
a row, the Default CPR
remained below 4%,
while the voluntary pre-
pay CPR stayed below
3%. With defaults con-
tinuing to trend down
while voluntary prepay-
ments remain in the 3%
range, overall prepay-
ments should remain well
below the 10% level for
the foreseeable future.
Turning to specifics, de-
faults ticked up by 2% to
3.06% from 2.99% the
previous month. Once
again, defaults have pro-
vided additional evidence
that they are decreasing
Continued on page 2
With over $2.8B remaining,allocation is not an issue at thistime.
Refinance
On Tuesday, March 29, SBAissued a press release revampingthe eligibility requirements forthe new SBA 504 refinanceprogram. The SBA removedrequirement for the debt to berefinanced to be due by12/31/12. As of now, there isno maturity date requirement;
however, SBA still has to issuespecific guidelines, so a maturitydate could be imposed. Buteven if a date is imposed, it isexpected to be many years in
Continued on page 4
Volume 5, Issue #3
P R E PA Y M E N T S P E E D S F A L L
B E L OW 6%
March, 2011
Special points of interest:
• Prepayments Go Below 6%
• SMA Update: 504 Refinance
• Default Rate Rises Slightly
• Value Indices Mixed
I N S I D E T H I S I S S U E :
Prepayment Speeds 1-2, 17-18
SMA 1, 4-8
Sale & Settle Tip 10
Value Indices 12, 14-16
Default Rate 13
Default Curtailment Ratios 13 & 21
The Legal Beat 9
www.sma504.com
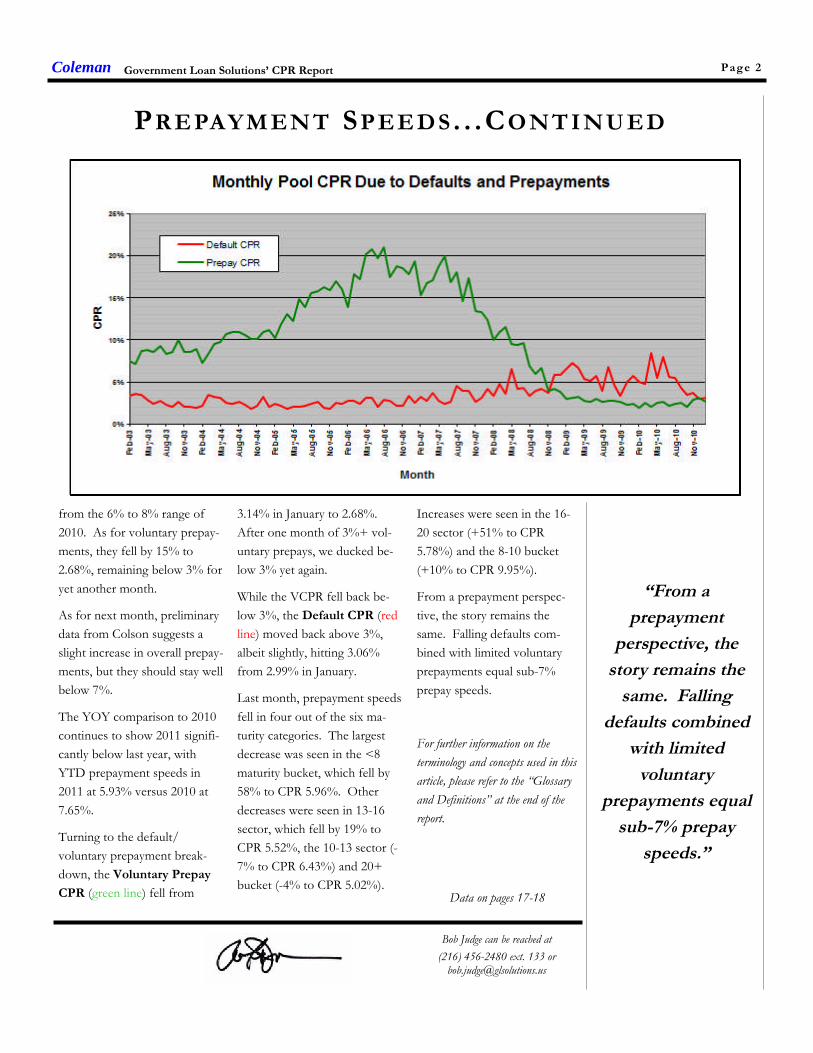
Increases were seen in the 16-
20 sector (+51% to CPR
5.78%) and the 8-10 bucket
(+10% to CPR 9.95%).
From a prepayment perspec-
tive, the story remains the
same. Falling defaults com-
bined with limited voluntary
prepayments equal sub-7%
prepay speeds.
For further information on the
terminology and concepts used in this
article, please refer to the “Glossary
and Definitions” at the end of the
report.
Coleman
Bob Judge can be reached at
(216) 456-2480 ext. 133 [email protected]
“From a
prepayment
perspective, the
story remains the
same. Falling
defaults combined
with limited
voluntary
prepayments equal
sub-7% prepay
speeds.”
Data on pages 17-18
Government Loan Solutions’ CPR Report
from the 6% to 8% range of
2010. As for voluntary prepay-
ments, they fell by 15% to
2.68%, remaining below 3% for
yet another month.
As for next month, preliminary
data from Colson suggests a
slight increase in overall prepay-
ments, but they should stay well
below 7%.
The YOY comparison to 2010
continues to show 2011 signifi-
cantly below last year, with
YTD prepayment speeds in
2011 at 5.93% versus 2010 at
7.65%.
Turning to the default/
voluntary prepayment break-
down, the Voluntary Prepay
CPR (green line) fell from
3.14% in January to 2.68%.
After one month of 3%+ vol-
untary prepays, we ducked be-
low 3% yet again.
While the VCPR fell back be-
low 3%, the Default CPR (red
line) moved back above 3%,
albeit slightly, hitting 3.06%
from 2.99% in January.
Last month, prepayment speeds
fell in four out of the six ma-
turity categories. The largest
decrease was seen in the <8
maturity bucket, which fell by
58% to CPR 5.96%. Other
decreases were seen in 13-16
sector, which fell by 19% to
CPR 5.52%, the 10-13 sector (-
7% to CPR 6.43%) and 20+
bucket (-4% to CPR 5.02%).
Page 2
PR E PAYM EN T SP EE DS . . .CO NT I NU ED

Page 3Coleman Government Loan Solutions’ CPR Report
Page 4Coleman Government Loan Solutions’ CPR Report
5% interest in the loan for the life of the loan. Since this is a loanon the Pool Originator’s books, a loan package must be deliveredand analyzed. If the loan information is dated, the Pool Originatormay, and probably will, ask for updated financial information.
Beyond the loan package, the Seller must insure that the paymentdate is on the first of the month. This is a program requirementand is not negotiable. If the payment date is not on the first of themonth, a Change-In-Terms agreement must be created and execut-ed by the borrower. Borrowers are not always cooperative, so suf-ficient time must be allocated to negotiate with the borrower.
The borrower must sign the Colson auto debit form which allowsColson to deduct the monthly payment. A bank auto debit form isnot sufficient as that only allows the bank, and not Colson, to de-duct the payment. In addition, Colson will request a W9 from theborrower so that Colson can report the interest paid at the end ofthe year.
Colson will also need the following from the selling bank:
Form 2401
Copy of note with original legend documenting that 85% ofthe loan has been sold.
An auto credit form so that Colson knows which account theSellers portion of the payment plus monthly servicing shouldbe directed to.
A W9 form from the bank so that Colson can report interestreceived.
Most Pool Originators will request that all of the required loan andSeller information be delivered by the end of the month precedingpool settlement. This is necessary so that Pool Originators havesufficient time to deliver the pool information to Colson, and tocomplete the data entry required by Colson prior to pool settle-ment.
the future, opening up financing for those affected smallbusiness borrowers looking to lock in today’s low rateswith the 504 program.
One misperception of the 504 refinance program is thatthe resulting new first mortgage cannot be sold throughthe FMP program. That is not the case. If a bank refi-nances its own debt, the bank cannot then sell the firstthrough the FMP program; however, if a bank (or non-bank lender) refinances another lender’s conventionaldebt, the first mortgage is eligible to sell through theFMP program. And a bank can always elect to sell a newfirst mortgage as a whole loan to Morgan Stanley orZions, regardless if it is their own debt or another lend-er’s debt that is being refinanced.
The refinance rules have been published extensively, but here is aquick refresher:
Only conventional debt on owner occupied property is eligibleto be refinanced
Owner occupancy is defined 51% or greater
Debt with any sort of federal guaranty is not eligible (7A, 504,B&I, Industrial Development Bond, etc.)
The maximum LTV is 90% overall – either on the subjectproperty or the subject property plus additional collateral(residence, other commercial property, possibly equipment,cash, etc.)
The debt being refinanced must be at least two years old
The debt must have been current for at least the last 12months
Matured construction or other loans are not eligible becausethey do not meet the definition of current (to be determined ifthis requirement remains in the new rules release)
The resulting first mortgage minimum loan amount must be atleast 50% of the appraised value (project costs)
If there are multiple loans on the property, all must qualifyand be considered eligible to be paid off with 504 refinanceproceeds
Pool Settlement Timing & Documentation
First mortgage Sellers should be aware of the long lead time neces-sary to sell a first mortgage to a Pool Originator. Many Sellers aresurprised how much information is required to sell a loan.
The process starts with a complete loan package being delivered tothe Pool Originator. The Pool Originator requests essentially thesame package the bank or CDC used to approve the loan. This isdue to the fact that the Pool Originator takes on an unguaranteed Continued on next page
S E C O N DA R Y M A R K E T A C C E S S . . . C O N T I N U E D
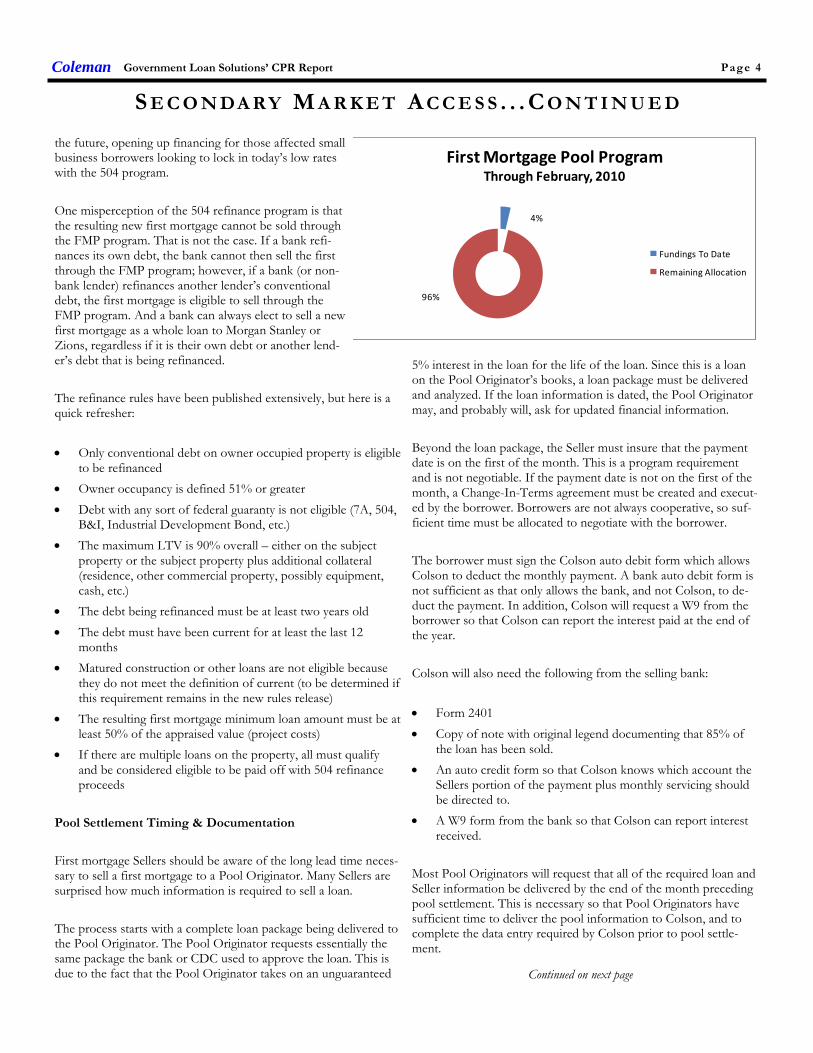
4%
96%
First Mortgage Pool ProgramThrough February, 2010
Fundings To Date
Remaining Allocation

Page 5Coleman Government Loan Solutions’ CPR Report
S E C O N DA R Y M A R K E T A C C E S S . . . C O N T I N U E D
Sale of the 80% participation interest for those banks whodesire to be the Seller and the Pool Originator.
Sale of the whole loan in situations where the lender is una-ble to retain any long term portion.
Who we Are
GLS is a leading consulting, outsourcing and financial asset valua-tion company to the small business lending community. GLS is anationwide leader in the valuation of small business loans, servicingrights and securities. For more information about our services,please contact us at (216) 456-2480, or at [email protected].
Pools do not settle prior to the 15th of the month. This is to insurethat all the payments due on the first have cleared appropriately.Colson will generally require that pools settle prior to about the23rd of each month. So there is about a one week period wherepools must settle.
FMP Tips…
Premiums vary by pool size. A Pool Originator with a large poolwill be able to pay more for a loan with the same characteristicsthan a Pool Originator with a smaller pool. Seek out Pool Origina-tors that are forming larger pools. Need help? Call Bob or Jordan.
Secondary Market Access
Secondary Market Access (SMA) is a network of CDC’s and finan-cial companies whose main goal is to provide secondary marketsolutions for 504 first mortgage lenders.
Our website can be found at www.SMA504.com.
Our Role
SMA has a solution for every lender need related to the new pro-gram, including:
Sale of the 85% participation interest for premium andservicing income.
Non-Traditional 504 Loan Referral Program
If you have a 504-eligible transaction that you are unable to fund for whatever reason, GLS canmatch you with another, non-competing lender looking to fund non-traditional 504 loans. This
allows you to earn referral fees, while preserving the business relationship with the borrower.
Program Overview:
An outlet for those transactions that you typically would not fund.
All commercial property types are eligible.
Can accommodate projected income and inferior credit.
Loan amounts up to $10 million with 30-year loan terms.
Rate terms are quarterly adjustable, with a 5-year fixed rate option available.
A referral fee for you on the first mortgage portion.
For more information, please contact Bob Judge, GLS, at (216) 456-2480 ext. 133 or at [email protected].
www.sma504.com
Page 6Coleman Government Loan Solutions’ CPR Report
Secondary Market AccessSecondary Market AccessSecondary Market Access
Providing expertise in all areas of the new SBA 504 First Lien PoolProviding expertise in all areas of the new SBA 504 First Lien PoolProviding expertise in all areas of the new SBA 504 First Lien Pool
Guaranty program, including:Guaranty program, including:Guaranty program, including:
Pricing bids for existing loans
Pricing strategies for new loans
Accepting loan tapes for bid on 85% of eligible loans
Whole loan sale option
Assistance with becoming a Pool Originator
If you are 504 lender and wish to discuss how we can help youIf you are 504 lender and wish to discuss how we can help youIf you are 504 lender and wish to discuss how we can help you
access the 504 secondary market, please contact:access the 504 secondary market, please contact:access the 504 secondary market, please contact:
Rob Herrick, GLS, at (216) 456-2480 ext. 144 or via e-mail at
“The source for accessing the SBA 504 Secondary
Market Pooling Program.”
www.SMA504.com
Page 7Coleman Government Loan Solutions’ CPR Report

Page 8Coleman Government Loan Solutions’ CPR Report
Page 9Coleman Government Loan Solutions’ CPR Report
THE LEGAL BEATB E S T P R AC T I C E S : E Q U I T Y I N J E C T I O N U N D E R
S O P 5 0 10 5 ( C )
By Ethan W. Smith
What is considered proper proof of equity injection for U.S.Small Business Administration (“SBA”) loans has always been ahot topic for lenders. Until now, there has never really beenmuch specific guidance from the SBA as to what documenta-tion is required to sufficiently prove equity injection, yet insuf-ficient proof of equity injection continues to be a basis for re-pairs and denials of the SBA guaranty. Both the NationalGuaranty Purchase Center (“NGPC”) and the Office of In-spector General (“OIG”) have placed great emphasis on theadequacy of the evidence of equity injection for those loans itreviews, especially early default and early problem loans. Previ-ously, the only information on what documentation would beconsidered acceptable to the SBA was contained in the SBASOP 50 51 with only a few general requirements included inthe SOP 50 10 5(B).
With the release of the SOP 50 10 5(C), which goes into effecton October 1, 2010, the SBA has revised the SOP to provide aspecific list of documents required to be obtained by a Lenderas adequate proof of equity injection. The documentationnow required under Section B.3 on page 190 of SOP 50 105(C) to document a cash equity injection is as follows:
(1) A copy of a check or wire transfer along with evidence thatthe check or wire was processed showing the funds weremoved into the borrower’s account or escrow;
(2) A copy of the statements of account for the account fromwhich the funds are being withdrawn for each of the two mostrecent months prior to disbursement showing that the fundswere available; and
(3) A subsequent statement of the borrower’s account showingthat the funds were deposited or a copy of an escrow settle-ment statement showing the use of the cash.
It is important to note that SBA has not included in its require-ments for documenting a cash injection, the prior distinctionbetween a “material” injection (which required lenders to provethe source of the injection) and a “non-material” injection(which did not require lenders to prove source). Apparently,under the new SOP, proof of the source of a cash injection isalways required.
The Section further goes on to state that a “promissory note,‘gift letter’ or financial statement” by themselves will not beconsidered sufficient documentation of equity injection, unlessthey are obtained in conjunction with the documentation setforth above.
The new SOP 50 10 5(C) also changed what is required whenassets other than cash are being used for equity injection.Therefore, beginning October 1, lenders are required, insteadof it being merely recommended, to obtain an appraisal or oth-er independent third party valuation “if the valuation of thefixed assets [to be injected] is greater than the depreciated value
(net book value).” The SBA further indicates that the required fixedasset valuation cannot be contained in a general business valuationobtained by the lender unless the valuation is part of a “going con-cern appraisal as described in paragraph II.C.5.e.” of the new SOP.
Lastly, the new SOP 50 10 5(C) has changed its stance on borrowedequity funds, but only in relation to 504 loans, not 7(a) loans. Untilnow, under both the 7(a) and 504 programs, borrowed equity fundswould only be allowed if borrower could demonstrate that it couldrepay the borrowed funds from sources other than the cash flowfrom the business and/or the salary of the business owner. As ofOctober 1, borrowed equity will be allowed to be considered towardsequity injection in the 504 program if borrower can demonstrate thatit can repay the debt from “the cash flow of the business or othersources.” SOP 50 10 5(C), page 263. Notwithstanding this change,the borrowed equity injection requirements under the 7(a) programremain the same (Borrower must demonstrate repayment ability fromoutside sources only).
Regardless of the type of equity injection involved, Lenders shouldavoid a “checkbox mentality” towards ensuring the adequacy of theproof of injection. A detailed, thoughtful review of the documenta-tion provided to prove the source and existence of the equity injec-tion may be the difference between the SBA honoring the guarantyand a repair or denial.
To access the new SOP 50 10 5(C), please go tohttp://www.sba.gov/aboutsba/sbaprograms/elending/reg/index.html. For more information on the revisions to the injection require-ments under SOP 50 10 5(C), contact Ethan Smith [email protected] or 215-542-7070.

Page 10Coleman Government Loan Solutions’ CPR Report
GLS 7(a) Sale & Settlement Tip # 31— Size does matter...
Perhaps a bit edgy for the CPR Report but the fact is that the secondary market is currently pricing loansize into the bid. This is logical as all new deals being sold will be done under the new 1086 agree-ment with no warranty protection. to the buyer should the loan prepay early. As a rough estimate, 25yrterms with loan sizes in excess of $1.5mm are being bid up to one point lower than smaller sizeddeals. In the ten year sector, larger loans are being priced approximately ½ point behind smaller
deals.
Scott Evans is a partner at GLS. Mr. Evans has over 18 years of trading experience and has been involved in the SBA secondary markets for the last eightof those years. Mr. Evans has bought, sold, settled, and securitized nearly 20,000 SBA loans and now brings some of that expertise to the CPR Report ina recurring article called Sale and Settlement Tip of the Month. The article will focus on pragmatic tips aimed at helping lenders develop a more con-
sistent sale and settlement process and ultimately deliver them the best execution possible.
Increase your premium dollars by eliminating brokerage feesand selling your SBA and USDA Loans “Investor Direct” to
Thomas USAF, America’s largest direct investor.
Contact Mike or Vasu at 404-365-2040

Page 11Coleman Government Loan Solutions’ CPR Report

GLS V A L U E I N D I C E S M I X E D I N J A N UA RY
In the first month of 2011, the GLS ValueIndices came in mostly mixed, with aneven number of sectors rising as falling.
The Base Rate / Libor spread decreasedby 1 basis point, again having little impacton the indices. The prepayment speedelement also saw an equal number of sec-tors rise as fall, coinciding with move-ments in the indices. By this I mean thatwhere we saw a decrease in the prepayelement, we witnessed an increase in thatspecific index.
As can be seen from below, January didn’t
see appreciable price movements fromDecember, which kept all but one sectorwithin single-digit percentages of the pre-vious index reading.
Turning to the specifics, the largest de-crease was seen in the GLS VI-4, whichfell by 10% to 175 basis points. The otherdecreases, by order of magnitude, were:VI-1 (-4% to 77) and VI-2 (-2% to 120).
Increases were seen in VI-5 (+30% to232), VI-6 (+6% to 204) and VI-3 (+1%to 117).
The secondary market seems to have come
to terms with the end of the warranty peri-od and has regained the initial price de-creases seen upon the announcement.
For further information on the terminology and
concepts used in this article, please refer to the
“Glossary and Definitions” at the end of the
report.
Data on pages 14-15, Graph on page 16
Coleman Government Loan Solutions’ CPR Report Page 12
MaturityGrossMargin
NetMargin
ServicingThis Month
Price1-Yr. Ago
Price
10 yrs. 2.75% 1.075% 1.00% 110.70 109.00
15 yrs. 2.75% 1.075% 1.00% 111.50 109.00
20 yrs. 2.75% 1.075% 1.00% 113.125 109.75
25 yrs. 2.75% 1.075% 1.00% 113.95 110.00
Last MonthPrice
110.75
111.50
113.25
114.00
3-Mos. AgoPrice
111.20
112.00
113.25
114.375
6-Mos. AgoPrice
111.125
111.75
113.00
113.50
7(a) Secondary Market Pricing Grid: January 2010
Signature Securities Group, located inHouston, TX, provides the following
services to meet your needs:
SBA Loans and Pools Assistance meeting CRA guidelines USDA B&I and FSA Loans Fixed Income Securities
For more information, please callToll-free 1-866-750-7150
Securities and Insurance products are:
• NOT FDIC INSURED • NO BANK GUARANTEE • MAY LOSE VALUE SignatureSecurities Group Corporation (SSG), member of FINRA/SIPC, is a registered brokerdealer, registered investment advisor and licensed insurance agency. SSG is a whollyowned subsidiary of Signature Bank.
Government Loan Solutions’ CPR ReportColeman
D E FA U L T - C U R TA I L M E N T R A T I O S
In our Default-Curtailment Ratios (DCR)we witnessed a decrease in the 504 ratio,but a slight increase in the 7a DCR.
Please note that an increase in the DCRdoes not necessarily mean that the defaultrate is rising, only that the percentage ofearly curtailments attributable to defaultshas increased.
SBA 7(a) Default Ratios
After going below 50% for the first time in24 months in January, the 7(a) DCR rose9.26% to 53.28% in February.
A slight rise in defaults, combined with adecrease in the voluntary prepaymentcomponent, led to the increase in the ratio.
Turning to actual dollar amounts, defaultsrose by 1% to $91 million from $90 mil-lion. As for voluntary prepayments, theyfell by 8% to $80 million versus $95 mil-lion in the previous month.
SBA 504 Default Ratios
For the 504 DCR, both voluntary prepay-ments and defaults decreased in February.With defaults falling by a greater percent-age than voluntaries, the ratio declined lastmonth.
Specifically, the dollar amount of defaultsfell by $37 million to $93 million (-29%).This figure represents the first sub-$100million default month since July of 2009.As for voluntary prepayments, they de-creased by $3 million to $62 million (-4%).
Summary
What was most impressive last month wasthe default performance for 504 loans.Since the peak last May, defaults have fall-en 42% over the span of 8 months. Thiscoincides with the sustained decreases wehave witnessed with 7a loans over a similartime span.
While voluntary prepayments remainmuch lower than their peak, I do not be-
Graph on page 21
D E FA U L T R A T E R I S E S T O 5 . 9 6 %
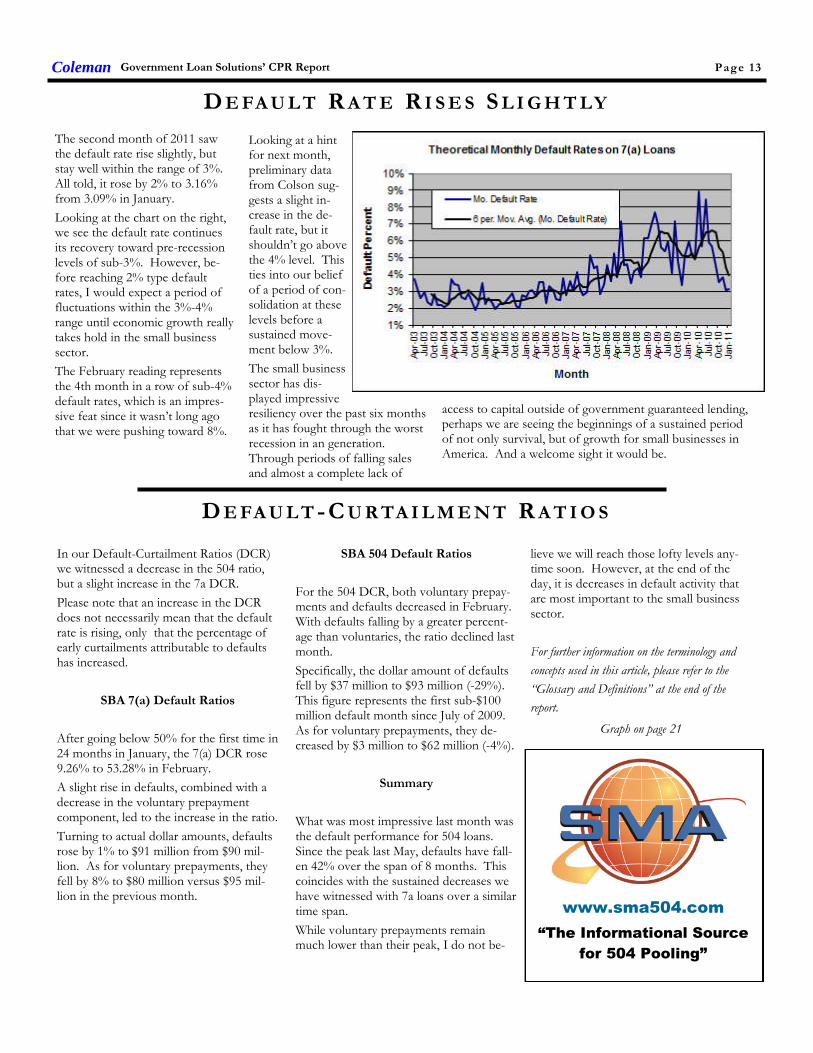
The second month of 2011 sawthe default rate rise slightly, butstay well within the range of 3%.All told, it rose by 2% to 3.16%from 3.09% in January.
Looking at the chart on the right,we see the default rate continuesits recovery toward pre-recessionlevels of sub-3%. However, be-fore reaching 2% type defaultrates, I would expect a period offluctuations within the 3%-4%range until economic growth reallytakes hold in the small businesssector.
The February reading representsthe 4th month in a row of sub-4%default rates, which is an impres-sive feat since it wasn’t long agothat we were pushing toward 8%.
access to capital outside of government guaranteed lending,perhaps we are seeing the beginnings of a sustained periodof not only survival, but of growth for small businesses inAmerica. And a welcome sight it would be.
Page 13
D E FA U L T R A T E R I S E S S L I G H T LY
lieve we will reach those lofty levels any-time soon. However, at the end of theday, it is decreases in default activity thatare most important to the small businesssector.
For further information on the terminology and
concepts used in this article, please refer to the
“Glossary and Definitions” at the end of the
report.
www.sma504.com
“The Informational Source
for 504 Pooling”
Looking at a hintfor next month,preliminary datafrom Colson sug-gests a slight in-crease in the de-fault rate, but itshouldn’t go abovethe 4% level. Thisties into our beliefof a period of con-solidation at theselevels before asustained move-ment below 3%.
The small businesssector has dis-played impressiveresiliency over the past six monthsas it has fought through the worstrecession in an generation.Through periods of falling salesand almost a complete lack of

Table 1:
Rolling six-month CPR speeds for all maturity buckets. Source: Colson Services
GLS VA L U E I N D I C E S : SU P P O RT I N G DA TA
Government Loan Solutions’ CPR ReportColeman Page 14
MONTHBUCKET 1
CPRBUCKET 2
CPRBUCKET 3
CPRBUCKET 4
CPRBUCKET 5
CPRBUCKET 6
CPR
Aug-07 0.00% 0.00% 0.00% 0.00% 0.00% 0.00%
Sep-07 19.18% 17.10% 14.19% 19.85% 18.61% 23.98%
Oct-07 18.14% 17.04% 14.59% 19.16% 18.57% 23.85%
Nov-07 17.68% 16.02% 14.82% 18.87% 18.32% 24.16%
Dec-07 17.14% 15.38% 14.42% 17.22% 17.99% 23.23%
Jan-08 15.70% 14.68% 13.96% 16.44% 17.45% 22.00%
Feb-08 15.91% 13.98% 14.19% 16.20% 17.53% 21.19%
Mar-08 15.58% 13.42% 13.27% 15.08% 15.41% 19.34%
Apr-08 16.16% 13.40% 13.05% 14.59% 15.19% 18.74%
May-08 15.49% 12.93% 12.65% 13.77% 14.33% 17.33%
Jun-08 15.29% 13.36% 12.96% 14.75% 13.62% 17.14%
Jul-08 15.70% 13.03% 12.78% 14.40% 12.49% 16.59%
Aug-08 15.45% 13.28% 12.87% 13.73% 12.24% 15.89%
Sep-08 14.03% 12.49% 12.77% 13.28% 12.36% 15.20%
Oct-08 12.98% 11.67% 12.16% 12.13% 11.97% 14.06%
Nov-08 12.08% 12.36% 11.45% 11.49% 11.49% 13.22%
Dec-08 12.37% 11.81% 10.46% 9.79% 11.08% 11.41%
Jan-09 12.86% 11.55% 10.45% 9.29% 10.61% 10.40%
Feb-09 12.30% 11.30% 10.36% 8.39% 9.99% 9.30%
Mar-09 12.96% 11.97% 10.58% 8.57% 10.47% 8.79%
Apr-09 13.23% 12.34% 11.23% 8.75% 9.81% 8.55%
May-09 13.12% 11.89% 11.80% 8.68% 9.92% 7.98%
Jun-09 13.18% 11.85% 12.36% 8.57% 8.73% 8.02%
Jul-09 12.40% 12.00% 12.51% 8.56% 8.23% 7.36%
Aug-09 13.38% 12.49% 12.36% 8.01% 7.34% 7.21%
Sep-09 12.79% 11.01% 11.83% 7.48% 6.70% 6.89%
Oct-09 12.50% 11.03% 11.35% 7.25% 7.85% 6.79%
Nov-09 12.16% 10.89% 11.05% 6.96% 7.13% 6.32%
Dec-09 11.38% 11.20% 10.59% 7.09% 7.80% 5.75%
Jan-10 11.20% 10.69% 10.34% 6.99% 8.00% 5.75%
Feb-10 10.06% 9.97% 10.05% 7.33% 8.84% 5.71%
Mar-10 9.92% 10.73% 10.11% 7.12% 8.75% 5.75%
Apr-10 9.97% 10.45% 9.73% 7.34% 8.12% 5.32%
May-10 10.58% 11.09% 10.29% 7.88% 8.53% 5.86%
Jun-10 10.95% 11.18% 10.42% 7.83% 8.53% 6.38%
Jul-10 10.33% 11.15% 10.57% 7.13% 8.59% 7.48%
Aug-10 10.45% 11.02% 10.16% 7.38% 8.25% 7.60%
Sep-10 11.29% 10.76% 10.54% 7.48% 8.01% 7.70%
Oct-10 11.35% 10.06% 10.28% 7.27% 7.29% 7.84%
Nov-10 10.89% 8.48% 8.45% 7.30% 5.61% 7.11%
Dec-10 11.35% 8.77% 9.04% 7.01% 6.67% 7.45%
Jan-11 12.00% 8.87% 7.84% 7.49% 5.03% 5.96%

Page 15
Table 2:
GLS VI values for all maturity buckets for last 42 months.
GLS VA L U E I N D I C E S : H I S TO R I C A L VA L U E S
INDICES LEGEND
HIGHEST READING
LOWEST READING
Government Loan Solutions’ CPR ReportColeman
MONTHWAVGLIBOR
WAVGBASE
BASELIBOR
SPDGLSVI-1
GLSVI-2
GLSVI-3
GLSVI-4
GLSVI-5
GLSVI-6
Aug-07 5.48% 8.25% 2.77% 12.9 33.5 59.8 43.6 57.8 7.0
Sep-07 5.70% 8.21% 2.51% -7.3 32.2 38.1 36.3 33.3 -14.1
Oct-07 5.05% 7.74% 2.69% 70.2 61.9 75.6 52.2 61.9 14.6
Nov-07 4.96% 7.50% 2.54% 42.6 46.7 50.5 57.8 48.7 -4.3
Dec-07 5.02% 7.35% 2.33% 30.4 55.2 54.4 57.0 46.7 7.9
Jan-08 3.77% 6.86% 3.09% 105.1 118.6 124.7 121.4 140.1 96.8
Feb-08 3.10% 6.00% 2.90% 94.4 98.7 98.6 93.3 118.0 69.9
Mar-08 2.90% 5.95% 3.05% 118.1 120.5 116.2 112.0 128.8 107.4
Apr-08 2.81% 5.25% 2.44% 69.9 79.5 77.4 90.6 100.8 77.4
May-08 2.78% 5.15% 2.37% 61.2 66.7 64.1 82.9 60.5 65.1
Jun-08 2.67% 5.00% 2.33% 44.1 47.4 59.8 74.6 66.9 47.2
Jul-08 2.75% 5.00% 2.25% 41.7 43.4 55.3 60.8 89.1 61.6
Aug-08 2.74% 5.02% 2.27% 44.0 52.5 70.1 47.4 95.8 83.1
Sep-08 3.00% 5.00% 2.00% 73.3 91.2 88.5 111.3 85.2 94.2
Oct-08 4.43% 4.56% 0.12% 2.3 -3.1 -38.6 30.5 -51.0 -12.9
Nov-08 2.06% 4.00% 1.94% 203.9 187.0 143.2 161.1 236.0 196.6
Dec-08 1.64% 3.89% 2.25% 162.2 144.9 170.3 151.0 212.5 238.6
Jan-09 1.11% 3.25% 2.14% 164.8 185.5 181.7 233.2 218.3 204.4
Feb-09 1.15% 3.25% 2.10% 203.6 179.5 157.4 162.9 201.5 171.3
Mar-09 1.06% 3.25% 2.19% 135.3 150.3 151.6 220.4 138.0 169.7
Apr-09 0.96% 3.28% 2.32% 149.4 134.8 144.3 182.0 198.3 184.5
May-09 0.70% 3.26% 2.57% 182.1 138.7 149.6 200.3 192.4 200.8
Jun-09 0.55% 3.25% 2.70% 144.8 130.3 137.3 200.2 183.8 212.8
Jul-09 0.48% 3.25% 2.77% 150.9 143.8 129.1 191.9 192.4 217.4
Aug-09 0.39% 3.25% 2.86% 129.7 127.4 125.7 201.7 197.3 222.8
Sep-09 0.29% 3.25% 2.96% 122.0 126.5 128.3 205.5 225.3 229.6
Oct-09 0.26% 3.25% 2.99% 128.2 131.3 133.9 216.0 191.2 228.8
Nov-09 0.26% 3.25% 2.99% 115.3 150.9 138.0 219.2 210.8 234.2
Dec-09 0.25% 3.25% 3.00% 136.1 153.4 162.0 226.3 218.0 259.6
Jan-10 0.25% 3.24% 2.99% 153.9 186.5 157.2 201.0 240.6 250.7
Feb-10 0.25% 3.23% 2.99% 150.8 155.1 150.4 192.3 193.0 250.7
Mar-10 0.26% 3.25% 2.99% 133.1 126.0 155.8 206.4 209.5 249.2
Apr-10 0.29% 3.25% 2.96% 142.1 147.5 149.3 213.6 205.1 250.0
May-10 0.41% 3.25% 2.84% 107.5 112.1 117.5 184.4 187.2 218.1
Jun-10 0.52% 3.25% 2.73% 85.9 90.9 90.1 147.5 168.7 200.4
Jul-10 0.46% 3.26% 2.80% 102.7 81.0 106.7 167.0 159.5 193.5
Aug-10 0.33% 3.26% 2.93% 85.6 91.6 95.4 161.6 186.6 193.2
Sep-10 0.28% 3.25% 2.97% 74.1 95.3 94.0 135.6 190.8 187.2
Oct-10 0.28% 3.25% 2.97% 79.8 89.7 91.3 159.8 207.2 179.5
Nov-10 0.27% 3.25% 2.98% 70.5 117.2 113.5 202.0 223.5 195.4
Dec-10 0.30% 3.30% 3.00% 80.1 121.8 116.0 194.9 178.1 192.3
Jan-11 0.29% 3.25% 2.96% 77.0 119.8 117.3 175.2 232.3 203.7

Coleman Government Loan Solutions’ CPR Report Page 16
GLS provides valuations for:
SBA 7(a), 504 1st mortgage and
USDA servicing rights SBA 7(a) and 504 1st mortgage
pools Guaranteed and non-guaranteed
7(a) loan portions Interest-only
portions of SBA and USDA loans
Government Loan Solutions
The nationwide leader in the valuation of SBA and USDA assets.
In these times of marketuncertainty, let GLS help you indetermining the value of your
SBA and USDA related-assets.
For further information, please contact RobHerrick at (216) 456-2480 ext. 144 or at

Table 3:
2011 monthly prepayment speeds broken out by maturity sector. Source: Colson Services
Table 4:
2011 pool age broken out by maturity sector. Source: Colson Services
YTD P R E PA Y M E N T S P E E D S
Coleman Government Loan Solutions’ CPR Report Page 17
CPR/MO. <8 8 - 10 10 - 13 13 - 16 16 - 20 20+ ALL
Jan-11 14.30% 9.08% 6.94% 6.85% 3.82% 5.26% 6.13%
Feb-11 5.96% 9.95% 6.43% 5.52% 5.78% 5.02% 5.74%
Grand Total 10.19% 9.52% 6.69% 6.19% 4.80% 5.14% 5.93%
POOL AGE <8 8 - 10 10 - 13 13 - 16 16 - 20 20+ ALL
Jan-11 22 Mos. 31 Mos. 32 Mos. 67 Mos. 49 Mos. 50 Mos. 45 Mos.
Feb-11 22 Mos. 30 Mos. 32 Mos. 66 Mos. 50 Mos. 51 Mos. 45 Mos.

Page 18
2011 YTD CPR by maturity and age bucket. Source: Colson Services
Table 5:
Y E A R -T O -DA T E CPR DA TA
Government Loan Solutions’ CPR ReportColeman
< 8 BY AGE 0-12 Mos. 13-24 Mos. 25-36 Mos. 37-48 Mos. 48+ Mos.Jan-11 8.14% 24.87% 18.55% 10.61% 14.45%Feb-11 6.33% 2.69% 5.40% 4.49% 12.63%
Grand Total 7.24% 14.03% 12.32% 7.66% 13.50%
10-13 BY AGE 0-12 Mos. 13-24 Mos. 25-36 Mos. 37-48 Mos. 48+ Mos.Jan-11 4.90% 6.31% 12.35% 6.54% 5.14%Feb-11 4.49% 10.85% 8.56% 4.39% 5.93%
Grand Total 4.69% 8.58% 10.52% 5.47% 5.54%
16-20 BY AGE 0-12 Mos. 13-24 Mos. 25-36 Mos. 37-48 Mos. 48+ Mos.Jan-11 0.00% 7.24% 8.01% 2.83% 2.85%Feb-11 0.00% 4.73% 9.77% 14.87% 1.78%
Grand Total 0.00% 5.94% 8.80% 9.16% 2.31%
8-10 BY AGE 0-12 Mos. 13-24 Mos. 25-36 Mos. 37-48 Mos. 48+ Mos.Jan-11 2.09% 10.85% 12.52% 4.62% 11.81%Feb-11 0.48% 18.09% 9.47% 9.90% 7.17%
Grand Total 1.29% 14.67% 11.12% 7.53% 9.52%
13-16 BY AGE 0-12 Mos. 13-24 Mos. 25-36 Mos. 37-48 Mos. 48+ Mos.Jan-11 0.00% 30.56% 5.65% 0.00% 5.93%Feb-11 15.31% 2.76% 12.71% 9.95% 3.99%
Grand Total 7.92% 15.65% 8.78% 5.27% 4.97%
20+ BY AGE 0-12 Mos. 13-24 Mos. 25-36 Mos. 37-48 Mos. 48+ Mos.Jan-11 2.78% 5.44% 6.82% 9.07% 4.80%Feb-11 2.22% 8.00% 5.69% 5.72% 4.78%
Grand Total 2.50% 6.78% 6.29% 7.42% 4.79%
Coleman Government Loan Solutions’ CPR Report Page 19
GLOSSARY AND DEFINITIONS: PART 1Default-Curtailment Ratio
The Default-Curtailment Ratio (DCR), or the percentage of secondary loan curtailments that are attributable to defaults, can be considered a meas-urement of the health of small business in the U.S. GLS, with default and borrower prepayment data supplied by Colson Services, has calculatedDCRs for both SBA 7(a) and 504 loans since January, 2000.
The default ratio is calculated using the following formula:
Defaults / (Defaults + Prepayments)
By definition, when the DCR is increasing, defaults are increasing faster than borrower prepayments, suggesting a difficult business environment forsmall business, perhaps even recessionary conditions. On the flip side, when the DCR is decreasing, either defaults are falling or borrower prepay-ments are outpacing defaults, each suggesting improving business conditions for small business.
Our research suggests that a reading of 20% or greater on 7(a) DCRs and 15% or greater on 504 DCRs suggest economic weakness in these smallbusiness borrower groups.
Theoretical Default RateDue to a lack of up-to-date default data, we attempt to estimate the current default rate utilizing two datasets that we track:
1. Total prepayment data on all SBA pools going back to 2003. This is the basis for our monthly prepayment information.
Total prepayment data on all secondary market 7(a) loans going back to 1999, broken down by defaults and voluntary prepayments. This is the basisfor our monthly default ratio analysis.
With these two datasets, it is possible to derive a theoretical default rate on SBA 7(a) loans. We say “theoretical” because the reader has to accept thefollowing assumptions as true:
1. The ratio of defaults to total prepayments is approximately the same for SBA 7(a) pools and secondary market 7(a) loans.
Fact: 60% to 70% of all secondary market 7(a) loans are inside SBA pools.
2. The default rate for secondary market 7(a) loans closely approximates the default rate for all outstanding 7(a) loans.
Fact: 25% to 35% of all outstanding 7(a) loans have been sold into the secondary market.
While the above assumptions seem valid, there exists some unknown margin for error in the resulting analysis. However, that does not invalidate thepotential value of the information to the SBA lender community.
The Process
To begin, we calculated total SBA pool prepayments, as a percentage of total secondary loan prepayments, using the following formula:
Pool Prepay Percentage = Pool Prepayments / Secondary Loan Prepayments
This tells us the percentage of prepayments that are coming from loans that have been pooled. Next, we calculated the theoretical default rate usingthe following equation:
((Secondary Loan Defaults * Pool Prepay Percentage) / Pool Opening Balance) * 12
This provides us with the theoretical default rate for SBA 7(a) loans, expressed as an annualized percentage.
GLS Long Value Indices
Utilizing the same maturity buckets as in our CPR analysis, we calculate 6 separate indexes, denoted as GLS VI-1 to VI-6. The num-bers equate to our maturity buckets in increasing order, with VI-1 as <8 years, VI-2 as 8-10 years, VI-3 as 10-13 years, VI-4 as 13-16years, VI-5 as 16-20 years and ending with VI-6 as 20+ years.
The new Indices are basically weighted-average spreads to Libor, using the rolling six-month CPR for pools in the same maturitybucket, at the time of the transaction. While lifetime prepayment speeds would likely be lower for new loans entering the secondarymarket, utilizing six-month rolling pool speeds allowed us to make relative value judgments across different time periods.
We compare the bond-equivalent yields to the relevant Libor rate at the time of the transaction. We then break the transactions intothe six different maturity buckets and calculate the average Libor spread, weighting them by the loan size.
For these indices, the value can be viewed as the average spread to Libor, with a higher number equating to greater value in the tradinglevels of SBA 7(a) loans.
GLOSSARY AND DEFINITIONS: PART 2Prepayment Calculations
SBA Pool prepayment speeds are calculated using the industry convention of Conditional Prepayment Rate, or CPR. CPR is the an-nualized percentage of the outstanding balance of a pool that is expected to prepay in a given period. For example, a 10% CPR sug-gests that 10% of the current balance of a pool will prepay each year.
When reporting prepayment data, we break it into seven different original maturity categories: <8 years, 8-10 years, 10-13 years, 13-16years, 16-20 years and 20+ years. Within these categories we provide monthly CPR and YTD values.
In order to get a sense as to timing of prepayments during a pool’s life, we provide CPR for maturity categories broken down by fivedifferent age categories: 0-12 months, 13-24 months, 25-36 months, 37-48 months and 48+ months.
As to the causes of prepayments, we provide a graph which shows prepayment speeds broken down by voluntary borrower prepay-ment speeds, denoted VCPR and default prepayment speeds, denoted as DCPR. The formula for Total CPR is as follows:
Total Pool CPR = VCPR + DCPR
SBA Libor Base RateThe SBA Libor Base Rate is set on the first business day of the month utilizing one-month LIBOR, as published in a national financialnewspaper or website, plus 3% (300 basis points). The rate will be rounded to two digits with .004 being rounded down and .005 be-ing rounded up.
Please note that the SBA’s maximum 7(a) interest rates continue to apply to SBA base rates: Lenders may charge up to 2.25% abovethe base rate for maturities under seven years and up to 2.75% above the base rate for maturities of seven years or more, with rates2% higher for loans of $25,000 or less and 1% higher for loans between $25,000 and $50,000. (Allowable interest rates are slightlyhigher for SBAExpress loans.)
Risk TypesThe various risk types that impact SBA pools are the following:
Basis Risk: The risk of unexpected movements between two indices. The impact of this type of risk was shown in the decrease inthe Prime/Libor spread experienced in 2007 and 2008.
Prepayment Risk: The risk of principal prepayments due to borrower voluntary curtailments and defaults. Overall prepayments areexpressed in CPR, or Conditional Prepayment Rate.
Interest Rate Risk: The risk of changes in the value of an interest-bearing asset due to movements in interest rates. For pools withmonthly or quarterly adjustments, this risk is low.
Credit Risk: Losses experienced due to the default of collateral underlying a security. Since SBA loans and pools are guaranteed bythe US government, this risk is very small.
Secondary Market First Lien Position 504 Loan Pool Guarantee ProgramAs part of the American Recovery and Reinvestment Act (AKA the Stimulus Bill), Congress authorized the SBA to create a temporaryprogram that provides a guarantee on an eligible pool of SBA 504 first liens. The program was authorized for a period of two yearsfrom the date of bill passage – February, 2009. The eligibility of each loan is dependent on the date of the SBA Debenture funding.To be eligible, the Debenture must have been funded on or after February 17, 2009, and prior to February 16, 2011. The total guar-antee allocation is $3 Billion. HR 5297 provides for a two-year extension from the first pooling month.
The SBA announced that they will begin issuing the first pool guarantees in September, 2010 for early October settlement.
For the purposes of the program, a pool is defined as 2 or more loans. A pool must be either fixed (for life) or adjustable (any periodadjustment including 5 or 10 years). If the pool is comprised of adjustable rate loans, all loans must have the same base rate (e.g.Prime, LIBOR, LIBOR Swaps, FHLB, etc.). Finally, each loan must be current for the lesser of 6 months or from the time of loanfunding. Congress mandated that this be a zero subsidy program to the SBA (and the US taxpayer). The SBA has determined theprogram cost (management and expected losses) can be covered by an ongoing subsidy fee of .167%.
Coleman Government Loan Solutions’ CPR Report Page 20

Coleman Government Loan Solutions’ CPR Report Page 21
GLS provides valuations for:
SBA 7(a), 504 1st mortgage and
USDA servicing rights SBA 7(a) and 504 1st mortgage
pools Guaranteed and non-guaranteed
7(a) loan portions Interest-only
portions of SBA and USDA loans
Government Loan Solutions
The nationwide leader in the valuation of SBA and USDA assets.
In these times of marketuncertainty, let GLS help you indetermining the value of your
SBA and USDA related-assets.
For further information, please contact RobHerrick at (216) 456-2480 ext. 144 or at

Powered By:
www.glsolutions.us
Government Loan Solutions’CPR Report is a monthly elec-tronic newsletter published by
Coleman Publishing.
The opinions, unless otherwisestated, are exclusively those of
the editorial staff.
This newsletter is not to bereproduced or distributed inany form or fashion, withoutthe express written consent ofColeman or Government Loan
Solutions.
Government Loan Solutions’CPR Report is distributed in
pdf format via e-mail. Spread-sheets relating to the presenteddata are available to paid sub-
scribers upon request.
The subscription to the Gov-ernment Loan Solutions’ “CPRReport” is free to all members
of the SBA Community.
To subscribe, please contactColeman at (800) 617-1380 or
via email at:[email protected]
Partners
Scott Evans
Bob Judge
Rob Herrick
Coleman Government Loan Solutions’ CPR Report Page 22
812 Huron RoadCleveland, OH 44115
Government Loan Solut ions
Phone: (216) 456-2480Fax: (216) 456-2481Web Site: www.glsolutions.usE-mail: [email protected]
Government Loan Solutions, Inc. (GLS) was founded by three former Bond Traders in
Cleveland, OH. Scott Evans, Rob Herrick and Bob Judge possess a combined 70 years experi-
ence in the institutional fixed income markets, 40 of which are in the loan securitization business.
GLS formally began operations in January, 2007. Our mission is as follows:
“The purpose of Government Loan Solutions is to bring greater efficiency, productivity
and transparency to the financial markets. Through the use of proprietary technology, we
intend to aid lenders in all aspects of their small business lending, help loan securitizers be
more productive in their operational procedures and provide quality research to the investor
community .”
Services available include:
Lenders:
Manage loan sales to the secondary market
Process loan settlements via our electronic platform, E-Settle
Third-Party servicing and non-guaranteed asset valuation
Model Validation
Specialized research projects
Mortgage Servicing Valuation
Loan Securitizers:
Manage loan settlements and pool formation
Loan and IO accounting
Loan, Pool and IO Mark-To-Market
Specialized research projects
Institutional Investors:
Loan, Pool, and IO Mark-To-Market
Specialized research projects
Portfolio consulting
For additional information regarding our products and capabilities, please contact us at:
Phone: (216)456-2480 E-mail at: [email protected] web: www.glsolutions.us
EDITORIAL DISCLAIMER
DISCLAIMER OF WARRANTIES – GOVERNMENT LOAN SOLUTIONS (GLS) MAKES NO REPRESENTATIONS OR WARRANTIES REGARD-ING THE ACCURACY, RELIABILITY OR COMPLETENESS OF THE CONTENT OF THIS REPORT. TO THE EXTENT PERMISSIBLE BY LAW,GLS DISCLAIMS ALL WARRANTIES, EXPRESS OR IMPLIED, INCLUDING BUT NOT LIMITED TO IMPLIED WARRANTIES OF MERCHANT-ABILITY AND FITNESS FOR A PARTICULAR PURPOSE.
Limitation of Liability - GLS shall not be liable for damages of any kind, including without limitation special or consequential damages, arising outof your use of, or reliance upon, this publication or the content hereof.
This Report may contain advice, opinions, and statements of various information providers and content providers. GLS does not represent orendorse the accuracy or reliability of any advice, opinion, statement or other information provided by any information provider or content provider,or any user of this Report or other person or entity. Reliance upon any such opinion, advice, statement, or other information shall also be at yourown risk.
Prior to the execution of a purchase or sale or any security or investment, you are advised to consult with investment professionals, as appropri-ate, to verify pricing and other information. Neither GLS, its information providers or content providers shall have any liability for investmentdecisions based upon, or the results obtained from, the information provided. Neither GLS, its information providers or content providers guaran-tee or warrant the timeliness, sequence, accuracy, or completeness of any such information. Nothing contained in this Report is intended to be,nor shall it be construed as, investment advice.