Embed Size (px)
Citation preview

Covina-Valley Unified School District
Second Interim Report
Board Meeting:
March 19, 2012

Presenters
Dr. Catherine Nichols, Superintendent
David A. Rivera, Chief Business Officer
Mary Perea,
Director of Fiscal

Report Content
Sections Budget
Assumptions Summary
Revenues
Expenditures
Financial Analysis
Sections District Reserves
Multi-year Projections
Budget Reports
State Forms

Second Interim Report
• Reporting Requirements – State Mandate to file a certification of financial
solvency twice a year • Ed Code Sections 35035 (g), 42130, and 42131
• AB 1200 and AB 1708
• Projections must include current year and subsequent two years (2012/13 to 2013/14)
– Timelines • First Interim is through Oct 31st and must be authorized
by Dec 15
• Second Interim is through Jan 31st and must be authorized by Mar 15
Noteworthy changes since First Interim Report

• Reporting Requirements (Continued)
– Certifications • Positive – the District will meet its obligations
• Qualified – the District may not meet its financial obligations
• Negative – the District will be unable to meet its financial obligations
• Certification is for the current fiscal year and subsequent fiscal years
Second Interim Report

Budget Assumptions Summary Outlined on Page 1.1 or 1.2
Section I
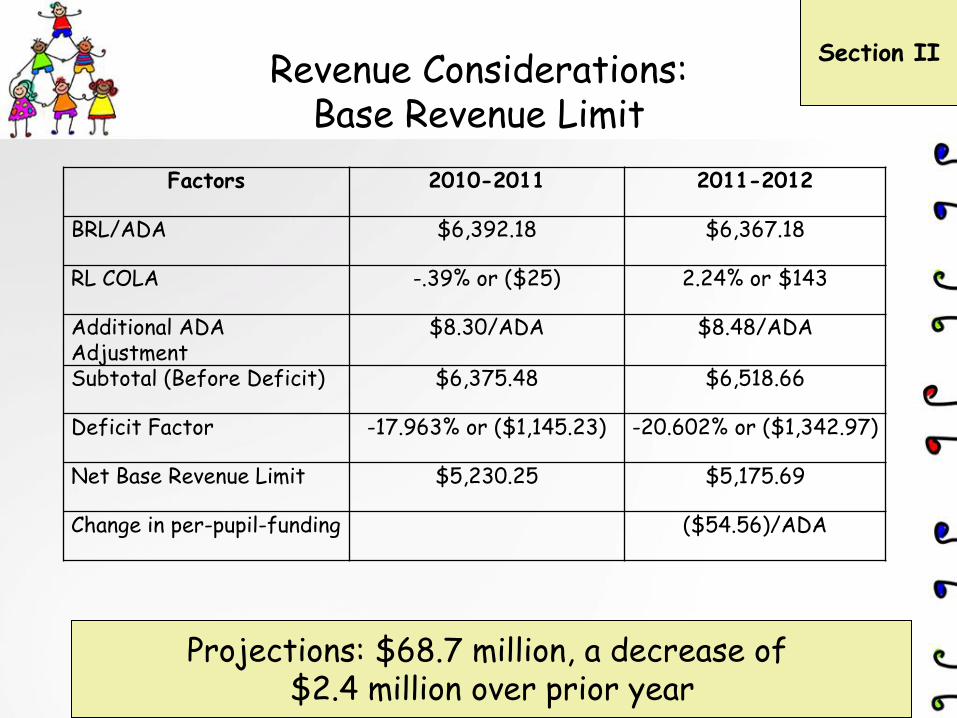
Revenue Considerations: Base Revenue Limit
Projections: $68.7 million, a decrease of $2.4 million over prior year
Section II
Factors 2010-2011 2011-2012
BRL/ADA $6,392.18 $6,367.18
RL COLA -.39% or ($25) 2.24% or $143
Additional ADA Adjustment
$8.30/ADA $8.48/ADA
Subtotal (Before Deficit) $6,375.48 $6,518.66
Deficit Factor -17.963% or ($1,145.23) -20.602% or ($1,342.97)
Net Base Revenue Limit $5,230.25 $5,175.69
Change in per-pupil-funding ($54.56)/ADA

Revenue Considerations: TIER III – Flexibility Transfers
Section II
Resource Program Funding Transfers
6258 Physical Education Grant $88,053 $88,053
6350 ROP Program (pass through to ROP) $885,771 $ -
6405 School Safety (campus supervisors) $215,247 $ - $103,144
7055 CAHSEE $144,046 $144,046
7080 School Counseling (counselors) $453,197 $ -
7140 GATE $94,821 $74,821
7156 Instructional Materials Fund $810,244 $500,000
7271 PAR $53,198 $20,751
7294 Math and Reading $103,214 $103,214
7390 Pupil Retention $41,518 $41,518
7392 Teacher Credentialing $23,945 $ -
7393 Professional Development Block Grant $548,904 $500,000
7394 Targeted Instructional Improvement $961,485 $581,485
7395 School and Library Improvement Grant $737,046 $657,099
6760 Arts and Music Block Grant $195,875 $150,875 7325 Administrator Training Program $14,000 $ -
6285 Community-Based English Tutoring (CBET) $51,086 $ - Other Funds Adult Education (Transfer) $ - $2,000,000
6092 Cal-Safe $165,230 $ - Deferred Maintenance (Transfer) $ - $500,000
Subtotals $5,586,880 $5,465,006
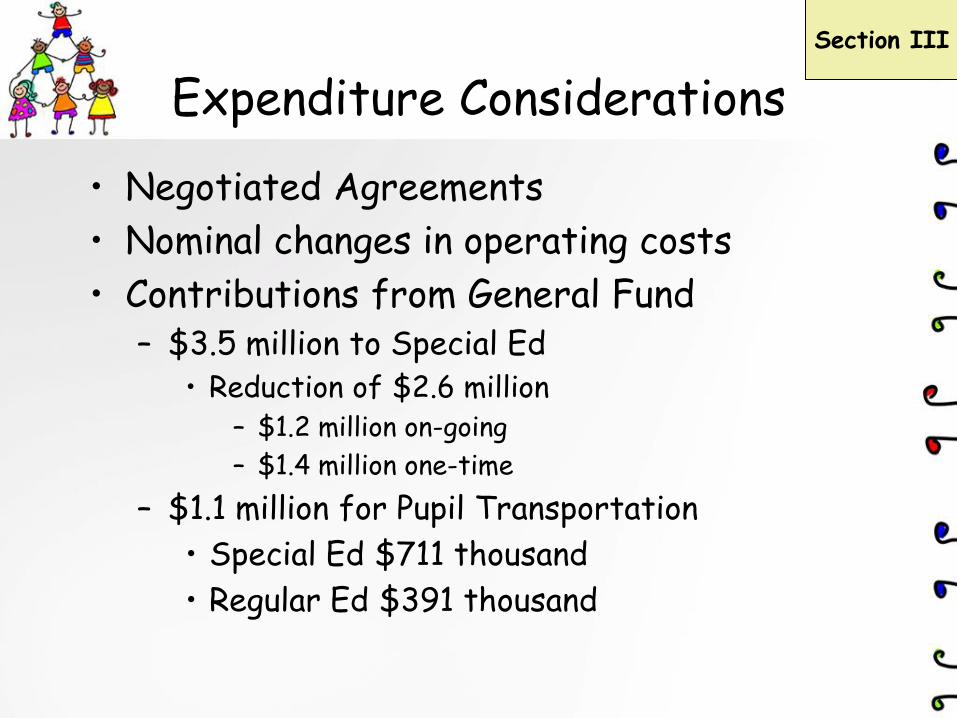
• Negotiated Agreements
• Nominal changes in operating costs
• Contributions from General Fund – $3.5 million to Special Ed
• Reduction of $2.6 million – $1.2 million on-going
– $1.4 million one-time
– $1.1 million for Pupil Transportation
• Special Ed $711 thousand
• Regular Ed $391 thousand
Expenditure Considerations
Section III

• Noteworthy Trends for the District
– Student Enrollment
– Changes in Average Daily Attendance
– Projections for the Base Revenue Limit
Financial Analysis Section IV

Financial Analysis: Student Enrollment Trends (Sept 2011)
Section IV
0
2,500
5,000
7,500
10,000
12,500
09-10 10-11 11-12 12-13 13-14 14-15 15-16 16-17 17-18 18-19
5,342 5,248 5,107 5,106 5,136 5,179 5,086 5,082 5,066 5,019
3,203 3,112 3,098 3,020 2,881 2,718 2,718 2,746 2,804 2,822
5,467 5,328 5,130 5,010 4,818 4,752 4,711 4,555 4,387 4,287
Elementary
Middle
High
S t
u d
e n
t
E n
r o
l l m
e n
t
Enrollment Data for Grades K-12

Historical ADATrends Section IV
12,500
12,750
13,000
13,250
13,500
13,750
14,000
14,250
14,500
14,750
15,000
02-03 03-04 04-05 05-06 06-07 07-08 08-09 09-10 10-11 11-12 * 12-13 * 13-14*
14,318
14,462
14,564
14,733 14,745
14,465
14,134
13,939
13,560
13,230
12,926
12,737
A v
e r
a g
e -
D a
i l y
- A
t t
e n
d e
n c
e
F i s c a l Y e a r
Student enrollment decline (over 1,515/ADA) x $5,176/ADA = $7.8 million

Financial Analysis: Base Revenue Limit Trends for 11-12
Section IV
$5,417.02
$5,364.79
$5,291.82
$5,307.65
$5,312.24
$5,204.19
$5,230.70
$5,230.70
$5,000 $5,100 $5,200 $5,300 $5,400 $5,500
Adopted Budget (June 2009)
1st Interim (Dec 2009)
2nd Interim (Mar 2010)
Adopted Budget (June 2010)
1st Interim (Dec 2010)
2nd Interim (Mar 2011)
State Budget Act (July 2011)
1st Interim (Dec 2011)
$5,417.02
$5,364.79
$5,291.82
$5,307.65
$5,312.24
$5,204.19
$5,230.70
$5,230.70
$5,175.69
$5,000 $5,100 $5,200 $5,300 $5,400 $5,500
Adopted Budget (June 2009)
1st Interim (Dec 2009)
2nd Interim (Mar 2010)
Adopted Budget (June 2010)
1st Interim (Dec 2010)
2nd Interim (Mar 2011)
State Budget Act (July 2011)
1st Interim (Dec 2011)
2nd Interim (Mar 2012)
$241.33 drop in per-student-funding for 11-12 = $3.2 million

District Reserves
• Unrestricted – Beg Balance
$16.0 million
– Projected Ending Balance $18.0 million
• Restricted – Beg Balance
$2.0 million
– Projected Ending Balance $1.0 million
Section VI
Reserve Requirements:
3% = $3.3 million $91 thousand for Revolving Cash/Inventory
$3.7 million for Restoring Bargaining Agreements Uncommitted Funds $10.9 million

Multi-Year Projections 2012-2013
• Revenues – BRL Funded @ .77
cents on the dollar – 198 Decline in
Student Enrollment
– COLA • 3.17% or $207/ADA
– One-time Funding • Federal Stimulus • Mandated Costs • Special Education
• Expenditures – Reduce Certificated
Staffing by 8
– Restore Employee Concessions
– Additional Program Encroachments
– Add’l Operating Costs
Section VI
Same as 2011-12, except for following revisions

Multi-Year Projections 2013-2014
• Revenues – BRL Funded @ .77 cents
on the dollar
– 301 Decline in Student Enrollment
– COLA Funding • 2.4% or $161/ADA
– Update Lottery and CSR Funding for enrollment decline
• Expenditures – Reduce Certificated
Staffing by 12
– Additional Program Encroachments
– Regular Operating Costs
Section VI
Same as 2012-13, except for following revisions

Multi-Year Budget Projections Section VI
Unrestricted Reserves will drop by $6.3 million or 58% over two years
Second Interim Projected Projected
2011-2012 2012-2013 2013-2014
Beginning Fund Balance $ 17,920,915 $ 19,013,744 $ 13,842,355
Audit Adjustment/Restatement $ - $ - $ -
Revised Fund Balance $ 17,920,915 $ 19,013,744 $ 13,842,355
Annual Revenues $ 111,907,941 $ 106,628,143 $ 105,224,483
Annual Expenditures (rounded to nearest dollar) $ 110,815,112 $ 115,499,532 $ 114,405,721
Budget Stabilization Plan ($ 3,700,000) ($ 3,700,000)
Revised Expenditures (rounded to nearest dollar) $ 110,815,112 $ 111,799,532 $ 110,705,721
Changes in Fund Balance $ 1,092,828 $ (5,171,389) $ (5,481,238)
I. Projected Ending Fund Balance $ 19,013,744 $ 13,842,355 $ 8,361,116
II. Unavailable Reserves: $ 1,095,240 $ 441,737 $ 441,737
1. Cash Accounts and Inventory $ 91,737 $ 91,737 $ 91,737
2. Restricted Program Balances $ 1,003,503 $ 350,000 $ 350,000
III. Committed Funds $ 3,700,000 Budgeted Budgeted
IV. Total Unrestricted Fund Balance $ 14,218,504 $ 13,400,618 $ 7,919,379
V. Reserve for Economic Uncertainty (3%) $ 3,324,453 $ 3,353,986 $ 3,321,172
VI. Available Reserves (Unrestricted) $ 10,894,051 $ 10,046,632 $ 4,598,207
VII. Available Reserves (Unrestricted Fund) 9.83% 8.99% 4.15%

State’s Cash Payment Schedule for 2011-12
Education Code (Theory) State Budget Act (Actual)
Months Payments YTD Payments YTD
July 2011 5.00% 5.00% 0.00% 0.00%
August 2011 5.00% 10.00% 0.00% 0.00%
September 2011 9.00% 19.00% 11.70% 11.70%
October 2011 9.00% 28.00% 0.00% 11.70%
November 2011 9.00% 37.00% 9.00% 20.70%
December 2011 9.00% 46.00% 9.00% 29.70%
January 2012 9.00% 55.00% 25.30% 55.00%
February 2012 9.00% 64.00% 0.50% 55.50%
March 2012 9.00% 73.00% 0.00% 55.50%
April 2012 9.00% 82.00% 4.60% 60.10%
May 2012 9.00% 91.00% 1.50% 61.60%
June 2012 9.00% 100.00% 0.00% 61.60%
July 2012 22.60% 84.20%
August 2012 15.80% 100.00%
100.00% 100.00%
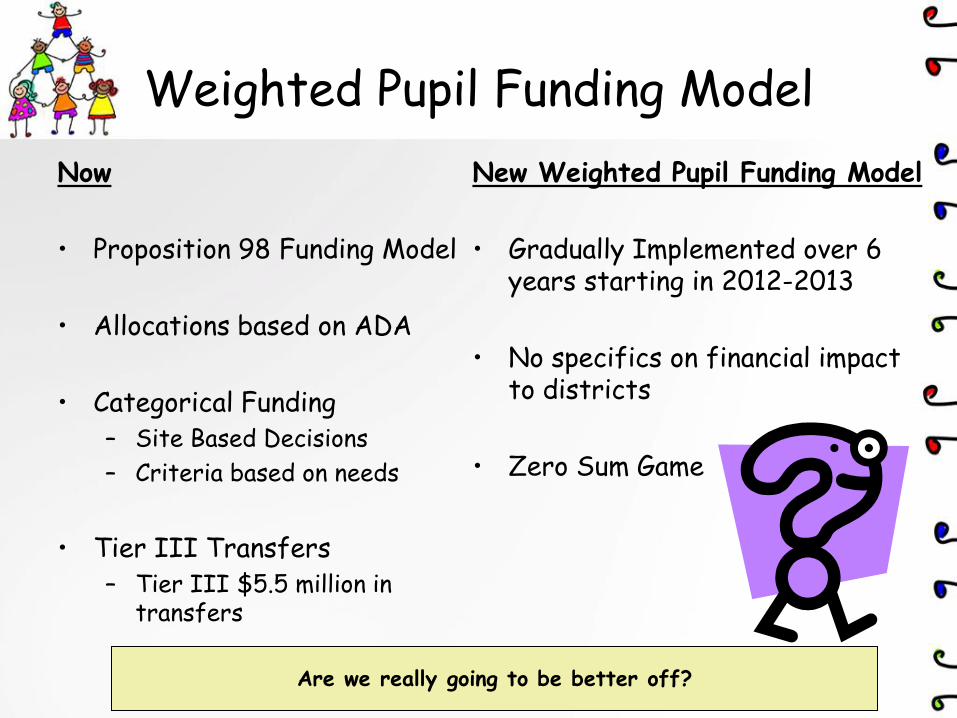
Weighted Pupil Funding Model
Now
• Proposition 98 Funding Model
• Allocations based on ADA
• Categorical Funding – Site Based Decisions
– Criteria based on needs
• Tier III Transfers – Tier III $5.5 million in
transfers
New Weighted Pupil Funding Model
• Gradually Implemented over 6 years starting in 2012-2013
• No specifics on financial impact to districts
• Zero Sum Game
Are we really going to be better off?

Sections VII and VIII
• Budget Reports – Detailed List of Revenues & Expenditures
• State Forms – SACS Reports

Potential Factors Impacting Budget Projections
• State of World Economy – Status of Financial Markets
• Stability of Federal and State’s Government
• Upcoming Presidential Election
• Changes in Unemployment Rate and Housing Market
• Consumer Confidence
• More Reductions in State Funding – 2012-13 COLA = $2 million
– Higher level of enrollment decline
– Tier III Flexibility Transfers Sunsetting
– Higher Cost of Doing Business • General Fund Contributions
• Unemployment Insurance
• Health Benefits
• Utilities

• District needs to take formal action on adopting Second Interim Report
• Recommend approving the report as submitted with a Positive Certification
• Finalize Budget Stabilization Plan that ensures maintaining a 3% Reserve Requirement – Current projections show 2013-14 @ 7.2%
• Submit reports to LACOE
Next Steps….Second Interim Report

Board Member comments and questions…