Embed Size (px)
Citation preview
ICEAA 2016 Bristol – TRN01
© 2002-2013 ICEAA. All rights reserved.
v1.2
Unit I - Module 2 1
Cost Estimating Techniques
The basic types of cost estimates
“Prediction is very difficult, especially if it’s about the future.” [disputed]-Niels Henrik David Bohr (1885-1962), Danish physicist and Nobel laureate
© 2002-2013 ICEAA. All rights reserved.
v1.2
Acknowledgments• ICEAA is indebted to TASC, Inc., for the
development and maintenance of theCost Estimating Body of Knowledge (CEBoK®)– ICEAA is also indebted to Technomics, Inc., for the
independent review and maintenance of CEBoK®
• ICEAA is also indebted to the following individuals who have made significant contributions to the development, review, and maintenance of CostPROF and CEBoK ®
• Module 2 Cost Estimating Techniques– Lead authors: Crystal H. Rudloff, Kenneth D. Odom, Colleen M. Craig
– Assistant author: Daniel V. Cota
– Senior reviewers: Richard L. Coleman, Richard B. Collins II,Fred K. Blackburn, Kevin Cincotta
– Reviewer: Laurette Sullivan, Karyn L. Sanders
– Managing editor: Peter J. Braxton
2Unit I - Module 2
ICEAA 2016 Bristol – TRN01
© 2002-2013 ICEAA. All rights reserved.
v1.2
Unit I - Module 2 3
Unit Index
Unit I – Cost Estimating1. Cost Estimating Basics
2. Cost Estimating Techniques3. Parametric Estimating
Unit II – Cost Analysis Techniques
Unit III – Analytical Methods
Unit IV – Specialized Costing
Unit V – Management Applications
© 2002-2013 ICEAA. All rights reserved.
v1.2
Unit I - Module 2 4
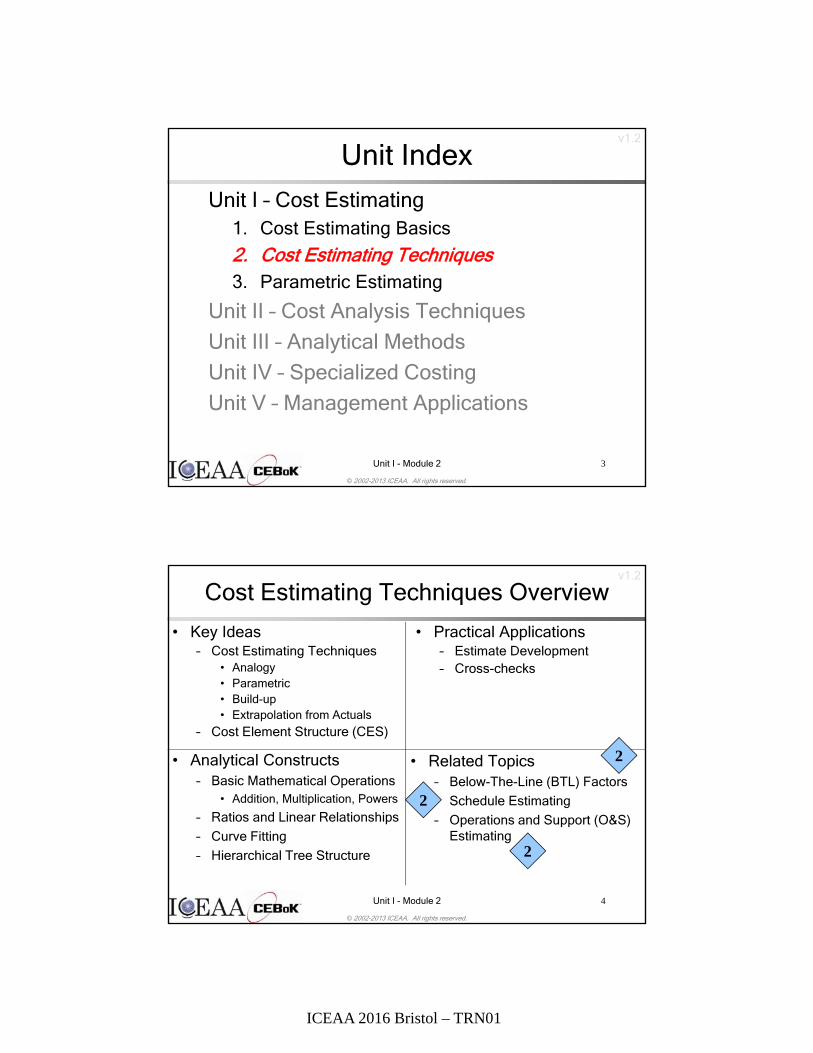
Cost Estimating Techniques Overview
• Key Ideas– Cost Estimating Techniques
• Analogy• Parametric• Build-up• Extrapolation from Actuals
– Cost Element Structure (CES)
• Practical Applications– Estimate Development– Cross-checks
• Analytical Constructs– Basic Mathematical Operations
• Addition, Multiplication, Powers
– Ratios and Linear Relationships
– Curve Fitting
– Hierarchical Tree Structure
• Related Topics– Below-The-Line (BTL) Factors
– Schedule Estimating
– Operations and Support (O&S) Estimating
2
2
2

ICEAA 2016 Bristol – TRN01
© 2002-2013 ICEAA. All rights reserved.
v1.2
Unit I - Module 2 5
A Bridge to the Future
http://commons.wikimedia.org/wiki/Image:Pierre_Pflimlin_UC_AdjAndCrop.jpg.
Your estimate
Historical data Time
now
© 2002-2013 ICEAA. All rights reserved.
v1.2
Unit I - Module 2 6
The Cost Estimating Framework
PastUnderstanding your
historical data
PresentDeveloping
estimating tools
FutureEstimating the new
system
The further in the future you want to estimate, the further back you need to go into the past!
Identical, off-the-shelf itemCatalog price
Identical items / capabilitiesPredicted inflation – recent historical trends
Manufactured itemsLearning curve – complete production run
Similar new development itemsCERs – historical costs from several programs
Dissimilar new development itemsAdjusted CERs – historical costs from several programs + paradigm shift
3
7
5

ICEAA 2016 Bristol – TRN01
© 2002-2013 ICEAA. All rights reserved.
v1.2
Unit I - Module 2 7
Cost Estimating Techniques Outline
• Core Knowledge– Introduction
– Uncertainty and Risk
– Cost Estimating Techniques
– Using Cost Estimating Techniques
– Comparison of Techniques
• Summary
• Resources
• Related and Advanced Topics
© 2002-2013 ICEAA. All rights reserved.
v1.2
Unit I - Module 2 8
Introduction
• The four essential cost estimating techniques (or methodologies) are:– Analogy
– Parametric
– Build-Up
– Extrapolation from Actuals
• Other topics will be discussed in relation to the four essential techniques– Expert Opinion
11
ICEAA 2016 Bristol – TRN01
© 2002-2013 ICEAA. All rights reserved.
v1.2
Unit I - Module 2 9
Risk Terminology
• Precision vs. accuracy– Precision = narrow range
– Accuracy = range centered on “right” answer
• Uncertainty vs. risk– Uncertainty = range of possible outcomes
• Characterization of precision
– Risk = shift of range to account for lack of accuracy of unadjusted estimates
Tip: We want estimates to be both precise and accurate, but imprecisely
accurate is better than precisely inaccurate!
Warning: Uncertainty and risk are difficult but essential.
9
Correction of bias
© 2002-2013 ICEAA. All rights reserved.
v1.2
Unit I - Module 2 10
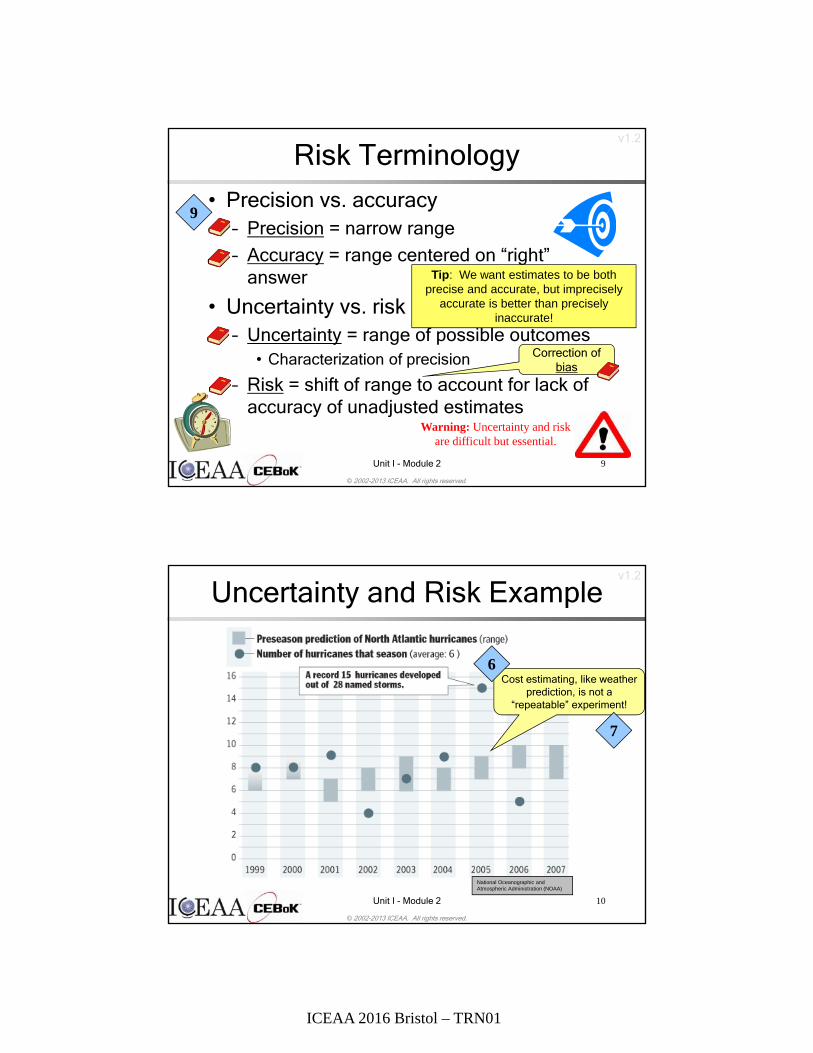
Uncertainty and Risk Example
National Oceanographic and Atmospheric Administration (NOAA)
Cost estimating, like weather prediction, is not a
“repeatable” experiment!
7
6

ICEAA 2016 Bristol – TRN01
© 2002-2013 ICEAA. All rights reserved.
v1.2
Unit I - Module 2 11
Uncertainty and Risk Illustration
Tip: Estimating cost as an average of historical data is generally a good starting point
0
5
10
15
20
25
30
35
40
45
50
0 2 4 6 8 10 12 14 16 18 20
Estimate Based on an
Average
© 2002-2013 ICEAA. All rights reserved.
v1.2
Unit I - Module 2 12
Cost Estimating Techniques• Analogy
• Parametric
• Build-Up
• Extrapolation from Actuals

ICEAA 2016 Bristol – TRN01
© 2002-2013 ICEAA. All rights reserved.
v1.2
Unit I - Module 2 13
Cost Estimating Techniques Basics
• Cost Estimating Techniques provide the structure of your cost estimate– They’re what enable you to predict future
costs based on historical data– Techniques rely on statistical properties,
logical relationships, and emotional appeal
• Four essential types– Analogy: “It’s like one of these”– Parametric: “This pattern holds”– Build-Up: “It’s made up of these”– Extrapolation from Actuals: “Stay the course”
© 2002-2013 ICEAA. All rights reserved.
v1.2
Unit I - Module 2 14
• Comparative analysis of similar systems
• Adjust costs of an analogous system to estimate the new system, using a numeric ratio based on an intuitive physical or countable metric– e.g., weight, SLOC, number of users
• Other adjustments may need to be made for any estimating methodology– Programmatic information (quantity/schedule)– Government vs. Commercial practices– Contract specifics – Economic trends
AKA Comparison Technique, Ratio,
Analysis of Analogues
Analogy - Method
5 $ $
3
“It’s like one of these”

ICEAA 2016 Bristol – TRN01
© 2002-2013 ICEAA. All rights reserved.
v1.2
Unit I - Module 2 15
Analogy - Application• Used early in the program life cycle
– Data are not available to support using more detailed methods
– Not enough data exist for a number of similar systems, but can find cost data from a single similar system
• The best results are achieved when– Adjustments can be quantified– Subjective adjustments are minimized– Similarities between old and new systems are high
1. Minimize differences to one or more that can be scaled, then2. Minimize the amount of scaling (size of adjustment factor)
• Can be used as a cross check for other methods
© 2002-2013 ICEAA. All rights reserved.
v1.2
Unit I - Module 2 16
Analogy – Considerations• Strengths
– Can be used early in programs before detailed requirements are known
– Difficult to refute if there is strong resemblance
• Weaknesses– No objective test of validity
– Danger in choice of scaling factor• Which variable
• Functional form (linear vs. non-linear scaling)
• What slope (through origin or borrowed slope)
• Challenges– Difficult to obtain cost/technical data on old/new systems for comparison
Warning 2: An adjusted analogy is, by definition, estimating outside
the range of the data.
Warning 1: An adjusted analogy is like a regression, but
the slope is just a guess.

ICEAA 2016 Bristol – TRN01
© 2002-2013 ICEAA. All rights reserved.
v1.2
Unit I - Module 2 17
Analogy - ExampleAttribute Old System New System
Engine: F-100 F-200
Thrust: 12,000 lbs 16,000 lbs
Cost: $5.2M ?
Q: What is the unit cost of the F-200?
A: $5.2M * (16,000/12,000) = $6.9Mor
($5.2M/12,000) * 16,000 = $6.9M
Tip: The mischief in analogy most often arises in the adjustment. Why do
we so readily believe a linear relationship which
passes through the origin?
Warning 2: An adjusted analogy is, by definition, estimating outside
the range of the data.
Warning 1: An adjusted analogy is like a regression, but
the slope is just a guess.
12
$Y1
Thrust
Cost
X1
X
2
X2
$Y2
© 2002-2013 ICEAA. All rights reserved.
v1.2
Unit I - Module 2 18
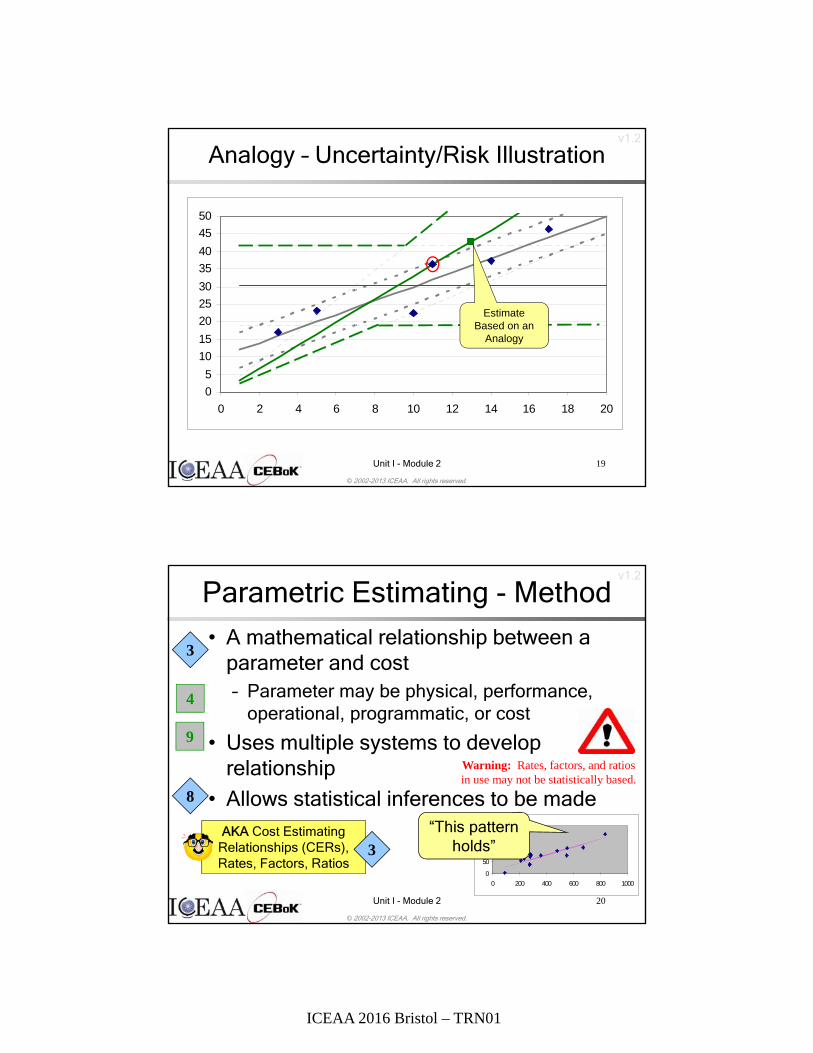
Analogy – Uncertainty and Risk
• Uncertainty– Uncertainty in point of departure
– Uncertainty in slope of adjustment
• Risk– Risks not “included” in analogy system
– Historical growth of scaling quantity
9
“Analogies: Techniques for Adjusting Them,” R. L. Coleman, J. R. Summerville, S. S. Gupta, SCEA 2004.
ICEAA 2016 Bristol – TRN01
© 2002-2013 ICEAA. All rights reserved.
v1.2
Unit I - Module 2 19
0
5
10
15
20
25
30
35
40
45
50
0 2 4 6 8 10 12 14 16 18 20
Analogy – Uncertainty/Risk Illustration
Estimate Based on an
Analogy
© 2002-2013 ICEAA. All rights reserved.
v1.2
Unit I - Module 2 20
AKA Cost Estimating Relationships (CERs), Rates, Factors, Ratios
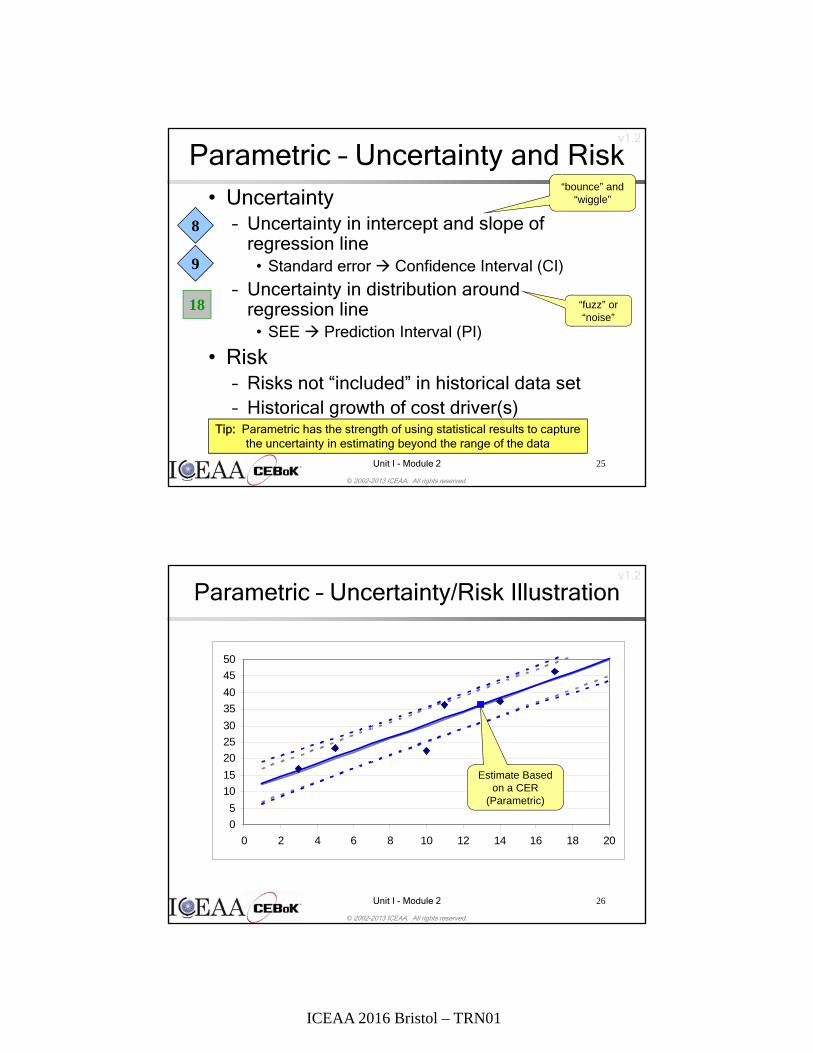
Parametric Estimating - Method
• A mathematical relationship between a parameter and cost– Parameter may be physical, performance,
operational, programmatic, or cost
• Uses multiple systems to develop relationship
• Allows statistical inferences to be made
3
8
0
50
100
150
200
0 200 400 600 800 1000
4
9
3
Warning: Rates, factors, and ratios in use may not be statistically based.
“This pattern holds”

ICEAA 2016 Bristol – TRN01
© 2002-2013 ICEAA. All rights reserved.
v1.2
Unit I - Module 2 21
Parametric Estimating - Application• Use of Parametrics
– Requires a good database which is relevant to the the system being estimated
– Excellent for use early in program life cycle before a detailed design exists
– Used as the design progresses to capture changes
• CAIV trades
• Good as a cross-check for other methods
•
•
4
16
© 2002-2013 ICEAA. All rights reserved.
v1.2
Unit I - Module 2 22
Parametric Estimating – Considerations
• Strengths– Can be easily adjusted for changes by modifying input parameters– Sensitivity Analysis - Can show how changes to certain
parameters impact the cost – Objective measures of validity– Statistical measures for uncertainty
• Weaknesses– “Black box syndrome” with pre-existing CERs, commercial models
• Challenges– Difficult to ensure consistency and validity of data
• Goal is to establish and maintain homogeneous data set
– Must constantly review relationships to ensure that relationships reflect current status of relevant programs, technology, and other factors
9
4
8
7

ICEAA 2016 Bristol – TRN01
© 2002-2013 ICEAA. All rights reserved.
v1.2
Unit I - Module 2 23
Parametric Estimating - Example• CER for Site Activation as a function of
Number of Workstations:– Site Act ($K) = 82.8 + 26.5 * Num Wkstn– Site Activation includes site survey and site
installation costs for an Automated Information System (AIS)
• Estimated based on 11 data points for installations ranging from 7 to 47 workstations
• Example expanded in Module 3
3
13
© 2002-2013 ICEAA. All rights reserved.
v1.2
Unit I - Module 2 24
Parametric Estimating – ERP Example
• The graph below shows an example CER for ERP investment as a function of the Number of Interfaces:
“Enterprise Resource Planning Systems: Sizing Metrics and CER Development”, D. Brown, SCEA National Conference and Training Workshop, 2011
NEW!
12
ICEAA 2016 Bristol – TRN01
© 2002-2013 ICEAA. All rights reserved.
v1.2
Unit I - Module 2 25
Parametric – Uncertainty and Risk• Uncertainty
– Uncertainty in intercept and slope of regression line
• Standard error Confidence Interval (CI)
– Uncertainty in distribution around regression line
• SEE Prediction Interval (PI)
• Risk– Risks not “included” in historical data set– Historical growth of cost driver(s)
9
Tip: Parametric has the strength of using statistical results to capture the uncertainty in estimating beyond the range of the data
8
18
“bounce” and “wiggle”
“fuzz” or “noise”
© 2002-2013 ICEAA. All rights reserved.
v1.2
Unit I - Module 2 26
0
5
10
15
20
25
30
35
40
45
50
0 2 4 6 8 10 12 14 16 18 20
Parametric – Uncertainty/Risk Illustration
Estimate Based on a CER
(Parametric)

ICEAA 2016 Bristol – TRN01
© 2002-2013 ICEAA. All rights reserved.
v1.2
Unit I - Module 2 27
0
5
10
15
20
25
30
35
40
45
50
0 2 4 6 8 10 12 14 16 18 20
Parametric – Uncertainty/Risk IllustrationCalibrated CER
Estimate Based on a Calibrated
CER (Parametric)
3
© 2002-2013 ICEAA. All rights reserved.
v1.2
Unit I - Module 2 28
Uncertainty and Risk Illustration
0
5
10
15
20
25
30
35
40
45
50
0 2 4 6 8 10 12 14 16 18 20
ICEAA 2016 Bristol – TRN01
© 2002-2013 ICEAA. All rights reserved.
v1.2
Unit I - Module 2 29
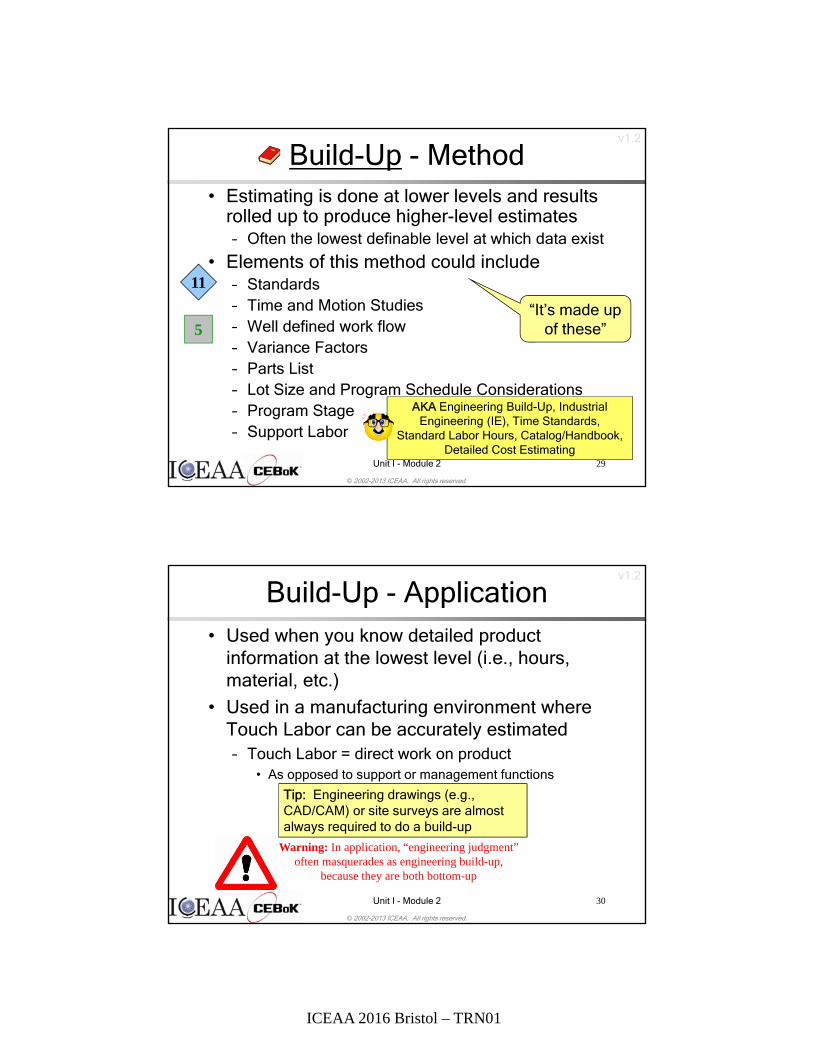
Build-Up - Method• Estimating is done at lower levels and results
rolled up to produce higher-level estimates– Often the lowest definable level at which data exist
• Elements of this method could include– Standards– Time and Motion Studies– Well defined work flow– Variance Factors– Parts List– Lot Size and Program Schedule Considerations– Program Stage– Support Labor
11
5“It’s made up
of these”
AKA Engineering Build-Up, Industrial Engineering (IE), Time Standards,
Standard Labor Hours, Catalog/Handbook, Detailed Cost Estimating
© 2002-2013 ICEAA. All rights reserved.
v1.2
Unit I - Module 2 30
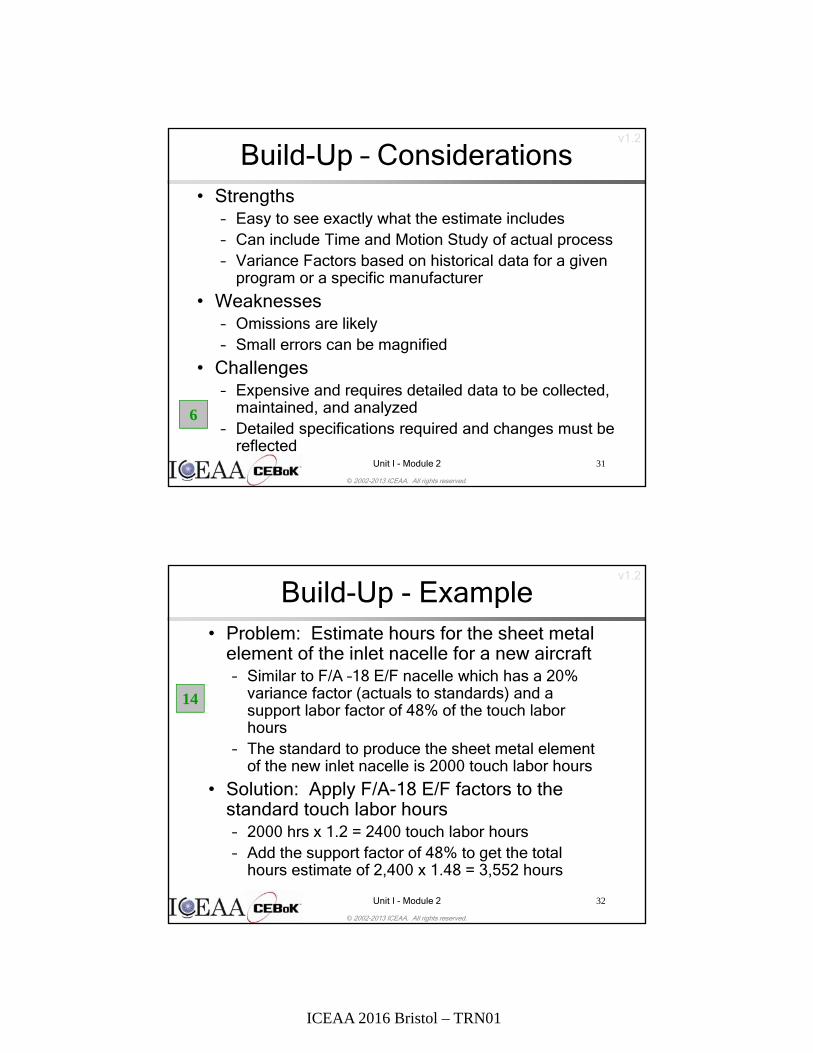
Build-Up - Application• Used when you know detailed product
information at the lowest level (i.e., hours, material, etc.)
• Used in a manufacturing environment where Touch Labor can be accurately estimated– Touch Labor = direct work on product
• As opposed to support or management functions
Warning: In application, “engineering judgment” often masquerades as engineering build-up,
because they are both bottom-up
Tip: Engineering drawings (e.g., CAD/CAM) or site surveys are almost always required to do a build-up
ICEAA 2016 Bristol – TRN01
© 2002-2013 ICEAA. All rights reserved.
v1.2
Unit I - Module 2 31
Build-Up – Considerations• Strengths
– Easy to see exactly what the estimate includes– Can include Time and Motion Study of actual process– Variance Factors based on historical data for a given
program or a specific manufacturer
• Weaknesses– Omissions are likely– Small errors can be magnified
• Challenges– Expensive and requires detailed data to be collected,
maintained, and analyzed– Detailed specifications required and changes must be
reflected
6
© 2002-2013 ICEAA. All rights reserved.
v1.2
Unit I - Module 2 32
Build-Up - Example• Problem: Estimate hours for the sheet metal
element of the inlet nacelle for a new aircraft– Similar to F/A –18 E/F nacelle which has a 20%
variance factor (actuals to standards) and a support labor factor of 48% of the touch labor hours
– The standard to produce the sheet metal element of the new inlet nacelle is 2000 touch labor hours
• Solution: Apply F/A-18 E/F factors to the standard touch labor hours– 2000 hrs x 1.2 = 2400 touch labor hours– Add the support factor of 48% to get the total
hours estimate of 2,400 x 1.48 = 3,552 hours
14
ICEAA 2016 Bristol – TRN01
© 2002-2013 ICEAA. All rights reserved.
v1.2
Unit I - Module 2 33
Build-Up – Uncertainty and Risk• Uncertainty
– Uncertainty in Design Specs– Uncertainty in performance to standards
(labor)– Uncertainty in unit costs, scrap rates
(material)
• Risk– Omissions– Historical growth of design specs– Difficulty of integration
© 2002-2013 ICEAA. All rights reserved.
v1.2
Unit I - Module 2 34
70
75
80
85
90
95
100
1 2 3 4 5 6 7 8
Quantity
Co
st
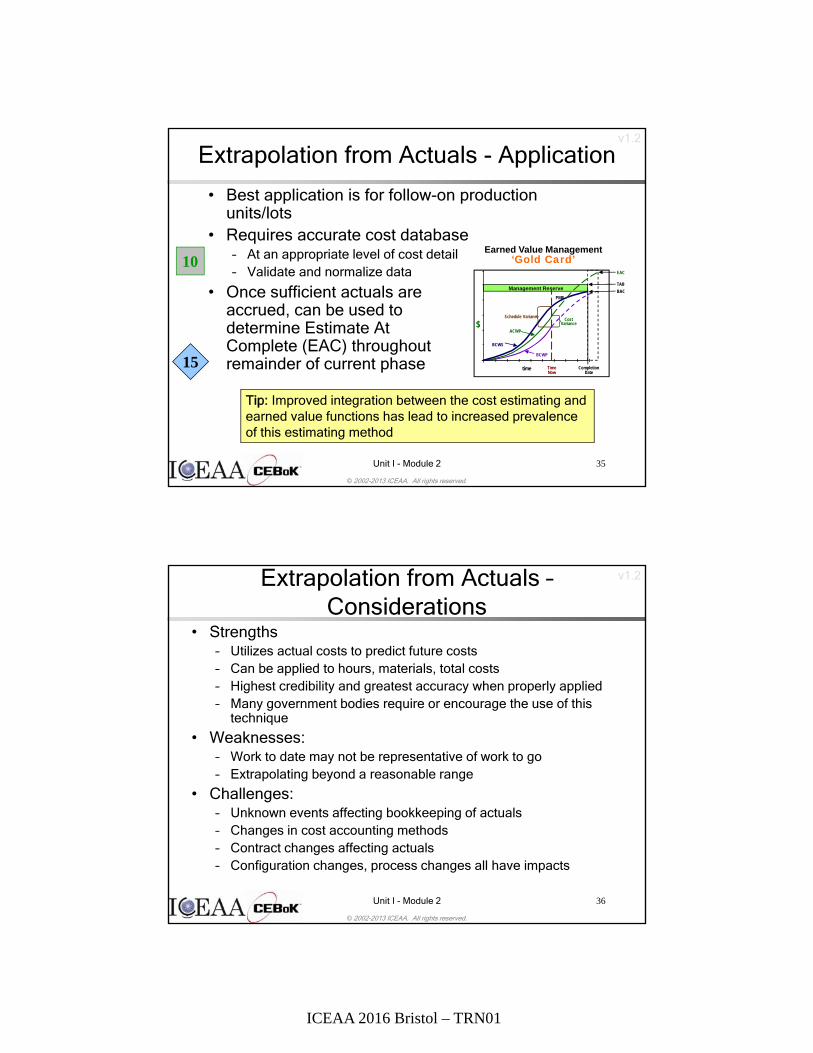
Extrapolation from Actuals
15
7
2 AKA Averages; Learning Curves, Cost Improvement Curves, Cost/Quantity Curve; Estimate at Completion (EAC), or Earned Value (EV)
“Stay the course”
• Extrapolation from actuals is a subset of some methods– Using actual costs to predict the cost of future
items of the same system• Extrapolation is used in several areas, which
include:– Averages – Learning Curves– Estimate at Completion
ICEAA 2016 Bristol – TRN01
© 2002-2013 ICEAA. All rights reserved.
v1.2
Unit I - Module 2 35
Extrapolation from Actuals - Application
• Best application is for follow-on production units/lots
• Requires accurate cost database– At an appropriate level of cost detail– Validate and normalize data
• Once sufficient actuals areaccrued, can be used todetermine Estimate AtComplete (EAC) throughoutremainder of current phase
10Earned Value Management
‘Gold Card’
Management Reserve
Cost Variance
Schedule Variance
ACWP
BCWP
BCWS
$
EAC
TimeNow
Completion Date
PMB
TAB
BAC
time15
Tip: Improved integration between the cost estimating and earned value functions has lead to increased prevalence of this estimating method
© 2002-2013 ICEAA. All rights reserved.
v1.2
Unit I - Module 2 36
Extrapolation from Actuals –Considerations
• Strengths– Utilizes actual costs to predict future costs– Can be applied to hours, materials, total costs– Highest credibility and greatest accuracy when properly applied– Many government bodies require or encourage the use of this
technique
• Weaknesses:– Work to date may not be representative of work to go– Extrapolating beyond a reasonable range
• Challenges:– Unknown events affecting bookkeeping of actuals– Changes in cost accounting methods– Contract changes affecting actuals– Configuration changes, process changes all have impacts

ICEAA 2016 Bristol – TRN01
© 2002-2013 ICEAA. All rights reserved.
v1.2
Unit I - Module 2 37
Extrapolation from Actuals –Uncertainty and Risk
• Uncertainty– Uncertainty in Learning Curve
– Uncertainty in EAC
• Risk– Insufficient cost history
– Cost history not representative of future work
– Unrealistic baselines, excessive optimism, and the EAC “tail chase”
15
7
“Do Not Sum Earned-Value-Based WBS-Element Estimates-at-Completion”, S.A. Book, SCEA National Conference and Training Workshop, 2000
© 2002-2013 ICEAA. All rights reserved.
v1.2
Unit I - Module 2 38
Expert Opinion
ICEAA 2016 Bristol – TRN01
© 2002-2013 ICEAA. All rights reserved.
v1.2
Unit I - Module 2 39
Expert Opinion - Method
• Uses an expert or a group of experts to estimate the cost of a system– One-on-one interviews
– Round-table discussions
– Delphi Technique
Warning: Expert Opinion alone is not widely considered to be a
valid technique
1
AKA Engineering Judgment, Round Table, Delphi Technique
17
Tip: Expert Opinion refers to direct assessment of costs. Expert judgment is expected to be applied in any of the previously-described legitimate cost
estimating techniques.
© 2002-2013 ICEAA. All rights reserved.
v1.2
Unit I - Module 2 40
Expert Opinion - Application
• Only used when more objective techniques are not applicable
• Used to corroborate or adjust objective data– Cross check historical based estimate
• Use for high-level, low-fidelity estimating (e.g., sanity check)
• Last resort Tip: Expert Opinion is the least regarded and most dangerous method, but it is
seductively easy. Most lexicons do not even admit it as a technique, but it is
included here for completeness.
ICEAA 2016 Bristol – TRN01
© 2002-2013 ICEAA. All rights reserved.
v1.2
Unit I - Module 2 41
Expert Opinion – Considerations• Strengths
– Good cross check of other estimate from Subject Matter Expert (SME) point of view
– Provides expert perspective that facilitates understanding
• Weaknesses– Completely subjective without use of other techniques
– Low-to-nil credibility
– Difficult to run risk around an expert opinion8
Tip: It is preferable to find data to support a credible basis, which may jibe with the expert-based estimate if it is implicitly founded on the same data
© 2002-2013 ICEAA. All rights reserved.
v1.2
Unit I - Module 2 42
Expert Opinion –Uncertainty and Risk
• Uncertainty– Human tendency to (significantly)
understate error bands
• Risk– Faulty recollection of “anecdotal actuals”
– Gaming
– Excessive optimism (or conservatism)

ICEAA 2016 Bristol – TRN01
© 2002-2013 ICEAA. All rights reserved.
v1.2
Unit I - Module 2 43
Using Cost Estimating Techniques
• Estimate Requirements• Top Down vs. Bottom Up• Cost Element Structure
(CES)• Technique Selection• Checking Results• Documentation
© 2002-2013 ICEAA. All rights reserved.
v1.2
Unit I - Module 2 44
Estimate Requirements
• Why are we developing this estimate? What will it be used for?– Milestone A, B, or C decision
– Developing a budget
– Developing a “ballpark” or rough order of magnitude (ROM) estimate
– Comparing alternatives
– Developing or evaluating proposals

ICEAA 2016 Bristol – TRN01
© 2002-2013 ICEAA. All rights reserved.
v1.2
Unit I - Module 2 45
• The below definitions are correct, although in practice many terms are used as if they are interchangeable
• Top Down vs. Bottom Up refers to the origin of the estimate– Top down (note singular) means either a target or a top-level
estimate, which is then allocated to lower levels of the WBS– Bottom up (note singular) means estimated at a lower level and then
rolled up• Top-Level vs. Lower-Level (estimate) refers to the level at
which an estimate is performed, whether or not it is allocated or rolled up, respectively
• Build-Up is a specific estimating methodology• Usual associations:
– {Top-Level estimate} or {cost target or Price to Win (PTW)} with {Top Down}
– {Lower-Level} with {Bottom Up}– {Bottom Up} with {Build-Up}
Top Down vs. Bottom Up
15
© 2002-2013 ICEAA. All rights reserved.
v1.2
Unit I - Module 2 46
Cost Element Structure• Determine what needs to be estimated and
develop an appropriate Cost Element Structure (CES) – CES Dictionary defines what is included in each
element
– Characteristics associated with cost elements that are routinely used to classify costs
• Program Phase: Development, Production, O&S
• “Color of Money”: RDT&E, Procurement, O&M
• Funding Source
• Non-Recurring or Recurring
• Direct or Indirect
1
Tip: Be sure to estimate at a level of the CES that is well
supported by defensible data
ICEAA 2016 Bristol – TRN01
© 2002-2013 ICEAA. All rights reserved.
v1.2
Unit I - Module 2 47
Technique Selection
• Review available techniques
• Compare alternatives
• Select or develop appropriate technique
• Identify primary and secondary techniquesEach cost estimating technique has strengths
and weaknesses and can be applied at different times in the life cycle of a cost estimate
© 2002-2013 ICEAA. All rights reserved.
v1.2
Unit I - Module 2 48
Checking Results• Cross Checking your results greatly increases
credibility– Example: A parametric-based estimate can also show an
analogy as a “reasonableness test”
– Doesn’t necessarily result in the exact same number, but should be a similar number (same order of magnitude)
• An independent* estimate is more detailed than a cross check and attempts to get the same result using a different technique– Example: Use the results from one commercial software
estimating package to validate the results of another
*Note: “Independent” has many meanings. The most stringent meaning is in Title 10 USC Section 2434 and involves an organization out of the chain of command of the acquiring agency. A looser meaning is an estimate done by an organization unbeholden to the program manager in funding or accountability. The loosest meaning is a separate estimate.
16

ICEAA 2016 Bristol – TRN01
© 2002-2013 ICEAA. All rights reserved.
v1.2
Unit I - Module 2 49
Documentation• Within reason, more information is better
than less
• Any information that is used in the analysis must be included in the documentation
• Documentation should be adequate for another cost analyst to replicate your technique
• Like they used to tell you in math class….
If You Don’t Show Your Work,You Don’t Get Any Credit!
© 2002-2013 ICEAA. All rights reserved.
v1.2
Unit I - Module 2 50
Comparison of Techniques

ICEAA 2016 Bristol – TRN01
© 2002-2013 ICEAA. All rights reserved.
v1.2
Unit I - Module 2 51
Comparison – Advocacy• Advocates of Build-Up drink beer and say:
– More detailed = more accurate– Analogy is prey to invalid comparisons– Parametric is too “theoretical”
• Advocates of Analogy drink bourbon and say:– Like things cost like amounts– Build-Up is prey to omission and duplication– Parametric is “diluted” by less applicable systems
• Advocates of Parametric drink wine and say:– Most thoroughly based on historical data– Analogy is just a one-point CER through the origin!– Build-Up is prey to omission and duplication
Hey, it’s a joke, lighten up!
© 2002-2013 ICEAA. All rights reserved.
v1.2
Unit I - Module 2 52
Comparison – Life Cycle Applicability
Program Life Cycle
Gross Estimates Detailed Estimates
Analogy
Parametric
ExtrapolationFrom Actuals
Engineering
Phase ATechnology
Development
Phase BDesign
Phase CProduction
Operations and Support (O&S)
19
Integrated Defense Acquisition, Technology and Logistics Life Cycle Management Chart, Defense Acquisition University (DAU), https://ilc.dau.mil/.
ICEAA 2016 Bristol – TRN01
© 2002-2013 ICEAA. All rights reserved.
v1.2
Unit I - Module 2 53
Cost Estimating Techniques Summary
• You need to have all the cost estimating techniques in your repertoire
• For each, you need to know:– What it is
– When to apply
– How to execute
– Strengths and Weaknesses
– Challenges
– The supporting data required
20
© 2002-2013 ICEAA. All rights reserved.
v1.2
Unit I - Module 2 54
Resources
• Integrated Defense Acquisition, Technology, and Logistics Life Cycle Management chart, Defense Acquisition University (DAU)– https://ilc.dau.mil/
• International Society of Parametric Analysts (ISPA), Parametric Estimating Handbook, 4th Edition, April 2008
– https://www.iceaaonline.org/documentation/files/ISPA_PEH_4th_ed_Final.pdf