Embed Size (px)
Citation preview

89PCI Journal | January–February 2008
Corrosion risk of bonded, post-tensioned concrete elementsRubén M. Salas, Andrea J. Schokker, Jeff S. West, John E. Breen, and Michael E. Kreger
Corrosion protection for bonded, internal, post-tensioning tendons can be effective. Within structural elements, post-tensioning ten-dons can be well protected by a multilayer system, which includes sound design of surface treatments; high-quality concrete; corro-sion-resistant ducts; high-quality cementitious grout, coatings, and other internal barriers in the prestressing steel; and superior an-chorage protection measures (for example, encapsulated systems and electrically isolated systems). Potential weaknesses exist in the protection system, however, when the concrete has high permea-bility (due to mixture proportions, construction techniques, and/or service and exposure conditions) or when the concrete is cracked (due to shrinkage or service loading). Additional weaknesses can occur when the post-tensioning ducts are not adequately spliced and lack adequate impermeable concrete cover or when the port-land cement grout contains voids, bleed water, or cracks. Finally, the prestressing steel may be more susceptible to corrosion if it is not adequately protected or handled during construction (including inadequate or nonexistent temporary protection techniques).
During the past two decades, numerous countries reported damage and failure of individual tendons in transportation structures, as documented by the Concrete Society in TR 471 and by fib and the International Association for Bridge and Structural Engineering (IABSE) during the Ghent, Belgium,2 and Zurich, Switzerland,3 workshops. In 1993, due to some unfortunate experiences in Europe and prior to the Ghent and Zurich workshops, a compre-hensive research program was initiated at the Phil M. Ferguson Structural Engineering Laboratory (FSEL) at the University of Texas at Austin. The program began before any serious durabil-ity problems were encountered in post-tensioned systems in the United States. In the research at FSEL, four experimental pro-grams were undertaken:
Schokker conducted a study of high-performance grouts with •the goal of improving the corrosion protection of prestressing strands. Results were published in 1999.4 This effort led to the development of stable grout mixtures and improved grouting procedures, which are widely used in current practice.
Editor’s quick points
n The effectiveness of cement grout as a corrosion- protection system for multistrand, bonded, post- tensioned tendons has been questioned.
n As part of this issue’s theme on service life and dura-bility, this paper presents a series of four experiments that investigate the material properties required to reduce or eliminate corrosion of all types of reinforcing steel used in precast, prestressed concrete structures.
n Part of this research program includes the develop-ment of design guidelines for durable, bonded, post-tensioned tendons.

January–February 2008 | PCI Journal90
Modifications to the standard ASTM G109 method included the introduction of a transverse joint in the concrete to allow evaluation of the influence of the segmental joint type, the use of a grouted prestress-ing strand as the top layer (which served as the anode) in place of one of the mild-steel reinforce-ment layers, and addition of compressive stress to simulate prestress in the structure. Figure 1 shows the specimen’s revised configuration.
Each specimen consisted of two match-cast seg-ments. Continuity between the segments was pro-vided by a 0.5-in.-diameter (12.7 mm), seven-wire prestressing strand inside a grouted duct, represent-ing a typical bonded, internal, post-tensioning ten-don in segmental bridge construction. The duct was cast into each of the match-cast segments and was not continuous across the joint. Due to the small specimen size, the strand could not effectively be post-tensioned. To simulate precompression across the joint due to post-tensioning, the pairs of match-cast segments were stressed together using external loading frames. The precompression force was maintained during the exposure testing period. All specimens had a concrete cover at the joint faces of about 3⁄4 in. (19 mm).
The long-term macrocell corrosion test series was initiated in •1993 to investigate corrosion protection for post-tensioning tendons in precast concrete segmental construction. After four and a half years of exposure testing, half of the macrocell laboratory specimens underwent internal examination.5 The remaining specimens underwent internal examination after eight years of exposure testing.6
The long-term beam corrosion test series examined the effects •of post-tensioning and crack width on corrosion protection of internal tendons. It was implemented in two phases: phase I was initiated in December 1997, and phase II began in December 1998. Comprehensive internal examinations of ap-proximately half of these specimens were performed in 2002.7
The long-term column corrosion test series was initiated in •1996 to examine corrosion protection in vertical elements. Specimens underwent internal examination in January 2003.8
This paper documents the results from the macrocell, beam, and column corrosion test series and recommends durability-design guidelines based on the overall research results.
Macrocell corrosion test series
Thirty-eight macrocell specimens developed by Vignos9 were used to investigate the corrosion protection of internal tendons at segmental joints. The testing method was based on ASTM G109,10 which was modified to examine post-tensioning tendons in grouted ducts and to simulate segmental joints.
Figure 1. Pictured are the test setup and specimen details of the macrocell corrosion test series. Note: 1 in. = 25.4 mm; no. 4 = 13M.
plexiglass dam
ductgrout
100OhmsR
2 no. 4 reinforcing bars
Longitudinal Section
3.5% NaCl solution
gasket (when applicable)
7-wire strand
match-castsegmental joint
1/4 in. end cover12 in.
5 in.
Table 1. Macrocell corrosion test series specimen notationJoint type Duct type Prestressing level Grout typeDJ = dry joint S = galvanized steel L = low, 5 psi NG = normal grout
SE = standard epoxy P = plastic M = medium, 50 psi SF = silica fume added
EG = epoxy with gasket — H = high, 190 psi CI = corrosion inhibitor
Example: DJ-S-L-NG.
Note: 1 psi = 6.895 kPa.

Examination
A detailed visual inspection was performed before internal exami-nations on all specimens after their respective duration of aggres-sive exposure testing, either four years and five months or eight years. Figure 3 shows an example of specimen condition prior to internal examination.
To evaluate and compare the test specimens, a generalized rating system was developed. The longitudinal mild-steel reinforce-ment, galvanized steel duct, and strand were subdivided into eight 11⁄2-in.-long (38 mm) segments. The steel was examined, and a rating was assigned to each segment describing the corro-sion severity. The extent of corrosion was evaluated by summing the segmental corrosion ratings for each type of steel within each macrocell specimen, which were all added together to give a total corrosion rating for all of the steel within each beam. These values were then used to make comparisons between specimens. A de-tailed description of the rating system is included in Salas et al.6
Test variables
Four protection variables were investigated in this program. Table 1 shows notations used in speci-men designations.
Joint prestress The three levels were low (5 psi [35 kPa]), medium (50 psi [345 kPa]), and high (190 psi [1310 kPa]):
The low prestress level could represent the lev-•el of precompression encountered in a precast concrete segmental column under self-weight.
The medium prestress level was based on the •AASHTO guide specifications.11
The high prestress level corresponded to about •3( f '
c )1/2 psi for this testing program, using
concrete with a water-cement ratio (w/c) of 0.44 and a design compressive strength f '
c of 5
ksi (35 MPa).
Match-cast joint type The three types were dry joints, epoxy joints with gaskets, and epoxy joints without gaskets. The match-cast dry joints were included as a worst-case scenario for comparison purposes.
Duct type The two types were standard galva-nized steel and plastic.
Cementitious grout type The three types were plain grout (no admixtures, w/c = 0.40), grout with silica fume (13% cement replacement by weight, water–cementitious materials ratio [w/cm] = 0.32, high-range water-reducing admixture added), and grout with a commercial calcium nitrite corrosion inhibitor (w/c = 0.40).
A total of 19 specimen types were developed to ad-dress all of the variables. Each specimen type was duplicated for a total of 38 specimens. All speci-mens used Texas Department of Transportation (TxDOT) concrete with w/c = 0.44 and f '
c =
5 ksi (35 MPa).
Exposure testing
Exposure conditions during testing consisted of two-week-long wet cycles using a 3% sodium chloride solution followed by two-week-long dry cycles. Two forms of regular measurements were taken to evaluate specimen performance during testing: macrocell cor-rosion currents and half-cell (HC) potential measure-ments. Figure 2 shows sample HC potential readings.
91PCI Journal | January–February 2008
Figure 2. Shown is an example of half-cell potential plots for the macrocell corrosion test series.
-800
-700
-600
-500
-400
-300
-200
-100
0
100
0 250 500 750 1000 1250 1500 1750 2000 2250 2500 2750 3000
Time, days
DJ-S-L-NG-2; Dry Joint, Steel DuctDJ-P-L-NG-2; Dry Joint, Plastic DuctSE-S-L-NG-1; Epoxy Joint, Steel DuctSE-P-L-NG-1; Epoxy Joint, Plastic Duct
Above -130 mV, < 10% probabilityof corrosion. As per ASTM C876
Below -280 mV, > 90% probabilityof corrosion. As per ASTM C876
Hal
f-ce
ll p
ote
nti
al, m
V
Figure 3. Pictured is an example of specimen condition prior to internal examination for the macrocell corrosion test series. Note: Table 1 defines specimen notations. 1 mm = 0.03937 in.
January–February 2008 | PCI Journal92
Beam corrosion test series
Localized corrosion was of great interest in this research program because this is the type of cor-rosion that will ultimately result in failure of the structural element or structure.
Results
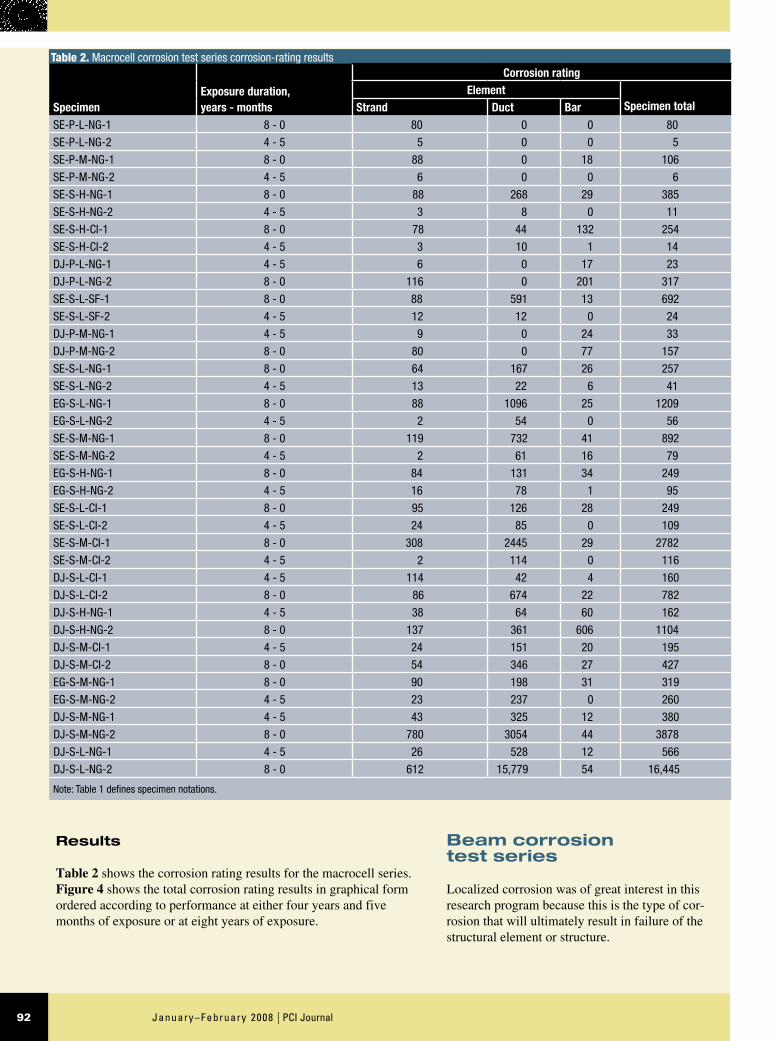
Table 2 shows the corrosion rating results for the macrocell series. Figure 4 shows the total corrosion rating results in graphical form ordered according to performance at either four years and five months of exposure or at eight years of exposure.
Table 2. Macrocell corrosion test series corrosion-rating results
SpecimenExposure duration, years - months
Corrosion ratingElement
Specimen totalStrand Duct BarSE-P-L-NG-1 8 - 0 80 0 0 80
SE-P-L-NG-2 4 - 5 5 0 0 5
SE-P-M-NG-1 8 - 0 88 0 18 106
SE-P-M-NG-2 4 - 5 6 0 0 6
SE-S-H-NG-1 8 - 0 88 268 29 385
SE-S-H-NG-2 4 - 5 3 8 0 11
SE-S-H-CI-1 8 - 0 78 44 132 254
SE-S-H-CI-2 4 - 5 3 10 1 14
DJ-P-L-NG-1 4 - 5 6 0 17 23
DJ-P-L-NG-2 8 - 0 116 0 201 317
SE-S-L-SF-1 8 - 0 88 591 13 692
SE-S-L-SF-2 4 - 5 12 12 0 24
DJ-P-M-NG-1 4 - 5 9 0 24 33
DJ-P-M-NG-2 8 - 0 80 0 77 157
SE-S-L-NG-1 8 - 0 64 167 26 257
SE-S-L-NG-2 4 - 5 13 22 6 41
EG-S-L-NG-1 8 - 0 88 1096 25 1209
EG-S-L-NG-2 4 - 5 2 54 0 56
SE-S-M-NG-1 8 - 0 119 732 41 892
SE-S-M-NG-2 4 - 5 2 61 16 79
EG-S-H-NG-1 8 - 0 84 131 34 249
EG-S-H-NG-2 4 - 5 16 78 1 95
SE-S-L-CI-1 8 - 0 95 126 28 249
SE-S-L-CI-2 4 - 5 24 85 0 109
SE-S-M-CI-1 8 - 0 308 2445 29 2782
SE-S-M-CI-2 4 - 5 2 114 0 116
DJ-S-L-CI-1 4 - 5 114 42 4 160
DJ-S-L-CI-2 8 - 0 86 674 22 782
DJ-S-H-NG-1 4 - 5 38 64 60 162
DJ-S-H-NG-2 8 - 0 137 361 606 1104
DJ-S-M-CI-1 4 - 5 24 151 20 195
DJ-S-M-CI-2 8 - 0 54 346 27 427
EG-S-M-NG-1 8 - 0 90 198 31 319
EG-S-M-NG-2 4 - 5 23 237 0 260
DJ-S-M-NG-1 4 - 5 43 325 12 380
DJ-S-M-NG-2 8 - 0 780 3054 44 3878
DJ-S-L-NG-1 4 - 5 26 528 12 566
DJ-S-L-NG-2 8 - 0 612 15,779 54 16,445
Note: Table 1 defines specimen notations.
93PCI Journal | January–February 2008
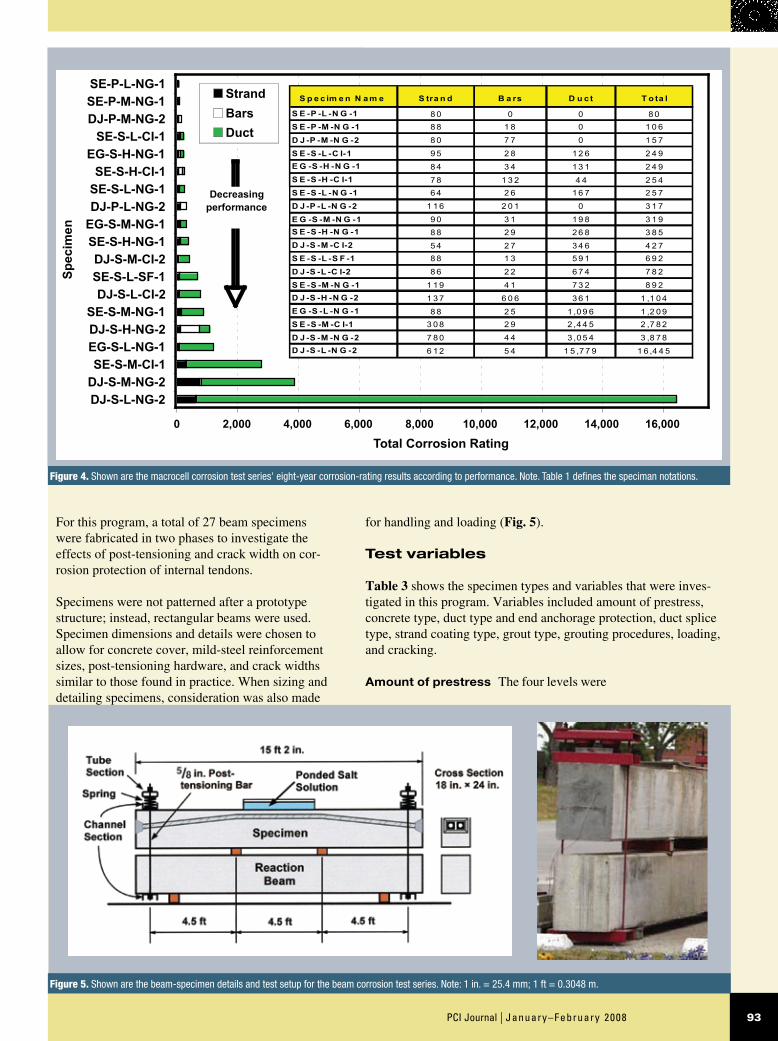
for handling and loading (Fig. 5).
Test variables
Table 3 shows the specimen types and variables that were inves-tigated in this program. Variables included amount of prestress, concrete type, duct type and end anchorage protection, duct splice type, strand coating type, grout type, grouting procedures, loading, and cracking.
Amount of prestress The four levels were
For this program, a total of 27 beam specimens were fabricated in two phases to investigate the effects of post-tensioning and crack width on cor-rosion protection of internal tendons.
Specimens were not patterned after a prototype structure; instead, rectangular beams were used. Specimen dimensions and details were chosen to allow for concrete cover, mild-steel reinforcement sizes, post-tensioning hardware, and crack widths similar to those found in practice. When sizing and detailing specimens, consideration was also made
Figure 4. Shown are the macrocell corrosion test series' eight-year corrosion-rating results according to performance. Note. Table 1 defines the speciman notations.
0 2,000 4,000 6,000 8,000 10,000 12,000 14,000 16,000
SE-P-L-NG-1SE-P-M-NG-1DJ-P-M-NG-2
SE-S-L-CI-1EG-S-H-NG-1
SE-S-H-CI-1SE-S-L-NG-1DJ-P-L-NG-2
EG-S-M-NG-1SE-S-H-NG-1DJ-S-M-CI-2SE-S-L-SF-1DJ-S-L-CI-2
SE-S-M-NG-1DJ-S-H-NG-2EG-S-L-NG-1SE-S-M-CI-1
DJ-S-M-NG-2DJ-S-L-NG-2
Total Corrosion Rating
Strand
Bars
Duct
S p e c im e n N a m e S tra n d B a rs D u c t T o ta l
S E -P -L -N G -1 8 0 0 0 8 0
S E -P -M -N G -1 8 8 1 8 0 1 0 6
D J -P -M -N G -2 8 0 7 7 0 1 5 7
S E -S -L -C I-1 9 5 2 8 1 2 6 2 4 9
E G -S -H -N G -1 8 4 3 4 1 3 1 2 4 9
S E -S -H -C I-1 7 8 1 3 2 4 4 2 5 4
S E -S -L -N G -1 6 4 2 6 1 6 7 2 5 7
D J -P -L -N G -2 1 1 6 2 0 1 0 3 1 7
E G -S -M -N G -1 9 0 3 1 1 9 8 3 1 9
S E -S -H -N G -1 8 8 2 9 2 6 8 3 8 5
D J -S -M -C I-2 5 4 2 7 3 4 6 4 2 7
S E -S -L -S F -1 8 8 1 3 5 9 1 6 9 2
D J -S -L -C I-2 8 6 2 2 6 7 4 7 8 2
S E -S -M -N G -1 1 1 9 4 1 7 3 2 8 9 2
D J -S -H -N G -2 1 3 7 6 0 6 3 6 1 1 ,1 0 4
E G -S -L -N G -1 8 8 2 5 1 ,0 9 6 1 ,2 0 9
S E -S -M -C I-1 3 0 8 2 9 2 ,4 4 5 2 ,7 8 2
D J -S -M -N G -2 7 8 0 4 4 3 ,0 5 4 3 ,8 7 8
D J -S -L -N G -2 6 1 2 5 4 1 5 ,7 7 9 1 6 ,4 4 5
Decreasing performance
Sp
ecim
en
Figure 5. Shown are the beam-specimen details and test setup for the beam corrosion test series. Note: 1 in. = 25.4 mm; 1 ft = 0.3048 m.

January–February 2008 | PCI Journal94
defined as the tensile force component provided by prestressing steel at the nominal flexural capacity of the section. The selected specimen dimensions and requirement to use strand in pairs dictated the use of eight strands for the 100%S PS section, six strands for the 100%U PS section, and four strands for the 2⁄3PS section.
Concrete The three types were the following:
The TxDOT Class C concrete contained Type •I cement, maximum aggregate size of 3⁄4 in. (19 mm), retarder, and entrained air admixture. It had an approximate compressive strength of 5 ksi (35 MPa), a w/c of 0.533, and a slump of 4 in. (100 mm).
The TxDOT Class C concrete with fly ash •
non-prestressed (non-PS), •
mixed reinforcement (• 2⁄3PS and passive reinforcement),
100% prestressed based on ultimate strength design •(100%U PS), and
100% prestressed based on allowable stress design (100%S PS). •
Reinforcement was proportioned based on the total allowable service load moment (dead load moment plus live load moment) computed for the 100%S PS section. Assuming a ratio of dead load to live load of 1.5, the calculated permissible total service load moment was used to compute the dead and live load moments. The factored moment was then computed and used to proportion the reinforcement for the other sections. The 100%S PS section was designed to meet the stress limits provided in the AASHTO LRFD 199812 specifications. The amount of prestress, in percentage, is
SpecimenPrestressing levels Concrete types
Duct type Duct splice
Strand coating
Grout types Loading Crack
Grouting procedure
Phase I
1.1 Non-PS TxDOT Class C n.a. n.a. n.a n.a. No load None n.a.1.2 Non-PS TxDOT Class C n.a. n.a. n.a. n.a. Service load ≤ 0.5 in. n.a.1.3 Non-PS TxDOT Class C n.a. n.a. n.a. n.a. Service load ≤ 0.5 in. n.a.1.4 Non-PS TxDOT Class C n.a. n.a. n.a. n.a. Overload ≤ 0.5 in. n.a.2.1 2⁄3 PS TxDOT Class C Steel IS & HS None TxDOT Std Below Service load Very small PTI2.2 2⁄3 PS TxDOT Class C Steel IS & HS None TxDOT Std Service load ≤ 0.5 in. PTI2.3 2⁄3 PS TxDOT Class C Steel IS & HS None TxDOT Std Service load ≤ 0.5 in. PTI2.4 2⁄3 PS TxDOT Class C Steel IS & HS None TxDOT Std Overload ≤ 0.5 in. PTI2.11 2⁄3 PS TxDOT Class C Steel IS & HS None Fly Ash Service load ≤ 0.5 in. PTI3.1 100% U PS TxDOT Class C Steel IS & HS None TxDOT Std No load ≤ 0.5 in. PTI3.2 100% U PS TxDOT Class C Steel IS & HS None TxDOT Std Service load Very small PTI3.3 100% U PS TxDOT Class C Steel IS & HS None TxDOT Std Overload ≤ 0.5 in. PTI3.4 100% U PS TxDOT Class C Steel IS & HS None TxDOT Std Service load ≤ 0.5 in. PTI3.5 100% U PS TxDOT Class C Steel IS & HS None TxDOT Std Overload ≤ 0.5 in. PTI4.1 100% S PS TxDOT Class C Steel IS & HS None TxDOT Std Service load none PTI4.2 100% S PS TxDOT Class C Steel IS & HS None TxDOT Std Service load none PTI
Phase II
1.5 Non-PS TxDOT Class C w/Fly Ash n.a. n.a. n.a. n.a. Service load ≤ 0.5 in. n.a.1.6 Non-PS High Performance n.a. n.a. n.a. n.a. Service load ≤ 0.5 in. n.a.2.5 2⁄3 PS TxDOT Class C w/Fly Ash Steel IS & HS None TxDOT Std Service load ≤ 0.5 in. PTI2.6 2⁄3 PS High-Performance Steel IS & HS None TxDOT Std Service load ≤ 0.5 in. PTI2.7 2⁄3 PS TxDOT Class C Steel IS Epoxy TxDOT Std Service load ≤ 0.5 in. PTI2.8 2⁄3 PS TxDOT Class C Steel IS & HS Galvanized TxDOT Std Service load ≤ 0.5 in. PTI2.9 2⁄3 PS TxDOT Class C Steel IS & HS None TxDOT Std Service load ≤ 0.5 in. Poor2.10 2⁄3 PS TxDOT Class C Steel IS None Antibleed Service load ≤ 0.5 in. PTI2.12 2⁄3 PS TxDOT Class C Plastic None None TxDOT Std Service load ≤ 0.5 in. PTI3.6 100% U PS TxDOT Class C w/Fly Ash Steel IS & HS None TxDOT Std Service load ≤ 0.5 in. PTI3.7 100% U PS High Performance Steel IS & HS None TxDOT Std Service load ≤ 0.5 in. PTI
Note: Non-PS = non-prestressed; 2⁄3 PS = 2⁄3 prestress + passive reinforcement; 100% U PS = 100% prestressed based on ultimate strength design; 100% S PS = 100% prestressed based on allowable stress design; TxDOT = Texas Department of Transportation; IS = industry standard duct tape; HS = heat shrink; PTI = Post-Tensioning Institute’s recommended grouting procedures. 1 in. = 25.4 mm.
Table 3. Beam corrosion test series specimen variables

95PCI Journal | January–February 2008
VSL Corp.’s VSLAB+ system. This system also allowed the inves-tigation of an encapsulated system for end anchorage protection. The system was basically airtight and watertight.
Duct splice The two types were the following:
The industry-standard splice consisted of a 12-in.-long •(300 mm) oversized duct sealed with duct tape.
The heat-shrink splice consisted of an 8-in.-long (200 mm) •heat-shrink tubing with an original diameter of 4 in. (100 mm).
The splices were used only in steel ducts because the plastic ducts were continuous.
Strand coating The three coating types were uncoated, epoxy, and galvanized. All but two specimens contained uncoated strands, while the epoxy and galvanized coatings were each applied to one specimen.
Grout type Three types of grout were used, but only two of the specimens used high-performance grout. One specimen received the fly-ash, high-performance grout, while the other received the antibleed, high-performance grout. The grouts are detailed in the following list:
The TxDOT standard grout had a • w/cm of 0.44 and contained 0.9% Interplast-N (high-range water-reducing admixture/ex-pansive admixture).
The high-performance fly ash grout had a • w/cm of 0.35 and contained 30% cement replacement with fly ash by weight and 4 mL/kg (0.06 oz/lb) of a high-range water-reducing admixture.
The high-performance antibleed grout had a • w/cm of 0.33 and contained 2% by weight of antibleed admixture.
Grouting procedures One specimen simulated the effect of poor grouting procedures. This specimen had one tendon grouted by the Post-Tensioning Institute's standard method and one tendon poorly grouted by interrupting the injection twice during the grout-ing procedure, thereby producing voids.
Loading The four loading conditions were unloaded, below service load (to produce first crack), service load, and temporary overload. A sustained pair of 50 kip (222 kN) loads were distrib-uted with a reaction beam and tensioned spring system (Fig. 5). Overloaded specimens were subjected to a temporary load equal to 133% of the computed allowable service load.
Cracking Cracking was investigated using the three types of specimens that would be expected to crack under service loads (Non-PS, 2⁄3PS, and 100%U PS). Only 100%S PS specimens would not be expected to crack under service loading. Crack widths for investigation were selected based on a survey of relevant literature and the moment-crack behavior computed for each section.
contained Type I cement, 25% cement replace-ment with fly ash by weight, and a maximum aggregate size of 3⁄4 in. (19 mm). It had an approximate compressive strength of 6 ksi (41 MPa), a w/cm of 0.44, and a slump of 4 in. (100 mm).
The high-performance concrete contained Type •I cement, 25% cement replacement with fly ash by weight, and a high-range water-reducing admixture. It had an approximate compressive strength of 10 ksi (69 MPa), a w/cm of 0.29, and a slump of about 8 in. (200 mm).
Duct type and end anchorage protection The two duct types were galvanized steel and polyeth-ylene plastic. Only one specimen used the plastic duct, which was a polyethylene duct that was part of
SpecimenPrestressing levels Concrete types
Duct type Duct splice
Strand coating
Grout types Loading Crack
Grouting procedure
Phase I
1.1 Non-PS TxDOT Class C n.a. n.a. n.a n.a. No load None n.a.1.2 Non-PS TxDOT Class C n.a. n.a. n.a. n.a. Service load ≤ 0.5 in. n.a.1.3 Non-PS TxDOT Class C n.a. n.a. n.a. n.a. Service load ≤ 0.5 in. n.a.1.4 Non-PS TxDOT Class C n.a. n.a. n.a. n.a. Overload ≤ 0.5 in. n.a.2.1 2⁄3 PS TxDOT Class C Steel IS & HS None TxDOT Std Below Service load Very small PTI2.2 2⁄3 PS TxDOT Class C Steel IS & HS None TxDOT Std Service load ≤ 0.5 in. PTI2.3 2⁄3 PS TxDOT Class C Steel IS & HS None TxDOT Std Service load ≤ 0.5 in. PTI2.4 2⁄3 PS TxDOT Class C Steel IS & HS None TxDOT Std Overload ≤ 0.5 in. PTI2.11 2⁄3 PS TxDOT Class C Steel IS & HS None Fly Ash Service load ≤ 0.5 in. PTI3.1 100% U PS TxDOT Class C Steel IS & HS None TxDOT Std No load ≤ 0.5 in. PTI3.2 100% U PS TxDOT Class C Steel IS & HS None TxDOT Std Service load Very small PTI3.3 100% U PS TxDOT Class C Steel IS & HS None TxDOT Std Overload ≤ 0.5 in. PTI3.4 100% U PS TxDOT Class C Steel IS & HS None TxDOT Std Service load ≤ 0.5 in. PTI3.5 100% U PS TxDOT Class C Steel IS & HS None TxDOT Std Overload ≤ 0.5 in. PTI4.1 100% S PS TxDOT Class C Steel IS & HS None TxDOT Std Service load none PTI4.2 100% S PS TxDOT Class C Steel IS & HS None TxDOT Std Service load none PTI
Phase II
1.5 Non-PS TxDOT Class C w/Fly Ash n.a. n.a. n.a. n.a. Service load ≤ 0.5 in. n.a.1.6 Non-PS High Performance n.a. n.a. n.a. n.a. Service load ≤ 0.5 in. n.a.2.5 2⁄3 PS TxDOT Class C w/Fly Ash Steel IS & HS None TxDOT Std Service load ≤ 0.5 in. PTI2.6 2⁄3 PS High-Performance Steel IS & HS None TxDOT Std Service load ≤ 0.5 in. PTI2.7 2⁄3 PS TxDOT Class C Steel IS Epoxy TxDOT Std Service load ≤ 0.5 in. PTI2.8 2⁄3 PS TxDOT Class C Steel IS & HS Galvanized TxDOT Std Service load ≤ 0.5 in. PTI2.9 2⁄3 PS TxDOT Class C Steel IS & HS None TxDOT Std Service load ≤ 0.5 in. Poor2.10 2⁄3 PS TxDOT Class C Steel IS None Antibleed Service load ≤ 0.5 in. PTI2.12 2⁄3 PS TxDOT Class C Plastic None None TxDOT Std Service load ≤ 0.5 in. PTI3.6 100% U PS TxDOT Class C w/Fly Ash Steel IS & HS None TxDOT Std Service load ≤ 0.5 in. PTI3.7 100% U PS High Performance Steel IS & HS None TxDOT Std Service load ≤ 0.5 in. PTI
Note: Non-PS = non-prestressed; 2⁄3 PS = 2⁄3 prestress + passive reinforcement; 100% U PS = 100% prestressed based on ultimate strength design; 100% S PS = 100% prestressed based on allowable stress design; TxDOT = Texas Department of Transportation; IS = industry standard duct tape; HS = heat shrink; PTI = Post-Tensioning Institute’s recommended grouting procedures. 1 in. = 25.4 mm.
Table 3. Beam corrosion test series specimen variables

January–February 2008 | PCI Journal96
corrosion within the specimen if the HC potential reading was less than -130 mV and more than 90% probability of corrosion if the reading was greater than -280 mV.
Examination
After four and a half years of exposure testing for phase I beam specimens and three and a half years for phase II beam specimens, detailed visual in-spections of the exterior conditions were performed on all 27 specimens, and exposure-testing data were thoroughly analyzed. Based on these evalu-ations, full internal examinations of 12 specimens and partial internal examinations of 2 specimens were performed. Internal visual examinations were performed after removing all concrete to compare the corrosion protection provided by different ma-terials and variables in the duct, bar, and strands. The remaining specimens will continue exposure testing until reaching a lifespan of eight years. Figure 7 shows an example of specimen condition prior to internal examination.
The rating system selected for evaluation was similar to the one used for the macrocell corrosion test series. For the beam specimens, the longitudi-nal mild-steel reinforcement, steel duct, and strand were subdivided into thirty-six 2-in.-long (50 mm) segments. The top portion from each stirrup was divided into seven 2-in.-long (50 mm) segments. Due to the dimensions of the section removed from each beam for internal examination, there were two 3-in.-long (75 mm) segments from the sides (legs) of the stirrups to be analyzed. Each 3-in.-long leg was considered one segment, for a total of nine segments per stirrup. The steel was examined, and a rating was assigned to describe the corro-
Exposure testing
The exposure condition consisted of a ponded region in the middle of the beam specimens that applied two-week wet cycles using a 3.5% sodium chloride solution followed by two-week dry cycles. This exposure condition was chosen to accelerate corrosion. Exposure testing for phase I began one year before phase II, but samples for both phases were internally examined at the same time.
To monitor the corrosion activity of the specimens during ex-posure, multiple non-destructive methods were used: visual inspection, crack-width measurements, HC potential readings, corrosion-rate measurements, and chloride-penetration measure-ments. Figure 6 shows an example of HC potential readings. The specimens received continuous exposure, but there were interrup-tions in the data-acquisition process. Probabilities of corrosion were based on ASTM C876,13 which formed the basis for the horizontal lines in Fig. 6. There was less than 10% probability of
Figure 7. Shown is a beam corrosion test series example of specimen condition prior to internal examination and generalized corrosion ratings for phase I internal exami-nation beams. Note: 1 ft = 0.3048 m.
0 1 0 0 0 2 0 0 0 3 0 0 0 4 0 0 0 5 0 0 0 6 0 0 0
2 .3 (D 2 )
2 .3 (D 1 )
2 .1 1 (D 1 )
2 .1 1 (D 2 )
3 .3 (D 1 )
3 .3 (D 2 )
3 .2 (D 1 )
3 .2 (D 2 )
3 .1 (D 1 )
4 .2 (D 1 )
4 .2 (D 2 )
3 .1 (D 2 )
R e b a r
D u c t
S tra n d
In c re a s e in
C o rro s io n
R e s is ta n c e
BB
Rating / ft
Be
am
Figure 6. This is an example of half-cell potential readings and contour maps at 1594 days of testing for the beam corrosion test series.Note: Discontinuities in the graph are due to interruptions in the data acquisition process; nonetheless, specimens remained under continuous exposure. In the graph, Vsce means voltage at a saturated calo-mel electrode. Probabilities of corrosion were based on ASTM C87613 and are indicated on the graph with horizontal lines. There is less than 10% probability of corrosion within the specimen with values less than -130mV, and more than 90% probability of corrosion with values greater than -280 mV.
-430 to -580 VSCE
-280 to -430 VSCE
-130 to -280 VSCE
+20 to -130 VSCE
-900
-800
-700
-600
-500
-400
-300
-200
-100
0
100
200
0 200 400 600 800 1000 1200 1400 1600 1800
3.1: U nloaded, U ncracked
3.2: Service Load , Uncracked
3.3: O verload , Cracked
< 10%
Probab ility
> 90%
Probab ility
Spec imen 3.1 Spec imen 3.2 Spec imen 3.3
Specimen 3.1 - Unloaded
Specimen 3.2 – Service (uncracked)
S
Specimen 3.3 - Over loaded (cracked) H
alf c
ell p
oten
tial,
-mV
Time, days

97PCI Journal | January–February 2008
Results
Tables 4 and 5 show the corrosion-rating results. Reference 7 includes a detailed set of corrosion-rating graphs for all specimens. Figure 7 shows the general corrosion ratings for phase I beams after internal examina-tion. The two ducts in each specimen are indicated by D1 and D2.
Extremely severe duct corrosion occurred in 2⁄3PS specimens, which was due to a higher frequency of cracking in these speci-mens. In general, severe duct destruction and pitting were found in most specimens with metal ducts.
sion severity within each segment. One rating was assigned to the inside and outside surfaces of each leg. The localized corrosion rating was taken as the maximum rating recorded for a segment for each element. The total corrosion rating for each length of material was obtained by summing the severity ratings of each segment. The extent of corrosion was analyzed by obtaining the generalized corro-sion ratings, which were calculated by dividing the total corrosion rating by the total length of each segment. This procedure was unique to the beam specimens. The result is a rating per foot of each element.
Specimen StirrupMild-steel reinforcement
North duct
South duct
North strand
South strand
1.1* 295 8 n.a. n.a. n.a. n.a.
1.3 770 261 n.a. n.a. n.a. n.a.
2.3 2236 6241 2107 6248 20 56
2.11 2978 7757 2440 1673 20 26
3.1* 4 0 0 0 20 22
3.2 462 4 2 2 28 28
3.3 867 294 924 685 64 32
4.2 236 169 8 4 22 16
1.5 296 8 n.a. n.a. n.a. n.a.
1.6 361 15 n.a. n.a. n.a. n.a.
2.5 866 20 8 1776 32 28
2.6 88 190 4 34 16 16
3.6 245 4 44 8 16 16
3.7 16 2 1164 20 28 28
*The specimen underwent only a partial internal examination. Note: Localized corrosion ratings were determined as the maximum rating recorded for any 2 in. segment from each element. Phase I specimens 1.2, 1.4, 2.1, 2.2, 2.4, 3.4, 3.5, and 4.1 and phase II specimens 2.7, 2.8, 2.9, 2.10, and 2.12 will be internally examined at a later date. n.a. = not applicable.
Table 4. Localized corrosion-rating results for beam corrosion test series
Specimen StirrupMild-steel reinforcement
North duct
South duct
North strand
South strand
1.1* 101 1 n.a. n.a. n.a. n.a.
1.3 1231 91 n.a. n.a. n.a. n.a.
2.3 1359 467 4299 5069 96 122
2.11 1923 476 1504 1413 97 92
3.1* 15 0 0 0 119 96
3.2 95 1 1 0 168 168
3.3 423 36 429 220 161 118
4.2 189 15 7 4 96 96
1.5 224 6 n.a. n.a. n.a. n.a.
1.6 92 7 n.a. n.a. n.a. n.a.
2.5 356 4 21 309 168 168
2.6 41 7 2 10 95 96
3.6 78 4 24 6 91 96
3.7 27 0 214 12 168 168
*The specimen underwent only a partial internal examination. Note: Ratings were calculated by summing the localized ratings of all segments for each element and dividing the result by the length of each element. Phase I speci-mens 1.2, 1.4, 2.1, 2.2, 2.4, 3.4, 3.5, and 4.1 and phase II specimens 2.7, 2.8, 2.9, 2.10, and 2.12 will be internally examined at a later date. n.a. = not applicable.
Table 5. Generalized corrosion-rating results for beam corrosion test series

January–February 2008 | PCI Journal98
Test variables
Six protection variables were investigated in this program. Table 6 shows the notation used in column-specimen designations.Variables included amount of prestress, concrete type, column-to-foundation connection type, duct type, strand coating type, and loading.
Amount of prestress The two levels were nonpre-stressed and prestressed. Five columns were pre-stressed, and five had typical reinforcing.
The prestressed columns used a minimum effective prestress f
pe of 60% of the ultimate tensile strength
of the prestressing tendons fpu
(fpe
= 0.6fpu
). The calculated decompression moment was 34 kip-ft (46 kN-m), which exceeded the applied service moment of 19 kip-ft (25 kN-m) by a considerable margin.
Long-term prestress losses were calculated for periods of 500, 1000, and 1500 days. Losses were not uniform in the loaded case due to the eccentric loading. The calculated losses indicated that with an initial prestress of 0.68f
pu, the effective prestress
in the columns met or exceeded the design value for an experiment duration longer than 1500 days. The average initial prestress in the gross column
Column corrosion test series
Ten column specimens were used to investigate corrosion mecha-nisms and chloride ion transport (wicking effect) in various column-connection configurations and to evaluate column-corro-sion-protection measures. Figure 8 shows the column-specimen details and test setup.
Test specimens, circular cast-in-place columns, were patterned after those used in standard TxDOT multicolumn substructures. A reduced nominal column diameter of 18 in. (460 mm) and a reduced height of 6 ft (1.8 m) were selected for the actual test specimens. These dimensions, in addition to the internal details (reinforcement size, 2 in. [50 mm] concrete cover, and post-tensioning hardware, [duct, post-tensioning bars, and anchorages]) were selected to provide specimens similar to columns in typical substructures. Consideration was made for the construction and loading of the specimens.
The design of the post-tensioned columns kept the same mild-steel reinforcement as the reinforced-column design—due to the need for confinement and concerns for creep—and added four threaded prestressing bars. These prestressing bars provided continuity between the column and foundation, effectively developing the flexural capacity about more than one axis and increasing the de-compression moment, which could improve durability at construc-tion joints.
Figure 8. Shown are the test setup and column-specimen details for the column corrosion test series. Note: 1 in. = 25.4 mm; no. 6 = 19M.
Columnreinforcement
at joint
6 dowels:no. 6 bars
bearing plateand nut
4 post-tensionbars 5/8 in. diameter
2 in.cover rubber
gasket coupler
Doweled Joint Post-Tensioned Joint No Dowel
Table 6. Column corrosion test series specimen notationColumn-to-foundation connection Concrete type Loading condition Post-tensioning protection
NJ = no dowel TC = TxDOT Class C N = no loadPD = plastic duct with noncoated PT B\bars
DJ = doweled joint FA = Class C with 35% fly ash S = service loadEB = metal duct with epoxy-coated PT bars
PT = post-tensioned joint — —GB = metal duct with galvanized PT bars
— — — Blank = not applicable (no PT)
Example: PT-TC-S-PD
Note: PT = post-tensioned; TxDOT = Texas Department of Transportation.

99PCI Journal | January–February 2008
samples. Chloride samples were taken directly from the concrete-column specimens at three depths (1⁄2 in., 1 in., and 2 in. [13 mm, 25 mm, and 50 mm]) from three locations (3 in., 9 in., and 15 in. [75 mm, 225 mm, and 380 mm] from the base of the specimens), and on both the spray and the non-spray side. The acid-soluble-chloride content was measured from these powder samples col-lected after 20 months, 32 months, and 78 months (end of testing). Figure 9 shows an example of chloride-content graphs. Chloride threshold value is indicated in the figure at 0.033%. This value, intended as a guide only, is based on the widely accepted chloride threshold value of 0.2% of the weight of cement.14
The post-tensioned column section was analyzed using the layer-by-layer strain-compatibility-analysis technique. The lower nomi-
section was about 500 psi (3500 kPa).
Concrete The two types were TxDOT Class C concrete and TxDOT Class C concrete with 35% cement replacement by volume with fly ash. The minimum compressive strength f '
c was 3600 psi (25
MPa) for both types of concrete.
Column-to-foundation connection The three types were no dowel joint, doweled joint, and post-tensioned joint.
Duct type The two types were plastic and galvanized steel.
Strand coating The three coating types were uncoated, epoxy, and galvanized.
Loading The two conditions were unloaded and service load (with combined moment and axial load). The axial load N
service of 75 kip (330 kN) and
combined moment Mservice
of 19 kip-ft (25 kN-mm) were used to apply the service load. These values were obtained from the prototype substructure analysis for the service-load condition. The unloaded case was included to represent a worst-case condition for allowing moisture and chloride penetration at the construction joint.
Loading was applied as external prestressing on the columns. A stiffened loading plate on top of the columns was connected to four 1-in.-diameter (25 mm) threaded prestressing bars. The forces in the bars were adjusted to apply the desired moment and axial force. Calculations for estimated losses in column loads were estimated for various lengths of time. Losses were small for a time period of 500 days from first loading: 3.6% for reinforced, non-prestressed columns and 6.6% for post-tensioned columns. For this reason the loading system was simplified and no springs were used. Readjust-ments were periodically made to the column loads in order to maintain loading level.
Exposure testing
Exposure testing consisted of a 3.5% sodium chloride solution continuously ponded around the base of the columns to simulate a coastal exposure. Trickle water with sodium chloride was used on one face of each column to simulate the effect of saltwater spray or dripping. Exposure testing was performed for six and a half years, at which time full internal examinations were conducted.
Exposure testing included HC potential measure-ments, periodic visual inspection, and chloride
Figure 9. Shown is concrete chloride penetration at 2 in. for all columns in dripper side at end of testing for the column corrosion test series. Chloride threshold value is indicated in the figure at 0.033%. This value, intended as a guide only, is based on the widely accepted chloride threshold value of 0.2% of the weight of cement (Source: Corrosion of Metals in Concrete).
Note: Table 6 defines specimen notations. 1 in. = 25.4 mm.
0
4
8
12
16
0.00% 0.10% 0.20% 0.30% 0.40% 0.50% 0.60%
NJ-TC-N
DJ-TC-N
DJ-FA-S
DJ-TC-S
NJ-TC-S
PT-TC-N-PD
PT-TC-S-PD
PT-FA-S-PD
PT-TC-S-EB
PT-TC-S-GB
water line
Foundation
Column
15 in.
9 in.
3 in.
Threshold Hei
gh
t A
bo
ve C
olu
mn
Bas
e, in
.
Acid soluble chloride content at 2 in. depth,% by weight of concrete
Figure 10. Shown is the column concrete removal and dismantling of reinforcement for the column corrosion test series.

January–February 2008 | PCI Journal100
corrosion tests was also used in the column series with minor changes due to the specific specimen characteristics. The reinforcing bars, post-tension-ing bars, and post-tensioning ducts in the column were subdivided into thirty-four 2-in.-long (50 mm) segments. In addition, the post-tensioning bars within the foundation were subdivided into seven 2-in.-long segments. Dowels were subdivid-ed into twenty-six 2-in.-long segments and spirals were subdivided into eleven 2-in.-long segments for every spiral step in the column, keeping the segments on the dripper side separate from those on the non-dripper side. Each segment of steel was
nal capacity of the post-tensioned columns illustrated the effect of post-tensioning on the axial-load carrying of these elements. However, even with this reduction, the factored resistance of the post-tensioned columns far exceeded the factored loads.
Examination
Internal examinations were performed on the column specimens after six and a half years of continuous accelerated exposure. Figure 10 shows the column concrete removal and dismantling of reinforcement.
The corrosion-rating system used in the macrocell and beam-
Specimen
Spiral
Mild-steel reinforcement
Dowel
Duct (1 and 2)
Duct (3 and 4)
Post-tensioned bar
PT-TC-S-EB 1 2 n.a. 1732 2582 52
PT-TC-S-GB 2 0 n.a. 2166 2657 60
PT-FA-S-PD 2 2 n.a. n.a.* 8 95
PT-TC-S-PD 2 2 n.a. n.a.* 1446 146
PT-TC-N-PD 8 2 n.a. n.a.* 232 673
NJ-TC-N 100 2 n.a. n.a. n.a. n.a.
NJ-TC-S 3470 8 n.a. n.a. n.a. n.a.
DJ-TC-N 62 2 2276 n.a. n.a. n.a.
DJ-FA-S 8 1 591 n.a. n.a. n.a.
DJ-TC-S 8 2 8 n.a. n.a. n.a.
Specimen title key
NJ = no dowel DJ = doweled joint PT = post-tensioned
TC = Class C concrete FA = fly ash concrete
N = unloaded S = service load
EB = metal duct with epoxy-coated PT bars GB = metal duct with galvanized PT bars
PD = plastic duct with no coating on PT bars
*Not applicable because ducts were made of plastic. Note: Maximum corrosion rating is the highest rating for any 2 in. segment within an element. n.a. = not applicable.
Table 7. Maximum corrosion-ratings results for column corrosion test series
Specimen
Spiral
Mild-steel reinforcing bar
Dowel
Duct (1 and 2)
Duct (3 and 4)
Post-tensioned bar
PT-TC-S-EB 291 6 n.a. 1756 3030 52
PT-TC-S-GB 331 0 n.a. 3984 5329 680
PT-FA-S-PD 337 12 n.a. n.a.* 24 95
PT-TC-S-PD 339 3 n.a. n.a.* 1773 146
PT-TC-N-PD 351 9 n.a. n.a.* 280 673
NJ-TC-N 532 2 n.a. n.a. n.a. n.a.
NJ-TC-S 10,266 32 n.a. n.a. n.a. n.a.
DJ-TC-N 595 35 2704 n.a. n.a. n.a.
DJ-FA-S 360 19 619 n.a. n.a. n.a.
DJ-TC-S 458 26 86 n.a. n.a. n.a.
Specimen title key
NJ = no dowel DJ = doweled joint PT = post-tensioned
TC = Class C concrete FA = fly ash concrete
N = unloaded S = service load
EB = metal duct with epoxy-coated PT bars GB = metal duct with galvanized PT bars
PD = plastic duct with no coating on PT bars
*Not applicable because ducts were made of plastic. Note: Total corrosion rating is the sum of all the 2 in. segment corrosion ratings within each element. n.a. = not applicable.
Table 8. Total corrosion-ratings results for column corrosion test series

101PCI Journal | January–February 2008
assigned a rating to describe the corrosion severity within that segment. The ratings for all segments were summed to give a total corrosion rating for each element, which could be compared with the same type of element from different specimens. This method ensured that both the extent and severity of the corrosion were evaluated.
Corrosion ratings for the mild-steel reinforcement (spirals, longitudinal steel, and dowels) were as-signed to indicate corrosion severity for each seg-ment (considering top and bottom surfaces in the same corrosion rating). This procedure differs from that used in the beam and macrocell series, where the horizontal reinforcing bar top and bottom sur-faces were rated separately. It was found, however, that one corrosion rating was enough to adequately determine the extent and severity of corrosion in these vertical bars.
The corrosion ratings were taken as described previ-ously to compare the maximum corrosion rating in any 2-in.-long (50 mm) segment and to compare the total corrosion rating in the complete element, obtained after adding the corrosion ratings for all segments in one element type (spirals, reinforcing bars, dowels, ducts, and PT bars).
Results
Tables 7 and 8 show the corrosion-rating results, and Fig. 11 illustrates the post-tensioning bar cor-rosion ratings.
Discussion and conclusions
Based on the results from the macrocell, beam, and column cor-rosion test series, the following major overall conclusions were drawn.
Exposure testing/monitoring
Of the exposure testing/monitoring methods used—HC potential readings, chloride-content determinations, and corrosion-current readings—only the first two showed some degree of correla-tion with internal examination results. These correlations are not discussed in this paper because of space limitation. A detailed discussion is included in the three Salas et al. papers.6,7,8
Figure 11. This graph shows post-tensioned bar corrosion ratings at six and a half years of exposure testing, ordered according to performance for the column corrosion test series. Note: Table 6 defines specimen notations.
673
146
95
60
52
0 100 200 300 400 500 600 700 800
PT-TC-N-PD
PT-TC-S-PD
PT-FA-S-PD
PT-TC-S-GB
PT-TC-S-EB
Total corrosion rating
PT-Bardecreasing
performance
Column Variable
Post-tensioned, Class C Concrete
S.Load, Epoxy Coated PT Bars
Post-tensioned, Class C Concrete
S.Load, Galvanized PT Bars
Post-tensioned, Fly Ash ConcreteS.Load, Plastic Duct
Post-tensioned, Class C Concrete
S.Load, Plastic Duct
Post-tensioned, Class C Concrete
Unloaded, Plastic Duct
PT-TC-S-EB
PT-TC-S-GB
PT-TC-N-PD
PT-TC-S-PD
PT-FA-S-PD
Co
lum
n s
pec
imen
Figure 12. Pictured is corrosion in galvanized-steel duct in beams with different levels of post-tensioning from the beam corrosion test series. Note: 1 in. = 25.4 mm.

January–February 2008 | PCI Journal102
Concrete type
Both high-performance concrete and the fly ash concrete beams showed better corrosion protection than the standard TxDOT concrete by minimiz-ing the chloride penetration through the concrete. The high-performance concrete appeared to show slightly better corrosion protection than the fly ash concrete, but the difference was not significant.
Joint type
Sound epoxy-joint filling is essential to prevent
Prestressing level
The prestressing level had an inverse relationship with the corro-sion activity. As the amount of prestressing increased, the sever-ity and extent of corrosion decreased. In the beam corrosion test series, the 2⁄3PS beams showed substantially more localized and generalized corrosion than fully prestressed members (Fig. 12). Prestressed concrete was a definite factor in reducing corrosion risk. Lower permeability due to increased prestressing also pro-vided better resistance to wicking effects, as shown in the column specimens.
Figure 13. Pictured is segmental or construction joint performance from the macrocell and column corrosion test series. Note: 1 in. = 25.4 mm.
MacrocellDry JointLocation
Macrocell SoundEpoxy Joint
Location
ColumnConstruction
Joint Location
MacrocellDry JointLocation
Macrocell SoundEpoxy Joint
Location
ColumnConstruction
Joint Location
MacrocellDry JointLocation
Macrocell SoundEpoxy Joint
Location
ColumnConstruction
Joint Location
Figure 14. Shown is duct-splice performance from the beam corrosion test series. Note: 1 in. = 25.4 mm.
Industry Standard Splice
duct tape heat shrink tubing
Heat Shrink Splice
103PCI Journal | January–February 2008
moisture and chloride ingress. Dry joints, which behaved like preset cracks, performed poorly in the macrocell specimens (Fig. 13). Similar results were observed in the column tests at the column bases for the nondoweled specimens.
The use of gaskets in the joints was detrimental to the performance of the specimens. The gaskets prevented complete epoxy coverage of the joints and allowed moisture and chloride ingress. They also trapped mois-ture at the duct ends and produced crevice corrosion in the galvanized-steel ducts. The incompletely filled-ep-oxy-joint performance was similar to that of a dry joint. Test results showed that poor epoxy filling at the joint was detrimental to the performance of the duct, the prestressing strand, and the mild-steel reinforcement.
Duct type
The use of galvanized-steel ducts appears unwise. Se-vere duct destruction and pitting were found in most specimens with this type of duct. The superiority of plastic ducts was evident from macrocell and column corrosion test results. The strands and post-tensioning bars within plastic ducts showed no signs of corrosion. The use of encapsulated anchorage protection systems appears promising but cannot be conclusively evalu-ated until final internal examinations of the remain-ing beam specimens are conducted. In view of the substantial corrosion found with galvanized ducts, it
would be prudent to use plastic duct in any application that has even a moderate risk of exposure to chlorides.
Duct-splice type
Both the industry-standard duct-taped splice and the heat-shrink splice used for the galvanized-steel ducts in the beam test series were unsatisfactory. Neither prevented moisture nor chloride ingress to the grout that was intended to provide corrosion protection to the strand (Fig. 14). Duct and strand corrosion were less severe away from the duct splice. Development of a more effective duct-splicing technique should be a high priority. There were no plastic duct splices to evalu-ate in the beam series because they were continuous along the beams.
Unspliced plastic ducts, such as those used in the macrocell and column series, demonstrated better protection of the strands compared with unspliced galvanized-steel ducts. The use of completely filled epoxy joints with unspliced plastic ducts showed good protection. However, in field applications and highly aggressive environments, it might be prudent to consider positive coupling of internal ducts at segmental joints if epoxy-joint filling cannot be thoroughly distrib-uted around the duct openings.
Strand coating
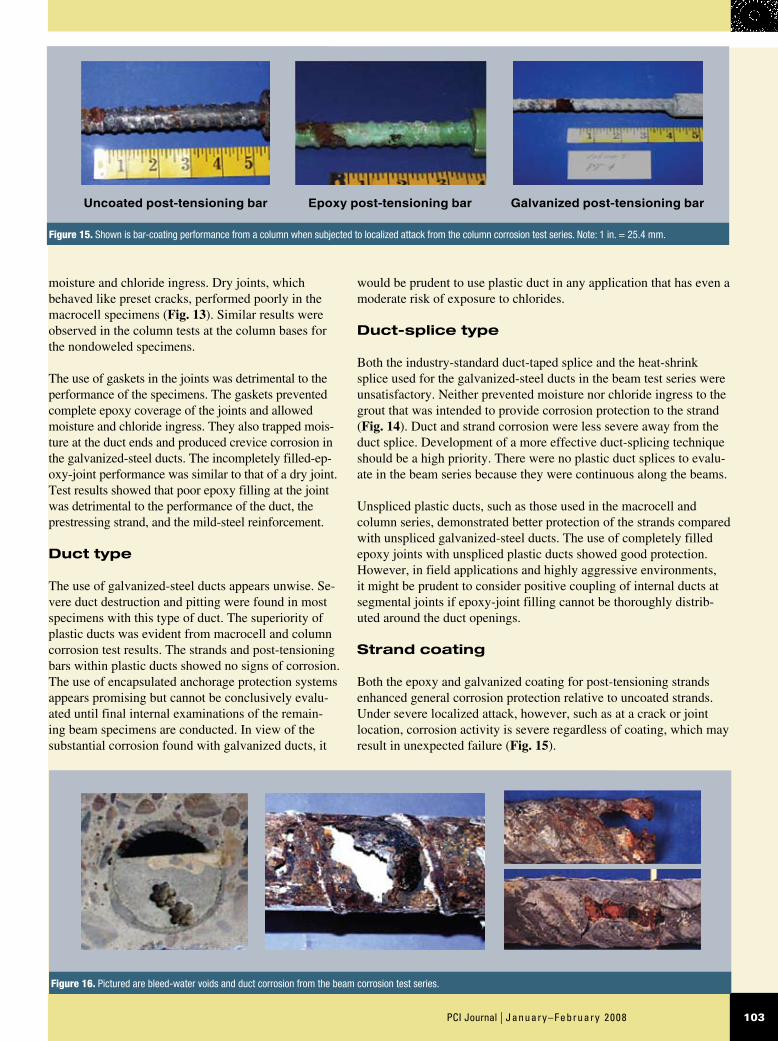
Both the epoxy and galvanized coating for post-tensioning strands enhanced general corrosion protection relative to uncoated strands. Under severe localized attack, however, such as at a crack or joint location, corrosion activity is severe regardless of coating, which may result in unexpected failure (Fig. 15).
Figure 16. Pictured are bleed-water voids and duct corrosion from the beam corrosion test series.
Figure 15. Shown is bar-coating performance from a column when subjected to localized attack from the column corrosion test series. Note: 1 in. = 25.4 mm.
Uncoated post-tensioning bar Epoxy post-tensioning bar Galvanized post-tensioning bar

January–February 2008 | PCI Journal104
moisture would have reached the strand. Stringent grouting procedures must be enforced, such as those recommended in Schokker et al.4
Cracking effects
Transverse cracking due to loading had a direct relationship with corrosion damage. As cracking in-creased, reinforcement corrosion increased. Larger crack width and crack density were found to be the cause of severe localized and uniform reinforce-ment-corrosion activity. Longitudinal or splitting cracks always indicated severe corrosion within a member (Fig. 18).
Concrete-cover thickness
Beam specimens used a concrete cover of 2 in. (50 mm). This practice was detrimental to corrosion resistance. In the macrocell corrosion test series, moisture and chloride ingress were permitted at the match-cast segmental joints. The smaller cover of 3⁄4 in. (19 mm) typical at the joint faces increased the corrosion activity in the steel. Similar results were observed at the base of the column specimens when analyzing spiral performance.
Implementation recommendations
Design guidelines for durable, bonded, post-ten-sioned tendons were developed from this research program and are discussed in the following section. Recommendations are based on specimens that were purposely placed in an aggressive environ-ment. By applying saltwater in wet and dry cycles, a condition simulating a harsh and extended service application was introduced. This testing procedure cannot be directly related to a specific real-life exposure age.
Measures for implementation from macrocell corrosion tests
Macrocell test results generated the following findings for immediate implementation to improve corrosion protection for precast concrete segmental construction:
Plastic ducts for post-tensioning should be used •in all situations where even moderately aggres-sive conditions may occur.
Epoxy-filled joints without gaskets should •always be used with internal prestressing strands.
Grout type
The standard TxDOT Class C grout performed poorly in all specimens that were evaluated. Better results were obtained from grout with fly ash or corrosion inhibitor added, but grout voids were not eliminated in any of the grout mixtures. Grout voids due to entrapped air, bleed water, incomplete grout filling, or a lack of grout fluidity were detrimental not only to the prestress-ing strand but also to the galvanized-steel duct. In addition, bleed water was found to be detrimental to the galvanized ducts when using heat-shrink or industry-standard splices, as shown in Fig. 16. Antibleed and better thixotropic grouts, such as those reported by Schokker,4 should be considered.
Because it is injected after post-tensioning of the element, the grout is not prestressed and is susceptible to cracking due to applied loads, deflections from loading, and vibrations. Cracks in the grout may serve as direct paths for moisture and chlo-ride ingress to the strands. Figure 17 shows the effect of grout cracking. Moisture and corrosion stains from the galvanized duct were present in many grout transverse slices. At the time of the internal examination, it appeared that with a little more time,
Figure 18. This strand from the macrocell corrosion test series was removed from the beam in Fig. 3, which experienced longitudinal cracking thereby facilitating severe corrosion of the strand.
DJ-S-L-NG-2Strand-Segment A Top Surface
Figure 17. Pictured is the effect of grout cracking from the beam corrosion test series. Note: 1 in. = 25.4 mm.

105PCI Journal | January–February 2008
Systems other than industry-standard or heat-shrink splices for •galvanized-steel ducts should be investigated and developed if galvanized ducts continue to be used in non-aggressive environ-ments.
Standard Class C grout with fly ash is not recommended be-•cause grout voids were not eliminated with the use of this type of grout. Grout with better thixotropic characteristics, such as those reported by Schokker,4 should be considered.
Stringent grouting procedures, following Schokker’s recom-•mendations,4 should be enforced during construction.
Measures for implementation from column-corrosion tests
Based on the results of full internal examination of all 10 column specimens, the following findings are recommended for immedi-ate implementation for partially submerged columns or columns exposed to saltwater spray or dripping:
Plastic ducts should be used to better protect post-tensioning •strand.
Better sealing materials or splices should be developed and used to •seal the duct at joints or ends.
Column elements should be prestressed to improve mild-•steel reinforcement and spiral-corrosion protection. Design-ers should not, however, rely entirely on post-tensioning to provide adequate corrosion protection at the cold joint. Other protection measures should be investigated.
TxDOT Class C concrete with fly ash (35% replacement by •volume) and a w/cm of 0.42 may be used to provide enhanced spiral, mild-steel reinforcement, duct, and strand-corrosion protection.
Rubber gaskets, such as those discussed in the macrocell •series, should not be used for sealing the joints in ducts.
The used of coated strand (galvanized or epoxy) is recom-•mended. Coatings enhance protection against uniform corro-sion but not severe localized corrosion.
Acknowledgments
The authors gratefully acknowledge the financial support provided by TxDOT, and are especially appreciative of the assistance pro-vided by TxDOT engineer Brian Merrill. Any opinions expressed in this paper are those of the authors and do not necessarily reflect those of the sponsor.
Dry joints should be avoided with internal pre-•stressing strands in even moderately aggres-sive conditions to protect mild-steel reinforce-ment at joints and to block entry of chlorides that might be transported to locations of flaws in external tendon sheaths or anchors.
Stringent inspection and construction practices •must be exercised to guarantee proper epoxy filling at the joints and complete grouting.
The use of gaskets should be avoided in •epoxy-filled joints. Preferred practice with epoxy-filled joints is to use a thorough swab-bing of strand ducts immediately after initial segment placement and stressing to seal the duct edges at the joint. Tightness of the joint should be checked by air-pressure testing. Carefully coupled ducts are an alternative as long as a positive seal is obtained.
Measures for implementation from beam-corrosion tests
Based on the results of final internal examinations of selected beam specimens, the following findings are recommended for immediate implementation:
Mixed-reinforcement members should not be •used in coastal areas or in areas where deic-ing salts are used unless special provisions are made to effectively seal cracks and concrete cover from exposure to chlorides.
Fully prestressed members are recommended •in aggressive environments to delay moisture and chloride ingress.
The use of plastic ducts is recommended. Post-•tensioning systems need protection beyond the current typical practice of galvanized-steel duct in aggressive environments.
High-performance concrete with a • w/c of about 0.29, as used in this research project, is recommended in aggressive environments due to the significantly reduced permeability and increased crack control.
TxDOT Class C concrete with fly ash and a •w/cm below 0.45 may also be considered when the environment is less aggressive.
Neither the industry-standard practice of using •duct-taped sleeves nor heat-shrink splices for duct splicing should be considered watertight.

January–February 2008 | PCI Journal106
12. AASHTO. 1998. AASHTO LRFD Bridge De-sign Specifications. 2nd ed. Washington, DC: AASHTO.
13. ASTM. 1991. Standard Test Method for Half-cell Potentials of Uncoated Reinforcing Steel in Concrete. ASTM C876-91. Philadelphia, PA: ASTM.
14. American Concrete Institute (ACI) Committee 222. 1996. Corrosion of Metals in Concrete. ACI 222 R-96. Detroit, MI: ACI.
Notation
f 'c = compressive strength of concrete
fpe
= effective prestress of prestressing tendons
fpu
= ultimate tensile strength of the prestressing tendons
Mservice
= combined service moment
Nservice
= axial service load
w/c = water-cement ratio
w/cm = water–cementitious materials ratio
References
1. The Concrete Society. 2002. Durable Post-tensioned Con-crete Bridges. Technical report 47. 2nd ed., 2000.
2. Federation Internationale du Beton (fib). 2001. Durability of Post-Tensioning Tendons. Bulletin no. 15. Ghent, Belgium, November.
3. fib-IABSE. 2004. Durability of Post-Tensioning Tendons. Proceedings, Swiss Federal Institute of Technology, ETH Zurich, Switzerland.
4. Schokker, A. J., B. D. Koester, J. E. Breen, and M. E. Kreger. 1999. Development of High-Performance Grouts for Bonded Post-Tensioned Structures. Research Report 1405-2. Center for Transportation Research, Bureau of Engineering Re-search, The University of Texas at Austin.
5. West, J. S., R. P. Vignos, J. E. Breen, and M. E. Kreger. 1999. Corrosion Protection for Bonded Internal Tendons in Precast Segmental Construction. Research Report 1405-4. Center for Transportation Research, Bureau of Engineering Research, The University of Texas at Austin.
6. Salas, R. M., A. L. Kotys, J. S. West, J. E. Breen, and M. E. Kreger. 2002. Final Evaluation of Corrosion Protection for Bonded Internal Tendons in Precast Segmental Construction. Research Report 1405-6. Center for Transportation Research, The University of Texas at Austin.
7. Salas, R. M., A. L. Kotys, J. S. West, A. J. Schokker, J. E. Breen, and M. E. Kreger. 2003. Long-Term Post-Tensioned Beam Test Specimens: Final Evaluation. Research Report 1405-7. Center for Transportation Research, Bureau of Engi-neering Research, The University of Texas at Austin.
8. Salas, R. M., J. S. West, A. J. Schokker, J. E. Breen, and M. E. Kreger. 2003. Long-Term Post-Tensioned Column Exposure Test Specimens: Final Evaluation. Research Report 1405-8. Center for Transportation Research, Bureau of Engi-neering Research, The University of Texas at Austin.
9. Vignos, R. P. 1994. Test Method for Evaluating the Corrosion Protection of Internal Tendons Across Segmental Bridge Joints. Master of Science thesis, The University of Texas at Austin.
10. American Society for Testing and Materials (ASTM). 1992. Standard Test Method for Determining the Effects of Chemi-cal Admixtures on the Corrosion of Embedded Steel Rein-forcement in Concrete Exposed to Chloride Environments. ASTM G109-92. West Conshohocken, PA: ASTM.
11. American Association of State Highway and Transportation Officials (AASHTO). 1989. Guide Specifications for Design and Construction of Segmental Concrete Bridges. Washing-ton, DC: AASHTO.

107PCI Journal | January–February 2008
About the authors
Rubén M. Salas, Ph.D., is a cathe-dratic professor for the Escuela de Ingeniería Civil, Facultad de Ingeniería, at Universidad de Costa Rica in San José, Costa Rica, and president of GCI Ingeniería, Oficentro Ejecutivo La Sabana, Sabana Sur, San José, Costa Rica.
Andrea J. Schokker, Ph.D., is a Henderson Professor for the Depart-ment of Civil and Environmental Engineering at Pennsylvania State University in University Park, Pa.
Jeff S. West, Ph.D., is an assistant professor for the Department of Civil Engineering at the University of Waterloo in Waterloo, ON, Canada.
John E. Breen, Ph.D., is the Nasser I. Al-Rashid Chair in Civil Engi-neering for the College of Engi-neering at the University of Texas at Austin in Austin, Tex.
Michael E. Kreger, Ph.D., is the Bowen Laboratory director and professor for the School of Civil Engineering at Purdue University in West Lafayette, Ind.
Synopsis
The effectiveness of cement grout, the most widely used corrosion-protection system for multistrand, bonded, post-tensioned tendons, has been under debate due to significant tendon-corrosion damage, several reported failures of indi-vidual tendons, and a few collapses of non-typical structures.
Sixteen years ago, a comprehensive research program to examine the use of post-tensioning in bridge structures was initiated at the Phil M. Ferguson Structural Engineering Laboratory at the University of Texas at Austin to identify durability concerns and existing technology, develop and carry out an experimental testing program, and develop durability-design guidelines. Four experimental programs were developed: high-performance-grout studies, long-term macrocell corrosion test series, long-term beam corrosion test series, and long-term column corrosion test series.
After performing comprehensive internal examinations, overall findings indicate unfavorable durability effects due to the use of mixed reinforcement (a combination of active and passive reinforcement), thin concrete cover, galva-nized-steel ducts, grout voids, and both industry-standard (duct tape) and heat-shrink-galvanized duct splices. The width of cracks was shown to have a direct adverse effect on specimen performance, and local areas of severe cor-rosion were found on epoxy-coated and galvanized bars. Favorable behavior was observed, however, for specimens constructed with high-performance concrete, high post-ten-sioning levels, plastic ducts, and sound, epoxy-filled joints.
Keywords
Corrosion, cracks, ducts, durability, grout, internal bonded tendons, post-tensioning, segmental construc-tion, structural concrete.
Review policy
This paper was reviewed in accordance with the Precast/Prestressed Concrete Institute’s peer-review process.
Reader comments
Please address any reader comments to PCI Journal editor-in-chief Emily Lorenz at [email protected] or Pre-cast/Prestressed Concrete Institute, c/o PCI Journal, 209 W. Jackson Blvd., Suite 500, Chicago, IL 60606. J

January–February 2008 | PCI Journal108


![61126277 Durable Bonded Post Tensioned Concrete Bridges TR47[1]](https://img.dokumen.tips/doc/110x75/544ad707af7959a8438b4d9b/61126277-durable-bonded-post-tensioned-concrete-bridges-tr471.jpg)