Embed Size (px)
Citation preview
Technical Report Documentation Page
1. Report No. 2. Government Accession No. 3. Recipient's Catalog No.
4. Title and Subtitle 5. Report Date
CORROSION PROTECTION FOR BONDED INTERNAL TENDONS October 1999 ·- -IN PRECAST SEGMENTAL CONSTRUCTION 6. Performing Organization Code
7. Author(s) 8. Performing Organization Report No.
J. S. West, R. P. Vignos, J. E. Breen, and M. E. Kreger Research Report 1405-4
9. Performing Organization Name and Address 10. Work Unit No. (TRAIS) Center for Transportation Research 11. Contract or Grant No. The University of Texas at Austin Research Study 0-1405 3208 Red River, Suite 200 Austin, TX 78705-2650
12. Sponsoring Agency Name and Address 13. Type of Report and Period Covered
Texas Department of Transportation Research Report (9/93-8/99) Research and Technology Transfer Section, Construction Division P.O. Box 5080 Austin, TX 78763-5080 14. Sponsoring Agency Code
15. Supplementary Notes
Project conducted in cooperation with the U.S. Department of Transportation
16. Abstract
This report documents a series of accelerated corrosion tests on small-sized specimens typical of bonded internal post-tensioning tendons in segmentally constructed box girder concrete bridges. Thirty-eight macrocell specimens were subjected to a highly aggressive exposure and observed for four and one-half years. At that time, nineteen of the specimens were opened for detailed examination and all corrosion behavior recorded. The variables included were joint type (dry or epoxy), duct type (galvanized steel or plastic), grout type (3 grouts with differing additives) and level of joint compression (3 different levels). Half-cell potentials and macrocell corrosion currents were measured throughout exposure. While some substantial corrosion was found in dry joint specimens, the corrosion resistance of epoxy joint specimens was excellent.
17. KeyWords 18. Distribution Statement
corrosion, dry joints, epoxy joints, grout, post- No restrictions. This document is available to the public through tensioned tendon concrete, post-tensioned the National Technical Information Service, Springfield, Virginia ducts, segmental bridge construction 22161.
19. Security Classif. (of report) 20. Security Classif. (of this page) 21. No. of pages 22. Price
Unclassified Unclassified 94
Form DOT F 1700.7 (8-72) Reproduction of completed page authorized

CORROSION PROTECTION FOR BONDED INTERNAL TENDONS IN PRECAST SEGMENTAL CONSTRUCTION
by
J. S. West, R. P. Vignos, J. E. Breen, and M. E. Kreger
Research Report 1405-4
Research Project 0-1405
DURABILITY DESIGN OF POST-TENSIONED
BRIDGE SUBSTRUCTURE ELEMENTS
Conducted for the
Texas Department of Transportation
In cooperation with the
U.S. Department of Transportation
Federal Highway Administration
by the
CENTER FOR TRANSPORTATION RESEARCH
BUREAU OF ENGINEERING RESEARCH
THE UNIVERSITY OF TEXAS AT AUSTIN
October 1999

Research performed in cooperation with the Texas Department of Transportation and the U.S. Department of Transportation, Federal Highway Administration.
ACKNOWLEDGEMENTS
We greatly appreciate the financial support from the Texas Department of Transportation that made this project possible. The support of the project director, Bryan Hodges (DES), and program coordinator, Richard Wilkison (DES), is also very much appreciated. We thank Project Monitoring Committee members, Gerald Lankes (CST), Ronnie VanPelt (BMT), and Tamer Ahmed (FHWA). We would also like to thank FHW A personnel, Jim Craig, Susan Lane, and Bob Stanford, for their assistance on this project.
DISCLAIMER The contents of this report reflect the views of the authors, who are responsible for the facts and the accuracy of the data presented herein. The contents do not necessarily reflect the view of the Federal Highway Administration or the Texas Department of Transportation. This report does not constitute a standard, specification, or regulation.
NOT INTENDED FOR CONSTRUCTION,
PERMIT, OR BIDDING PURPOSES
J. E. Breen, P.E., TX #18479
M. E. Kreger, P.E., TX #65541
Research Supervisors
iv
TABLE OF CONTENTS
CHAPTER 1: INTRODUCTION ..................................................................................................................... 1
1.1 BACKGROUND AND OBJECTIVES ............................................................................................................ 1
1.2 REsEAROI PROJECT 0-1405 .................................................................................................................... 2
1.3 REsEARQI OBJECTIVES AND PROJECT SCOPE ........................................................................................ 3
1.3.1 Project Objectives ....................................................................................................................... 3
1.3.2 Project Scope ............................................................................................................................... 3
1.4 PROJECT REPoR11NG ............................................................................................................................... 4
CHAPTER 2: EXPERIMENTAL PROGRAM ................................................................................................ 7
2.1 TEsT SPECIMEN ....................................................................................................................................... 7
2.2 VARIABLES .............................................................................................................................................. 9
2.2.1 Joint Type .................................................................................................................................... 9
2.2.2 Duct Type ................................................................................................................................. 10
2.2.3 Joint Precompression ................................................................................................................ 10
2.2.4 Grout Type ................................................................................................................................ 10
2.2.5 Specimen Types ......................................................................................................................... 10
2.3 MATERIAlS ............................................................................................................................................ 11
2.4 MEAsuRE:M::ENTs DURI:N'G EXPOSURE TEs11NG .................................................................................... 12
2.4.1 Macrocell Corrosion Current Measurements ........................................................................... 12
2.4.2 Half-Cell Potential Readings .................................................................................................... 13
CHAPTER 3: EXPOSURE TEST RESULTS ................................................................................................. 15
3.1 MACROCELLCORROSIONCURRENTREsuL1S ..................................................................................... 15
3.2 HALF-CELL POTENI1AL READINGS ...................................................................................................... 17
3.3 ANALYSIS AND DISCUSSION OF EXPOSURE TEsT REsuLTS .................................................................. 20
3.3.1 Time to Initiation of Corrosion ................................................................................................. 20
3.3.1.1 Discussion: Time to Corrosion .............................................................................................. 20
3.3.2 Corrosion Rate or Severity ........................................................................................................ 22
3.3.2.1 Weighted Average Corrosion Current ................................................................................. 22
3.3.2.2 Corrosion Current Density .................................................................................................... 23
3.3.2.3 Metal Loss ................................................................................................................................ 23
3.3.2.4 Discussion: Corrosion Rate Calculations ............................................................................ 24
CHAPTER 4: FORENSIC EXAMINATION ................................................................................................ 29
4.1 PROCEDURE ........................................................................................................................................... 30
v
4.1.1 Specimen Condition at End of Testing ..................................................................................... 30
4.1.2 Concrete Powder Samples for Chloride Analysis ...................................................................... 30
4.1.2.1 Location A ................................................................................................................................ 31
4.1.2.2 Location B ................................................................................................................................ 31
4.1.2.3 Location c ................................................................................................................................ 31
4.1.3 Longitudinal Saw Cuts ............................................................................................................. 31
4.1.4 Expose and Remove Duct and Strand ....................................................................................... 32
4.1.5 Grout Samples for Chloride Analysis ....................................................................................... 32
4.1.6 Expose and Remove Mild Steel ................................................................................................. 32
4.1.7 Examine joint Condition ........................................................................................................... 33
4.2 AUTOPSY PROGRAM .............................................................................................................................. 33
4.3 EVALUATION AND RATING OF CORROSION FOUND DURING FORENSIC EXAMINATION ................... 34
4.3.1 Prestressing Strand ................................................................................................................... 34
4.3.2 Mild Steel Reinforcement .......................................................................................................... 36
4.3.3 Galvanized Steel Duct ............................................................................................................... 37
4.4 FORENSIC EXAMINATION REsuLTS ...................................................................................................... 38
4.4.1 Specimen DJ-S-L-NG-1 ............................................................................................................ 39
4.4.2 Specimen DJ-S-M-NG-1 ........................................................................................................... 41
4.4.3 Specimen DJ-S-H-NG-1 ........................................................................................................... 42
4.4.4 Specimen DJ-P-L-NG-1 ............................................................................................................ 42
4.4.5 Specimen DJ-P-M-NG-1 .......................................................................................................... 43
4.4.6 Specimen DJ-S-L-CI-1 .............................................................................................................. 43
4.4.7 Specimen DJ-S-M-CI-1 ............................................................................................................. 44
4.4.8 Specimen SE-S-L-NG-2 ............................................................................................................ 44
4.4.9 Specimen SE-S-M-NG-2 .......................................................................................................... 45
4.4.10 Specimen SE-S-H-NG-2 ........................................................................................................... 45
4.4.11 Specimen SE-P-L-NG-2 ............................................................................................................ 46
4.4.12 Specimen SE-P-M-NG-2 .......................................................................................................... 47
4.4.13 Specimen SE-S-L-CI-2 .............................................................................................................. 47
4.4.14 Specimen SE-S-M-CI-2 ............................................................................................................ 48
4.4.15 Specimen SE-S-H-CI-2 ............................................................................................................. 48
4.4.16 Specimen SE-S-L-SF-2 .............................................................................................................. 48
4.4.17 Specimen EG-S-L-NG-2 ........................................................................................................... 49
4.4.18 Specimen EG-S-M-NG-2 .......................................................................................................... 49
4.4.19 Specimen EG-S-H-NG-2 .......................................................................................................... 50
4.4.20 Corrosion Ratings ..................................................................................................................... 50
vi
4.4.21 Chloride Analysis ...................................................................................................................... 53
CHAPTER 5: ANALYSIS AND DISCUSSION OF RESULTS ............................................................ .
5.1 OVERALL PERFoRMANCE................................................................................................................... -'"
5.2 EFFECTOFJOINTTYPE .......................................................................................................................... 61
5.2.1 Galvanized Steel Duct Corrosion .............................................................................................. 61
5.2.2 Prestressing Strand Corrosion .................................................................................................. 62
5.2.3 Mild Steel Reinforcement Corrosion ......................................................................................... 63
5.2.4 Chloride Penetration ................................................................................................................. 63
5.2.5 Grouting ................................................................................................................................... 63
5.3 EFFECT OF DuCT TYPE .......................................................................................................................... 63
5.3.1 Duct Corrosion ......................................................................................................................... 63
5.3.2 Prestressing Strand Corrosion .................................................................................................. 64
5.3.3 Reversed Macrocell ................................................................................................................... 64
5.4 EFFECT OF JOINT PRECOMPRESSION ..................................................................................................... 64
5.4.1 Reinforcement Corrosion .......................................................................................................... 64
5.4.2 Duct Corrosion ......................................................................................................................... 64
5.5 EFFECT OF GROUT TYPE ........................................................................................................................ 65
5.6 GROUT Voros ....................................................................................................................................... 66
5.7 REvERsED CORROSION MACROCELL ................................................................................................... 67
5.8 'TEST MEAsuREMENTs ........................................................................................................................... 68
5.8.1 Comparison Between Half-Cell Potentials and Macrocell Corrosion Current ......................... 68
5.8.2 Reversed Macrocell Corrosion .................................................................................................. 69
5.8.3 Comparison Between Macrocell Corrosion Current and Forensic Examination ...................... 69
CHAPTER 6: SUMMARY AND CONCLUSIONS .................................................................................... 73
6.1 OVERALL PERFoRMANCE ..................................................................................................................... 73
6.2 AssFSSING CORROSION ACTIVITY USING HALF-CELL POTENTIAL MEAsuREMENTs ........................ 73
6.3 SEGMENTAL JOIN1S ............................................................................................................................... 73
6.4 DuC1SFORlNTERNALPOST-TENSIONING ........................................................................................... 74
6.5 JOINT PRECOMPRESSION ....................................................................................................................... 74
6.6 GROUTS FOR BoNDED POST-TENSIONING ............................................................................................ 74
CHAPTER 7: IMPLEMENTATION OF RESULTS .................................................................................... 75
vii

viii
Figure 1.1
Figure 1.2
Figure 2.1
Figure2.2
Figure2.3
Figure 2.4
Figure2.5
Figure3.1
Figure3.2
Figure3.3
Figure3.4
Figure3.5
Figure3.6
Figure3.7
Figure3.8
Figure3.9
Figure3.10
Figure4.1
Figure4.2
Figure4.3
Figure4.4
Figure4.5
Figure4.6
Figure4.7
Figure4.8
LIST OF FIGURES
Possible Corrosion Mechanism at Precast Segmental Joints .................................................. 1
Corrosion of Internal Prestressing Tendons at Mortar Joint Between Precast Segments ....................................................................................................................................... 2
Macrocell Specimen Details ........................................................................................................ 8
Anode and Cathode Bar Details ................................................................................................ 9
Gasket J)etails ............................................................................................................................. 10
Macrocell Corrosion Current Measurement .......................................................................... 13
Half-Cell Potential Readings .................................................................................................... 14
Macrocell Corrosion Current: Dry Joint, Steel Duct and Normal Grout ............................ 15
Macrocell Corrosion Current: Dry Joint, Steel Duct and Corrosion Inhibitor in Grout... 16
Macrocell Corrosion Current: Dry Joint, PVC Duct and Normal Grout ............................ 16
Macrocell Corrosion Current: Standard Epoxy Joint, Steel Duct and Normal Grout ...... 17
Half...Cell Potentials: Dry Joint, Steel Duct and Normal Grout ............................................ 18
Half-Cell Potentials: Dry Joint, Steel Duct and Corrosion Inhibitor ................................... 18
Half-Cell Potentials: Dry Joint PVC Duct and Normal Grout.. .......................................... 19
Half-Cell Potentials: Standard Epoxy Joint, Steel Duct and Normal Grout ...................... 19
Time to Corrosion Initiation for Active Specimens ............................................................... 22
Calculated Corrosion Rates for Active Specimens ................................................................ 26
Specimen Labeling Scheme ...................................................................................................... 29
Chloride Sample Locations ....................................................................................................... 30
Longitudinal Saw Cuts ............................................................................................................. 31
Specimen Opened to Expose Duct/Strand ............................................................................ 32
Specimen Opened to Expose Mild Steel Bars ........................................................................ 32
Examining Epoxy Joint Condition ........................................................................................... 33
Intervals for Corrosion Ratings on Prestressing Strand ....................................................... 35
Intervals for Corrosion Ratings On Mild Steel Bars .............................................................. 37
Figure 4.9 Intervals for Corrosion Ratings on Galvanized Duct ........................................................... 38
Figure 4.10 Severe Duct Corrosion Damage ............................................................................................... 39
Figure 4.11 Moderate Prestressing Strand Corrosion Where Epoxy Paint Peeled Away (Segmental Joint Location Indicated by Vertical White Line) ............................................. 40
Figure 4.12 Heavy Rust Staining on Grout Surface ................................................................................... 40
Figure 4.13 Rust Staining Around Duct Opening in Dry Joint Face ....................................................... 41
Figure 4.14 Cracking Due to Rebar Corrosion ........................................................................................... 42
ix
Figure 4.15 Grout Infiltration Into Joint: Specimen DJ-S-L-CI-1 .............................................................. 44
-r:;~e 4.16 Joint Epoxy Smeared Inside Galvanized Dud During Swabbing ....................................... 46
ure 4.17 Joint Epoxy Smeared Inside Plastic Duct During Swabbing ............................................... 47
Figure 4.18 Incomplete Epoxy Coverage in Epoxy /Gasket Joint (EG-S-M-NG-2) ............................... 50
Figure 4.19 Strand Corrosion Ratings for All Specimens ......................................................................... 52
Figure 4.20 Mild Steel Bar Corrosion Ratings for All Specimens ............................................................ 52
Figure 4.21 Duct Corrosion Ratings for All Specimens ............................................................................. 53
Figure 4.22 Concrete Chloride Ion Profiles for Specimen DJ-S-L-NG-1 ................................................. 54
Figure 4.23 Concrete Chloride Ion Profiles for Specimen SE-S-L-NG-2 ................................................. 55
Figure 4.24 Concrete Chloride Ion Profiles for Specimen DJ-S-L-CI-1 ................................................... 55
Figure 4.25 Concrete Chloride Ion Profiles for Specimen SE-S-M-NG-2 ................................................ 56
Figure 4.26 Measured Chloride Contents in Post-tensioning Grout ....................................................... 57
Figure 5.1 Corrosion Ratings for Prestressing Strand Ordered According to Performance .............. 60
Figure 5.2 Total Corrosion Rating Ordered According to Performance ............................................... 61
Figure 5.3 Galvanized Steel Duct Corrosion: Effect of Joint Type ......................................................... 62
Figure 5.4 Effect of Joint Precompression on Duct Corrosion ................................................................ 65
Figure 5.5 Typical Grout Voids .................................................................................................................. 66
Figure 5.6 Hole in Duct Corresponding to Grout Void .......................................................................... 67
Figure 5.7 Mechanism for Development of Reversed Macrocell in Dry Joint Specimens .................. 68
Figure 5.8 Comparison Between Corrosion Current and Half-Cell Potential Readings .................... 69
Figure 5.9 Comparison of Corrosion Rating and Metal Loss for Prestressing Strand ........................ 70
Figure 5.10 Comparison of Corrosion Ratings and Metal Loss for Mild Steel Bars .............................. 71
X
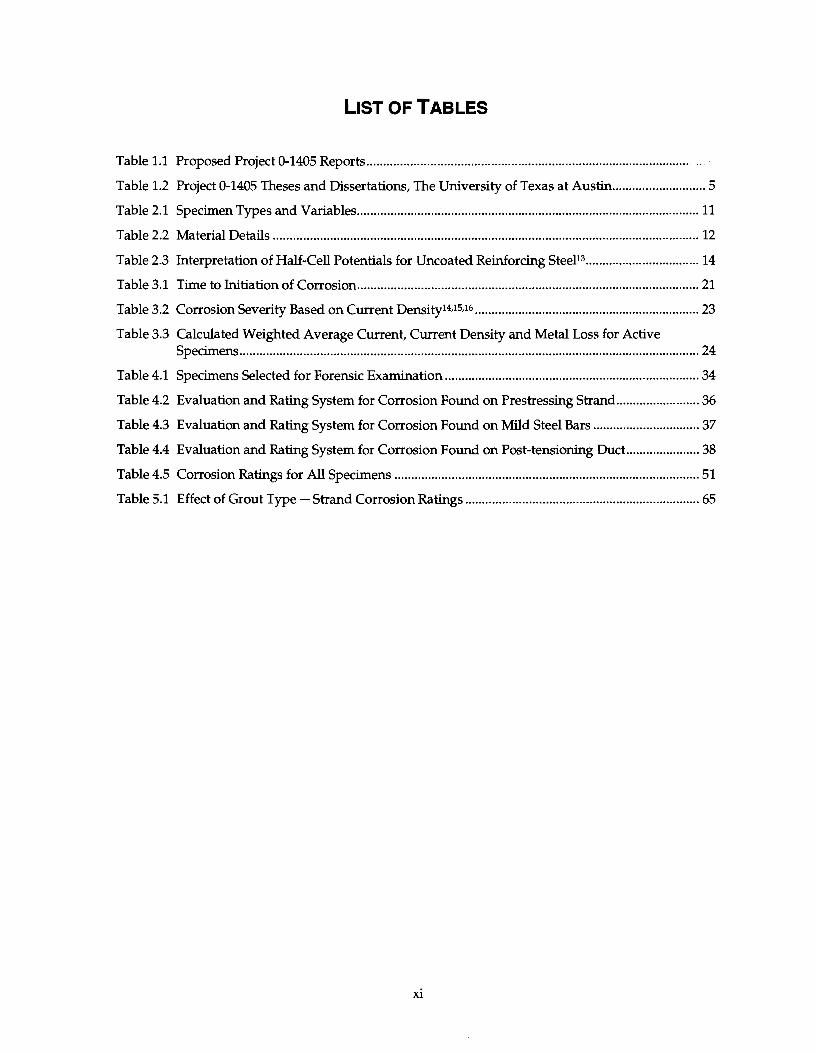
LIST OFT ABLES
Table 1.1 Proposed Project 0-1405 Reports ................................................................................................ ,.
Table 1.2 Project 0-1405 Theses and Dissertations, The University of Texas at Austin ............................ 5
Table 2.1 Specimen Types and Variables ...................................................................................................... 11
Table 2.2 Material Details ............................................................................................................................... 12
Table 2.3 Interpretation of Half-Cell Potentials for Uncoated Reinforcing Steel13 .................................. 14
Table 3.1 Time to Initiation of Corrosion ...................................................................................................... 21
Table 3.2 Corrosion Severity Based on Current Densityi4.15,I6 ................................................................... 23
Table 3.3 Calculated Weighted Average Current, Current Density and Metal Loss for Active Specimens ......................................................................................................................................... 24
Table 4.1 Specimens Selected for Forensic Examination ............................................................................ 34
Table 4.2 Evaluation and Rating System for Corrosion Found on Prestressing Strand ......................... 36
Table 4.3 Evaluation and Rating System for Corrosion Found on Mild Steel Bars ................................ 37
Table 4.4 Evaluation and Rating System for Corrosion Found on Post-tensioning Duct ...................... 38
Table 4.5 Corrosion Ratings for All Specimens ........................................................................................... 51
Table 5.1 Effect of Grout Type- Strand Corrosion Ratings ...................................................................... 65
xi

I
Xll
SUMMARY
This report documents a series of accelerated corrosion tests on small-sized specimens typica _ \ . bonded internal post-tensioning tendons in segmentally constructed box girder concrete bridges. Thirty-eight macrocell specimens were subjected to a highly aggressive exposure and observed for four and one-half years. At that time, nineteen of the specimens were opened for detailed examination and all corrosion behavior recorded. The variables included were joint type (dry or epoxy), duct type (galvanized steel o~ plastic), grout type (3 grouts with differing additives) and level of joint compression (3 different levels). Half-cell potentials and macrocell corrosion currents were measured throughout exposure. While some substantial corrosion was found in dry joint specimens, the corrosion resistance of epoxy joint specimens was excellent. Detailed conclusions and 5 specific recommendations for immediate implementation are given.
Xlll

Chapter 1: Introduction
1.1 BACKGROUND AND OBJECTIVES
Post-tensioning in precast concrete segmental bridge construction may be in the form of internal bonded tendons, external tendons, or a combination of both. Current specifications1 require the use of match-cast epoxy joints when internal tendons are used. Epoxy joints were introduced to enhance force transfer across the segmental joint and to seal the joint against moisture ingress. More recently, epoxy joints have been recognized as an absolute requirement for durability when internal tendons are used.
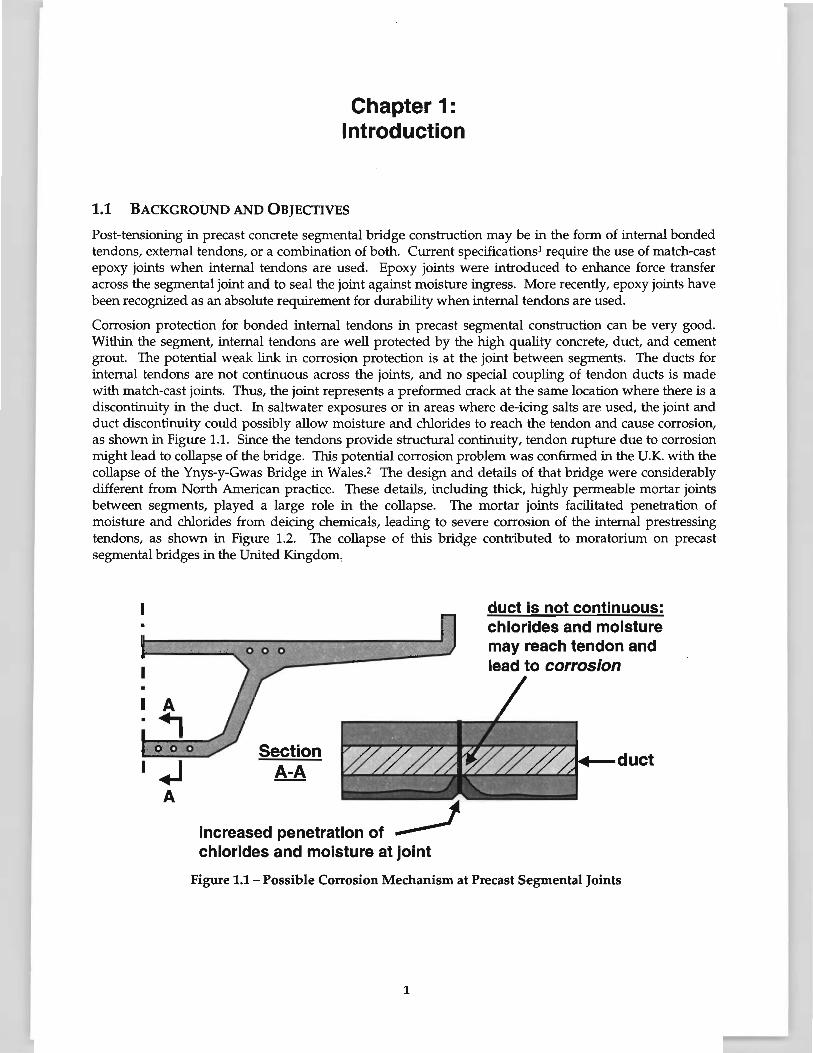
Corrosion protection for bonded internal tendons in precast segmental construction can be very good. Within the segment, internal tendons are well protected by the high quality concrete, duct, and cement grout. The potential weak link in corrosion protection is at the joint between segments. The ducts for internal tendons are not continuous across the joints, and no special coupling of tendon ducts is made with match-cast joints. Thus, the joint represents a preformed crack at the same location where there is a discontinuity in the duct. In saltwater exposures or in areas where de-icing salts are used, the joint and duct discontinuity could possibly allow moisture and chlorides to reach the tendon and cause corrosion, as shown in Figure 1.1. Since the tendons provide structural continuity, tendon rupture due to corrosion might lead to collapse of the bridge. This potential corrosion problem was confirmed in the U.K. with the collapse of the Ynys-y-Gwas Bridge in Wales.2 The design and details of that bridge were considerably different from North American practice. These details, including thick, highly permeable mortar joints between segments, played a large role in the collapse. The mortar joints facilitated penetration of moisture and chlorides from deicing chemicals, leading to severe corrosion of the internal prestressing tendons, as shown in Figure 1.2. The collapse of this bridge contributed to moratorium on precast segmental bridges in the United Kingdom,
I
A
Section A-A
Increased penetration of chlorides and moisture at joint
duct Is not continuous: chlorides and moisture may reach tendon and lead to corrosion
Figure 1.1- Possible Corrosion Mechanism at Precast Segmental Joints
1

severe corrosion of prestressing wires at mortar joint
1" thick mortar joint between segments
Figure 1.2- Corrosion of Internal Prestressing Tendons at Mortar Joint Between Precast Segments
The overall performance of precast segmental bridges in North America has been very favorable,3 and there have been no reported cases of corrosion of internal tendons in North American precast segmental construction with epoxy joints. However, given the concerns raised by the U.K. experience, and the relative youth of precast segmental construction in North America (the first precast segmental bridge with internal tendons and epoxied joints in the U.S.A. was constructed in 1972), it is prudent to examine the potential for corrosion problems and get a better understanding of the protective mechanisms with the design details used in North America. Therefore, the objectives of this research program are:
1. To evaluate the potential for corrosion of internal tendons at joints in typical precast segmental construction,
2. To examine the effect of typical North American design and construction details on corrosion protection for internal tendons,
3. To examine methods for improving corrosion protection for internal tendons.
1.2 RESEARCH PROJECT 0-1405
The research described in this report is part of The University of Texas at Austin, Center for Transportation Research Project 0-1405: "Durability Design of Post-Tensioned Bridge Substructure Elements." The research was performed at the Phil M. Ferguson Structural Engineering Laboratory and was sponsored by the Texas Department of Transportation and Federal Highway Administration. The title of Project 0-1405 implies two main components:
1. Durability of Bridge Substructures, and
2. Post-Tensioned Bridge Substructures.
The durability aspect is in response to the deteriorating condition of bridge substructures in some areas of Texas. Considerable research and design effort has been given to bridge deck design to prevent corrosion damage, while substructures have been largely overlooked. In some districts of the state, more than ten percent of the substructures are deficient, and the substructure condition is limiting the service life of the bridges.
2

The second aspect of the research is post-tensioned substructures. As described above, there are many possible applications in bridge substructures where post-tensioning can provide structural and economical benefits, and can possibly improve durability. Post-tensioning is now being used in Texas bridge substructures, and it is reasonable to expect the use of post-tensioning to increase in the future as precasting of substructure components becomes more prevalent and as foundation sizes increase.
Problem:
The problem that bridge engineers are faced with is that there are no durability design guidelines for post-tensioned concrete structures. Durability design guidelines should provide information on how to identify possible durability problems, how to improve durability using post-tensioning, and how to ensure that the post-tensioning system does not intrOduce new durability problems.
1.3 RESEARCH 0BJECfiVES AND PROJECf SCOPE
1.3.1 Project Objectives
The overall research objectives for Project 0-1405 are as follows:
1. To examine the use of post-tensioning in bridge substructures,
2. To identify durability concerns for bridge substructures in Texas,
3. To identify existing technology to ensure durability or improve durability,
4. To develop experimental testing programs to evaluate protection measures for improving the durability of post-tensioned bridge substructures, and
5. To develop durability design guidelines and recommendations for post-tensioned bridge substructures.
A review of literature early in the project indicated that post-tensioning was being successfully used in past and present bridge substructure designs, and that suitable post-tensioning hardware was readily available. It was decided not to develop possible post-tensioned bridge substructure designs as part of the first objective for two reasons. First, other research4,5,6 on post-tensioned substructures was already underway, and second, the durability issues warranted the full attention of Project 0-1405. The third objective was added after the project had begun. The initial literature review identified a substantial amount of relevant information that could be applied to the durability of post-tensioned bridge substructures. This existing information allowed the scope of the experimental portion of the project to be narrowed. The final objective represents the culmination of the project. All of the research findings are to be compiled into the practical format of durability design guidelines.
1.3.2 Project Scope
The subject of durability is extremely broad, and as a result a broad scope of research was developed for Project Q-1405. Based on the project proposal and an initial review of relevant literature, the project scope and necessary work plan were defined. The main components of Project Q-1405 are:
• Extensive literature Review
• Survey of Existing Bridge Substructures
• Long-Term Corrosion Tests with Large-Scale Post-Tensioned Beam and Column Elements
• Investigation of Corrosion Protection for Internal Prestressing Tendons in Precast Segmental Bridges
• Development of Improved Grouts for Post-Tensioning
3
The investigation of corrosion protection for internal tendons in segmental construction is described in this report. This testing program was developed and implemented R. P. Vignos7 under TxOOT Project 0-1264. This testing program was transferred to Project 0-1405 in 1995 for long-term testing. Although this aspect of the research was developed under Project 0-1264 to address corrosion concerns for precast segmental bridge superstructures, the concepts and variables are equally applicable to precast segmental substructures, and the testing program fits well within the scope of Project 0-1405.
1.4 PROJECT REPORTING
The research tasks in Project 0-1405 were performed by graduate research assistants B. D. Koester~s C. J. Laroschel A. J. Schokker,w and J. S. West}l under the supervision of Dr. J. E. Breen and Dr. M. E. Kreger. Project 0-1405 is not complete, with the long-term beam and column exposure tests and the macrocell corrosion tests currently ongoing. The major tasks to be completed in the future include continued exposure testing and data collection, final autopsy of all beam, column and macrocell specimens and preparation of the final durability design guidelines.
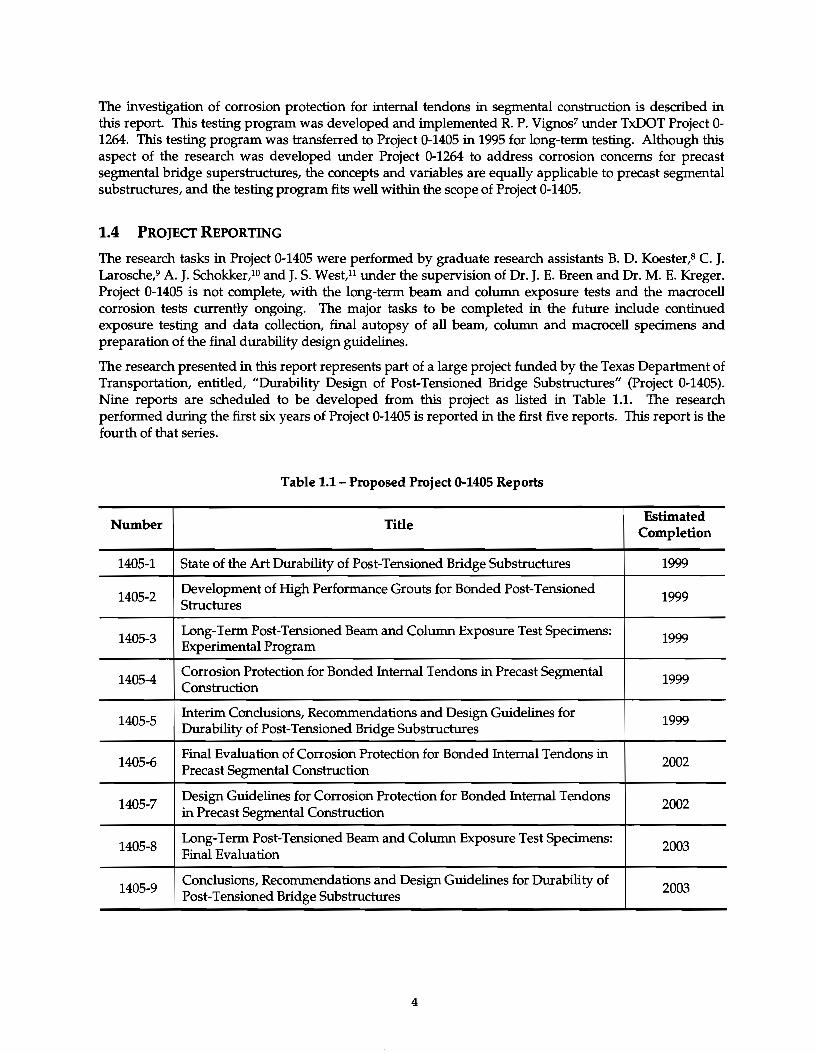
The research presented in this report represents part of a large project funded by the Texas Department of Transportation, entitled, "Durability Design of Post-Tensioned Bridge Substructures" (Project 0-1405). Nine reports are scheduled to be developed from this project as listed in Table 1.1. The research performed during the first six years of Project 0-1405 is reported in the first five reports. This report is the fourth of that series.
Table 1.1- Proposed Project Q-1405 Reports
Number Title Estimated
Completion
1405-1 State of the Art Durability of Post-Tensioned Bridge Substructures 1999
1405-2 Development of High Performance Grouts for Bonded Post-Tensioned
1999 Structures
1405-3 Long-Term Post-Tensioned Beam and Column Exposure Test Specimens:
1999 Experimental Program
1405-4 Corrosion Protection for Bonded Internal Tendons in Precast Segmental
1999 Construction
1405-5 Interim Conclusions, Recommendations and Design Guidelines for
1999 Durability of Post-Tensioned Bridge Substructures
1405-6 Final Evaluation of Corrosion Protection for Bonded Internal Tendons in
2002 Precast Segmental Construction
1405-7 Design Guidelines for Corrosion Protection for Bonded Internal Tendons
2002 in Precast Segmental Construction
1405-8 Long-Term Post-Tensioned Beam and Column Exposure Test Specimens:
2003 Final Evaluation
1405-9 Conclusions, Recommendations and Design Guidelines for Durability of
2003 Post-Tensioned Bridge Substructures
4
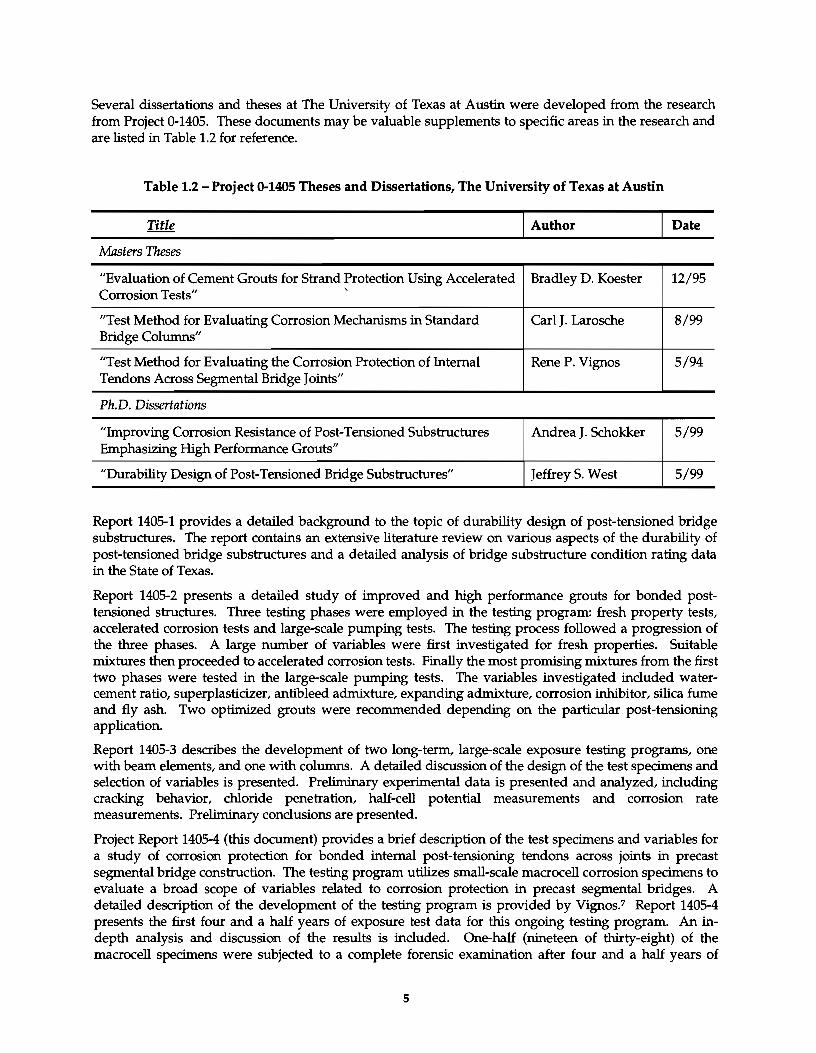
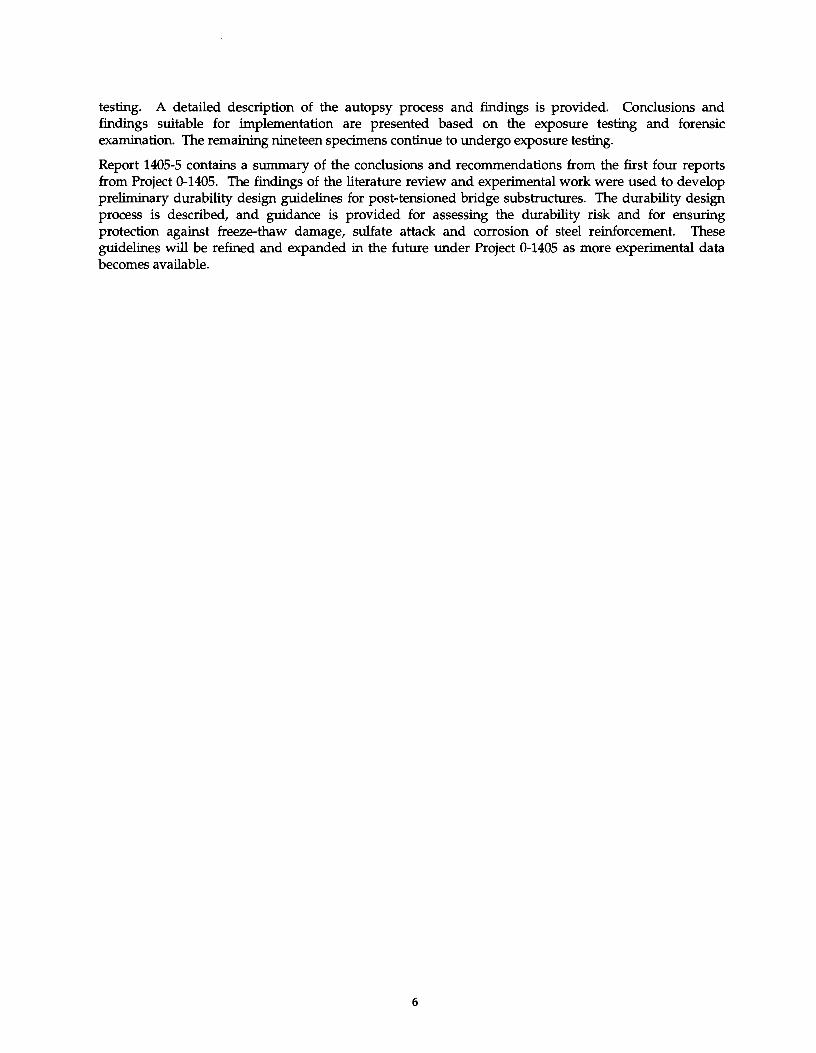
Several dissertations and theses at The University of Texas at Austin were developed from the research from Project ()..1405. These documents may be valuable supplements to specific areas in the research and are listed in Table 1.2 for reference.
Table 1.2- Project 0-1405 Theses and Dissertations, The University of Texas at Austin
Masters Theses
"Evaluation of Cement Grouts for Strand Protection Using Accelerated Corrosion Tests" '
"Test Method for Evaluating Corrosion Mechanisms in Standard Bridge Columns"
"Test Method for Evaluating the Corrosion Protection of Internal Tendons Across Segmental Bridge Joints"
Ph.D. Dissertations
"Improving Corrosion Resistance of Post-Tensioned Substructures Emphasizing High Performance Grouts"
"Durability Design of Post-Tensioned Bridge Substructures"
I Author
Bradley D. Koester
Carl J. Larosche
Rene P. Vignos
Andrea J. Schokker
JeffreyS. West
Date
12/95
8/99
5/94
5/99
5/99
Report 1405-1 provides a detailed background to the topic of durability design of post-tensioned bridge substructures. The report contains an extensive literature review on various aspects of the durability of post-tensioned bridge substructures and a detailed analysis of bridge substructure condition rating data in the State of Texas.
Report 1405-2 presents a detailed study of improved and high performance grouts for bonded posttensioned structures. Three testing phases were employed in the testing program: fresh property tests, accelerated corrosion tests and large-scale pumping tests. The testing process followed a progression of the three phases. A large number of variables were first investigated for fresh properties. Suitable mixtures then proceeded to accelerated corrosion tests. Finally the most promising mixtures from the first two phases were tested in the large-scale pumping tests. The variables investigated included watercement ratio, superplasticizer, antibleed admixture, expanding admixture, corrosion inhibitor, silica fume and fly ash. Two optimized grouts were recommended depending on the particular post-tensioning application.
Report 1405-3 describes the development of two long-term, large-scale exposure testing programs, one with beam elements, and one with columns. A detailed discussion of the design of the test specimens and selection of variables is presented. Preliminary experimental data is presented and analyzed, including cracking behavior, chloride penetration, half-cell potential measurements and corrosion rate measurements. Preliminary conclusions are presented.
Project Report 1405-4 (this document) provides a brief description of the test specimens and variables for a study of corrosion protection for bonded internal post-tensioning tendons across joints in precast segmental bridge construction. The testing program utilizes small-scale macrocell corrosion specimens to evaluate a broad scope of variables related to corrosion protection in precast segmental bridges. A detailed description of the development of the testing program is provided by Vignos.7 Report 1405-4 presents the first four and a half years of exposure test data for this ongoing testing program. An indepth analysis and discussion of the results is included. One-half (nineteen of thirty-eight) of the macrocell specimens were subjected to a complete forensic examination after four and a half years of
5
testing. A detailed description of the autopsy process and findings is provided. Conclusions and findings suitable for implementation are presented based on the exposure testing and forensic examination. The remaining nineteen specimens continue to undergo exposure testing.
Report 1405-5 contains a summary of the conclusions and recommendations from the first four reports from Project 0-1405. The findings of the literature review and experimental work were used to develop preliminary durability design guidelines for post-tensioned bridge substructures. The durability design process is described, and guidance is provided for assessing the durability risk and for ensuring protection against freeze-thaw damage, sulfate attack and corrosion of steel reinforcement. These guidelines will be refined and expanded in the future under Project Q-1405 as more experimental data becomes available.
6
Chapter 2: Experimental Program
The test method and experimental program described in this report were developed and implemented by Rene Vignos.7 The criteria for the testing program were as follows:
• The test method should provide meaningful comparisons in a reasonable amount of time (less than 5 years).
• The test method should accommodate the desired variables in a realistic manner.
• The test method should allow measurement of both macrocell and microcell corrosion.
• The test method should be as standardized as possible to allow comparisons with past and future testing, and provide reproducible results.
Vignos patterned the test method after ASTM G109- "Standard Test Method for Determining the Effects of Chemical Admixtures on the Corrosion of Embedded Steel Reinforcement in Concrete Exposed to Chloride Environments."12 The standard macrocell corrosion specimens were modified to examine prestressing tendons in grouted ducts and simulate segmental joints. A full description of the development of the testing program and details of the experiment setup are provided in Ref. 7. A summary of the test specimens, variables and measurements is provided in the following sections. Exposure testing was initiated by Vignos in August 1993.
2.1 TEST SPECIMEN
The specimens used in this program are patterned after the standard ASTM G10912 macrocell specimen developed to evaluate the effect of concrete admixtures on the corrosion of mild steel reinforcement. The standard specimens consisted of a single concrete block with two layers of mild steel reinforcement. During macrocell corrosion, the top layer of steel acts as the anode and the bottom layer acts as the cathode. Several modifications were made to the ASTM G109 specimens to evaluate corrosion protection for internal tendons in segmental bridge construction. These included the introduction of a transverse joint in the concrete block to allow the effect of the segmental joint type to be evaluated, the use of a grouted prestressing strand in the top layer (anode) and the addition of longitudinal compressive stress on the specimen to simulate prestress in the structure. The specimen configuration is shown in Figure 2.1.
Each specimen consists of two match-cast segments. Continuity between the segments is provided by a 12.7 mm (0.5 inch) diameter, seven-wire prestressing strand inside a grouted duct, representing a typical bonded internal tendon in segmental bridge construction. The duct is cast into each of the match-cast segments and is not continuous across the joint. Due to the small specimen size, the strand can not be post-tensioned effectively. To simulate precompression across the joint due to post-tensioning, the pairs of match-cast segments were stressed together using external loading frames.
Similar to ASTM G109, two 12.7 mm (#4) mild steel bars were used as the cathode. These bars would represent non-prestressed reinforcement within the segment. The use of two bars increases the ratio of cathode area to anode area, accelerating macrocell corrosion. The cathode bars were discontinuous across the transverse joint, consistent with precast segmental construction. The end cover for the cathode bars at the segmental joint was 6 mm (0.25 in.). Following ASTM G109, the exposed length of the anode and cathode were limited to 125 mm (5 in.) by painting the steel with epoxy paint as shown in Figure 2.2.
7

R
2- #4 bars 12.7 mm dia.
3% NaCI solution
plexiglass
1-E----- 300 mm ----ill>l
19mm
150mm
Long!tudjnal Section
25mm
End VIew
30 mm O.D. steel 33 mm O.D. plastic
Figure 2.1- Macrocell Specimen Details
Electrical contact must exist between the anode and cathode for macrocell corrosion to develop. This contact is achieved in the test specimen by wiring the protruding ends of the anode and cathode steel together, as shown in Figure 2.1. Zinc ground clamps are used to connect the wire to the steel. A 100-0hm resistor is placed in the wire connection between the anode and cathode, as shown in Figure 2.1, to allow assessment of the corrosion current by measuring the voltage drop across the resistor (L:orr = Vmeas/R).
8
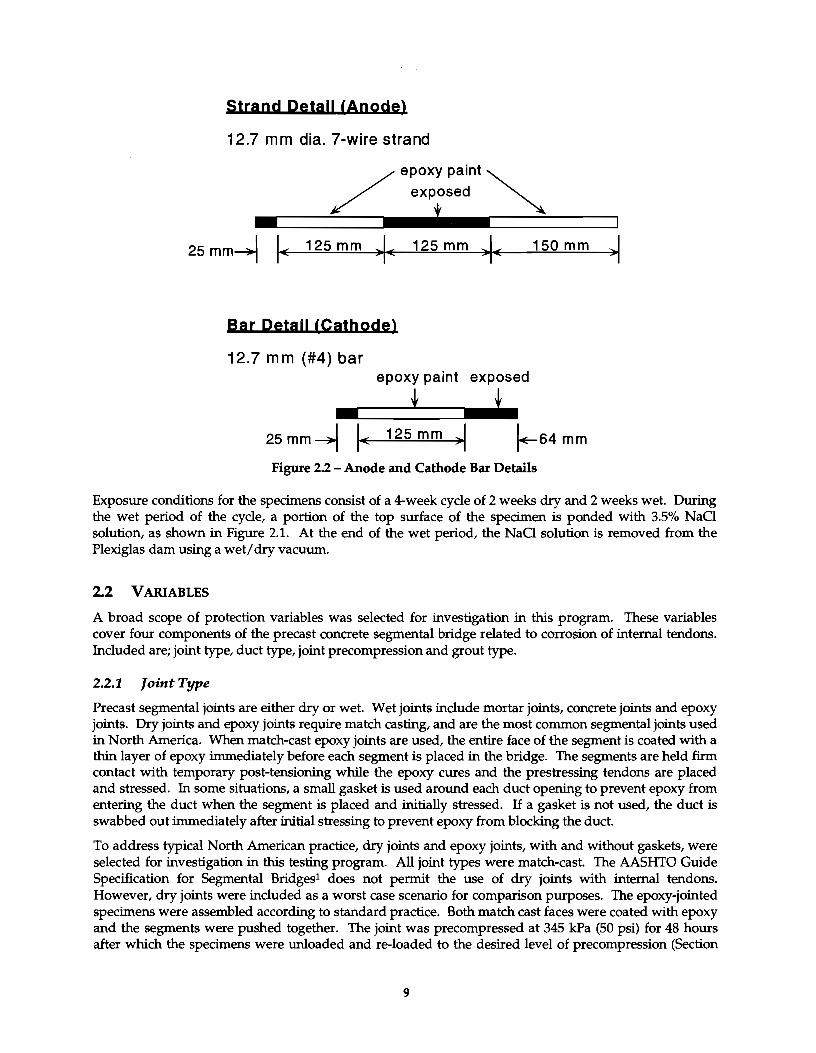
Strand Detail CAnodel
12.7 mm dia. 7-wirestrand
/
epoxy paint~ exposed
t
Bar Detail (Cathode)
12.7 mm (#4) bar
150 mm ~1
epoxy paint exposed
t t 25 mm~ I< 125 mm ~I ~64mm Figure 2.2 -Anode and Cathode Bar Details
Exposure conditions for the specimens consist of a 4-week cycle of 2 weeks dry and 2 weeks wet. During the wet period of the cycle, a portion of the top surface of the specimen is ponded with 3.5% NaCl solution, as shown in Figure 2.1. At the end of the wet period, the NaCl solution is removed from the Plexiglas dam using a wet/ dry vacuum.
2.2 VARIABLES
A broad scope of protection variables was selected for investigation in this program. These variables cover four components of the precast concrete segmental bridge related to corrosion of internal tendons. Included are; joint type, duct type, joint precompression and grout type.
2.2.1 Joint Type
Precast segmental joints are either dry or wet. Wet joints include mortar joints, concrete joints and epoxy joints. Dry joints and epoxy joints require match casting, and are the most common segmental joints used in North America. When match-cast epoxy joints are used, the entire face of the segment is coated with a thin layer of epoxy immediately before each segment is placed in the bridge. The segments are held firm contact with temporary post-tensioning while the epoxy cures and the prestressing tendons are placed and stressed. In some situations, a small gasket is used around each duct opening to prevent epoxy from entering the duct when the segment is placed and initially stressed. If a gasket is not used, the duct is swabbed out immediately after initial stressing to prevent epoxy from blocking the duct.
To address typical North American practice, dry joints and epoxy joints, with and without gaskets, were selected for investigation in this testing program. All joint types were match-cast. The AASIITO Guide Specification for Segmental Bridges1 does not permit the use of dry joints with internal tendons. However, dry joints were included as a worst case scenario for comparison purposes. The epoxy-jointed specimens were assembled according to standard practice. Both match cast faces were coated with epoxy and the segments were pushed together. The joint was precompressed at 345 kPa (50 psi) for 48 hours after which the specimens were unloaded and re-loaded to the desired level of precompression (Section
9
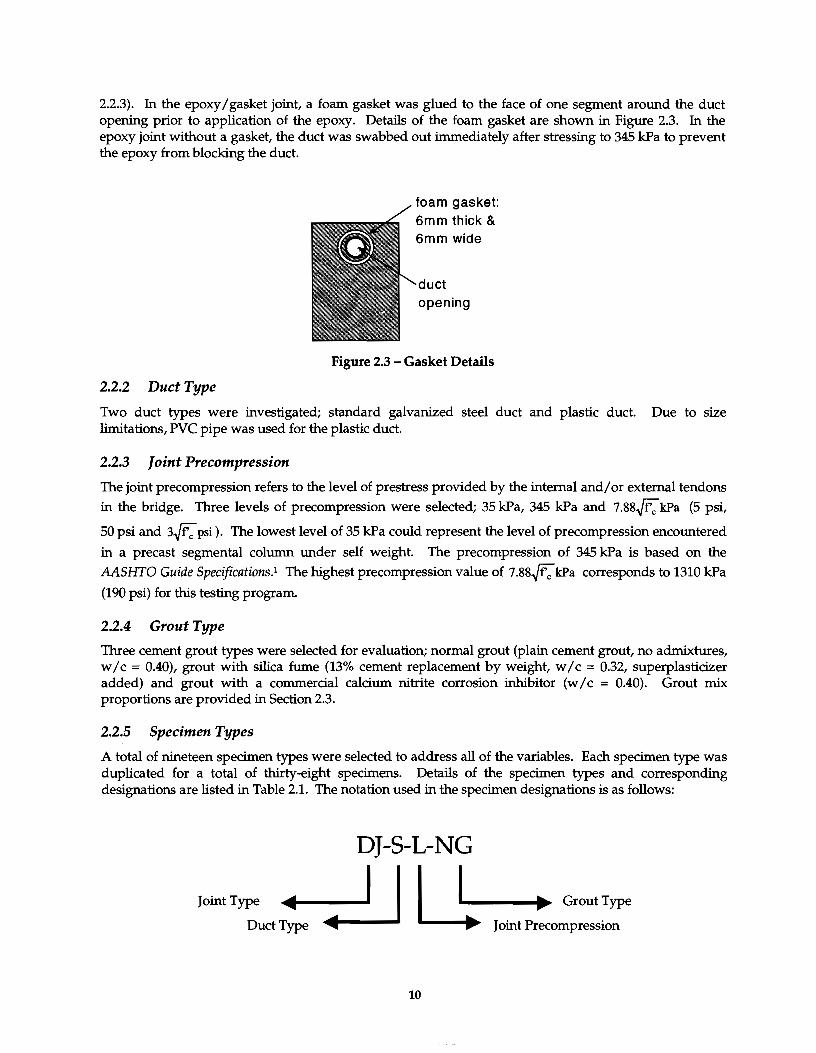
2.2.3). In the epoxy I gasket joint, a foam gasket was glued to the face of one segment around the duct opening prior to application of the epoxy. Details of the foam gasket are shown in Figure 2.3. In the epoxy joint without a gasket, the duct was swabbed out immediately after stressing to 345 kPa to prevent the epoxy from blocking the duct.
Figure 2.3 - Gasket Details
2.2.2 Duct Type
Two duct types were investigated; standard galvanized steel duct and plastic duct. Due to size limitations, PVC pipe was used for the plastic duct.
2.2.3 Joint Precompression
The joint precompression refers to the level of prestress provided by the internal and/ or external tendons
in the bridge. Three levels of precompression were selected; 35 kPa, 345 kPa and 7.88..{f; kPa (5 psi,
50 psi and 3..{f; psi). The lowest level of 35 kPa could represent the level of precompression encountered
in a precast segmental column under self weight. The precompression of 345 kPa is based on the
AASHTO Guide Specifications.1 The highest precompression value of 7.88..{f; kPa corresponds to 1310 kPa
(190 psi) for this testing program.
2.2.4 Grout Type
Three cement grout types were selected for evaluation; normal grout (plain cement grout, no admixtures, w I c = 0.40), grout with silica fume (13% cement replacement by weight, w I c = 0.32, superplasticizer added) and grout with a commercial calcium nitrite corrosion inhibitor (w I c = 0.40). Grout mix proportions are provided in Section 2.3.
2.2.5 Specimen Types
A total of nineteen specimen types were selected to address all of the variables. Each specimen type was duplicated for a total of thirty-eight specimens. Details of the specimen types and corresponding designations are listed in Table 2.1. The notation used in the specimen designations is as follows:
DJ-5-L-NG
JointType • • I I U .. GroutType
Duct Type Joint Precompression
10
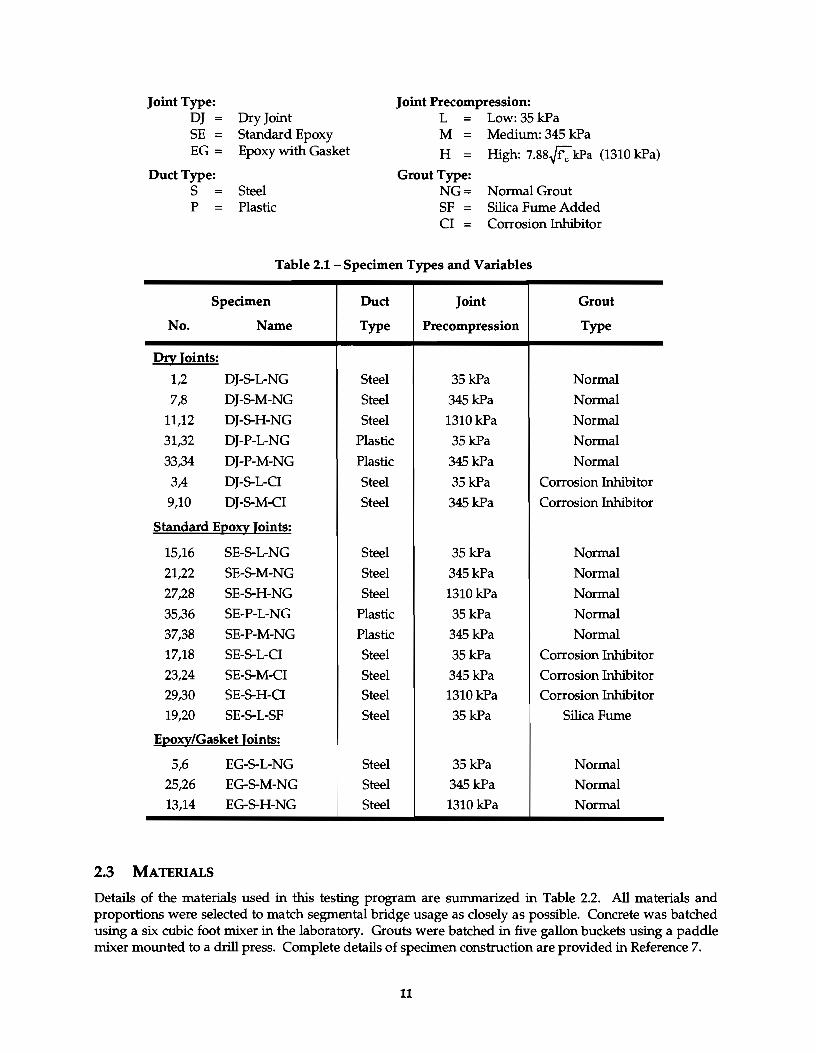
Joint Type: DJ SE EG =
Duct Type:
Dry Joint Standard Epoxy Epoxy with Gasket
S Steel P Plastic
Joint Precompression: L = Low: 35 kPa M = Medium: 345 kPa
H = High: 7.88,.J'f; kPa (1310 kPa)
Grout Type: NG = Normal Grout SF = Silica Fume Added CI = Corrosion Inhibitor
Table 2.1 -Specimen Types and Variables
Specimen Duct Joint Grout
No. Name Type Precompression Type
Dry Joints:
1,2 DJ-5-L-NG Steel 35kPa Normal
7,8 DJ-5-M-NG Steel 345kPa Normal
11,12 DJ-5-H-NG Steel 1310kPa Normal
31,32 DJ-P-L-NG Plastic 35kPa Normal
33,34 DJ-P-M-NG Plastic 345kPa Normal
3,4 DJ-5-L-CI Steel 35kPa Corrosion Inhibitor
9,10 DJ-5-M-CI Steel 345kPa Corrosion Inhibitor
Standard E:eo~ Joints:
15,16 SE-5-L-NG Steel 35kPa Normal
21,22 SE-5-M-NG Steel 345kPa Normal
27,28 SE-5-H-NG Steel 1310kPa Normal
35,36 SE-P-L-NG Plastic 35kPa Normal
37,38 SE-P-M-NG Plastic 345 kPa Normal
17,18 SE-5-L-CI Steel 35kPa Corrosion Inhibitor
23,24 SE-5-M-CI Steel 345kPa Corrosion Inhibitor
29,30 SE-5-H-CI Steel 1310kPa Corrosion Inhibitor
19,20 SE-5-L-SF Steel 35kPa Silica Fume
E:eo~/Gasket Ioints:
5,6 EG-5-L-NG Steel 35kPa Normal
25,26 EG-5-M-NG Steel 345kPa Normal
13,14 EG-5-H-NG Steel 1310kPa Normal
2.3 MATERIALS
Details of the materials used in this testing program are summarized in Table 2.2. All materials and proportions were selected to match segmental bridge usage as closely as possible. Concrete was batched using a six cubic foot mixer in the laboratory. Grouts were batched in five gallon buckets using a paddle mixer mounted to a drill press. Complete details of specimen construction are provided in Reference 7.
11
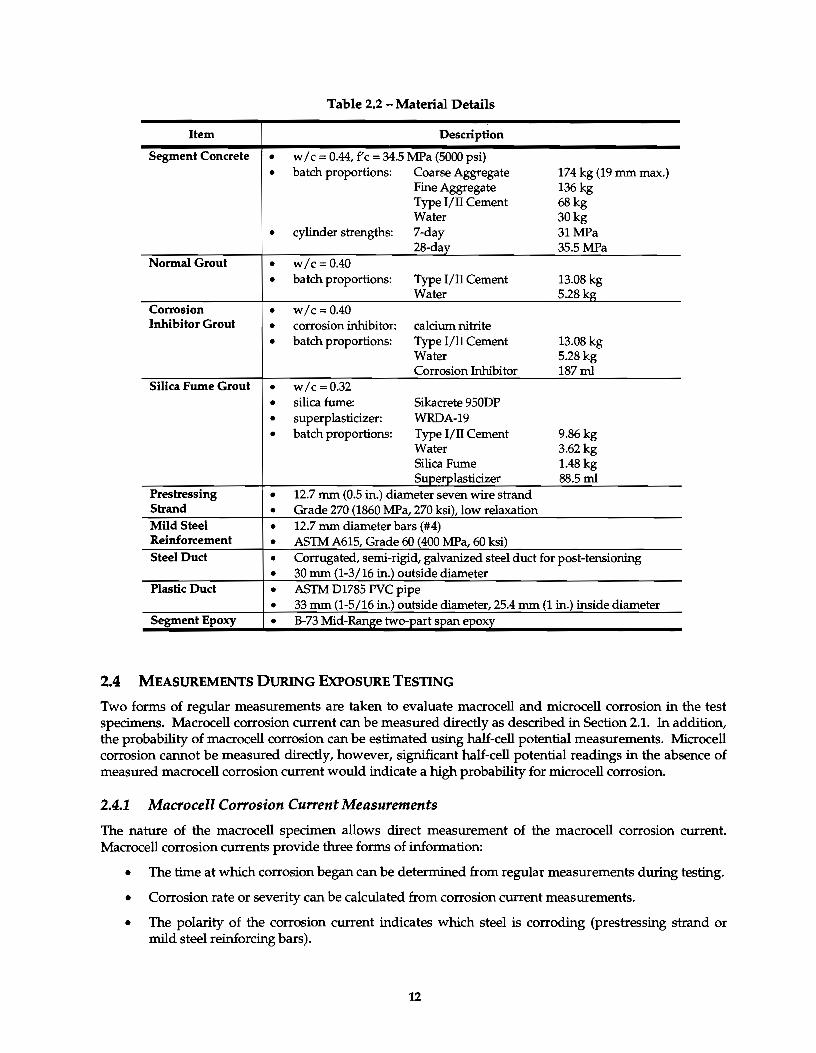
Table 2.2 -Material Details
Item Description
Segment Concrete • w I c = 0.44, f' c = 34.5 MPa (5000 psi)
• batch proportions: Coarse Aggregate 174 kg (19 mm max.) Fine Aggregate 136kg Type 1/IT Cement 68kg Water 30kg
• cylinder strengths: 7-day 31MPa 28-day 35.5MPa
Normal Grout • w/c = 0.40 • batch proportions: Type 1/IT Cement 13.08kg
Water 5.28kg Corrosion • w/c = 0.40 Inhibitor Grout • corrosion inhibitor: calcium nitrite
• batch proportions: Type l/IT Cement 13.08kg Water 5.28kg Corrosion Inhibitor 187ml
Silica Fume Grout • w/c =0.32
• silica fume: Sikacrete 950DP
• superplasticizer: WRDA-19
• batch proportions: Type 1/IT Cement 9.86kg Water 3.62kg Silica Fume 1.48 kg Superplasticizer 88.5ml
Prestressing • 12.7 mm (0.5 in.) diameter seven wire strand Strand • Grade 270 (1860 MPa, 270 ksi), low relaxation Mild Steel • 12.7 mm diameter bars (#4) Reinforcement • AS1M A615, Grade 60 (400 MPa, 60 ksi) Steel Duct • Corrugated, semi-rigid, galvanized steel duct for post-tensioning
• 30 mm (1-3/16 in.) outside diameter Plastic Duct • AS1M D1785 PVC pipe
• 33 mm (1-5/16 in.) outside diameter,25.4 mm (1 in.) inside diameter Segment Epoxy • B-73 Mid-Range two-part span epoxy
2.4 MEASUREMENTS DURING EXPOSURE TESTING
Two forms of regular measmements are taken to evaluate macrocell and microcell corrosion in the test specimens. Macrocell corrosion current can be measmed directly as described in Section 2.1. In addition, the probability of macrocell corrosion can be estimated using half-cell potential measmements. Microcell corrosion cannot be measmed directly, however, significant half-cell potential readings in the absence of measmed macrocell corrosion current would indicate a high probability for microcell corrosion.
2.4.1 Macrocell Co"osion Cu"ent Measurements
The natme of the macrocell specimen allows direct measmement of the macrocell corrosion current. Macrocell corrosion currents provide three forms of information:
• The time at which corrosion began can be determined from regular measmements dming testing.
• Corrosion rate or severity can be calculated from corrosion current measmements.
• The polarity of the corrosion current indicates which steel is corroding (prestressing strand or mild steel reinforcing bars).
12
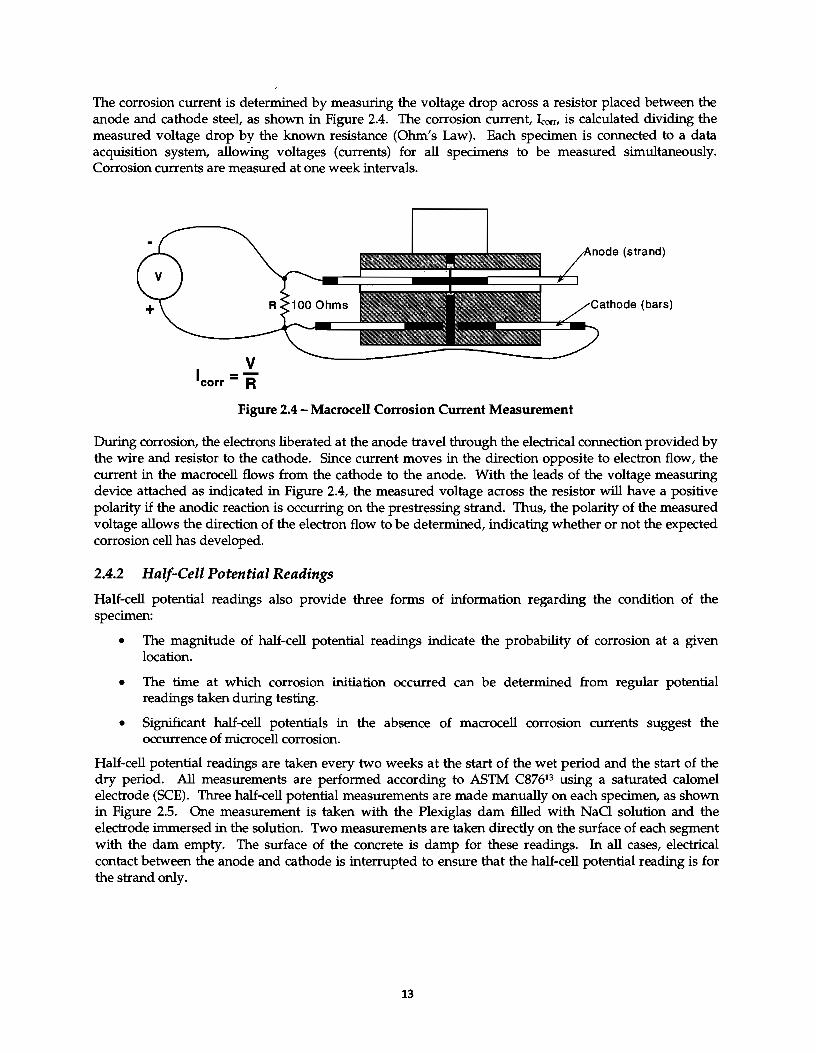
The corrosion current is determined by measuring the voltage drop across a resistor placed between the anode and cathode steel, as shown in Figure 2.4. The corrosion current, brr, is calculated dividing the measured voltage drop by the known resistance (Ohm's Law). Each specimen is connected to a data acquisition system, allowing voltages (currents) for all specimens to be measured simultaneously. Corrosion currents are measured at one week intervals.
v 1corr = R
Figure 2.4 - Macrocell Corrosion Current Measurement
(strand)
athode (bars)
During corrosion, the electrons liberated at the anode travel through the electrical connection provided by the wire and resistor to the cathode. Since current moves in the direction opposite to electron flow, the current in the macrocell flows from the cathode to the anode. With the leads of the voltage measuring device attached as indicated in Figure 2.4, the measured voltage across the resistor will have a positive polarity if the anodic reaction is occurring on the prestressing strand. Thus, the polarity of the measured voltage allows the direction of the electron flow to be determined, indicating whether or not the expected corrosion cell has developed.
2.4.2 Half-Cell Potential Readings
Half-cell potential readings also provide three forms of information regarding the condition of the specimen:
• The magnitude of half-cell potential readings indicate the probability of corrosion at a given location.
• The time at which corrosion initiation occurred can be determined from regular potential readings taken during testing.
• Significant half-cell potentials in the absence of macrocell corrosion currents suggest the occurrence of microcell corrosion.
Half-cell potential readings are taken every two weeks at the start of the wet period and the start of the dry period. All measurements are performed according to ASTM C87613 using a saturated calomel electrode (SCE). Three half-cell potential measurements are made manually on each specimen, as shown in Figure 2.5. One measurement is taken with the Plexiglas dam filled with NaO solution and the electrode immersed in the solution. Two measurements are taken directly on the surface of each segment with the dam empty. The surface of the concrete is damp for these readings. In all cases, electrical contact between the anode and cathode is interrupted to ensure that the half-cell potential reading is for the strand only.
13
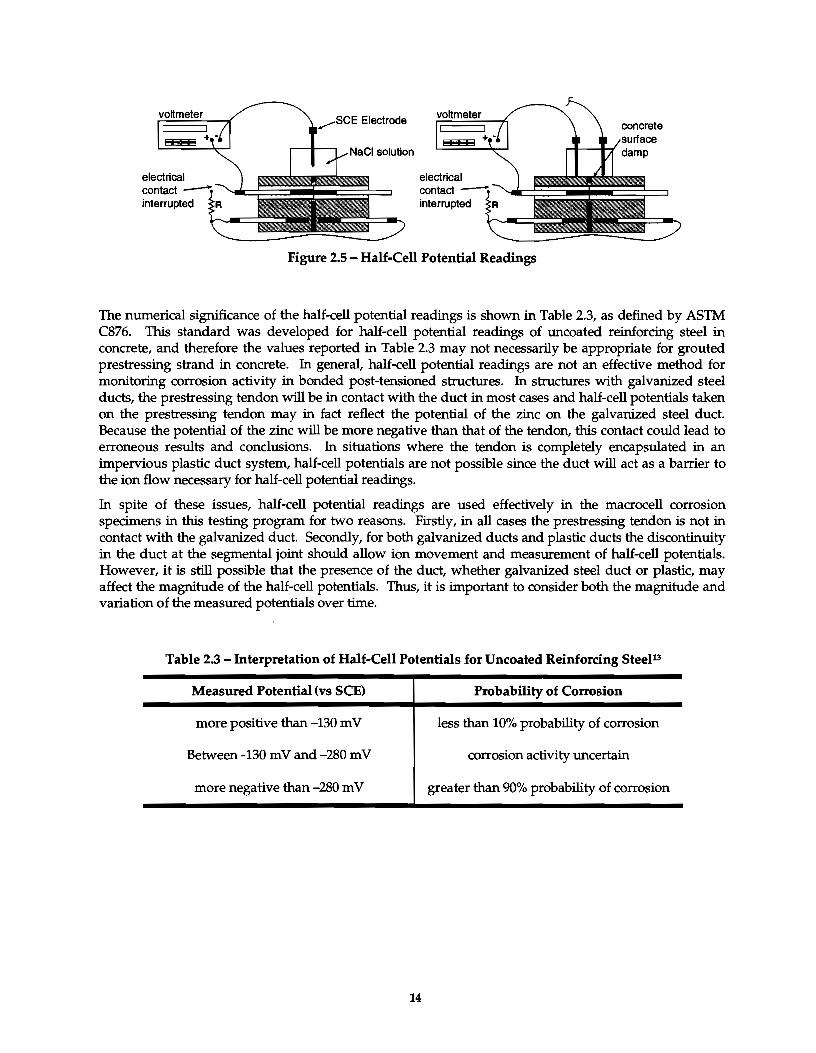
Figure 2.5 - Half-Cell Potential Readings
The numerical significance of the half-cell potential readings is shown in Table 2.3, as defined by AS1M C876. This standard was developed for half-cell potential readings of uncoated reinforcing steel in concrete, and therefore the values reported in Table 2.3 may not necessarily be appropriate for grouted prestressing strand in concrete. In general, half-cell potential readings are not an effective method for monitoring corrosion activity in bonded post-tensioned structures. In structures with galvanized steel ducts, the prestressing tendon will be in contact with the duct in most cases and half-cell potentials taken on the prestressing tendon may in fact reflect the potential of the zinc on the galvanized steel duct. Because the potential of the zinc will be more negative than that of the tendon, this contact could lead to erroneous results and conclusions. In situations where the tendon is completely encapsulated in an impervious plastic duct system, half-cell potentials are not possible since the duct will act as a barrier to the ion flow necessary for half-cell potential readings.
In spite of these issues, half-cell potential readings are used effectively in the macrocell corrosion specimens in this testing program for two reasons. Firstly, in all cases the prestressing tendon is not in contact with the galvanized duct. Secondly, for both galvanized ducts and plastic ducts the discontinuity in the duct at the segmental joint should allow ion movement and measurement of half-cell potentials. However, it is still possible that the presence of the duct, whether galvanized steel duct or plastic, may affect the magnitude of the half-cell potentials. Thus, it is important to consider both the magnitude and variation of the measured potentials over time.
Table 2.3- Interpretation of Half-Cell Potentials for Uncoated Reinforcing Steel13
Measured Potential (vs SCE) Probability of Corrosion
more positive than -130 m V less than 10% probability of corrosion
Between-130m V and-280m V corrosion activity uncertain
more negative than -280 m V greater than 90% probability of corrosion
14
Chapter 3: Exposure Test Results
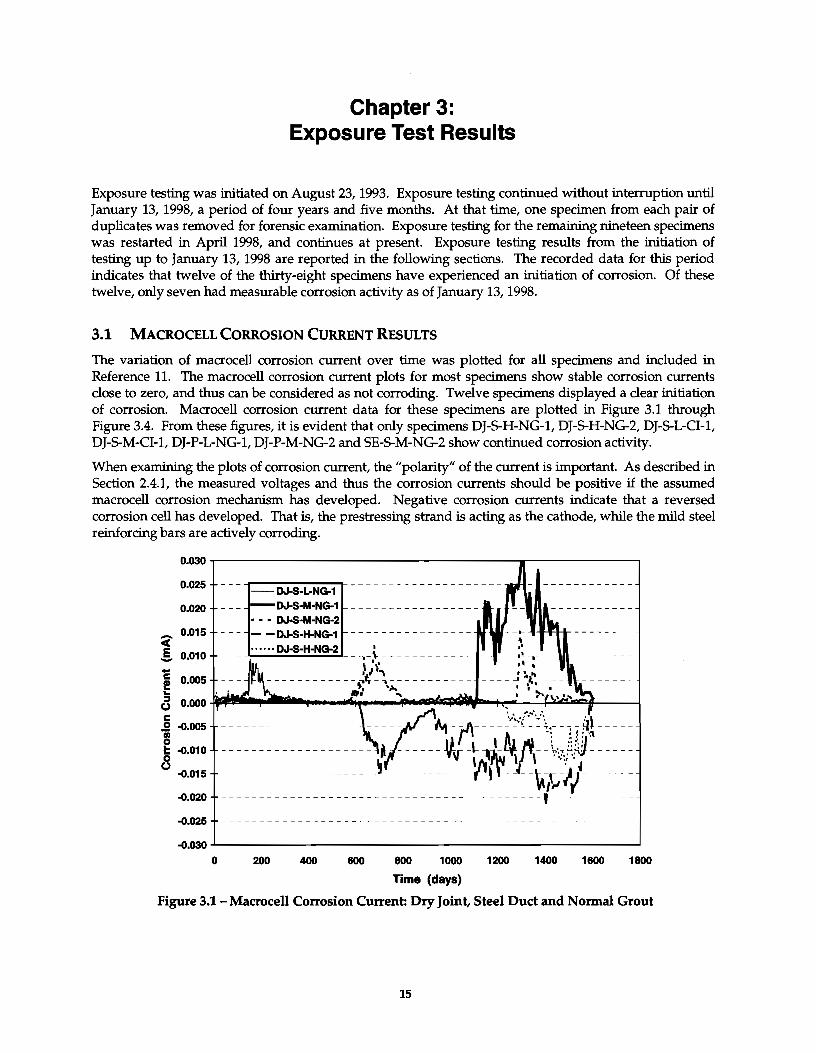
Exposure testing was initiated on August 23, 1993. Exposure testing continued without interruption until January 13, 1998, a period of four years and five months. At that time, one specimen from each pair of duplicates was removed for forensic examination. Exposure testing for the remaining nineteen specimens was restarted in April 1998, and continues at present. Exposure testing results from the initiation of testing up to January 13, 1998 are reported in the following sections. The recorded data for this period indicates that twelve of the thirty-eight specimens have experienced an initiation of corrosion. Of these twelve, only seven had measurable corrosion activity as of January 13, 1998.
3.1 MACROCELL CORROSION CURRENT RESULTS
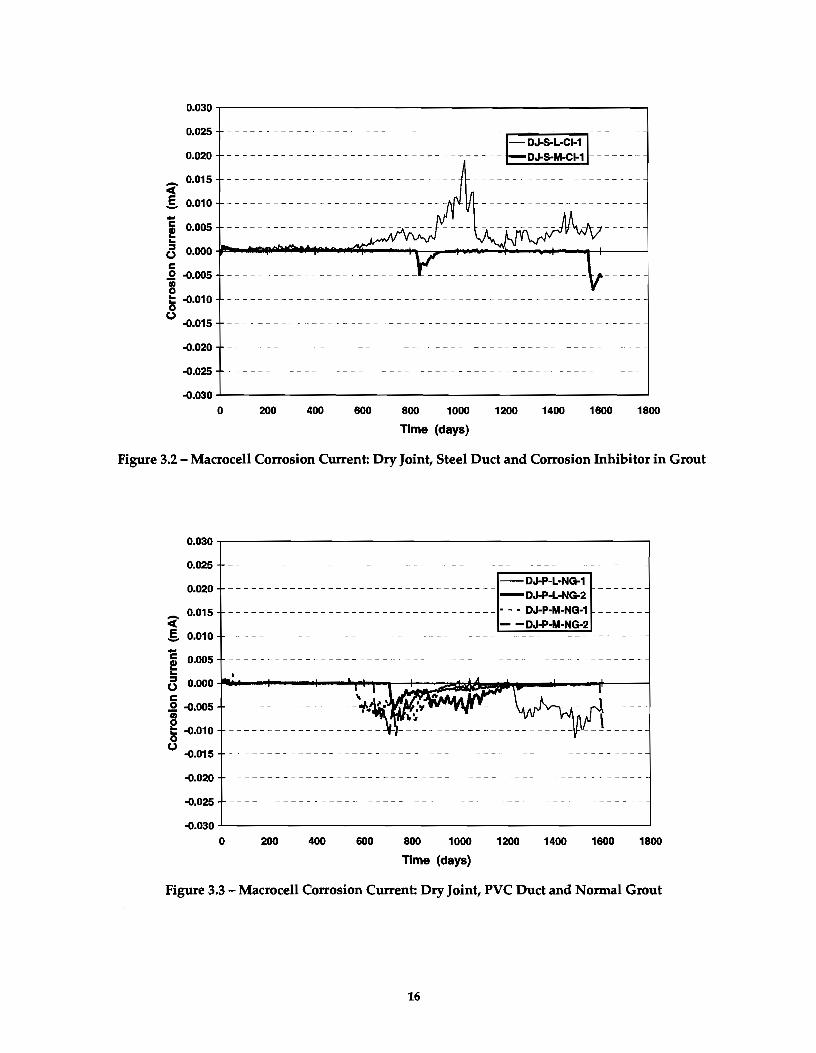
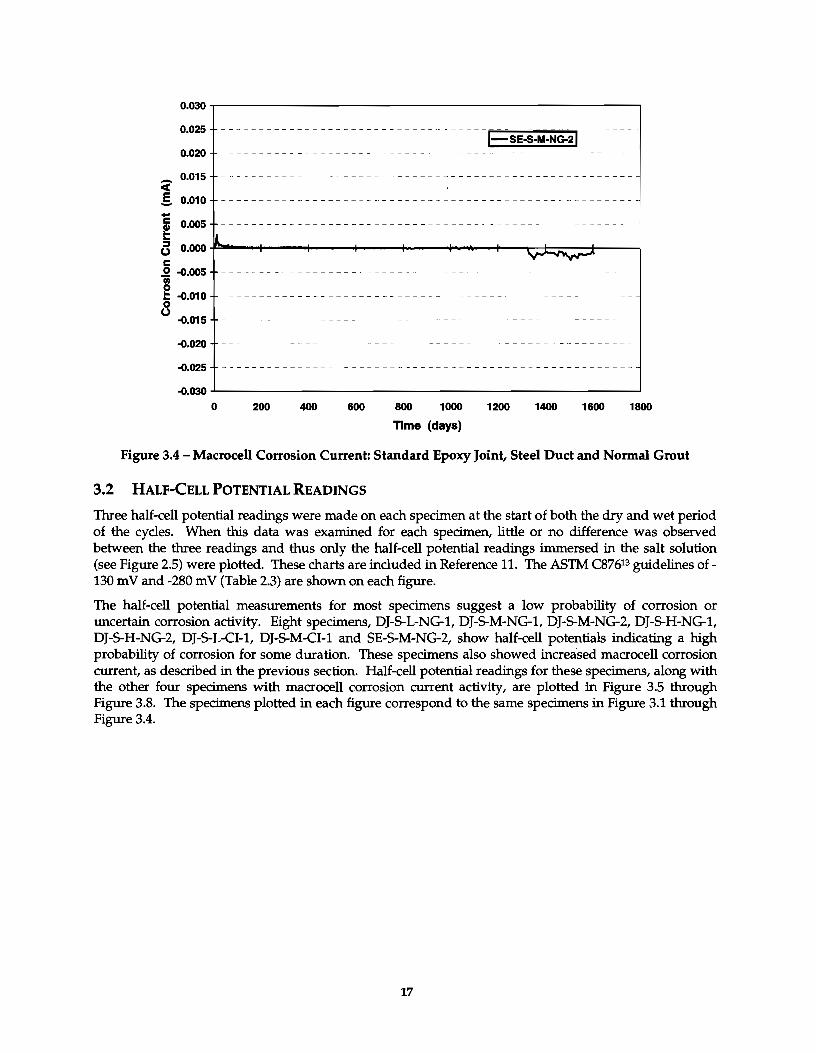
The variation of macrocell corrosion current over time was plotted for all specimens and included in Reference 11. The macrocell corrosion current plots for most specimens show stable corrosion currents close to zero, and thus can be considered as not corroding. Twelve specimens displayed a clear initiation of corrosion. Macrocell corrosion current data for these specimens are plotted in Figure 3.1 through Figure 3.4. From these figures, it is evident that only specimens DJ-5-H-NG-1, DJ-5-H-NG-2, DJ-5-L-CI-1, DJ-5-M-CI-1, DJ-P-L-NG-1, DJ-P-M-NG-2 and SE-5-M-NG-2 show continued corrosion activity.
When examining the plots of corrosion current, the "polarity" of the current is important. As described in Section 2.4.1, the measured voltages and thus the corrosion currents should be positive if the assumed macrocell corrosion mechanism has developed. Negative corrosion currents indicate that a reversed corrosion cell has developed. That is, the prestressing strand is acting as the cathode, while the mild steel reinforcing bars are actively corroding.
o.roo~----------------------------------~-------------.
0.025
0.020
..0.025 -------
~.roo~------------------------------------------------~ 0 200 400 600 800 1000
Time (days)
1200 1400 1600 1800
Figure 3.1 - Macrocell Corrosion Current: Dry Joint, Steel Duct and Normal Grout
15
0.030
0.025 - DJ-&-L-CI-1
0.020 -DJ-S·M.CI-1 ---
c 0.015
e 0.010 -... c 0.005 ! .. :I 0.000 (,) c .2 -o.oo5 co 0 I: -o.010 0
(,) -o.015
-o.020
-o.025
.0.030 0 200 400 600 800 1000 1200 1400 1600 1800
Time (days)
Figure 3.2 - Macrocell Corrosion Current: Dry Joint, Steel Duct and Corrosion Inhibitor in Grout
0.030
0.025
0.020
c 0.015
e 0.010 -... c 0.005 ! .. :I 0.000 (,) c .2 -o.oo5 8 I: .0.010 0 (,) -o.015
-o.020
-o.025
.0.030 0 200
- DJ-P-L·NG-1 ---- ----- ---- ----- -DJ-P-L-NG-2
- - - - - - - - - - - - - - - - - - - - - - • - • DJ-P·M·NG-1
400 600 800 1000
Time (days)
- -DJ-P·M·NG-2 . --
1200 1400 1600 1800
Figure 3.3- Macrocell Corrosion Current: Dry Joint, PVC Duct and Normal Grout
16
0.030.,----------------------------,
0.025 ... - - - - - - - - - - - - - -
0.020
...... 0.015 c(
g 0.010
~ 0.005
ao.ooo-r---t-----+---+----+---........ --+--t:;l:;;;;~-:::;:jt-----, c .2 ..0.005 - - - - ... -co 0 t -6.010
8 -6.015 -
-6.020
-6.025
..0.030~------------------------~
0 200 400 600 800 1000
Time (days)
1200 1400 1600 1800
Figure 3.4 - Macrocell Corrosion Current: Standard Epoxy Joint, Steel Duct and Normal Grout
3.2 HALF-CELL POTENTIAL READINGS
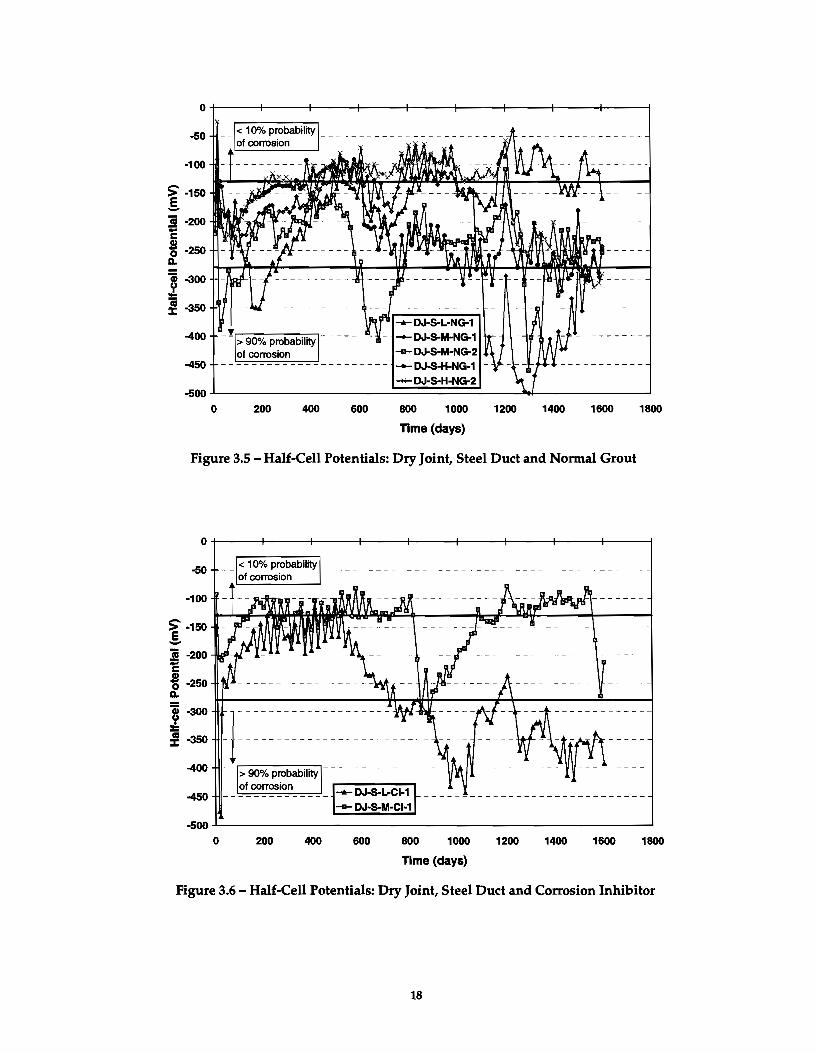
Three half-cell potential reactings were made on each specimen at the start of both the dry and wet period of the cycles. When this data was examined for each specimen, little or no difference was observed between the three reactings and thus only the half-cell potential reactings immersed in the salt solution (see Figure 2.5) were plotted. These charts are included in Reference 11. The ASTM C87613 guidelines of-130 mV and -280 mV (Table 2.3) are shown on each figure.
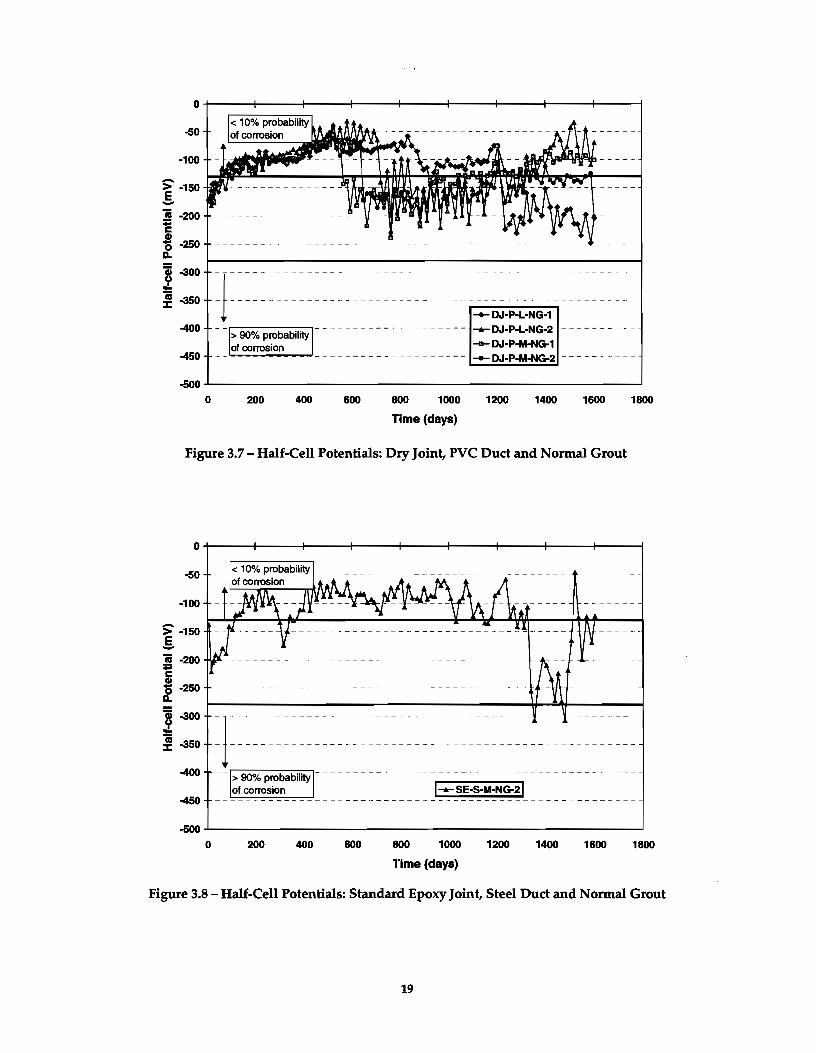
The half-cell potential measurements for most specimens suggest a low probability of corrosion or uncertain corrosion activity. Eight specimens, DJ-S-L-NG-1, DJ-S-M-NG-1, DJ-S-M-NG-2, DJ-S-H-NG-1, DJ-S-H-NG-2, DJ-S-L-CI-1, DJ-S-M-CI-1 and SE-S-M-NG-2, show half-cell potentials indicating a high probability of corrosion for some duration. These specimens also showed increased macrocell corrosion current, as described in the previous section. Half-cell potential reactings for these specimens, along with the other four specimens with macrocell corrosion current activity, are plotted in Figure 3.5 through Figure 3.8. The specimens plotted in each figure correspond to the same specimens in Figure 3.1 through Figure 3.4.
17
0+-----;------r-----+-----+----~~----~----+-----;-----~
-50
·100
-400
-450
0 200 400 600 600 1000 1200 1400 1600 1800
Time (days)
Figure 3.5- Half-Cell Potentials: Dry Joint, Steel Duct and Normal Grout
0+-----;------r-----+-----+----~~----~----+-----;-----~
-50
·100
> ·150 .5. iii ·200 ;:
i 0 ·250 a.
'-300
= :!-350 -400 ··· > 90% probability
of corrosion -450 - - '="=-=-=-=-==-=--=-='
-500~------------------------------------------------------~
0 200 400 600 800 1000 1200 1400 1600 1800
nme(days)
Figure 3.6 - Half-Cell Potentials: Dry Joint, Steel Duct and Corrosion Inhibitor
18
0+-----4-----~-----+-----+-----4~----~----+-----4-----~
-50
> ·150 .§. ti ·200
i 0 ·250 D.
I: 1--400
0
> 90% probability of corrosion
200 400 600
-+- DJ·P·L-NG·1 - - - ..,._ DJ·P·L·NG-2
-a- DJ·P·M-NG-1 - ..... DJ.P·M·NG-2 - - - - - - -
800 1000
Time (days)
1200 1400 1600
Figure 3.7- Half-Cell Potentials: Dry Joint, PVC Duct and Normal Grout
1800
0+-----4-----~-----+----~------~----+-----+-----~----~
·100
> ·150 .§. i ·200
i 0 ·250 D.
l-300
1-350
> 90% probability of corrosion
~00~------------------------------------------------------~
0 200 400 800 800 1000 1200 1400 1600 1800
Tlme(days)
Figure 3.8 - Half-Cell Potentials: Standard Epoxy Joint, Steel Duct and Normal Grout
19
3.3 ANALYSIS AND DISCUSSION OF EXPOSURE TEST RESULTS
3.3.1 Time to Initiation of Corrosion
The length of exposure before corrosion initiation is detected may be used to evaluate the effectiveness of corrosion protection variables. For the purposes of this research program, the initiation of corrosion is defined as:
a) a sudden and significant increase in measured corrosion current
and/or b) half-cell potential measurements more negative than -280 mV
and/or c) a sudden and significant change (more negative) in half-cell potential
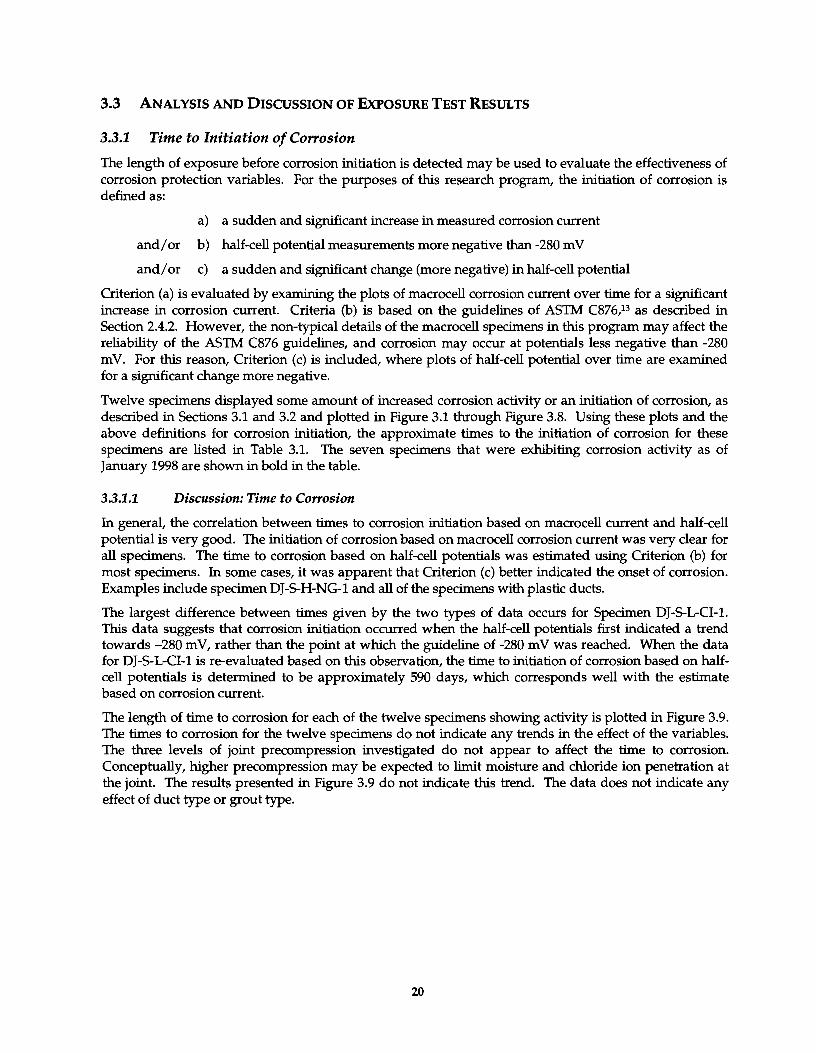
Criterion (a) is evaluated by examining the plots of macrocell corrosion current over time for a significant increase in corrosion current. Criteria (b) is based on the guidelines of ASTM C876,13 as described in Section 2.4.2. However, the non-typical details of the macrocell specimens in this program may affect the reliability of the ASTM C876 guidelines, and corrosion may occur at potentials less negative than -280 mV. For this reason, Criterion (c) is included, where plots of half-cell potential over time are examined for a significant change more negative.
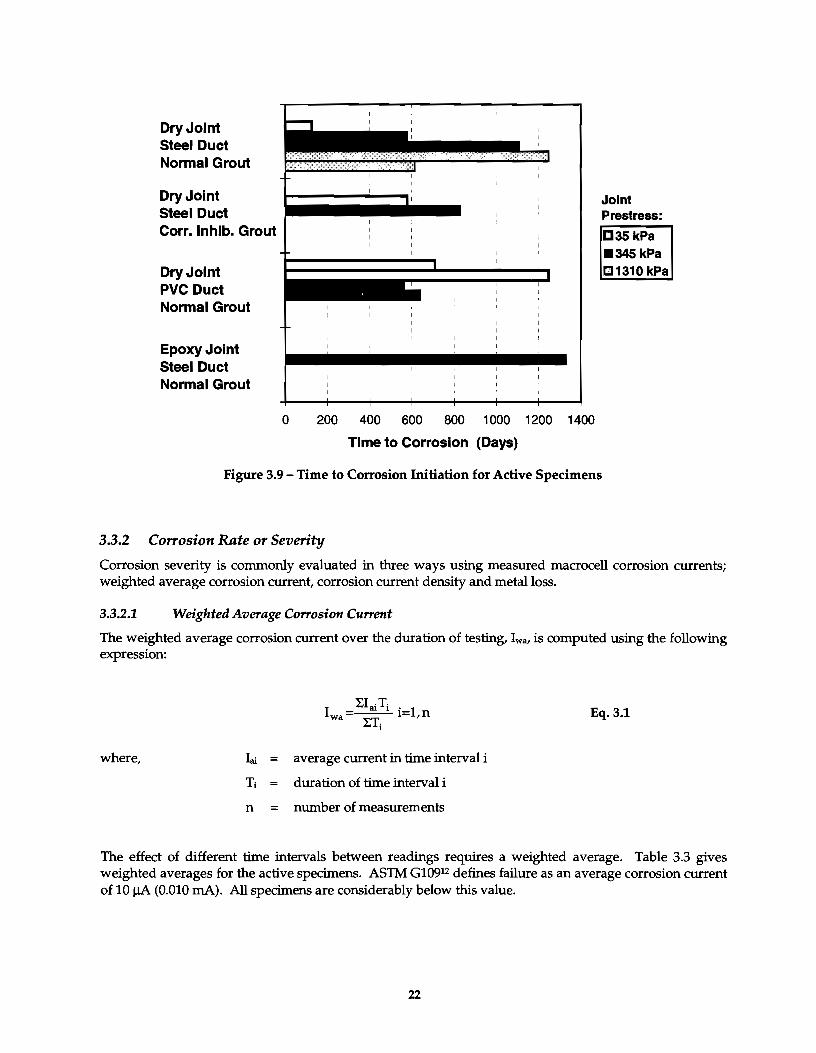
Twelve specimens displayed some amount of increased corrosion activity or an initiation of corrosion, as described in Sections 3.1 and 3.2 and plotted in Figure 3.1 through Figure 3.8. Using these plots and the above definitions for corrosion initiation, the approximate times to the initiation of corrosion for these specimens are listed in Table 3.1. The seven specimens that were exhibiting corrosion activity as of January 1998 are shown in bold in the table.
3.3.1.1 Discussion: Time to Corrosion
In general, the correlation between times to corrosion initiation based on macrocell current and half-cell potential is very good. The initiation of corrosion based on macrocell corrosion current was very clear for all specimens. The time to corrosion based on half-cell potentials was estimated using Criterion (b) for most specimens. In some cases, it was apparent that Criterion (c) better indicated the onset of corrosion. Examples include specimen DJ-S-H-NG-1 and all of the specimens with plastic ducts.
The largest difference between times given by the two types of data occurs for Specimen DJ-S-L-CI-1. This data suggests that corrosion initiation occurred when the half-cell potentials first indicated a trend towards -280 mV, rather than the point at which the guideline of -280 mV was reached. When the data for DJ-S-L-CI-1 is re-evaluated based on this observation, the time to initiation of corrosion based on halfcell potentials is determined to be approximately 590 days, which corresponds well with the estimate based on corrosion current.
The length of time to corrosion for each of the twelve specimens showing activity is plotted in Figure 3.9. The times to corrosion for the twelve specimens do not indicate any trends in the effect of the variables. The three levels of joint precompression investigated do not appear to affect the time to corrosion. Conceptually, higher precompression may be expected to limit moisture and chloride ion penetration at the joint. The results presented in Figure 3.9 do not indicate this trend. The data does not indicate any effect of duct type or grout type.
20
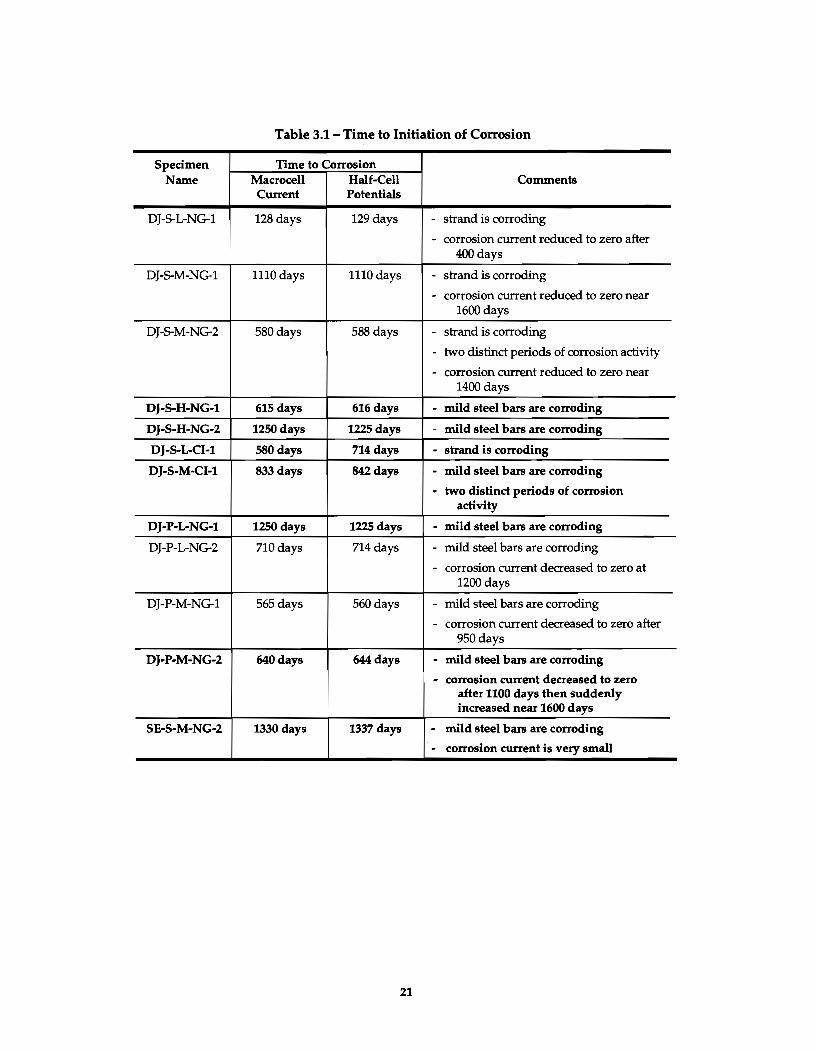
Table 3.1- Time to Initiation of Corrosion
Specimen Time to Corrosion Name Macrocell Half .Cell Comments
Current Potentials
DJ-5-L-NG-1 128 days 129 days - strand is corroding
- corrosion current reduced to zero after 400days
DJ-5-M-NG-1 1110days 1110days - strand is corroding
- corrosion current reduced to zero near 1600 days
DJ-5-M-NG-2 580days 588 days - strand is corroding
- two distinct periods of corrosion activity
- corrosion current reduced to zero near 1400days
DJ·S·H-NG-1 615 days 616days - mild steel bars are corroding
DJ-S-H-NG-2 1250days 1225days - mild steel bars are corroding
DJ·S-L..CI-1 580 days 714days - strand is corroding
DJ-S-M..CI-1 833 days 842days • mild steel bars are corroding
• two distinct periods of corrosion activity
DJ-P-L-NG-1 1250 days I 1225 days - mild steel bars are corroding
DJ-P-L-NG-2 710days 714 days - mild steel bars are corroding
- corrosion current decreased to zero at 1200days
DJ-P-M-NG-1 565 days 560days - mild steel bars are corroding
- corrosion current decreased to zero after 950days
DJ·P·M-NG-2 640days 644days • mild steel bars are corroding
• corrosion current decreased to zero after 1100 days then suddenly increased near 1600 days
SE·S-M-NG-2 1330days 1337 days - mild steel bars are corroding
- corrosion current is very small
21
Dry Joint Steel Duct Normal Grout
Dry Joint Steel Duct Corr. lnhib. Grout
Dry Joint PVC Duct Normal Grout
Epoxy Joint Steel Duct Normal Grout
0 200 400 600 800 1000 1200 1400
Time to Corrosion (Days)
Joint Prestress:
1:::135 kPa •345 kPa []1310 kPa
Figure 3.9 -Time to Corrosion Initiation for Active Specimens
3.3.2 Corrosion Rate or Severity
Corrosion severity is commonly evaluated in three ways using measured macrocell corrosion currents; weighted average corrosion current, corrosion current density and metal loss.
3.3.2.1 Weighted Average Corrosion Current
The weighted average corrosion current over the duration of testing, lw2J is computed using the following expression:
where, Lu = average current in time interval i
Ti duration of time interval i
n = number of measurements
Eq. 3.1
The effect of different time intervals between readings requires a weighted average. Table 3.3 gives weighted averages for the active specimens. ASTM G10912 defines failure as an average corrosion current of 10 J.lA (0.010 rnA). All specimens are considerably below this value.
22
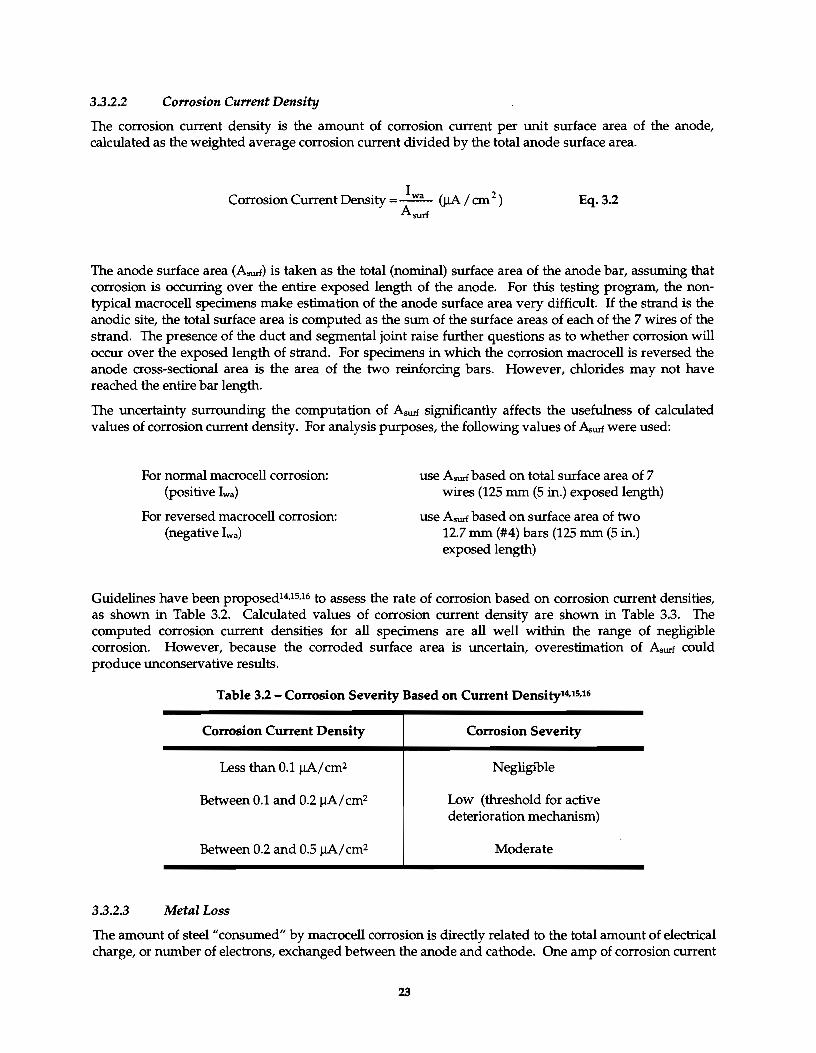
3.3.2.2 Corrosion Current Density
The corrosion current density is the amount of corrosion current per unit surface area of the anode, calculated as the weighted average corrosion current divided by the total anode surface area.
Corrosion Current Density=~ (Jl.A I em 2 ) Asurt
Eq. 3.2
The anode surface area (Asurt) is taken as the total (nominal) surface area of the anode bar, assuming that corrosion is occurring over the entire exposed length of the anode. For this testing program, the nontypical macrocell specimens make estimation of the anode surface area very difficult. If the strand is the anodic site, the total surface area is computed as the sum of the surface areas of each of the 7 wires of the strand. The presence of the duct and segmental joint raise further questions as to whether corrosion will occur over the exposed length of strand. For specimens in which the corrosion macrocell is reversed the anode cross-sectional area is the area of the two reinforcing bars. However, chlorides may not have reached the entire bar length.
The uncertainty surrounding the computation of Asurt significantly affects the usefulness of calculated values of corrosion current density. For analysis purposes, the following values of Asurt were used:
For normal macrocell corrosion: (positive Iwa)
For reversed macrocell corrosion: (negative Iwa)
use Asurt based on total surface area of 7 wires (125 mm (5 in.) exposed length)
use Asurt based on surface area of two 12.7 mm (#4) bars (125 mm (5 in.) exposed length)
Guidelines have been proposed14•15.16 to assess the rate of corrosion based on corrosion current densities, as shown in Table 3.2. Calculated values of corrosion current density are shown in Table 3.3. The computed corrosion current densities for all specimens are all well within the range of negligible corrosion. However, because the corroded surface area is uncertain, overestimation of Asurt could produce unconservative results.
3.3.2.3
Table 3.2 -Corrosion Severity Based on Current Densityt4.tS,t6
Corrosion Current Density
Less than 0.1 Jl.A/ cm2
Between 0.1 and 0.2 Jl.A/ cm2
Between 0.2 and 0.5 Jl.A/ cm2
Metal Loss
Corrosion Severity
Negligible
Low (threshold for active deterioration mechanism)
Moderate
The amount of steel "consumed" by macrocell corrosion is directly related to the total amount of electrical charge, or number of electrons, exchanged between the anode and cathode. One amp of corrosion current
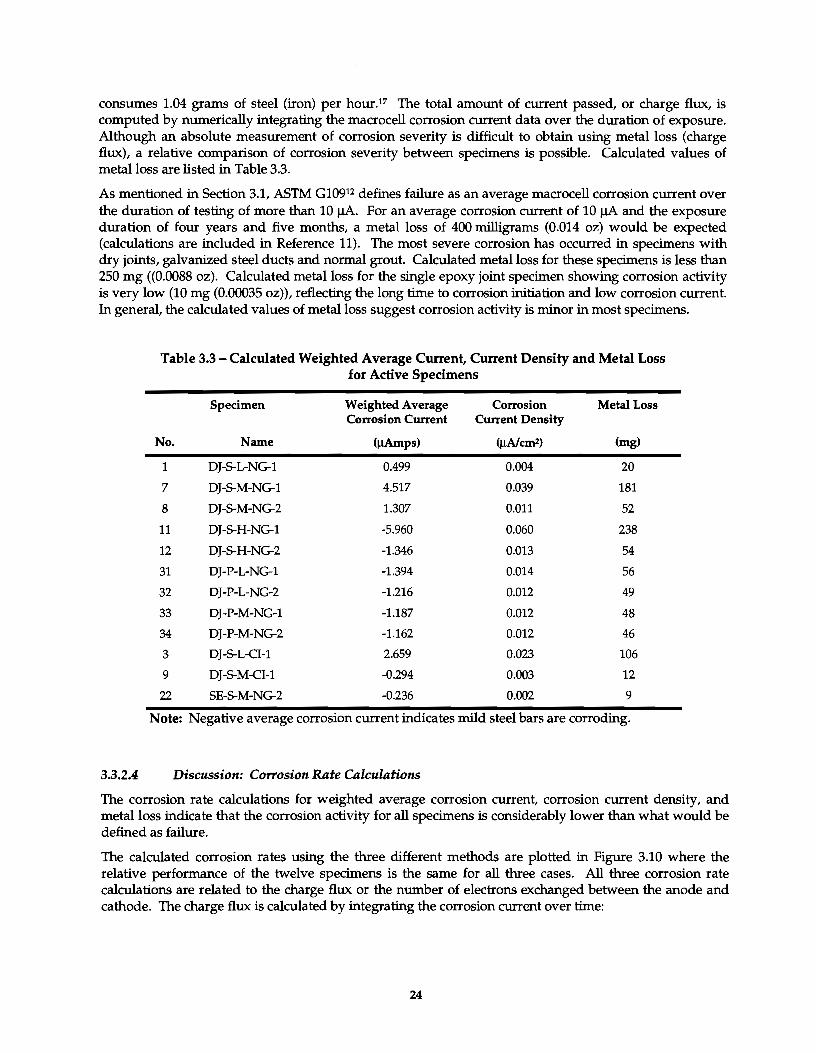
consumes 1.04 grams of steel (iron) per hourP The total amount of current passed, or charge flux, is computed by numerically integrating the macrocell corrosion current data over the duration of exposure. Although an absolute measurement of corrosion severity is difficult to obtain using metal loss (charge flux), a relative comparison of corrosion severity between specimens is possible. Calculated values of metal loss are listed in Table 3.3.
As mentioned in Section 3.1, ASTM G10912 defines failure as an average macrocell corrosion current over the duration of testing of more than 10 )JA. For an average corrosion current of 10 )JA and the exposure duration of four years and five months, a metal loss of 400 milligrams (0.014 oz) would be expected (calculations are included in Reference 11). The most severe corrosion has occurred in specimens with dry joints, galvanized steel ducts and normal grout. Calculated metal loss for these specimens is less than 250 mg ((0.0088 oz). Calculated metal loss for the single epoxy joint specimen showing corrosion activity is very low (10 mg (0.00035 oz)), reflecting the long time to corrosion initiation and low corrosion current. In general, the calculated values of metal loss suggest corrosion activity is minor in most specimens.
Table 3.3- Calculated Weighted Average Current, Current Density and Metal Loss for Active Specimens
Specimen Weighted Average Corrosion Metal Loss Corrosion Current Current Density
No. Name (JlAmps) (JlA/cm2) (mg)
1 DJ-5-L-NG-1 0.499 0.004 20
7 DJ-5-M-NG-1 4.517 0.039 181
8 DJ-5-M-NG-2 1.307 0.011 52
11 DJ-5-H-NG-1 -5.960 0.060 238
12 DJ-5-H-NG-2 -1.346 0.013 54
31 DJ-P-L-NG-1 -1.394 0.014 56
32 DJ-P-L-NG-2 -1.216 0.012 49
33 DJ-P-M-NG-1 -1.187 0.012 48
34 DJ-P-M-NG-2 -1.162 0.012 46
3 DJ-5-L-Q-1 2.659 0.023 106
9 DJ-5-M-CI-1 -0.294 0.003 12
22 SE-5-M-NG-2 -0.236 0.002 9
Note: Negative average corrosion current indicates mild steel bars are corroding.
3.3.2.4 Discussion: Corrosion Rate Calculations
The corrosion rate calculations for weighted average corrosion current, corrosion current density, and metal loss indicate that the corrosion activity for all specimens is considerably lower than what would be defined as failure.
The calculated corrosion rates using the three different methods are plotted in Figure 3.10 where the relative performance of the twelve specimens is the same for all three cases. All three corrosion rate calculations are related to the charge flux or the number of electrons exchanged between the anode and cathode. The charge flux is calculated by integrating the corrosion current over time:
24
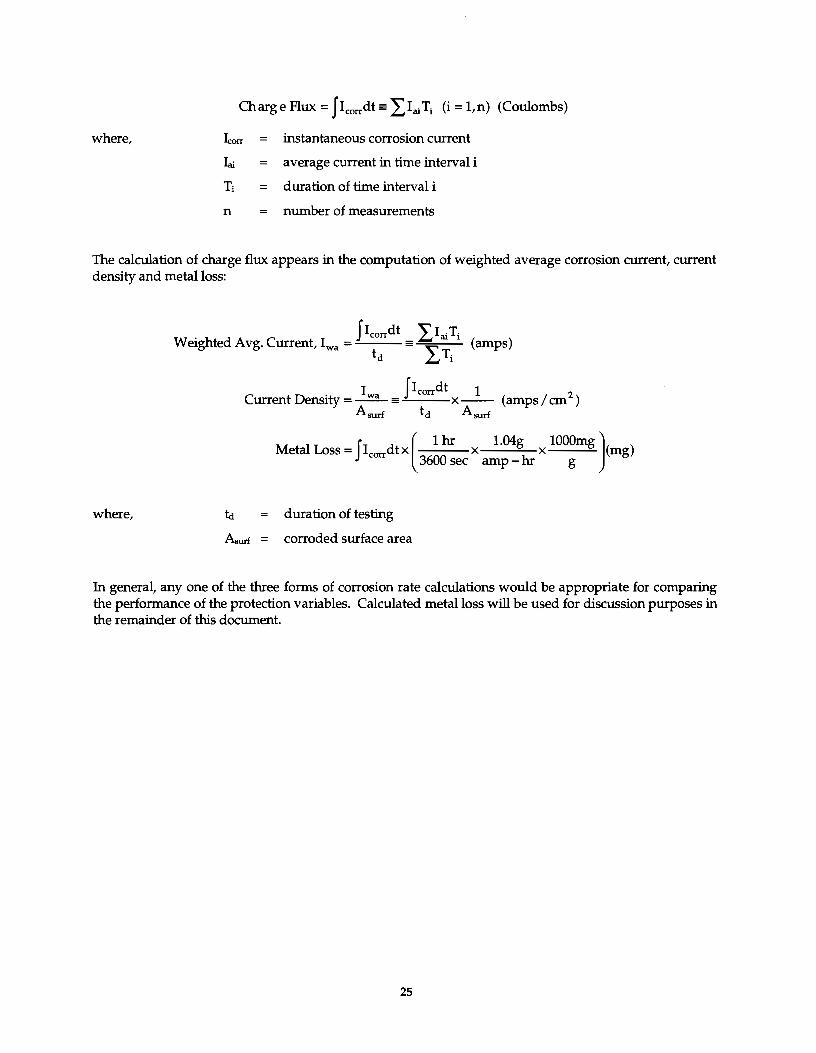
Charge Flux = J Icorrdt = ~Iai Ti (i = l,n) (Coulombs)
where, instantaneous corrosion current
Lu average current in time interval i
T; = duration of time interval i
n number of measurements
The calculation of charge flux appears in the computation of weighted average corrosion current, current density and metal loss:
Jicorrdt ~I ·T Weighted Avg. Current, Iwa = = ~ m
1 (amps)
td Ti
Metal Loss= Icorrdtx x X (mg) J ( 1 hr 1.04g lOOOmg)
3600 sec amp - hr g
where, t:t = duration of testing
A..un = corroded surface area
In general, any one of the three forms of corrosion rate calculations would be appropriate for comparing the performance of the protection variables. Calculated metal loss will be used for discussion purposes in the remainder of this document.
25
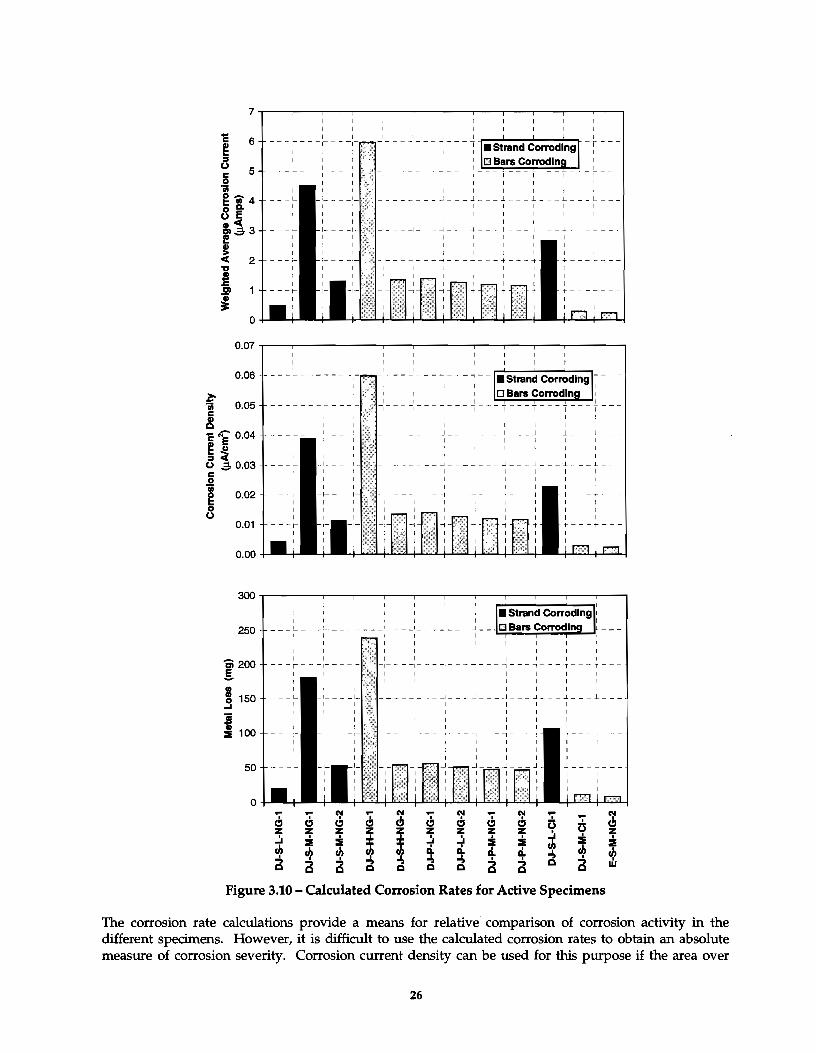
f 0.05 c: g 'E ~ 0.04 ~ u
al o.os i • 0.02 g 0 0
O.Q1
0.00
300
250 L __ _\_- _I_--
'6i200 I -, -,- .l-- --T
.! I I I I I I
I I I
150 J ..l _J
..3 I I I
ii I
1100 ----, I
50 -- l.
0 .... ...
~ ....
~ .... N ...
~ ...
";' f:'l I c; I I I I .I. CJ CJ CJ CJ CJ 0 (3 CJ z z z ::If ::If z z z z ..:. z ..:. I I ..:. ..:. I :1!
I I
:& :& :z::
~ :& ~
:& :& ~ fh ~ ~ ci.. ci.. ci.. ci.. ~ ~ I I ., ., I a ., ., I I
Q ., ., a a w Q Q Q Q Q Q Q
Figure 3.10- Calculated Corrosion Rates for Active Specimens
The corrosion rate calculations provide a means for relative comparison of corrosion activity in the different specimens. However, it is difficult to use the calculated corrosion rates to obtain an absolute measure of corrosion severity. Corrosion current density can be used for this purpose if the area over
26

which corrosion is occurring is known. The non-typical details of the segmental macrocells make estimation of the corroded surface area uncertain at best, and thus the use of corrosion current density to assign a corrosion severity using Table 3.2 is questionable for this testing program.
The effect of the different variables (other than joint type) is not clear based on the calculated corrosion rates (Figure 3.10). Similar to the time to corrosion data, computed values of metal loss do not indicate improved corrosion protection for the three levels of joint precompression. Also, the effect of duct type and grout type is unclear.
27

28
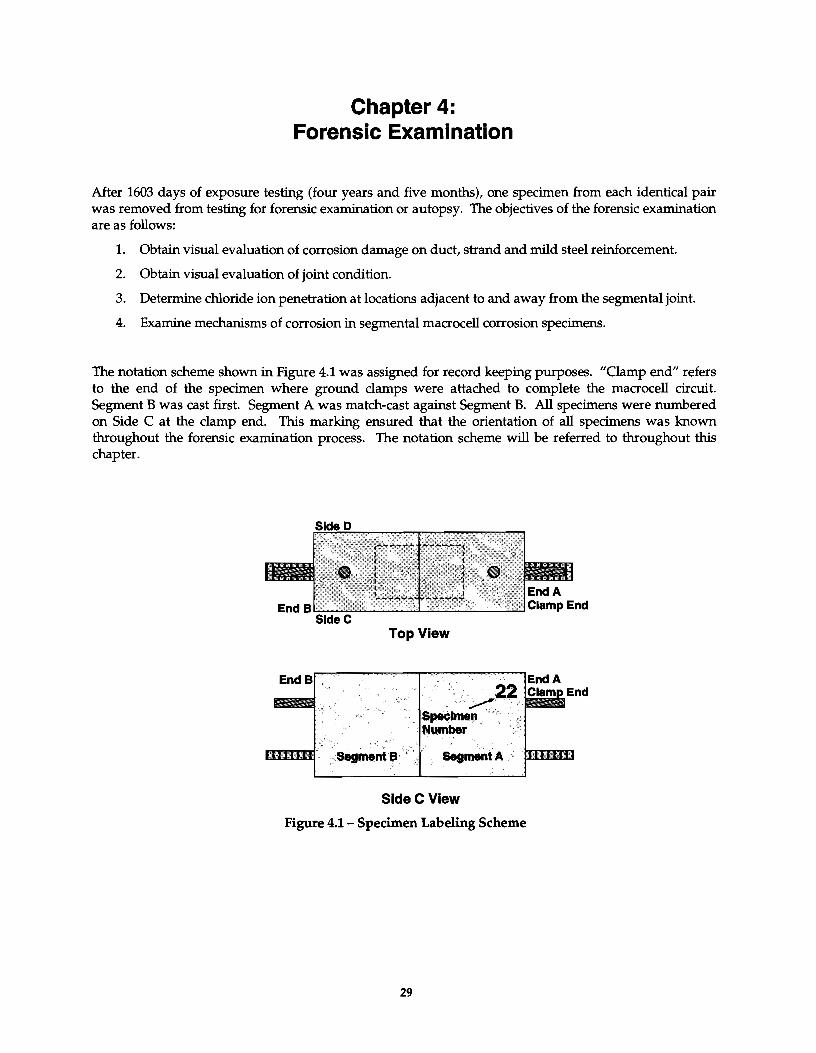
Chapter 4: Forensic Examination
After 1603 days of exposure testing (four years and five months), one specimen from each identical pair was removed from testing for forensic examination or autopsy. The objectives of the forensic examination are as follows:
1. Obtain visual evaluation of corrosion damage on duct, strand and mild steel reinforcement.
2. Obtain visual evaluation of joint condition.
3. Determine chloride ion penetration at locations adjacent to and away from the segmental joint.
4. Examine mechanisms of corrosion in segmental macrocell corrosion specimens.
The notation scheme shown in Figure 4.1 was assigned for record keeping purposes. "Clamp end" refers to the end of the specimen where ground clamps were attached to complete the macrocell circuit. Segment B was cast first. Segment A was match-cast against Segment B. All specimens were numbered on Side C at the clamp end. This marking ensured that the orientation of all specimens was known throughout the forensic examination process. The notation scheme will be referred to throughout this chapter.
Top View
SldeC VIew
Figure 4.1- Specimen Labeling Scheme
29

4.1 PROCEDURE
4.1.1 Specimen Condition at End of Testing
The exterior surfaces of each specimen were examined for cracking and rust staining upon removal from testing. Duct ends were examined for grout voids and rust stains. The joint perimeter was examined for visible salt stains, joint epoxy and grout.
4.1.2 Concrete Powder Samples for Chloride Analysis
One of the objectives of the forensic examination is to determine the influence of the three joint types on the penetration of moisture and chlorides. It was expected that chloride contents could be higher in the vicinity of the joint, particularly for dry joint specimens. To examine the influence of joint type on chloride penetration, concrete powder samples were collected at multiple depths and locations to determine chloride ion profiles adjacent to the joint and away from the joint. Sample locations are shown in Figure 4.2. Concrete powder samples were collected using a rotary hammer and following a procedure based on AASHTO T 260-94.18 Two 1.5 g samples were collected at each depth. Samples were analyzed for add soluble chlorides using a specific ion probe (CL Test System by James Instruments).
Plan View
6 mm13 mm 6 mm 13 mm
Chloride Sample Depths at A and C
Chloride Sample Depths at B
Figure 4.2 - Chloride Sample Locations
30
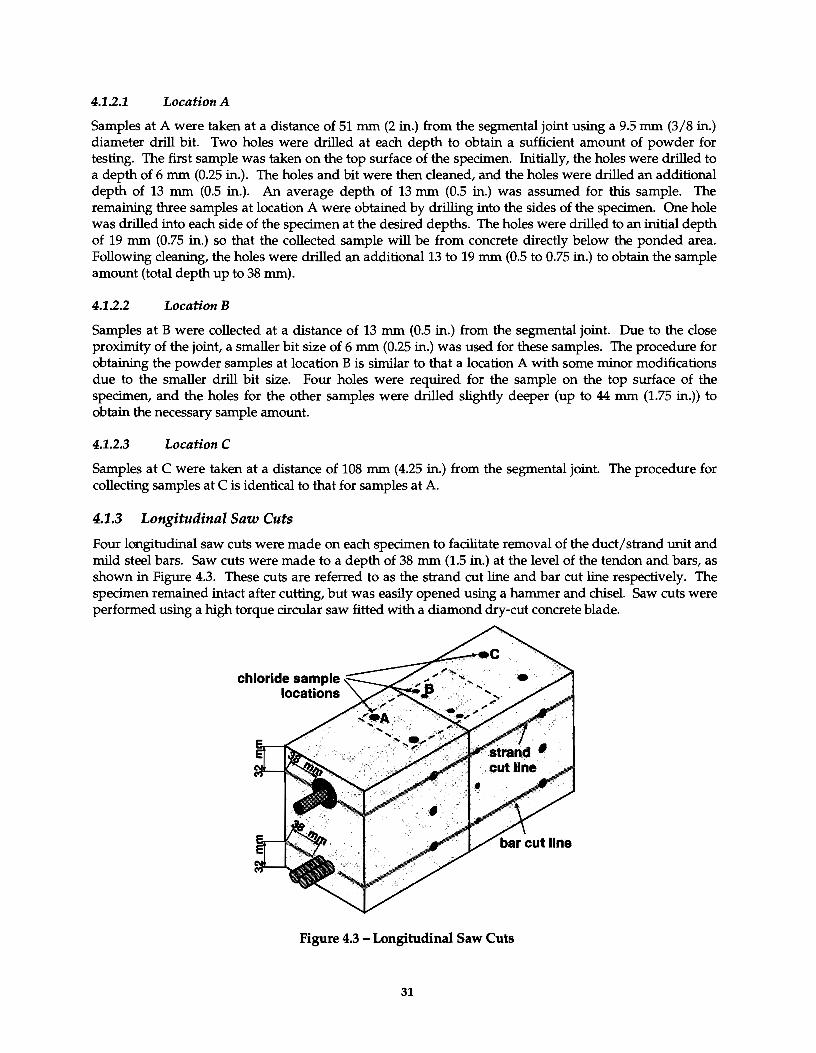
4.1.2.1 Location A
Samples at A were taken at a distance of 51 mm (2 in.) from the segmental joint using a 9.5 mm (3/8 in.) diameter drill bit. Two holes were drilled at each depth to obtain a sufficient amount of powder for testing. The first sample was taken on the top surface of the specimen. Initially, the holes were drilled to a depth of 6 mm (0.25 in.). The holes and bit were then cleaned, and the holes were drilled an additional depth of 13 mm (0.5 in.). An average depth of 13 mm (0.5 in.) was assumed for this sample. The remaining three samples at location A were obtained by drilling into the sides of the specimen. One hole was drilled into each side of the specimen at the desired depths. The holes were drilled to an initial depth of 19 mm (0.75 in.) so that the collected sample will be from concrete directly below the ponded area. Following cleaning, the holes were drilled an additional13 to 19 mm (0.5 to 0.75 in.) to obtain the sample amount (total depth up to 38 mm).
4.1.2.2 Location B
Samples at B were collected at a distance of 13 mm (0.5 in.) from the segmental joint. Due to the close proximity of the joint, a smaller bit size of 6 mm (0.25 in.) was used for these samples. The procedure for obtaining the powder samples at location B is similar to that a location A with some minor modifications due to the smaller drill bit size. Four holes were required for the sample on the top surface of the specimen, and the holes for the other samples were drilled slightly deeper (up to 44 mm (1.75 in.)) to obtain the necessary sample amount.
4.1.2.3 Location C
Samples at C were taken at a distance of 108 mm (4.25 in.) from the segmental joint. The procedure for collecting samples at C is identical to that for samples at A.
4.1.3 Longitudinal Saw Cuts
Four longitudinal saw cuts were made on each specimen to facilitate removal of the duct/strand unit and mild steel bars. Saw cuts were made to a depth of 38 mm (1.5 in.) at the level of the tendon and bars, as shown in Figure 4.3. These cuts are referred to as the strand cut line and bar cut line respectively. The specimen remained intact after cutting, but was easily opened using a hammer and chisel. Saw cuts were performed using a high torque circular saw fitted with a diamond dry-cut concrete blade.
chloride sample locations
Figure 4.3 -Longitudinal Saw Cuts
31
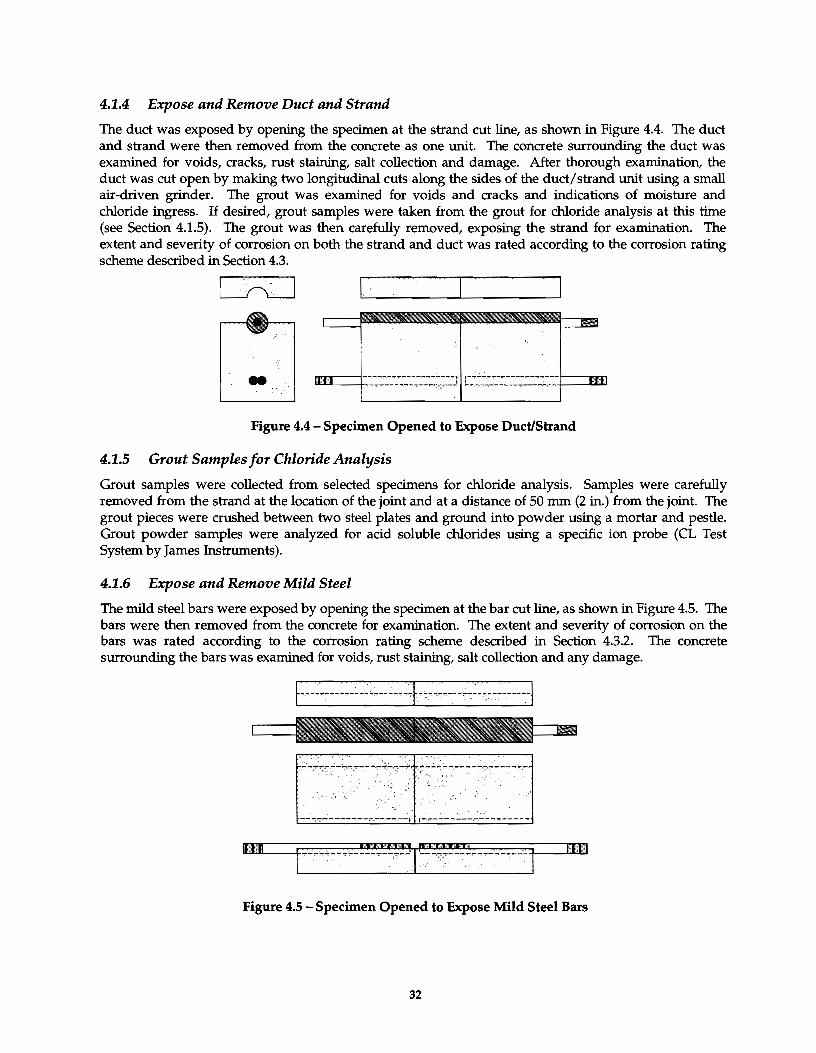
4.1.4 Expose and Remove Duct and Strand
The duct was exposed by opening the specimen at the strand cut line, as shown in Figure 4.4. The duct and strand were then removed from the concrete as one unit. The concrete surrounding the duct was examined for voids, cracks, rust staining, salt collection and damage. After thorough examination, the duct was cut open by making two longitudinal cuts along the sides of the duct/ strand unit using a small air-driven grinder. The grout was examined for voids and cracks and indications of moisture and chloride ingress. If desired, grout samples were taken from the grout for chloride analysis at this time (see Section 4.1.5). The grout was then carefully removed, exposing the strand for examination. The extent and severity of corrosion on both the strand and duct was rated according to the corrosion rating scheme described in Section 4.3.
1!1'1.1 -_-_-_-:_-:_-_-_-_-:_-_-_-_-_-_-_-_-] l---:~------~-:_-_-_-:~-:_-_-:_-_- ll~l
Figure 4.4 - Specimen Opened to Expose Duct/Strand
4.1.5 Grout Samples for Chloride Analysis
Grout samples were collected from selected specimens for chloride analysis. Samples were carefully removed from the strand at the location of the joint and at a distance of 50 mm (2 in.) from the joint. The grout pieces were crushed between two steel plates and ground into powder using a mortar and pestle. Grout powder samples were analyzed for acid soluble chlorides using a specific ion probe (CL Test System by James Instruments).
4.1.6 Expose and Remove Mild Steel
The mild steel bars were exposed by opening the specimen at the bar cut line, as shown in Figure 4.5. The bars were then removed from the concrete for examination. The extent and severity of corrosion on the bars was rated according to the corrosion rating scheme described in Section 4.3.2. The concrete surrounding the bars was examined for voids, rust staining, salt collection and any damage.
II II
Figure 4.5 - Specimen Opened to Expose Mild Steel Bars
32
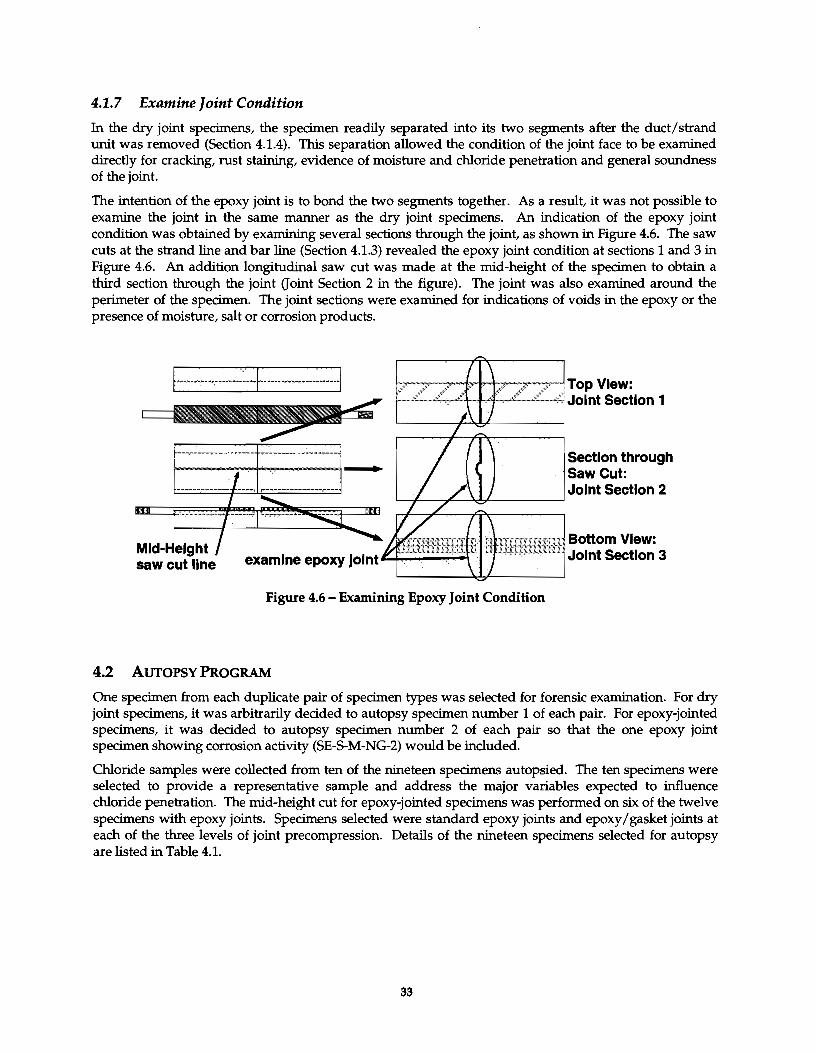
4.1.7 Examine ]oint Condition
fu the dry joint specimens, the specimen readily separated into its two segments after the duct/ strand unit was removed (Section 4.1.4). This separation allowed the condition of the joint face to be examined directly for cracking, rust staining, evidence of moisture and chloride penetration and general soundness of the joint.
The intention of the epoxy joint is to bond the two segments together. As a result, it was not possible to examine the joint in the same manner as the dry joint specimens. An indication of the epoxy joint condition was obtained by examining several sections through the joint, as shown in Figure 4.6. The saw cuts at the strand line and bar line (Section 4.1.3) revealed the epoxy joint condition at sections 1 and 3 in Figure 4.6. An addition longitudinal saw cut was made at the mid-height of the specimen to obtain a third section through the joint Goint Section 2 in the figure). The joint was also examined around the perimeter of the specimen. The joint sections were examined for indications of voids in the epoxy or the presence of moisture, salt or corrosion products.
Figure 4.6 -Examining Epoxy Joint Condition
4.2 AUTOPSY PROGRAM
Top VIew: Joint Section 1
Section through Saw Cut: Joint Section 2
Bottom View: Joint Section 3
One specimen from each duplicate pair of specimen types was selected for forensic examination. For dry joint specimens, it was arbitrarily decided to autopsy specimen number 1 of each pair. For epoxy-jointed specimens, it was decided to autopsy specimen number 2 of each pair so that the one epoxy joint specimen showing corrosion activity (SE-5-M-NG-2) would be included.
Chloride samples were collected from ten of the nineteen specimens autopsied. The ten specimens were selected to provide a representative sample and address the major variables expected to influence chloride penetration. The mid-height cut for epoxy-jointed specimens was performed on six of the twelve specimens with epoxy joints. Specimens selected were standard epoxy joints and epoxy I gasket joints at each of the three levels of joint precompression. Details of the nineteen specimens selected for autopsy are listed in Table 4.1.
33
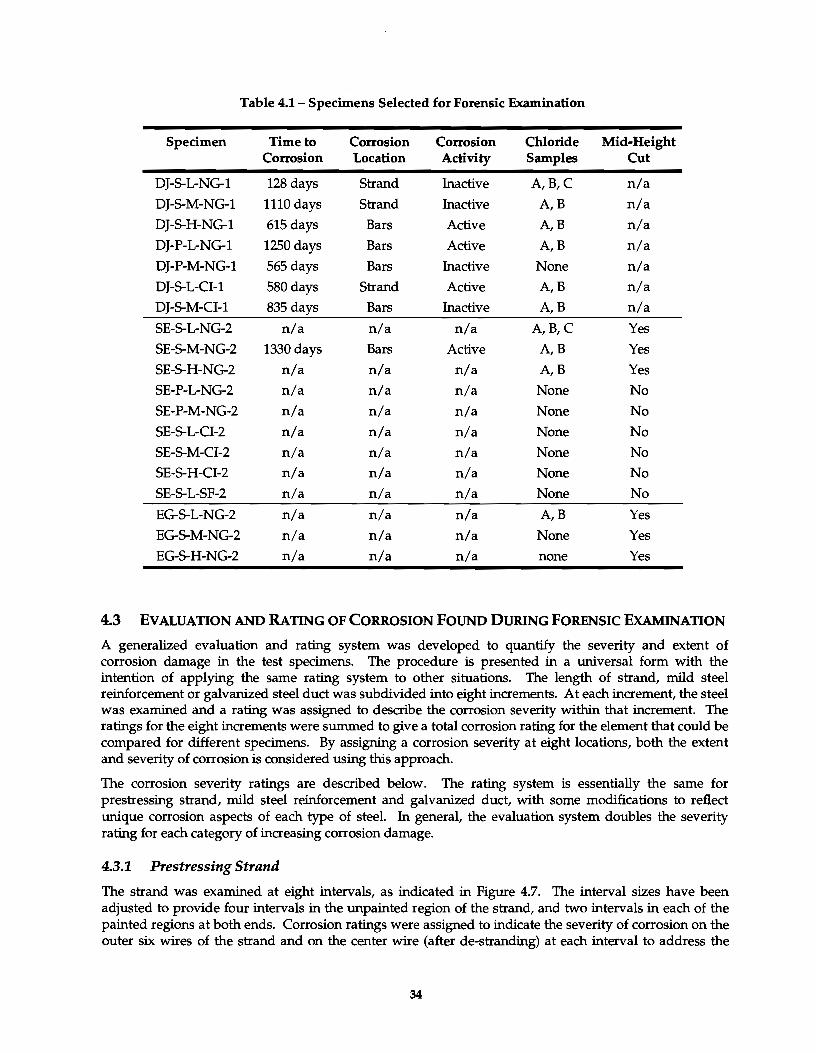
Table 4.1- Specimens Selected for Forensic Examination
Specimen Time to Corrosion Corrosion Chloride Mid-Height Corrosion Location Activity Samples Cut
DJ-5-L-NG-1 128 days Strand Inactive A,B,C n/a
DJ-5-M-NG-1 1110days Strand Inactive A,B n/a
DJ-5-H-NG-1 615 days Bars Active A,B n/a
DJ-P-L-NG-1 1250days Bars Active A,B n/a
DJ-P-M-NG-1 565 days Bars Inactive None n/a
DJ-5-L-CI-1 580 days Strand Active A,B n/a
DJ-5-M-CI-1 835 days Bars Inactive A,B n/a
SE-5-L-NG-2 n/a n/a n/a A,B, C Yes
SE-5-M-NG-2 1330days Bars Active A,B Yes
SE-5-H-NG-2 n/a n/a n/a A, B Yes
SE-P-L-NG-2 n/a n/a n/a None No
SE-P-M-NG-2 n/a n/a n/a None No
SE-5-L-CI-2 n/a n/a n/a None No
SE-5-M-CI-2 n/a n/a n/a None No
SE-5-H-CI-2 n/a n/a n/a None No
SE-5-L-SF-2 n/a n/a n/a None No
EG-5-L-NG-2 n/a n/a n/a A,B Yes
EG-5-M-NG-2 n/a n/a n/a None Yes
EG-5-H-NG-2 n/a n/a n/a none Yes
4.3 EvALUATION AND RATING OF CORROSION FOUND DURING FORENSIC EXAMINATION
A generalized evaluation and rating system was developed to quantify the severity and extent of corrosion damage in the test specimens. The procedure is presented in a universal form with the intention of applying the same rating system to other situations. The length of strand, mild steel reinforcement or galvanized steel duct was subdivided into eight increments. At each increment, the steel was examined and a rating was assigned to describe the corrosion severity within that increment. The ratings for the eight increments were summed to give a total corrosion rating for the element that could be compared for different specimens. By assigning a corrosion severity at eight locations, both the extent and severity of corrosion is considered using this approach.
The corrosion severity ratings are described below. The rating system is essentially the same for prestressing strand, mild steel reinforcement and galvanized duct, with some modifications to reflect unique corrosion aspects of each type of steel. In general, the evaluation system doubles the severity rating for each category of increasing corrosion damage.
4.3.1 Prestressing Strand
The strand was examined at eight intervals, as indicated in Figure 4.7. The interval sizes have been adjusted to provide four intervals in the unpainted region of the strand, and two intervals in each of the painted regions at both ends. Corrosion ratings were assigned to indicate the severity of corrosion on the outer six wires of the strand and on the center wire (after de-stranding) at each interval to address the
34
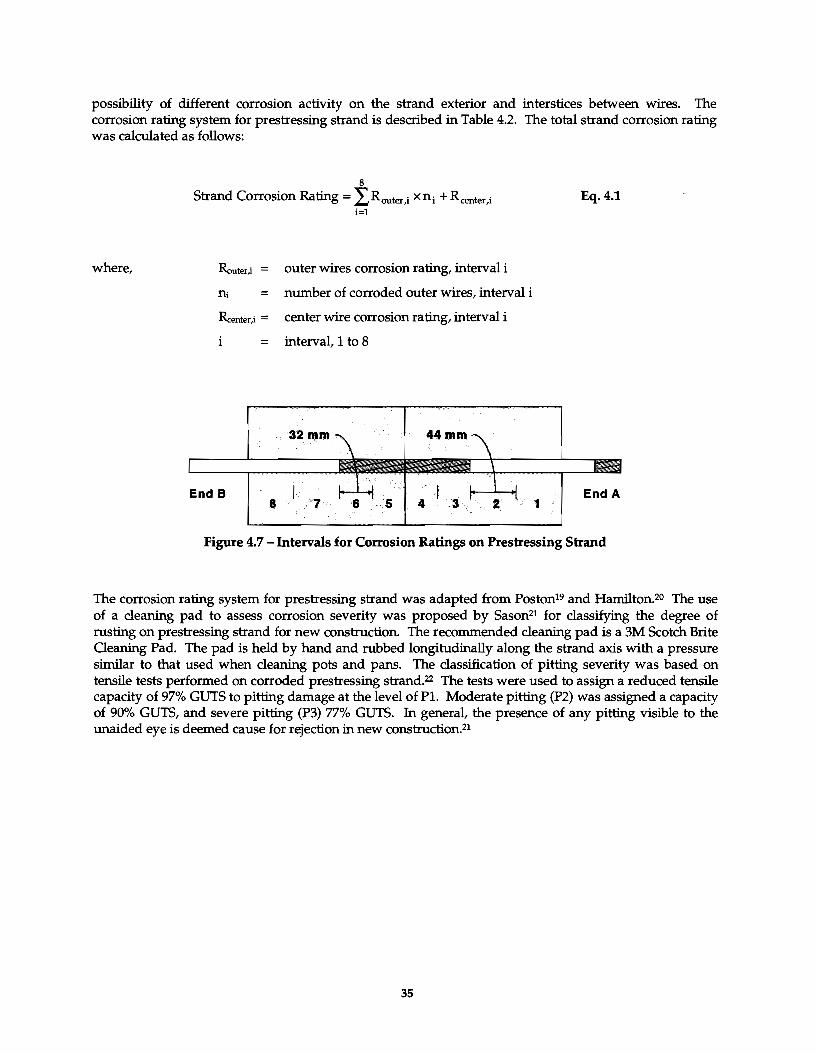
possibility of different corrosion activity on the strand exterior and interstices between wires. The corrosion rating system for prestressing strand is described in Table 4.2. The total strand corrosion rating was calculated as follows:
where,
8
Strand Corrosion Rating= LRouter,i xni + Rcenter,i i=l
Router,; = outer wires corrosion rating, interval i
ni = number of corroded outer wires, interval i
Reenter,; = center wire corrosion rating, interval i
i = interval, 1 to 8
End B 8
Eq. 4.1
End A 1
Figure 4.7- Intervals for Corrosion Ratings on Prestressing Strand
The corrosion rating system for prestressing strand was adapted from Poston19 and Hamilton.2o The use of a cleaning pad to assess corrosion severity was proposed by Sason21 for classifying the degree of rusting on prestressing strand for new construction. The recommended cleaning pad is a 3M Scotch Brite Oeaning Pad. The pad is held by hand and rubbed longitudinally along the strand axis with a pressure similar to that used when cleaning pots and pans. The classification of pitting severity was based on tensile tests performed on corroded prestressing strand.22 The tests were used to assign a reduced tensile capacity of 97% GUTS to pitting damage at the level of Pl. Moderate pitting (P2) was assigned a capacity of 90% GUTS, and severe pitting (P3) 77% GUTS. In general, the presence of any pitting visible to the unaided eye is deemed cause for rejection in new construction.21
35
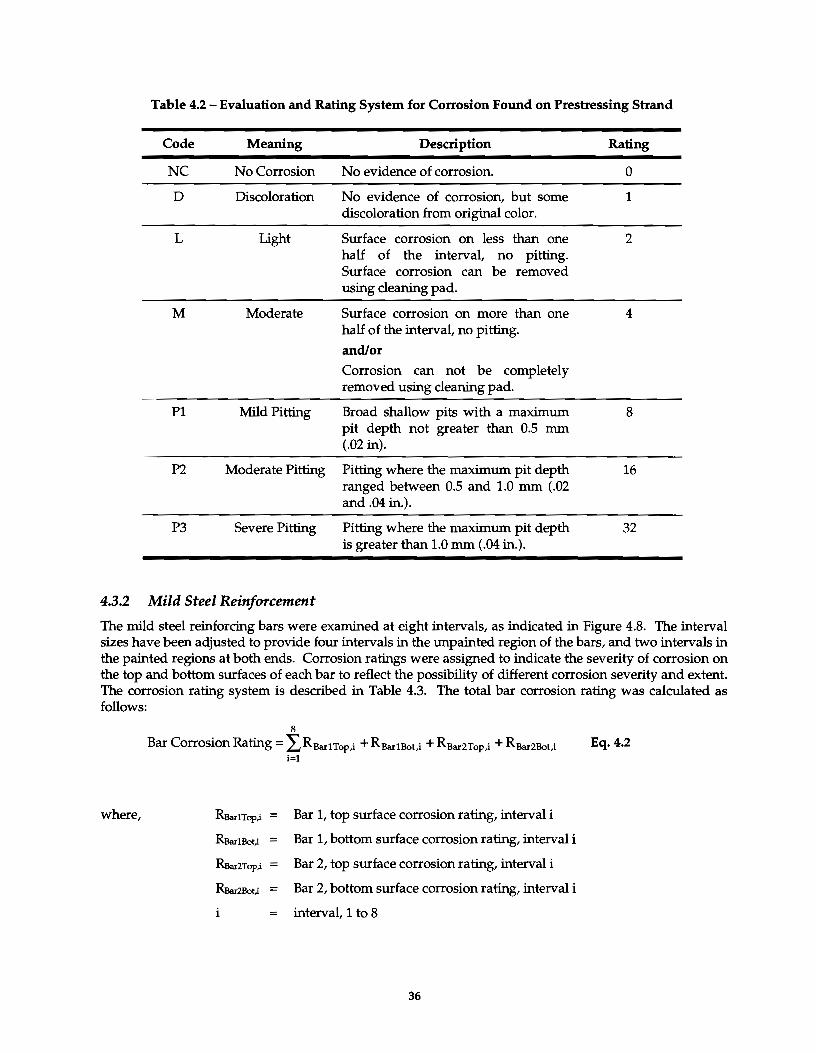
Table 4.2 -Evaluation and Rating System for Corrosion Found on Prestressing Strand
Code
NC
D
L
M
P1
P2
P3
Meaning
No Corrosion
Discoloration
Light
Moderate
Description
No evidence of corrosion.
No evidence of corrosion, but some discoloration from original color.
Surface corrosion on less than one half of the interval, no pitting. Surface corrosion can be removed using cleaning pad.
Surface corrosion on more than one half of the interval, no pitting.
and/or
Corrosion can not be completely removed using cleaning pad.
Mild Pitting Broad shallow pits with a maximum pit depth not greater than 0.5 mm (.02 in).
Moderate Pitting Pitting where the maximum pit depth ranged between 0.5 and 1.0 mm (.02 and .04 in.).
Severe Pitting Pitting where the maximum pit depth is greater than 1.0 mm (.04 in.).
4.3.2 Mild Steel Reinforcement
Rating
0
1
2
4
8
16
32
The mild steel reinforcing bars were examined at eight intervals, as indicated in Figure 4.8. The interval sizes have been adjusted to provide four intervals in the unpainted region of the bars, and two intervals in the painted regions at both ends. Corrosion ratings were assigned to indicate the severity of corrosion on the top and bottom surfaces of each bar to reflect the possibility of different corrosion severity and extent. The corrosion rating system is described in Table 4.3. The total bar corrosion rating was calculated as follows:
where,
8
Bar Corrosion Rating= :L,RsaxlTop,i + RBaxlBot,i + Rsax2Top,i + RBax2Bot,i i=l
RBa:rtTop). = Bar 1, top surface corrosion rating, interval i
RBaxlBot,i = Bar 1, bottom surface corrosion rating, interval i
R5ax2Top,i = Bar 2, top surface corrosion rating, interval i
RBax2Bot,; Bar 2, bottom surface corrosion rating, interval i
= interval, 1 to 8
36
Eq. 4.2
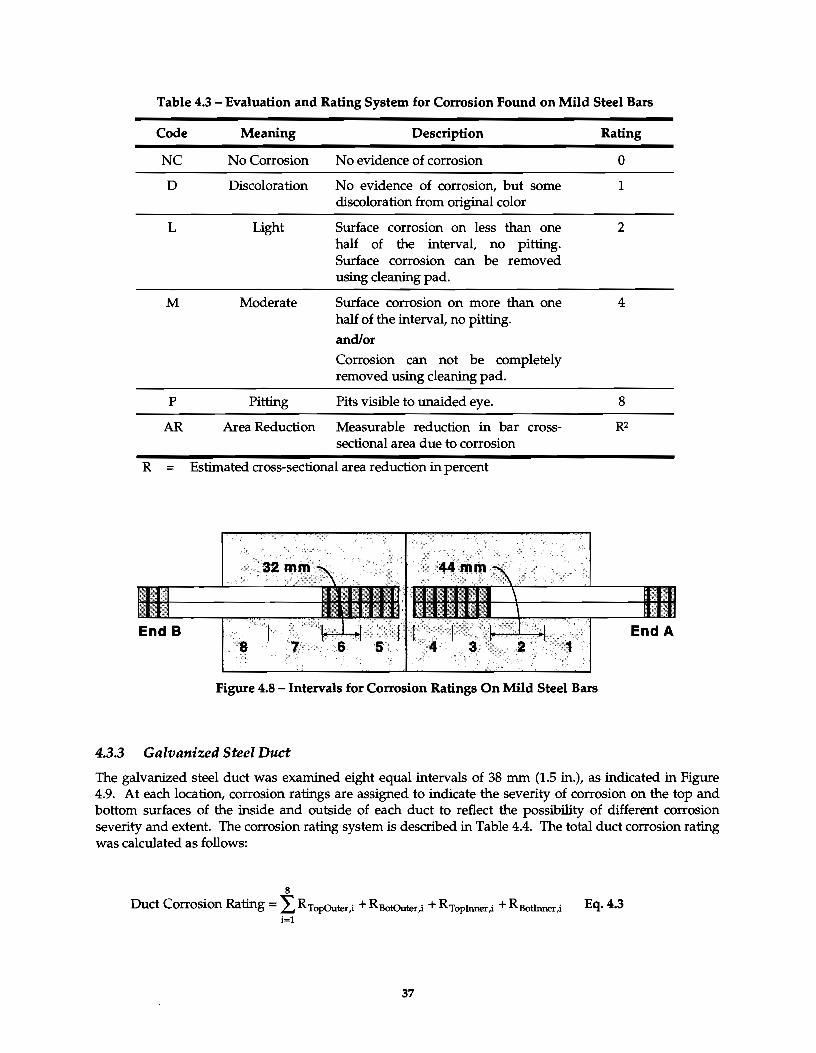
Table 4.3 - Evaluation and Rating System for Corrosion Found on Mild Steel Bars
Code
NC
D
L
M
p
AR
Meaning Description
No Corrosion No evidence of corrosion
Discoloration No evidence of corrosion, but some discoloration from original color
light Surface corrosion on less than one half of the interval, no pitting. Surface corrosion can be removed using cleaning pad.
Moderate Surface corrosion on more than one half of the interval, no pitting.
and/or
Corrosion can not be completely removed using cleaning pad.
Pitting Pits visible to unaided eye.
Area Reduction Measurable reduction in bar crosssectional area due to corrosion
R = Estimated cross-sectional area reduction in percent
Figure 4.8 - Intervals for Corrosion Ratings On Mild Steel Bars
4.3.3 Galvanized Steel Duct
Rating
0
1
2
4
8
The galvanized steel duct was examined eight equal intervals of 38 mm (1.5 in.), as indicated in Figure 4.9. At each location, corrosion ratings are assigned to indicate the severity of corrosion on the top and bottom surfaces of the inside and outside of each duct to reflect the possibility of different corrosion severity and extent. The corrosion rating system is described in Table 4.4. The total duct corrosion rating was calculated as follows:
8
Duct Corrosion Rating= I,.RTopOuter,i + RBotOuter,i + RTopinner,i + RBotinner,i Eq. 4.3 i=l
37
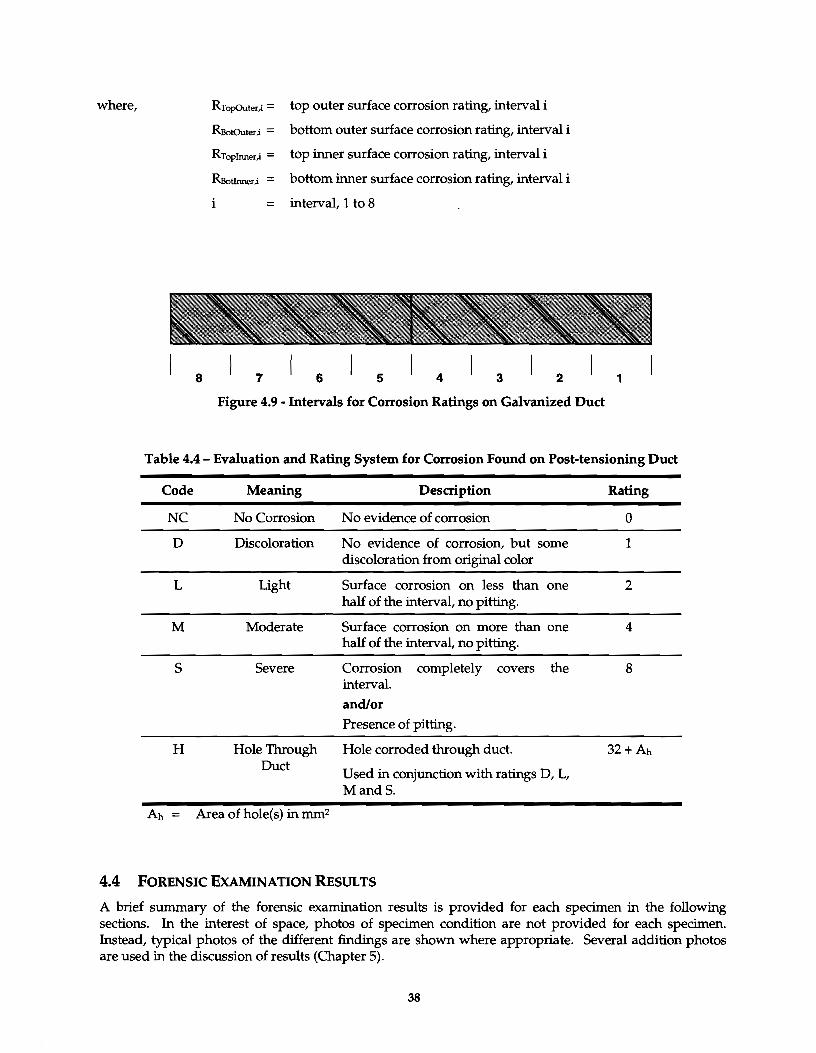
where,
8
RTopOuter,i = top outer surface corrosion rating, interval i
RBotOuter,i = bottom outer surface corrosion rating, interval i
RTopinner.i = top inner surface corrosion rating, interval i
RBotinner,.i = bottom inner surface corrosion rating, interval i
i = interval, 1 to 8
7 6 5 4 3 2
Figure 4.9 • Intervals for Corrosion Ratings on Galvanized Duct
1
Table 4.4- Evaluation and Rating System for Corrosion Found on Post-tensioning Duct
Code Meaning Description Rating
NC No Corrosion No evidence of corrosion 0
D Discoloration No evidence of corrosion, but some 1 discoloration from original color
L light Surface corrosion on less than one 2 half of the interval, no pitting.
M Moderate Surface corrosion on more than one 4 half of the interval, no pitting.
s Severe Corrosion completely covers the 8 interval.
and/or Presence of pitting.
H Hole Through Hole corroded through duct. 32+Ah Duct Used in conjunction with ratings D, L,
MandS.
Ah = Area of hole(s) in mm2
4.4 FORENSIC EXAMINATION RESULTS
A brief summary of the forensic examination results is provided for each specimen in the following sections. In the interest of space, photos of specimen condition are not provided for each specimen. Instead, typical photos of the different findings are shown where appropriate. Several addition photos are used in the discussion of results (Chapter 5).
38
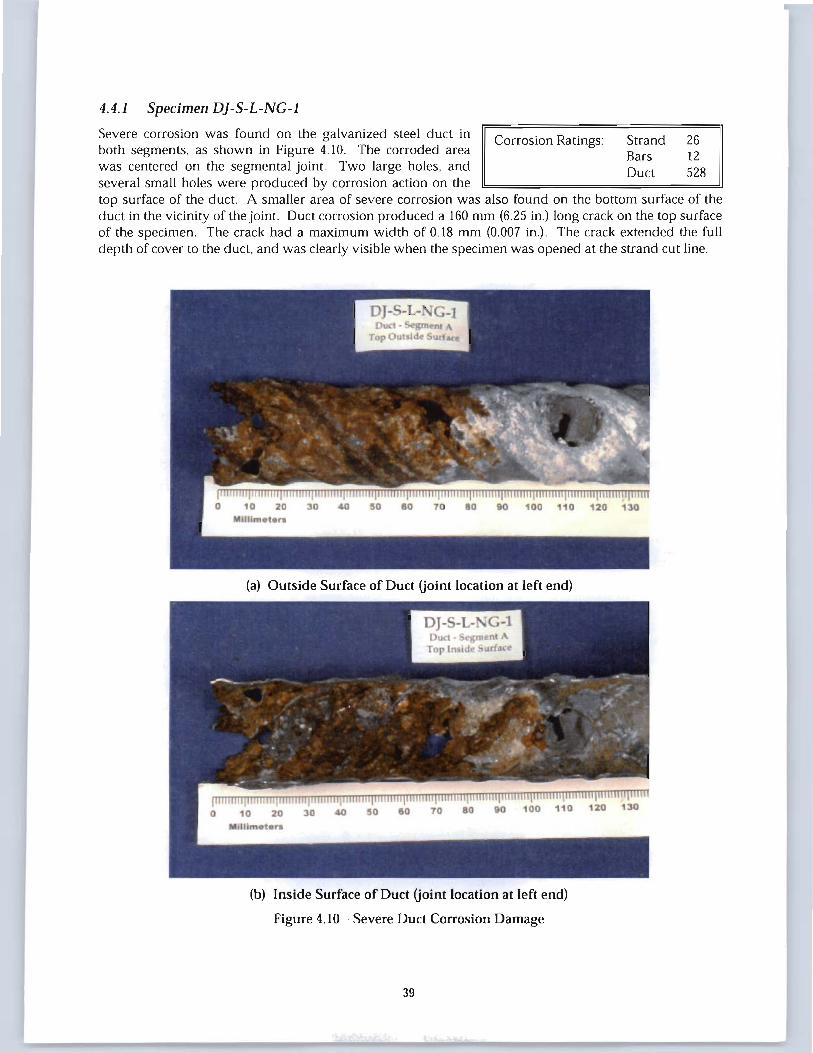
4.4.1 Specimen D]-S-L-NG-1
Severe corrosion was found on the galvanized steel duct in both segments, as shown in Figure 4.10. The corroded area was centered on the segmental joint Two large holes, and several small holes were produced by corrosion action on the
Corrosion Ratings: Strand Bars Duct
26 12 528
top surface of the duct A smaller area of severe corrosion was also found on the bottom surface of the duct in the vicinity of the joint Duct corrosion produced a 160 mm (6.25 in.) long crack on the top surface of the specimen. The crack had a maximum width of 0.18 mm (0.007 in.). The crack extended the full depth of cover to the duct, and was clearly visible when the specimen was opened at the strand cut line.
(a) Outside Surface of Duct Uoint location at left end)
(b) Inside Surface of Duct Uoint location at left end)
Figure 4.10 - Severe Duct Corrosion Damage
39
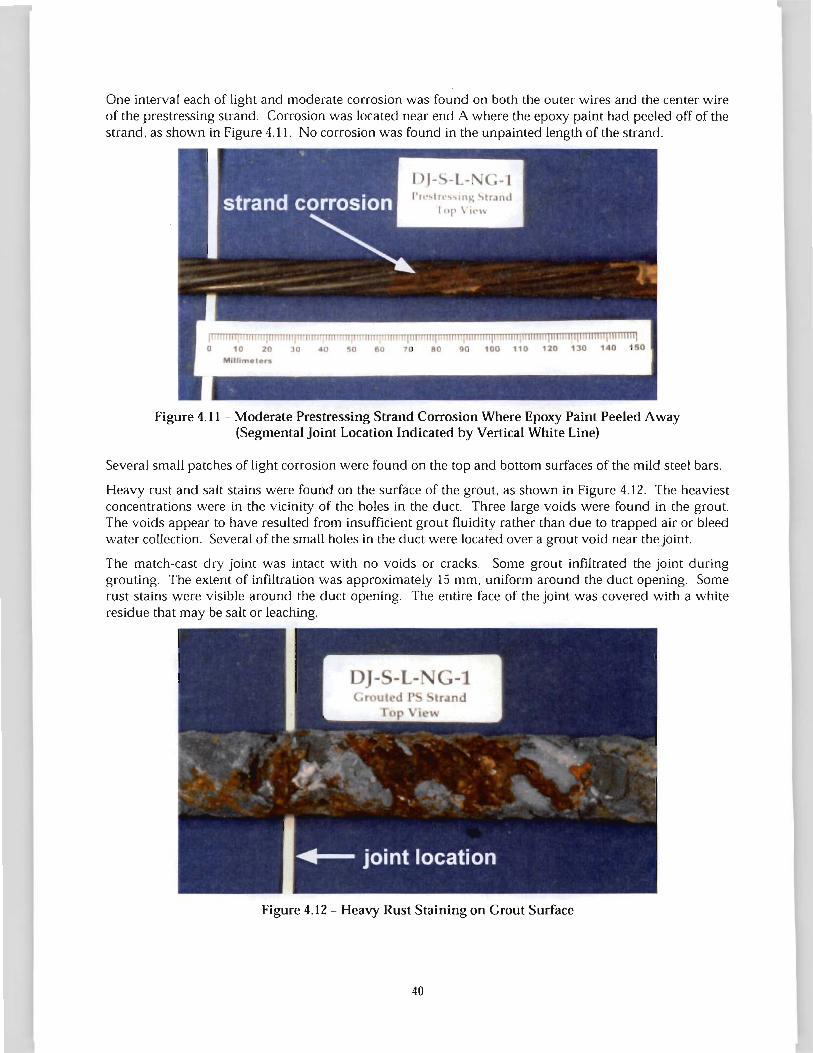
One interval each of light and moderate corrosion was found on both the outer wires and the center wire of the prestressing strand. Corrosion was located near end A where the epoxy paint had peeled off of the strand, as shown in Figure 4.11. No corrosion was found in the unpainted length of the strand.
Df- -L- <.-1 l'll•,lro·,,an..: "tr.ln I
I "I' \ "'"
Figure 4.11 - Moderate Prestressing Strand Corrosion Where Epoxy Paint Peeled Away (Segmental Joint Location Indicated by Vertical White Line)
Several small patches of light corrosion were found on the top and bottom surfaces of the mild steel bars.
Heavy rust and salt stains were found on the surface of the grout, as shown in Figure 4.12. The heaviest concentrations were in the vicinity of the holes in the duct. Three large voids were found in the grout. The voids appear to have resulted from insufficient grout fluidity rather than due to trapped air or bleed water collection. Several of the small holes in the duct were located over a grout void near the joint.
The match-cast dry joint was intact with no voids or cracks. Some grout infiltrated the joint during grouting. The extent of infiltration was approximately 15 mm, uniform around the duct opening. Some rust stains were visible around the duct opening. The entire face of the joint was covered with a white residue that may be salt or leaching.
Figure 4.12- Heavy Rust Staining on Grout Surface
40
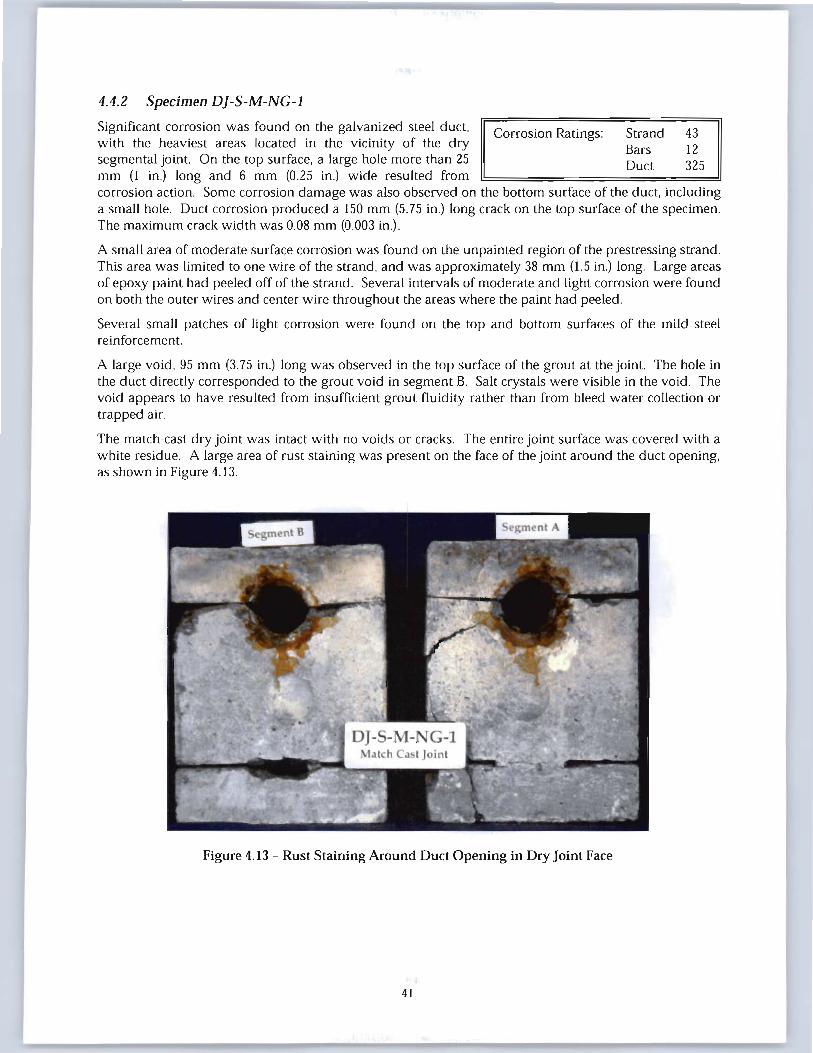
4.4.2 Specimen D]-S-M-NG-1
Significant corrosion was found on the galvanized steel duct, with the heaviest areas located in the vicinity of the dry segmental joint. On the top surface, a large hole more than 25 mm (I in.) long and 6 mm (0.25 in.) wide resulted from
Corrosion Ratings: Strand Bars Duct
43 12 325
corrosion action. Some corrosion damage was also observed on the bottom surface of the duct. including a small hole. Duct corrosion produced a 150 mm (5.75 in.) long crack on the top surface of the specimen. The maximum crack width was 0.08 mm (0.003 in.).
A small area of moderate surface corrosion was found on the unpainted region of the prestressing strand. This area was limited to one wire of the strand. and was approximately 38 mm (1.5 in.) long. Large areas of epoxy paint had peeled off of the strand. Several intervals of moderate and light corrosion were found on both the outer wires and center wire throughout the areas where the paint had peeled.
Several small patches of light corrosion were found on the top and bottom surfaces of the mild steel reinforcement.
A large void, 95 mm (3. 75 in.) long was observed in the top surface of the grout at the joint. The hole in the duct directly corresponded to the grout void in segment B. Salt crystals were visible in the void. The void appears to have resulted from insufficient grout fluidity rather than from bleed water collection or trapped air.
The match-cast dry joint was intact with no voids or cracks. The entire joint surface was covered with a white residue. A large area of rust staining was present on the face of the joint around the duct opening, as shown in Figure 4.13.
Figure 4.13 - Rust Staining Around Duct Opening in Dry Joint Face
41
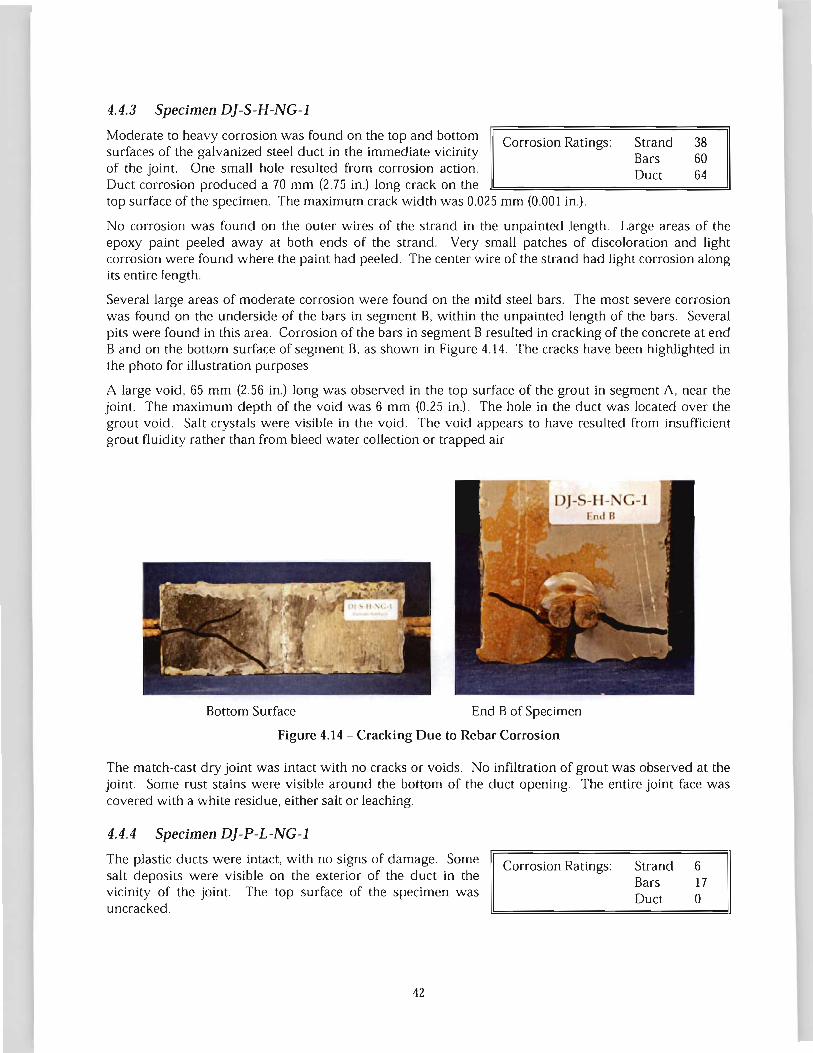
4.4.3 Specimen D]-S-H-NG-1
Moderate to heavy corrosion was found on the top and bottom surfaces of the galvanized steel duct in the immediate vicinity of the joint. One small hole resulted from corrosion action. Duct corrosion produced a 70 mm (2.75 in.) long crack on the
Corrosion Ratings:
top surface of the specimen. The maximum crack width was 0.025 mm (0.001 in.).
Strand 38 Bars 60 Duct 64
No corrosion was found on the outer wires of the strand in the unpainted length. Large areas of the epoxy paint peeled away at both ends of the strand. Very small patches of discoloration and light corrosion were found where the paint had peeled. The center wire of the strand had light corrosion along its entire length.
Several large areas of moderate corrosion were found on the mild steel bars. The most severe corrosion was found on the underside of the bars in segment B. within the unpainted length of the bars. Several pits were found in this area. Corrosion of the bars in segment B resulted in cracking of the concrete at end Band on the bottom surface of segment B. as shown in Figure 4.14. The cracks have been highlighted in the photo for illustration purposes
A large void . 65 mm (2.56 in.) long was observed in the top surface of the grout in segment A, near the joint. The maximum depth of the void was 6 mm (0.25 in.) . The hole in the duct was located over the grout void. Salt crystals were visible in the void. The void appears to have resulted from insufficient grout fluidity rather than from bleed water collection or trapped air.
Bottom Surface End B of Specimen
Figure 4.14 - Cracking Due to Rebar Corrosion
The match-cast dry joint was intact with no cracks or voids. No infiltration of grout was observed at the joint. Some rust stains were visible around the bottom of the duct opening The entire joint face was covered with a white residue, either salt or leaching.
4.4.4 Specimen D]-P-L-NG-1
The plastic ducts were intact, with no signs of damage. Some salt deposits were visible on the exterior of the duct in the vicinity of the joint. The top surface of the specimen was uncracked .
42
Corrosion Ratings: Strand 6 Bars 17 Duct 0
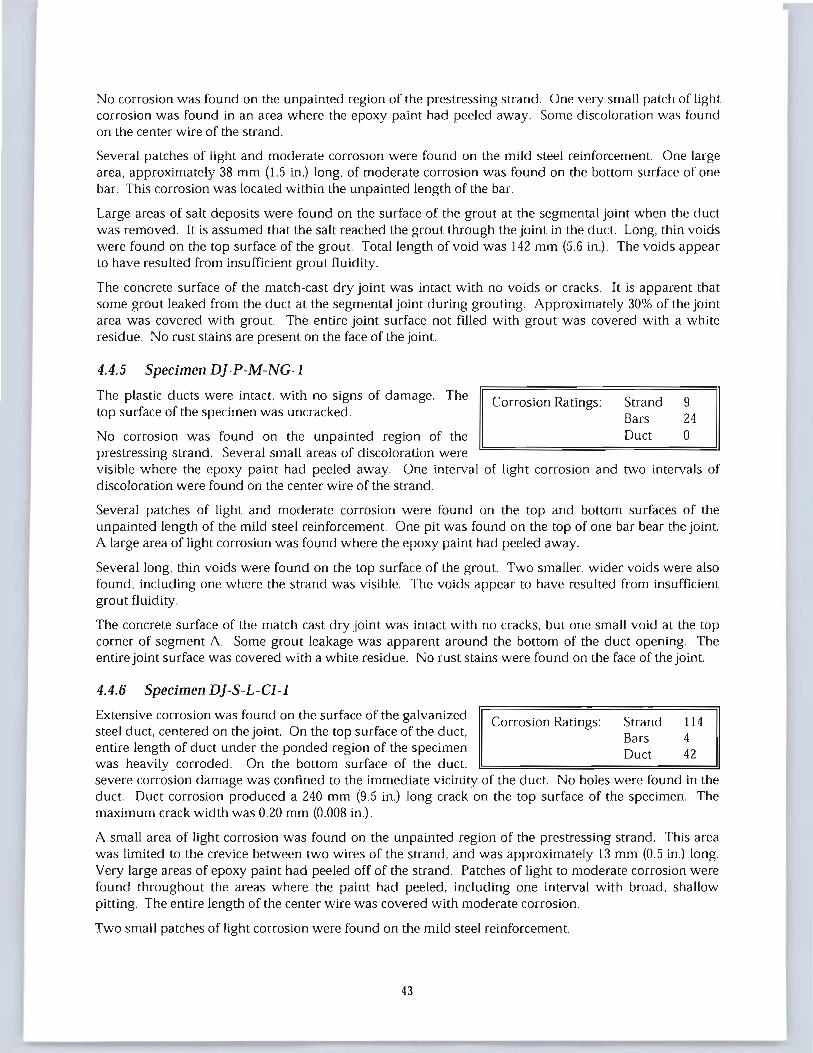
No corrosion was found on the unpainted region of the prestressing strand. One very small patch of light corrosion was found in an area where the epoxy paint had peeled away. Some discoloration was found on the center wire of the strand.
Several patches of light and moderate corrosion were found on the mild steel reinforcement. One large area, approximately 38 mm (1.5 in.) long, of moderate corrosion was found on the bottom surface of one bar. This corrosion was located within the unpainted length of the bar.
Large areas of salt deposits were found on the surface of the grout at the segmental joint when the duct was removed. It is assumed that the salt reached the grout through the joint in the duct. Long, thin voids were found on the top surface of the grout. Total length ofvoid was 142 mm (5.6 in.). The voids appear to have resulted from insufficient grout fluidity.
The concrete surface of the match-cast dry joint was intact with no voids or cracks. It is apparent that some grout leaked from the duct at the segmental joint during grouting. Approximately 30% of the joint area was covered with grout. The entire joint surface not filled with grout was covered with a white residue. No rust stains are present on the face of the joint.
4.4.5 Specimen D]-P-M-NG-1
The plastic ducts were intact, with no signs of damage. The top surface of the specimen was uncracked .
No corrosion was found on the unpainted region of the prestressing strand. Several small areas of discoloration were
Corrosion Ratings:
visible where the epoxy paint had peeled away. One interval of light corrosion and discoloration were found on the center wire of the strand.
Strand 9 Bars 24 Duct 0
two intervals of
Several patches of light and moderate corrosion were found on the top and bottom surfaces of the unpainted length of the mild steel reinforcement. One pit was found on the top of one bar bear the joint. A large area of light corrosion was found where the epoxy paint had peeled away.
Several long, thin voids were found on the top surface of the grout. Two smaller, wider voids were also found, including one where the strand was visible. The voids appear to have resulted from insufficient grout fluidity .
The concrete surface of the match-cast dry joint was intact with no cracks, but one small void at the top corner of segment A. Some grout leakage was apparent around the bottom of the duct opening. The entire joint surface was covered with a white residue. No rust stains were found on the face of the joint.
4.4.6 Specimen D]-S-L-CI-1
Extensive corrosion was found on the surface of the galvanized steel duct, centered on the joint. On the top surface of the duct, entire length of duct under the ponded region of the specimen was heavily corroded. On the bottom surface of the duct,
Corrosion Ratings: Strand Bars Duct
114 4 42
severe corrosion damage was confined to the immediate vicinity of the duct. No holes were found in the duct. Duct corrosion produced a 240 mm (9.5 in.) long crack on the top surface of the specimen. The maximum crack width was 0.20 mm (0.008 in.).
A small area of light corrosion was found on the unpainted region of the prestressing strand. This area was limited to the crevice between two wires of the strand, and was approximately 13 mm (0.5 in.) long. Very large areas of epoxy paint had peeled off of the strand. Patches of light to moderate corrosion were found throughout the areas where the paint had peeled, including one interval with broad, shallow pitting. The entire length of the center wire was covered with moderate corrosion.
Two small patches of light corrosion were found on the mild steel reinforcement.
43
Heavy rust stains were found on the surface of the grout in the vicinity of the joint. The entire top surface of the grout in segment A was covered with salt crystals. Three voids were visible in the grout, all located away from the joint. The voids appear to have resulted from insufficient grout fluidity.
The concrete surface of the match-cast dry joint was intact with no voids or cracks. Significant grout leakage occurred during grouting, and approximately 80% of the joint surface was covered with grout, as shown in Figure 4.15. Rust and salt stains are present on the face of the joint around the duct opening.
Figure 4.15 - Grout Infiltration Into joint: Specimen Dj-S-L-CI-1
4.4.7 Specimen D]-S-M -CI-1
A large area of moderate to severe corrosion was found on the galvanized steel duct in the vicinity of the dry segmental joint. Two small holes were found on the top surface of the duct, and one small hole was found on the bottom surface. Duct
Corrosion Ratings: Strand Bars Duct
24 20 151
corrosion produced a 57 mm (2.25 in.) long crack on the top surface of the specimen. width was 0.05 mm (0.002 in.).
The maximum crack
No corrosion was found on the outer wires within the unpainted length of the strand. Large areas of epoxy paint had peeled off of the strand, and one interval of light corrosion and several areas of discoloration were found where the paint had peeled . The center wire of the strand was discolored near the ends and had five intervals of light surface corrosion.
Several small patches of light corrosion were found on the top and bottom surfaces of the mild steel reinforcement. Two areas of moderate corrosion were found on the underside of the mild steel reinforcement. All corrosion was found in the unpainted length of the bars.
Several voids were observed in the top surface of the grout away from the joint. The void appears to have resulted from insufficient grout fluidity. Rust and salt stains were visible on the surface of the grout in the vicinity of the joint.
The match-cast dry joint was intact with no voids or cracks. A sizeable area of the joint face was covered with grout due to leakage at the joint. The remainder of the joint surface was covered with a white residue. Minor rust stains were present on the face of the joint around the duct opening.
4.4.8 Specimen SE-S-L-NG-2
Severe corrosion was found on the galvanized steel duct in segment B. Corrosion damage was located under the ponded area of the segment and was centered approximately 25 mm (1 in.) from the joint. Light corrosion was found on the top
44
Corrosion Ratings: Strand 13 Bars 6 Duct 22
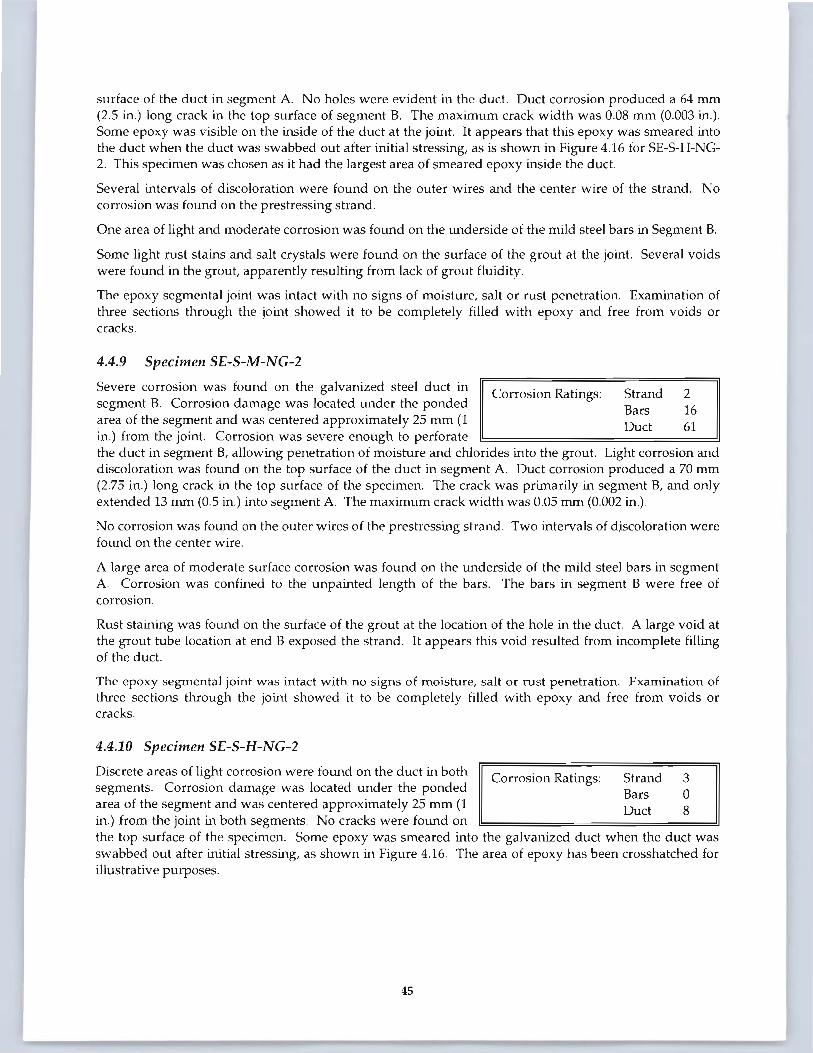
surface of the duct in segment A. No holes were evident in the duct. Duct corrosion produced a 64 mm (2.5 in.) long crack in the top surface of segment B. The maximum crack width was 0.08 mm (0.003 in.) . Some epoxy was visible on the inside of the duct at the joint. It appears that this epoxy was smeared into the duct when the duct was swabbed out after initial stressing, as is shown in Figure 4.16 for SE-S-H-NG-2. This specimen was chosen as it had the largest area of smeared epoxy inside the duct.
Several intervals of discoloration were found on the outer wires and the center wire of the strand. No corrosion was found on the prestressing strand.
One area of light and moderate corrosion was found on the underside of the mild steel bars in Segment B.
Some light rust stains and salt crystals were found on the surface of the grout at the joint. Several voids were found in the grout, apparently resulting from lack of grout fluidity
The epoxy segmental joint was intact with no signs of moisture, salt or rust penetration. Examination of three sections through the joint showed it to be completely filled with epoxy and free from voids or cracks.
4.4.9 Specimen SE-S-M-NG-2
Severe corrosion was found on the galvanized steel duct in segment B. Corrosion damage was located under the ponded area of the segment and was centered approximately 25 mm (1 in.) from the joint. Corrosion was severe enough to perforate
Corrosion Ratings: Strand Bars Duct
2 16 61
the duct in segment B, allowing penetration of moisture and chlorides into the grout. Light corrosion and discoloration was found on the top surface of the duct in segment A. Duct corrosion produced a 70 mm (2.75 in.) long crack in the top surface of the specimen. The crack was primarily in segment B, and only extended 13 mm (0.5 in.) into segment A. The maximum crack width was 0.05 mm (0.002 in.).
No corrosion was found on the outer wires of the prestressing strand. Two intervals of d~scoloration were found on the center wire.
A large area of moderate surface corrosion was found on the underside of the mild steel bars in segment A. Corrosion was confined to the unpainted length of the bars. The bars in segment B were free of corrosion.
Rust staining was found on the surface of the grout at the location of the hole in the duct. A large void at the grout tube location at end B exposed the strand. It appears this void resulted from incomplete filling of the duct.
The epoxy segmental joint was intact with no signs of moisture, salt or rust penetration. Examination of three sections through the joint showed it to be completely filled with epoxy and free from voids or cracks.
4.4.10 Specimen SE-S-H-NG-2
Discrete areas of light corrosion were found on the duct in both segments. Corrosion damage was located under the ponded area of the segment and was centered approximately 25 mm (1 in.) from the joint in both segments. No cracks were found on
Corrosion Ratings: Strand Bars Duct
3 0 8
the top surface of the specimen. Some epoxy was smeared into the galvanized duct when the duct was swabbed out after initial stressing, as shown in Figure 4.16. The area of epoxy has been crosshatched for illustrative purposes.
45
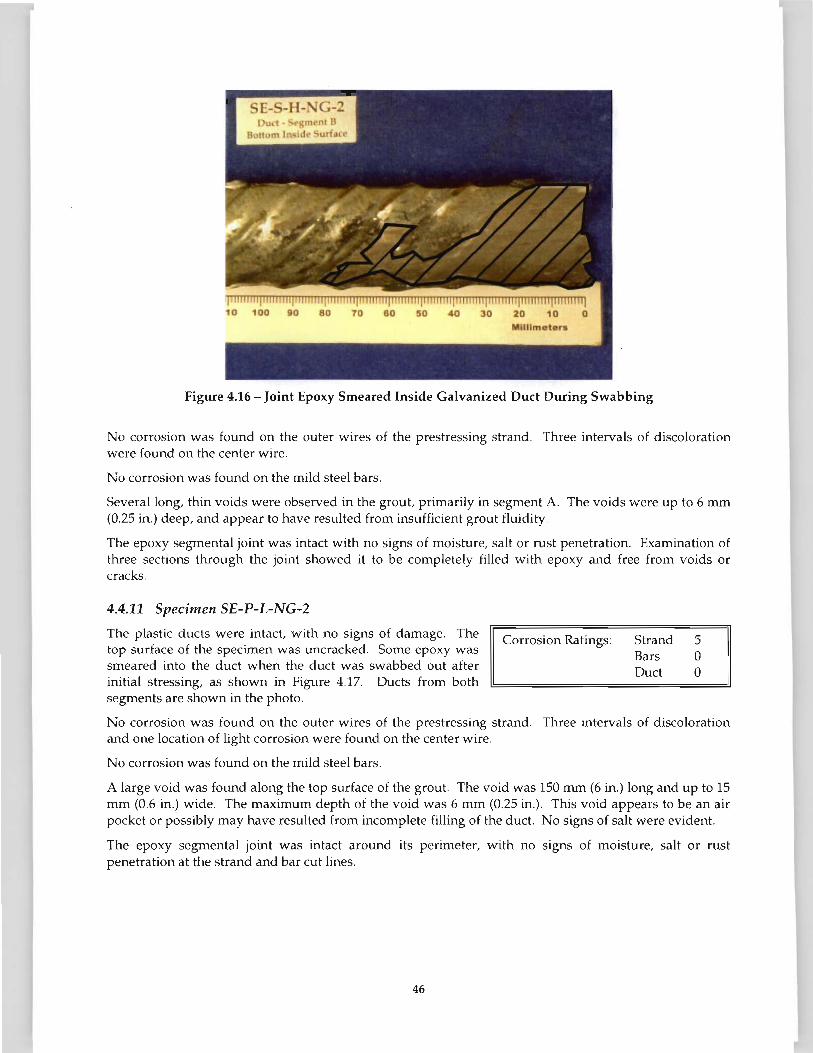
Figure 4.16- Joint Epoxy Smeared Inside Galvanized Duct During Swabbing
No corrosion was found on the outer wires of the prestressing strand. Three intervals of discoloration were found on the center wire.
No corrosion was found on the mild steel bars.
Several long, thin voids were observed in the grout, primarily in segment A. The voids were up to 6 mm (0.25 in.) deep, and appear to have resulted from insufficient grout fluidity
The epoxy segmental joint was intact with no signs of moisture, salt or rust penetration. Examination of three sections through the joint showed it to be completely filled with epoxy and free from voids or cracks.
4.4.11 Specimen SE-P-L-NG-2
The plastic ducts were intact, with no signs of damage. The top surface of the specimen was uncracked. Some epoxy was smeared into the duct when the duct was swabbed out after initial stressing, as shown in Figure 4.17. Ducts from both segments are shown in the photo.
Corrosion Ratings: Strand 5 Bars 0 Duct 0
No corrosion was found on the outer wires of the prestressing strand. Three intervals of discoloration and one location of light corrosion were found on the center wire.
No corrosion was found on the mild steel bars.
A large void was found along the top surface of the grout. The void was 150 mm (6 in.) long and up to 15 mm (0.6 in.) wide. The maximum depth of the void was 6 mm (0.25 in.) . This void appears to be an air pocket or possibly may have resulted from incomplete filling of the duct. No signs of salt were evident.
The epoxy segmental joint was intact around its perimeter, with no signs of moisture, salt or rust penetration at the strand and bar cut lines.
46
Figure 4.17- Joint Epoxy Smeared Inside Plastic Duct During Swabbing
4.4.12 Specimen SE-P-M-NG-2
The plastic ducts were intact, with no signs of damage. The top surface of the specimen was uncracked.
No corrosion was found on the outer wires of the prestressing strand. Six intervals of discoloration were found on the center wire.
No corrosion was found on the mild steel bars.
Corrosion Ratings: Strand 6 Bars 0 Duct 0
Several large voids were present in the grout. Voids were both longitudinal and transverse. The strand was exposed at one location. The voids appear to be caused by lack of grout fluidity . No signs of salt were evident.
The epoxy segmental joint was intact around its perimeter, with no signs of moisture, salt or rust penetration at the strand and bar cut lines.
4.4.13 Specimen SE-S-L-CI-2
Discrete areas of corrosion were found on the duct in both segments. In segment A, light corrosion was centered approximately 35 mm (1.375 in.) from the joint. In segment B, severe corrosion was centered 42 mm (1.65 in.) from the joint.
Corrosion Ratings: Strand Bars Duct
24 0 85
Corrosion damage produced several small holes through the duct in segment B. No cracks were found on the top surface of the specimen. Some epoxy was smeared into the duct when the duct was swabbed out after initial stressing.
Several areas of discoloration were found on the outer wires and center wire of the prestressing strand.
No corrosion was found on the mild steel bars.
Rust and salt stains were found on the surface of the grout in segment B. It appears that moisture and chlorides penetrated through the hole in the duct in this area. Several voids were observed in the grout. The voids appear to have resulted from trapped air or bleed water collection.
The epoxy segmental joint was intact around its perimeter, with no signs of moisture, salt or rust penetration at the strand and bar cut lines.
47
4.4.14 Specimen SE-S-M-CI-2
Discrete areas of corrosion were found on the duct in both segments. In segment A, light corrosion and discoloration was centered approximately 38 mm (1.5 in.) from the joint. A large area of severe corrosion was centered 42 mm (1.65 in.) from the
Corrosion Ratings: Strand Bars Duct
2 0 114
joint in segment B. Corrosion damage produced a large hole through the duct in segment B. No cracks were found on the top surface of the specimen. Some epoxy was smeared into the duct when the duct was swabbed out after initial stressing.
Two intervals of discoloration were found on the center wire of the strand .
No corrosion was found on the mild steel bars.
Rust and salt stains were found on the surface of the grout in segment B in the vicinity of the hole in the duct in this area. One void was present in the grout of segment A, apparently resulting from insufficient grout fluidity. The prestressing strand was exposed at this location.
The epoxy segmental joint was intact around its perimeter, with no signs of moisture, salt or rust penetration at the strand and bar cut lines.
4.4.15 Specimen SE-S-H-CI-2
Discrete areas of light corrosion were found on the duct in both segments. In both segments, corrosion was centered approximately 38 mm (1.5 in.) from the joint. No cracks were found on the top surface of the specimen. Some epoxy was
Corrosion Ratings:
smeared into the duct when the duct was swabbed out after initial stressing.
Three intervals of discoloration were found on the center wire of the strand.
No corrosion was found on the mild steel bars.
Strand Bars Duct
3 1 10
Two voids were found in the grout, one located at the joint and one at end A Both voids appear to have resulted from insufficient grout fluidity.
The epoxy segmental joint was intact around its perimeter, with no signs of moisture, salt or rust penetration at the strand and bar cut lines.
4.4.16 Specimen SE-S-L-SF-2
Discrete areas of corrosion were found on the duct in both segments. An area of light corrosion was centered approximately 40 mm (1.57 in.) from the joint in segment A In
Corrosion Ratings: Strand Bars Duct
12 0 12
segment B, moderate corrosion was centered 38 mm (1.5 in.) from the joint No cracks were found on the top surface of the specimen. the duct when the duct was swabbed out after initial stressing.
Some epoxy was smeared into
Two areas of light surface corrosion were found on the outer wires of the prestressing strand where some of the epoxy paint had peeled away. Two intervals of discoloration were found on the center wire of the strand.
No corrosion was found on the mild steel bars.
A long, thin, shallow void was found in the grout of segment B. Several small voids and many tiny air bubbles were visible in segment A grout. These voids appear to have resulted from trapped ai r or possibly bleed water collection.
The epoxy segmental joint was intact around its perimeter, with no signs of moisture, salt or rust penetration at the strand and bar cut lines.
48
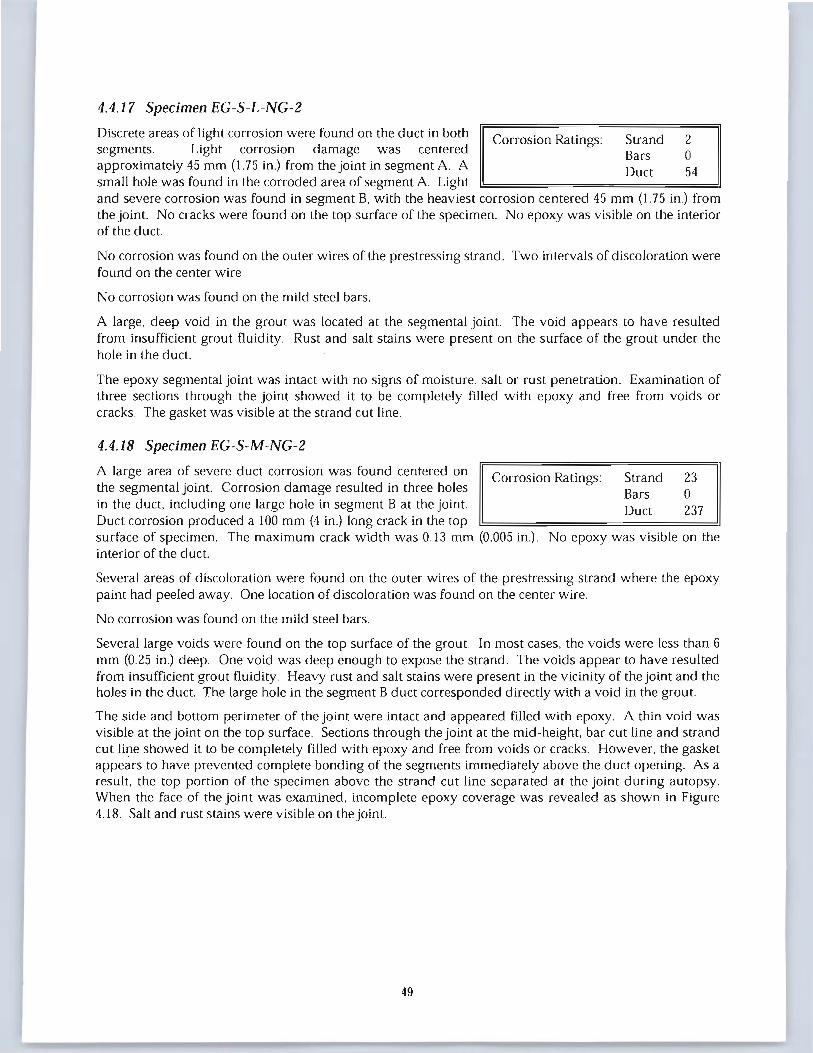
4.4.17 Specimen EG-S-L-NG-2
Discrete areas of light corrosion were found on the duct in both segments. Light corrosion damage was centered approximately 45 mm (1.75 in.) from the joint in segment A. A small hole was found in the corroded area of segment A. Light
Corrosion Ratings: Strand Bars Duct
2 0 54
and severe corrosion was found in segment B. with the heaviest corrosion centered 45 mm (1.75 in.) from the joint. No cracks were found on the top surface of the specimen. No epoxy was visible on the interior of the duct.
No corrosion was found on the outer wires of the prestressing strand. Two intervals of discoloration were found on the center wire.
No corrosion was found on the mild steel bars.
A large. deep void in the grout was located at the segmental joint. The void appears to have resulted from insufficient grout fluidity. Rust and salt stains were present on the surface of the grout under the hole in the duct.
The epoxy segmental joint was intact with no signs of moisture, salt or rust penetration. Examination of three sections through the joint showed it to be completely filled with epoxy and free from voids or cracks. The gasket was visible at the strand cut line.
4.4.18 Specimen EG-S-M -NG-2
A large area of severe duct corrosion was. found centered on the segmental joint. Corrosion damage resulted in three holes in the duct, including one large hole in segment B at the joint.
Corrosion Ratings: Strand Bars Duct
23 0 237
Duct corrosion produced a 100 mm (4 in.) long crack in the top surface of specimen. The maximum crack width was 0.13 mm (0.005 in.) . interior of the duct.
No epoxy was visible on the
Several areas of discoloration were found on the outer wires of the prestressing strand where the epoxy paint had peeled away. One location of discoloration was found on the center wire.
No corrosion was found on the mild steel bars.
Several large voids were found on the top surface of the grout. In most cases, the voids were less than 6 mm (0.25 in.) deep. One void was deep enough to expose the strand . The voids appear to have resulted from insufficient grout fluidity . Heavy rust and salt stains were present in the vicinity of the joint and the holes in the duct. The large hole in the segment B duct corresponded directly with a void in the grout.
The side and bottom perimeter of the joint were intact and appeared filled with epoxy. A thin void was visible at the joint on the top surface. Sections through the joint at the mid-height, bar cut line and strand cut line showed it to be completely filled with epoxy and free from voids or cracks. However, the gasket appears to have prevented complete bonding of the segments immediately above the duct opening. As a result, the top portion of the specimen above the strand cut line separated at the joint during autopsy. When the face of the joint was examined , incomplete epoxy coverage was revealed as shown in Figure 4.18. Salt and rust stains were visible on the joint.
49
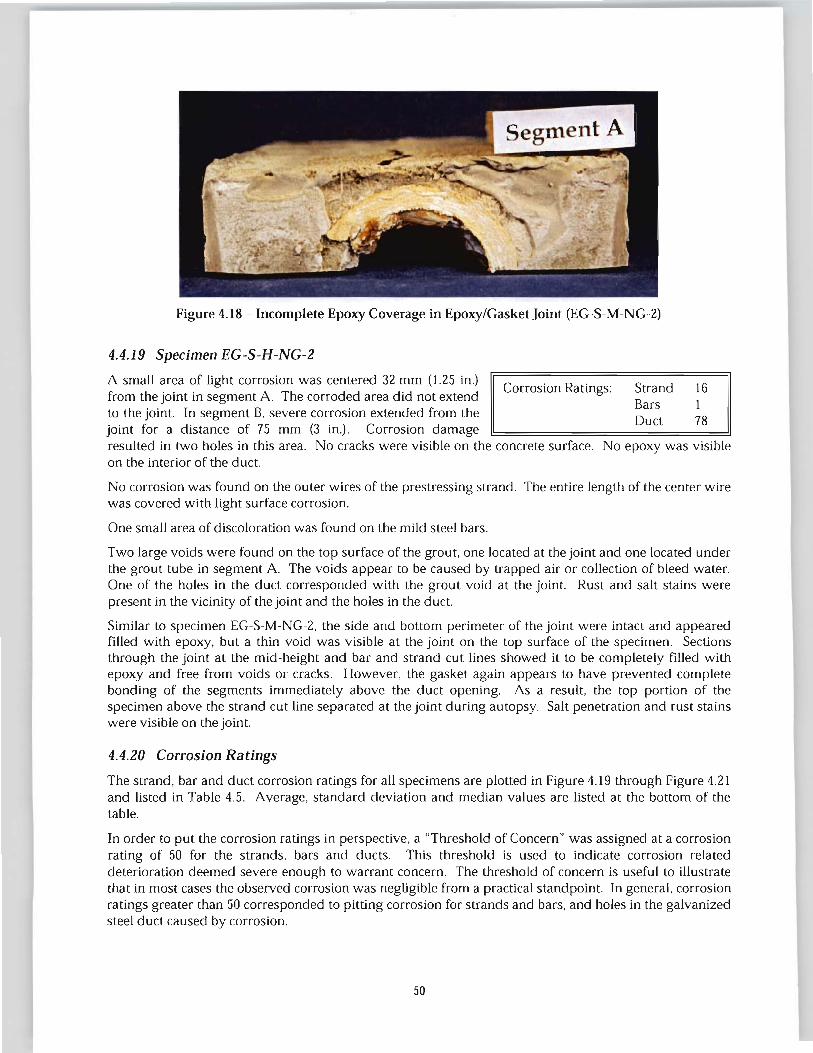
Figure 4.18- Incomplete Epoxy Coverage in Epoxy/Gasket joint (EG-S-M-NG-2)
4.4.19 Specimen EG-S-H-NG-2
A small area of light corrosion was centered 32 mm (1.25 in.) from the joint in segment A The corroded area did not extend to the joint. In segment B. severe corrosion extended from the joint for a distance of 75 mm (3 in.) . Corrosion damage
Corrosion Ratings: Strand Bars Duct
16 1 78
resulted in two holes in this area. No cracks were visible on the concrete surface. No epoxy was visible on the interior of the duct.
No corrosion was found on the outer wires of the prestressing strand. The entire length of the center wire was covered with light surface corrosion.
One small area of discoloration was found on the mild steel bars.
Two large voids were found on the top surface of the grout. one located at the joint and one located under the grout tube in segment A The voids appear to be caused by trapped air or collection of bleed water. One of the holes in the duct corresponded with the grout void at the joint. Rust and salt stains were present in the vicinity of the joint and the holes in the duct.
Similar to specimen EG-S-M-NG-2. the side and bottom perimeter of the joint were intact and appeared filled with epoxy, but a thin void was visible at the joint on the top surface of the specimen. Sections through the joint at the mid -height and bar and strand cut lines showed it to be completely filled with epoxy and free from voids or cracks. However, the gasket again appears to have prevented complete bonding of the segments immediately above the duct opening. As a result. the top portion of the specimen above the strand cut line separated at the joint during autopsy. Salt penetration and rust stains were visible on the joint.
4.4.20 Corrosion Ratings
The strand. bar and duct corrosion ratings for all specimens are plotted in Figure 4.19 through Figure 4.21 and listed in Table 4.5. Average, standard deviation and median values are listed at the bottom of the table.
In order to put the corrosion ratings in perspective. a "Threshold of Concern" was assigned at a corrosion rating of 50 for the strands. bars and ducts. This threshold is used to indicate corrosion related deterioration deemed severe enough to warrant concern. The threshold of concern is useful to illustrate that in most cases the observed corrosion was neglig ible from a practical standpoint. In general. corrosion ratings greater than 50 corresponded to pitting corrosion for strands and bars. and holes in the galvanized steel duct caused by corrosion.
50
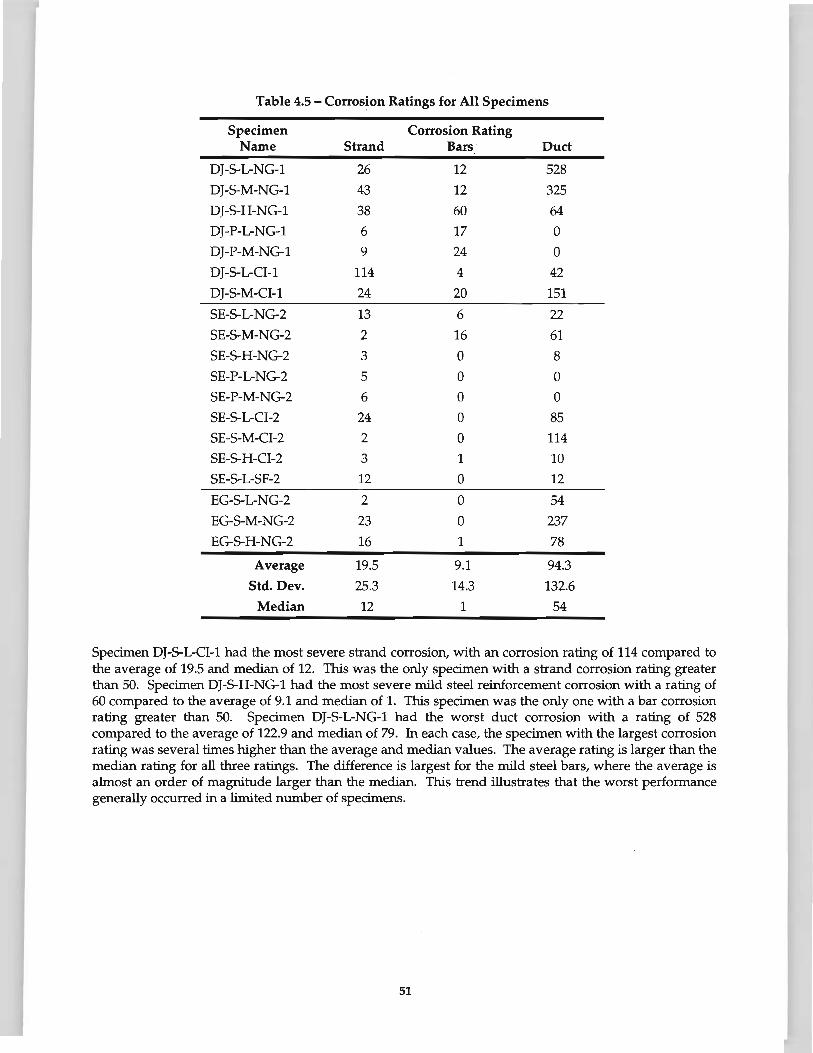
Table 4.5- Corrosion Ratings for All Specimens
Specimen Corrosion Rating Name Strand Bars Duct
DJ-5-L-NG-1 26 12 528
DJ-5-M-NG-1 43 12 325
DJ-5-H-NG-1 38 60 64
DJ-P-L-NG-1 6 17 0
DJ-P-M-NG-1 9 24 0
DJ-5-L-CI-1 114 4 42
DJ-5-M-CI-1 24 20 151
SE-5-L-NG-2 13 6 22
SE-5-M-NG-2 2 16 61
SE-5-H-NG-2 3 0 8
SE-P-L-NG-2 5 0 0
SE-P-M-NG-2 6 0 0
SE-5-L-CI-2 24 0 85
SE-5-M-CI-2 2 0 114
SE-5-H-CI-2 3 1 10
SE-5-L-SF-2 12 0 12
EG-5-L-NG-2 2 0 54
EG-5-M-NG-2 23 0 237
EG-5-H-NG-2 16 1 78
Average 19.5 9.1 94.3
Std. Dev. 25.3 14.3 132.6
Median 12 1 54
Specimen DJ-5-L-CI-1 had the most severe strand corrosion, with an corrosion rating of 114 compared to the average of 19.5 and median of 12. This was the only specimen with a strand corrosion rating greater than 50. Specimen DJ-5-H-NG-1 had the most severe mild steel reinforcement corrosion with a rating of 60 compared to the average of 9.1 and median of 1. This specimen was the only one with a bar corrosion rating greater than 50. Specimen DJ-5-L-NG-1 had the worst duct corrosion with a rating of 528 compared to the average of 122.9 and median of 79. In each case, the specimen with the largest corrosion rating was several times higher than the average and median values. The average rating is larger than the median rating for all three ratings. The difference is largest for the mild steel bars, where the average is almost an order of magnitude larger than the median. This trend illustrates that the worst performance generally occurred in a limited number of specimens.
51
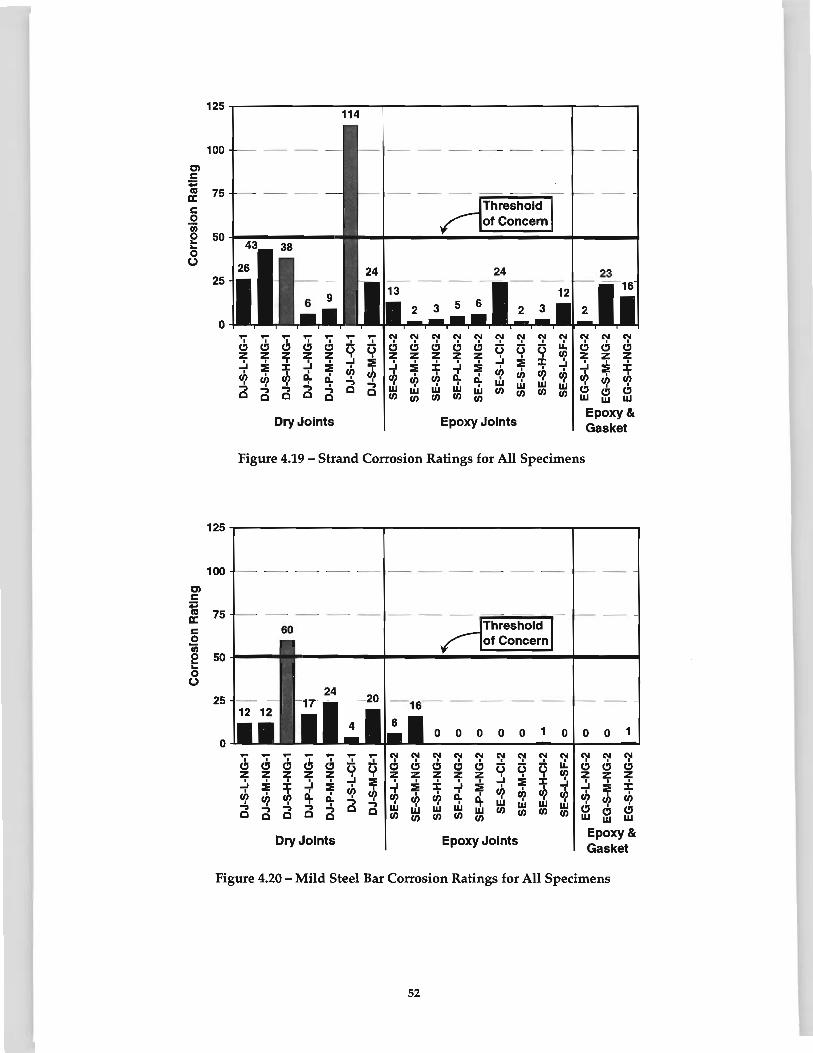
C) c ;:: Ill a: c 0 ii) 0 .. .. 0 0
C) c ;:: Ill a: c 0 ii) e .. 0 0
125
100
75
50
25
0
125
100
75
50
25
0
... ... ... ... ... ";" ... N I I I 6 6 I I
(!) (!) (!) Q Q (!) z z z z z z
I I I I I ...I :IE I ...I :IE :r: ...I :IE I
I ...I I I I Ul I
Ul I
Ul ~ I Ul Ul Ul 0. I
.., .., .., .., .., .., .., 0 0 w 0 0 0 0 0 U)
Dry Joints
Cll Cll Cll N Cll N
6 I (!) (!) (!) 0 Q z z z z ..:. I I I I :IE :IE :r: ...1 :IE I
th I I Ul I
Ul 0. I
Ul 0. I I I w w w w w w U) U) U) U) U) U)
Epoxy Joints
Cll :L Q Ul :r: ...I
~ I
Ul w w U) U)
~ ~ ~ (!) (!) (!)
:it :it :it ...I :IE :r: ~ ~ ~ ffi ffi ffi Epoxy& Gasket
Figure 4.19 - Strand Corrosion Ratings for All Specimens
60
0 0 0 0 0 1 0 0 0 1
... ... ... ... ... ";" ";" Cll Cll N Cll Cll Cll Cll Cll :L Cll Cll N I I I I I I I
(!) (!) (!) (!) (!) 0 Q (!) (!) (!) (!) (!) 0 0 0 (!) (!) (!) z z z z z I z z z z z I I I ~ z z z
I I I I I ...I :IE I I I ..:. I ...I :IE :r: I I ± ...I :::IE :r: ...I :::IE I I ...I :::IE :r: :IE I
I I I ...I :::IE I I I I I Ul Ul
I I I I I Ul Ul Ul Ul ~ I
~ Ul Ul Ul 0. 0. Ul Ul Ul 0. 0. Ul I I
.., .., I I w w w w .., .., .., .., .., 0 0 w w w w w U) U) U) U)
(!) (!) (!) 0 0 0 0 0 U) U) U) U) U) w w w
Dry Joints Epoxy Joints Epoxy& Gasket
Figure 4.20 -Mild Steel Bar Corrosion Ratings for All Specimens
52

125
100 C) c ;:; as 75 a: c 0 iii 0 50 ... ... 0 0
25
0 - - - - - - ";'" ~ N ~ N N ~ ~ ~ N
6 I I I I I I 6 I I
~ ~ ~ ~ Q Q ~ ~ ~ ~ Q Q Q IL z z z z z z z z z z Ill I I I I I ..J :::e ..J ::!: * ..J ::!: ..J :::e J: ..J ..J :::e J: ..J :::e I I I I I I I
I I I
D.. tn Ill cQ cQ I
D.. tn Ill Ill Ill Ill Ill Ill D. I Ill D. I I I
'"') '"') I I w w w w '"') '"') '"') '"') '"') c c w w w w w tn tn c c c c c tn tn tn tn tn tn tn
Dry Joints Epoxy Joints
Figure 4.21 - Duct Corrosion Ratings for All Specimens
4.4.21 Chloride Analysis
~ ~ ~ ~ ~ ~ z z z -t ::!: i "' ~ u_, ~ ~ ~ w w w Epoxy& Gasket
Concrete powder samples were collected from six dry joint specimens and four epoxy joint specimens for chloride analysis (procedure described in Section 4.1.2). In addition, samples were collected from the grout in these specimens for chloride analysis. Concrete chloride ion profiles for these ten specimens are included in Reference 11.
The chloride ion profiles in the concrete revealed distinct trends in chloride ion penetration in dry joint and epoxy joint specimens. In general, the dry joint specimens showed significantly higher chloride contents adjacent to the joint in comparison to measurements away from the joint. In the epoxy joint specimens, the chloride profiles were essentially the same near and away from the joint. Typical profiles are show in Figure 4.22 and Figure 4.23 for specimens D}-S-L-NG-1 and SE-S-L-NG-2. Values plotted in the figures are acid soluble chloride levels, expressed as a percentage of concrete weight. The chloride threshold for corrosion is indicated in the figures at 0.033%. This value is intended as a guideline only, and is based on the widely accepted chloride threshold value of 0.2% of the weight of cement.23 In the dry joint specimens, the chloride contents were well above the corrosion threshold over the depth of the specimen. In some cases, chloride contents at 51 mm from the joint were higher in the dry joint specimens in comparison to those with epoxy joints. Samples collected at location C, 108 mm from the joint, showed negligible chloride levels in both dry and epoxy joint specimens.
The chloride profile near the joint for specimen D}-S-L-CI-1 was very low in comparison to the other dry joint specimens tested, as shown in Figure 4.24. During the autopsy process, it was discovered that a significant grout leak had occurred at the joint in this specimen. Approximately 80% of the dry joint face was covered with grout, and in essence this joint became a thin mortar joint. The presence of grout in the joint could explain the lower chloride penetration at the joint in comparison to the other dry joint specimens.
The chloride profile for specimen SE-S-M-NG-2 displays a discontinuity in the measurements adjacent to the joint, as shown in Figure 4.25. Chloride measurements near and away from the joint decrease to zero by mid-height of the specimen. However, chloride levels increase dramatically at the level of the mild
53

steel bars near the joint. This discontinuity could be dismissed as an error in sampling or testing, however, in this case, corrosion was found on the mild steel at this location, suggesting the results are valid. Three possible explanations may account for this:
1. The chloride measurements at mid-height and the level of the strand are in error. This scenario is unlikely, since chloride profiles measured for other epoxy joint specimens do not indicate increased penetration of chlorides at the joint, and all show chloride levels decreasing rapidly to zero over the height of the specimen.
2. The concrete or mild steel bars were contaminated with chlorides prior to or during construction. This contamination is unlikely since construction was performed under carefully controlled conditions.
3. Saltwater leakage from the ponded area ran down the exterior of the specimen to the bottom where it entered the concrete. The top surface and sides of the specimen are sealed with epoxy according to AS1M G10912 requirements, while the bottom is not. This mechanism is common in bridges, and the epoxy sealant on the top and sides would amplify the effect leading to increased chloride levels near the bottom surface. This situation is the most likely explanation for the increased chloride levels and mild steel corrosion.
-E E -..c -a. Q) Q Q) -Q) ... (,) c 0 0
0.0%
0
25
50
75
100
125
150
Acid Soluble Chloride Content (% by weight of concrete)
0.1%
I I I
0.2%
I ,
~ cr Threshold for Corrosion
\ \ \ \
0.3% 0.4% 0.5%
Level of Strand
-108 mm from joint -51 mm from joint --13 mm from joint
Level of Bars
Figure 4.22- Concrete Chloride Ion Profiles for Specimen DJ-S-L-NG-1
54
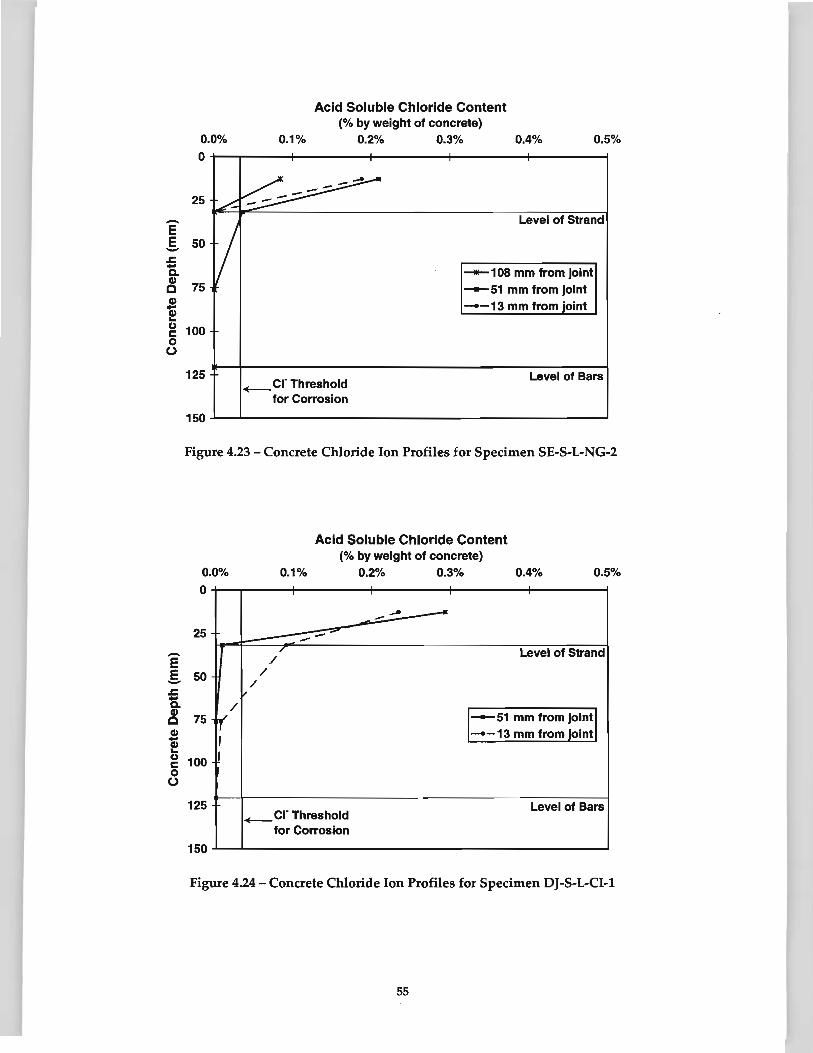
-E E -.s:. ... c. Q)
c Q)
a; ... u c 0 0
-E E -.s:. ... c. Q)
c Q) ... CD ... u c 0 0
0.0%
0
25
50
75
100
125
150
Acid Soluble Chloride Content (% by weight of concrete)
0.1%
+--Cr Threshold for Corrosion
0.2% 0.3% 0.4% 0.5%
Level of Strand
-108 mm from joint -s1 mm from joint --13 mm from joint
Level of Bars
Figure 4.23 -Concrete Chloride Ion Profiles for Specimen SE-S-L-NG-2
0.0%
0
25
50
/ 75 rr'
I 100
125
150
Acid Soluble Chloride Content (% by weight of concrete)
0.1% 0.2% 0.3% 0.4% 0.5%
_. -~-
/ Level of Strand /
/ / v
~~51 mmfromjoln~~ --13 mm from joint
+--cr Threshold Level of Bars
for Corrosion
Figure 4.24- Concrete Chloride Ion Profiles for Specimen DJ-S-L-CI-1
55
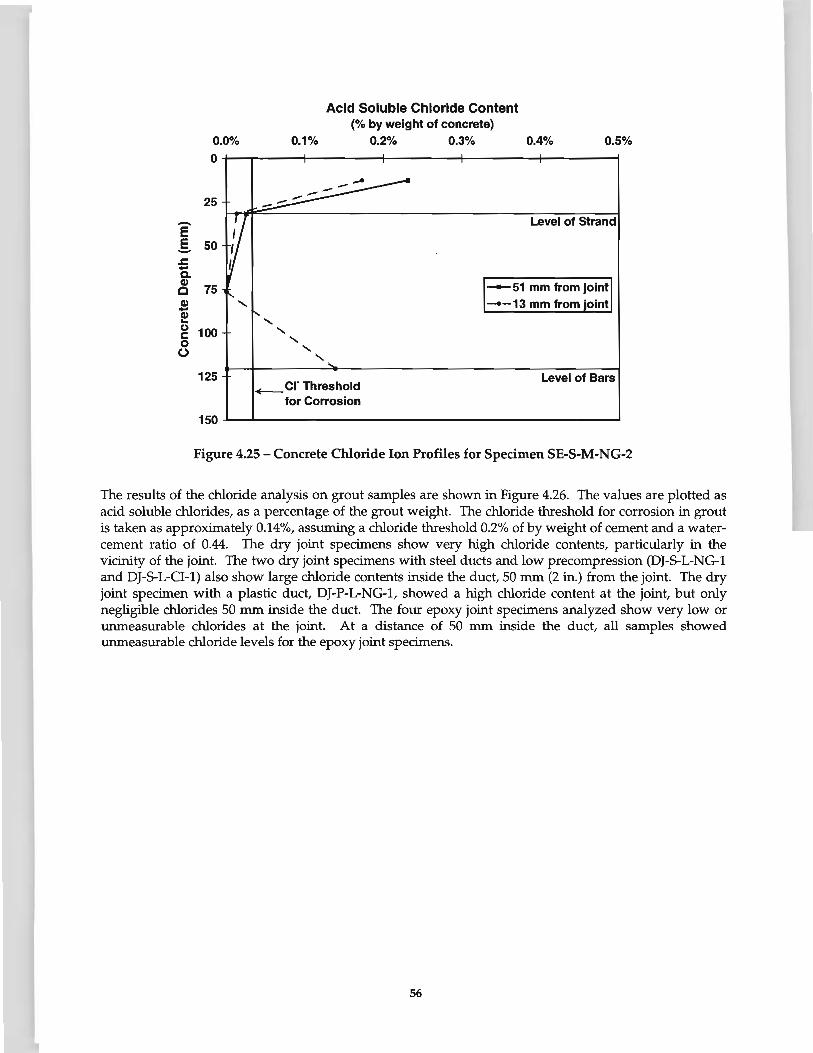
-E E -.c -c. Q) Q Q)
G) ... (.) c 0 0
0.0% 0
25
50
75
100
125
150
' '
0.1%
' ' '
Acid Soluble Chloride Content (% by weight of concrete)
0.2% 0.3%
+---cr Threshold for Corrosion
0.4% 0.5%
Level of Strand
Level of Bars
Figure 4.25 -Concrete Chloride Ion Profiles for Specimen SE-S-M-NG-2
The results of the chloride analysis on grout samples are shown in Figure 4.26. The values are plotted as acid soluble chlorides, as a percentage of the grout weight. The chloride threshold for corrosion in grout is taken as approximately 0.14%, assuming a chloride threshold 0.2% of by weight of cement and a watercement ratio of 0.44. The dry joint specimens show very high chloride contents, particularly in the vicinity of the joint. The two dry joint specimens with steel ducts and low precompression (DJ-5-L-NG-1 and DJ-5-L-CI-1) also show large chloride contents inside the duct, 50 mm (2 in.) from the joint. The dry joint specimen with a plastic duct, DJ-P-L-NG-1, showed a high chloride conten t at the joint, but only negligible chlorides 50 mm inside the duct. The four epoxy joint specimens analyzed show very low or unmeasurable chlorides at the joint. At a distance of 50 mm inside the duct, all samples showed unmeasurable chloride levels for the epoxy joint specimens.
56

0.0% 0.1%
Acid Soluble Chloride Content (% by weight of grout)
0.2% 0.3% 0.4% 0.5% 0.6%
DJ-S-L-NG-1 liiiiiiiiliiiiiiiiliiiiiiiliiiiiiiiiliii DJ-S-M-NG-1
DJ-S-H-NG-1
DJ-P-L-NG-1
DJ-S-M-CI-1 •At Joint
SE-8-L-NG-2 0 50 mm from Joint
SE-S-M-NG-2 ·--
SE-S-H-NG-2
EG-S-L-NG-2 lcorros ?n Thresh~ld 0.14% l j
Figure 4.26- Measured Chloride Contents in Post-tensioning Grout
57
0.7%

58
Chapter 5: Analysis and Discussion of Results
The effect of many of the variables investigated in this testing program can be demonstrated based on nearly four and a half years of severe exposure test data and the thorough forensic examination of each specimen type. The discussion of results in this chapter describes the effect of the test variables.
5.1 OVERALL PERFORMANCE
The performance of the macrocell corrosion specimens in this testing program is very good. After four years and five months of testing, only twelve of thirty-eight specimens displayed any corrosion activity. Computed values of weighted average corrosion current are well below the failure value proposed by AS1M G109. Forensic examination of each specimen type revealed that corrosion damage to prestressing strand and mild steel reinforcement was not severe. Only one prestressing strand was found to have pitting corrosion, and no mild steel bars were found to have measurable area reduction. Similar testing programs using macrocell corrosion specimens normally report severe corrosion damage and specimen failure in less than four and a half years. Part of a corrosion study on epoxy-coated reinforcement at The University of Texas at Austin24 used modified macrocell corrosion specimens. Severe corrosion damage indicated by concrete cracking and rust staining was observed in less than three years of testing. Testing was concluded after four and a half years of exposure due to severe deterioration in some specimens.
The main objective for this testing program was to examine corrosion protection for internal prestressing tendons in precast segmental bridges. The relative performance of the specimens in this testing program can be seen by looking at the corrosion ratings for the prestressing strand, ordered from lowest to highest. This data is plotted in Figure 5.1. At the top half of the list are standard epoxy joints and dry joints with plastic ducts. At the bottom of the list are dry joints, two of the three epoxy I gasket joints and one of the epoxy joints with corrosion inhibitor in the grout.
59
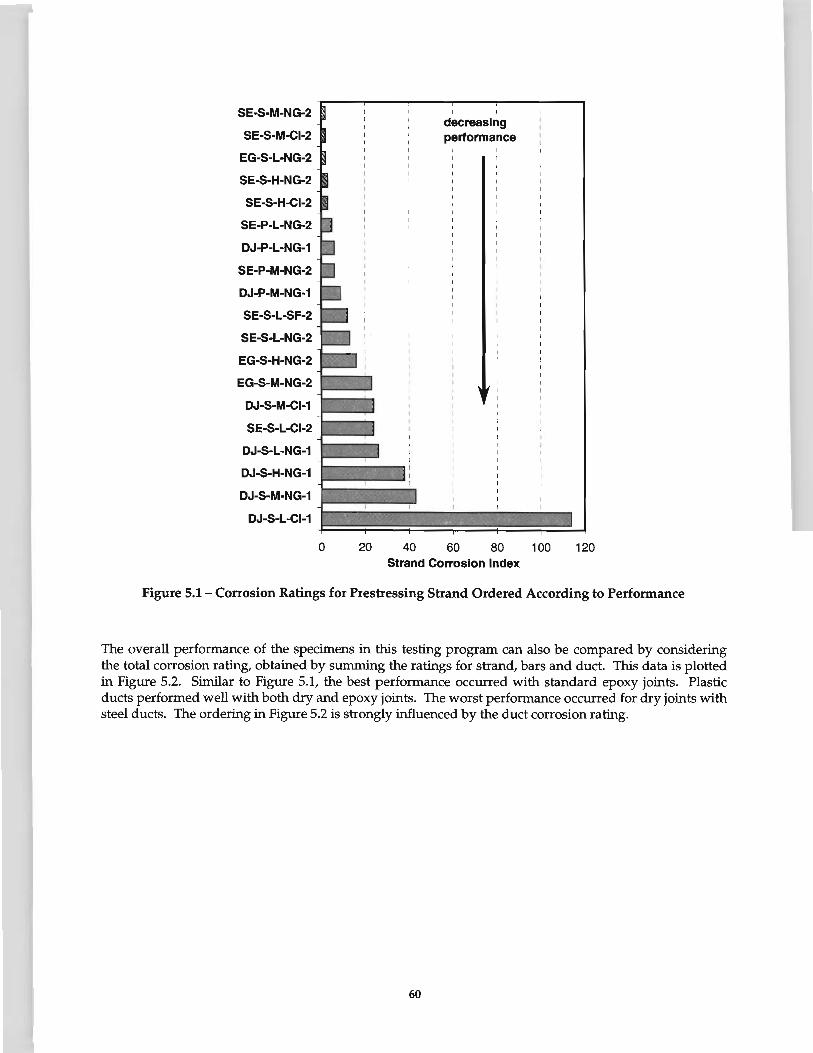
SE-5-M-NG-2
SE-S-M-CI-2
EG-S-L-NG-2
SE-5-H-NG-2
SE-S-H-CI-2
SE-P-L-NG-2
DJ-P-L-NG-1
SE-P-M-NG-2
DJ-P-M-NG-1
SE-S·L·SF-2
SE-5-L-NG-2
EG-5-H-NG-2
EG-5-M-NG-2
DJ-5-M-CI-1
SE-S-L-CI-2
DJ-S-L-NG-1
DJ-5-H-NG-1
DJ-5-M-NG-1
DJ-S-L-CI-1
0 20 40
decreasing performance
60 80 Strand Corrosion Index
100 120
Figure 5.1 - Corrosion Ratings for Prestressing Strand Ordered According to Performance
The overall performance of the specimens in this testing program can also be compared by considering the total corrosion rating, obtained by summing the ratings for strand, bars and duct. This data is plotted in Figure 5.2. Similar to Figure 5.1, the best performance occurred with standard epoxy joints. Plastic ducts performed well with both dry and epoxy joints. The worst performance occurred for dry joints with steel ducts. The ordering in Figure 5.2 is strongly influenced by the duct corrosion rating.
60
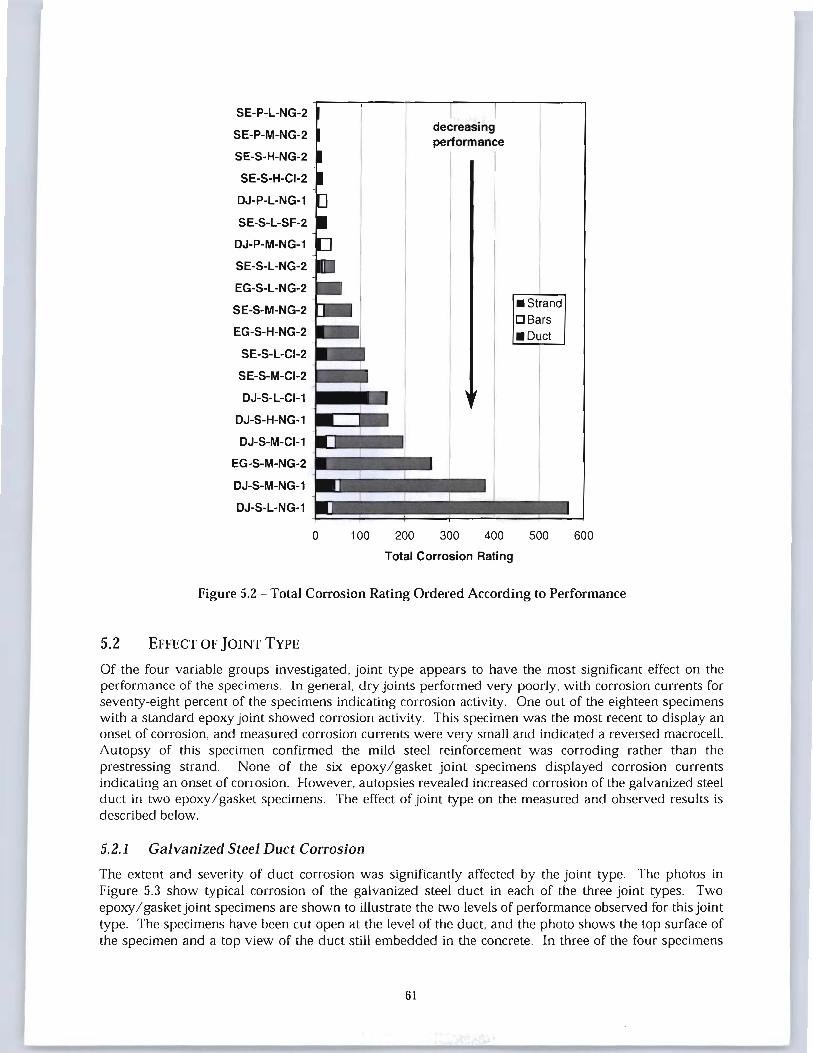
SE-P-L-NG-2
SE-P-M-NG-2
SE-S-H-NG-2
SE-S-H-CI-2
DJ-P-L-NG-1
SE-S-L-SF-2
DJ-P-M-NG-1
SE-S-L-NG-2
EG-S-L-NG-2
SE-S-M-NG-2
EG-S-H-NG-2
SE-S-L-CI-2
SE-S-M-CI-2
DJ-S-L-CI-1
DJ-S-H-NG-1
DJ-S-M-CI-1
EG-S-M-NG-2
DJ-5-M-NG-1
DJ-S-L-NG-1
0 100 200
decreasing performance
300 400
Total Corrosion Rating
•Strand DBars •Duct
500 600
Figure 5.2 - Total Corrosion Rating Ordered According to Performance
5.2 EFFECT OF jOINT TYPE
Of the four variable groups investigated, joint ty pe appears to have the most significant effect on the performance of the specimens. In general, dry joints performed very poorly, with corrosion currents for seventy-eight percent of the specimens indicating corrosion activity. One out of the eighteen specimens with a standard epoxy joint showed corrosion activity. This specimen was the most recent to display an onset of corrosion, and measured corrosion currents were very small and indicated a reversed macrocell. Autopsy of this specimen confirmed the mild steel reinforcement was corroding rather than the prestressing strand. None of the six epoxy I gasket joint specimens displayed corrosion currents indicating an onset of corrosion. However. autopsies revealed increased corrosion of the galvanized steel duct in two epoxy/gasket specimens. The effect of joint type on the measured and observed results is described below.
5.2.1 Galvanized Steel Duct Corrosion
The extent and severity of duct corrosion was significantly affected by the joint type. The photos in Figure 5.3 show typical corrosion of the galvanized steel duct in each of the three joint types. Two epoxy I gasket joint specimens are shown to illustrate the two levels of performance observed for this joint type. The specimens have been cut open at the level of the duct, and the photo shows the top surface of the specimen and a top view of the duct still embedded in the concrete. In three of the four specimens
61

shown, the top surface of the concrete had a longitudinal crack due to corrosion (the crack has been highlighted in the photo) . The black arrow indicates the location of the segmental joint.
In general. the duct corroded area and corrosion severity were less for epoxy joints and corrosion induced cracking on the concrete surface was more severe for dry joints. Duct corrosion was centered on the segmental joint in all of the dry joint specimens. Corrosion was not centered on the joint in the standard epoxy joint, suggesting corrosion was caused by moisture and chloride migration through the concrete with no discernible influence from the joint. Two of the three epoxy I gasket joint specimens autopsied indicated that the gasket interfered with epoxy coverage in the vicinity of the duct. When the joint was sound, the duct corrosion in the epoxy/ gasket joint was less severe than the dry joints and was not centered on the joint. similar to the standard epoxy joint. However, when epoxy coverage was not complete the corrosion was severe and led to concrete cracking. Duct corrosion was centered on the joint, suggesting that moisture and chlorides penetrated at the joint. These results indicate that the standard epoxy joint consistently provides the best corrosion protection and is less likely influenced by quality control in the construction process. The results also indicate that the complications introduced in the process by adding gaskets are counter productive since corrosion resistance was reduced when compared to the epoxy joint without a gasket.
Dry Joint Epoxy joint
Sound Epoxy/ GasketJoint Poor Epoxy / Gasket Joint
Figure 5.3 - Galvanized Steel Duct Corrosion: Effect of joint Type
5.2.2 Prestressing Strand Corrosion
Macrocell corrosion current data measured during exposure testing indicated that corrosion of the prestressing strand was only occurring in four dry joint specimens. The prestressing strand corrosion found during the forensic examination would be considered very mild or negligible for all specimens with the exception of specimen DJ-S-L-CI-1 (dry joint, steel duct, low precompression. corrosion inhibitor grout) . In general, 'the strand corrosion found in the dry joint specimens was worse than in the epoxy
62

joint specimens (see Figure 5.1). light to moderate surface corrosion was found on the strand in all of the dry joint specimens where galvanized steel ducts were used. In the standard epoxy and epoxy I gasket joints, corrosion ratings for most specimens were very low (less than 10). Corrosion ratings higher than ten resulted primarily from discoloration on the strand. Patches of light strand corrosion were found in only three of the twelve epoxy joint specimens, and no moderate or pitting corrosion was found.
5.2.3 Mild Steel Reinforcement Corrosion
Corrosion current data indicated that corrosion of mild steel reinforcement was occurring in seven dry joint specimens and one standard epoxy joint specimen. Forensic examination revealed reinforcing bar corrosion in all of the dry joint specimens, one small area of discoloration in two epoxy joint specimens and light corrosion in two epoxy joint specimens. Two-thirds of the epoxy joint specimens had no discoloration or corrosion of the mild steel bars. The highest mild steel corrosion rating for epoxy joint specimens occurred in Specimen SE-5-M-NG-2. This epoxy joint specimen was the only one where corrosion currents indicated activity during exposure testing. The measured chloride profile for this specimen (see Section 4.4.21 and Figure 4.25) suggests that elevated chloride levels at the bottom of the specimen resulted from an external source of moisture and chlorides, rather than from penetration at the epoxy joint or through the concrete.
5.2.4 Chloride Penetration
Chloride penetration was higher for dry joint specimens in all cases. Measured chloride ion profiles indicated chloride contents in excess of the corrosion threshold in the vicinity of the dry joints. Chloride profiles adjacent to the joint and away from the joint were similar in the epoxy joint specimens, suggesting no influence from the joint. Crystalline salt deposits were observed on the interior of the ducts in the dry joint specimens, clearly indicating moisture and chlorides had penetrated through the joint. Chloride analysis performed on samples from the grout showed very high chloride contents for dry joint specimens, even at distances of 50 mm (2 in.) from the joint. Grout chloride contents in epoxy joint specimens were very low or negligible. While dry joints are not permitted with internal tendons, this penetration of chlorides through the dry joint faces could result in accelerated corrosion of the mild steel reinforcement near the joint face when used with external tendons.
5.2.5 Grouting
Grout leaked into the joint region in five of the seven dry joint specimens. The extent of the leak ranged from very minor around the duct opening to almost 80% of the joint face covered with grout. No grout leakage was found in the standard epoxy joint and epoxy I gasket joint specimens.
5.3 EFFEcr OF Ducr TYPE
5.3.1 Duct Corrosion
Galvanized steel ducts were corroded in all cases. Duct corrosion led to concrete cracking on the top surface of the specimen in eight of the fifteen specimens with galvanized steel ducts. No cracks were found in specimens with plastic ducts. Galvanized steel ducts were perforated by corrosion action in nine of fifteen specimens, allowing direct ingress of moisture and chlorides. Plastic ducts were not affected by exposure testing and remained intact as a barrier in the corrosion protection system.
The concrete cover in these specimens was lower than would be allowed by specification, and this condition contributed to the severe galvanized duct corrosion in a short period of time. However, the test results indicate the potential corrosion problems when using galvanized ducts in aggressive exposures. The relative performance of the galvanized and plastic ducts is not affected by the low cover, and plastic ducts performed extremely well in spite of the small cover.
63
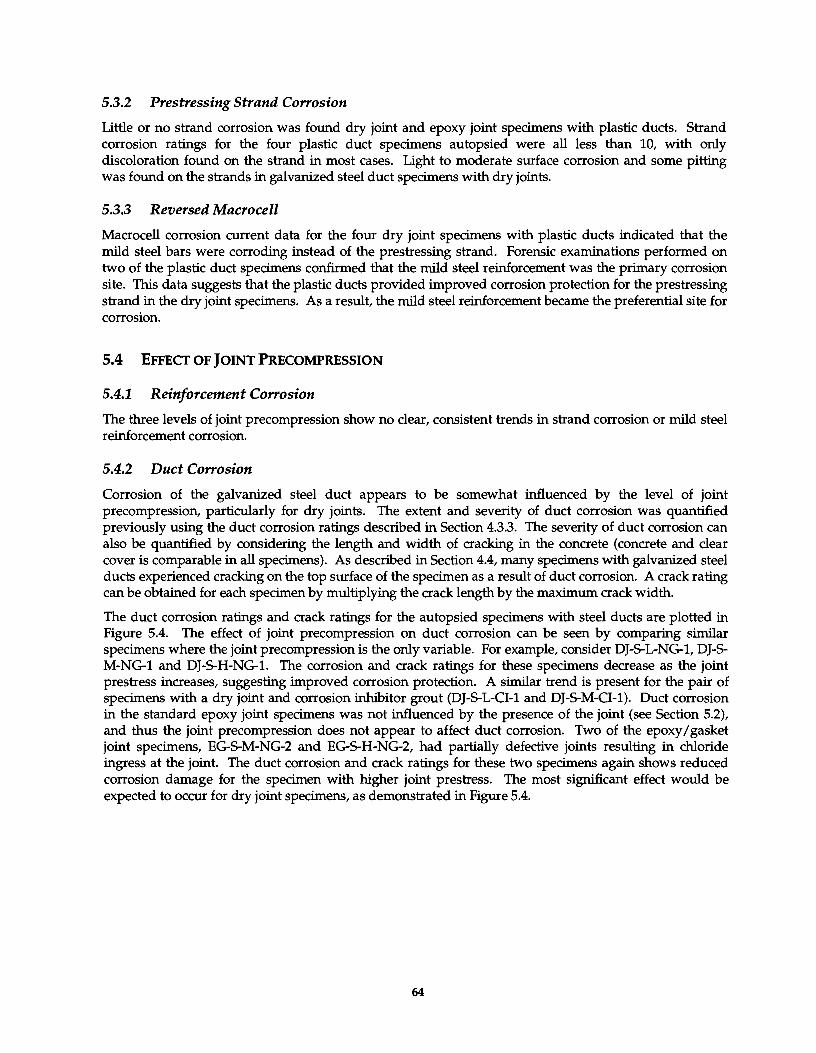
5.3.2 Prestressing Strand Corrosion
little or no strand corrosion was found dry joint and epoxy joint specimens with plastic ducts. Strand corrosion ratings for the four plastic duct specimens autopsied were all less than 10, with only discoloration found on the strand in most cases. light to moderate surface corrosion and some pitting was found on the strands in galvarrized steel duct specimens with dry joints.
5.3.3 Reversed Macrocell
Macrocell corrosion current data for the four dry joint specimens with plastic ducts indicated that the mild steel bars were corroding instead of the prestressing strand. Forensic examinations performed on two of the plastic duct specimens confirmed that the mild steel reinforcement was the primary corrosion site. This data suggests that the plastic ducts provided improved corrosion protection for the prestressing strand in the dry joint specimens. As a result, the mild steel reinforcement became the preferential site for corrosion.
5.4 EFFECf OF JOINT PRECOMPRESSION
5.4.1 Reinforcement Corrosion
The three levels of joint precompression show no clear, consistent trends in strand corrosion or mild steel reinforcement corrosion.
5.4.2 Duct Corrosion
Corrosion of the galvanized steel duct appears to be somewhat influenced by the level of joint precompression, particularly for dry joints. The extent and severity of duct corrosion was quantified previously using the duct corrosion ratings described in Section 4.3.3. The severity of duct corrosion can also be quantified by considering the length and width of cracking in the concrete (concrete and clear cover is comparable in all specimens). As described in Section 4.4, many specimens with galvarrized steel ducts experienced cracking on the top surface of the specimen as a result of duct corrosion. A crack rating can be obtained for each specimen by multiplying the crack length by the maximum crack width.
The duct corrosion ratings and crack ratings for the autopsied specimens with steel ducts are plotted in Figure 5.4. The effect of joint precompression on duct corrosion can be seen by comparing similar specimens where the joint precompression is the only variable. For example, consider DJ-5-L-NG-1, DJ-5-M-NG-1 and DJ-5-H-NG-1. The corrosion and crack ratings for these specimens decrease as the joint prestress increases, suggesting improved corrosion protection. A similar trend is present for the pair of specimens with a dry joint and corrosion inhibitor grout (DJ-5-L-CI-1 and DJ-5-M-CI-1). Duct corrosion in the standard epoxy joint specimens was not influenced by the presence of the joint (see Section 5.2), and thus the joint precompression does not appear to affect duct corrosion. Two of the epoxy I gasket joint specimens, EG-5-M-NG-2 and EG-5-H-NG-2, had partially defective joints resulting in chloride ingress at the joint. The duct corrosion and crack ratings for these two specimens again shows reduced corrosion damage for the specimen with higher joint prestress. The most significant effect would be expected to occur for dry joint specimens, as demonstrated in Figure 5.4.
64
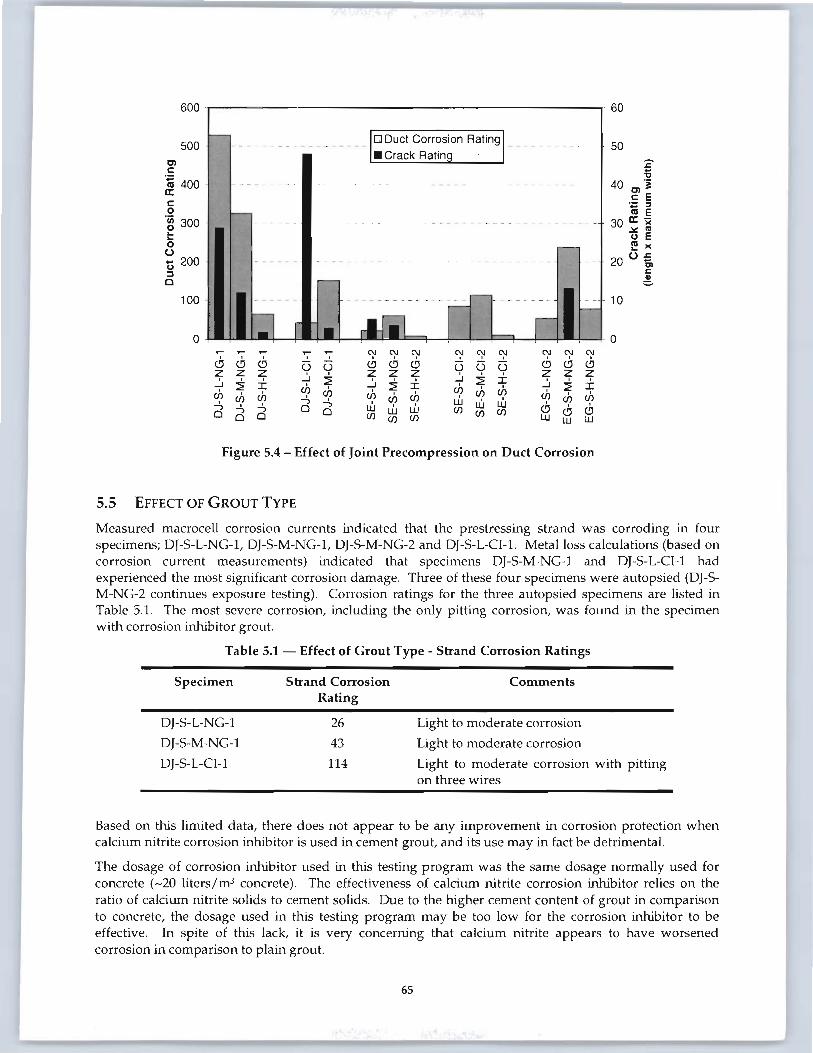
600 60
1-- IQ Duct Corrosion Rating I 500 - - - - - -- - - - - 50 Dl
• Crack Rating :2 c: ;;
iii 400 - - ----- -- -- - . -- - -- - - - . - - - - -- 40 Dl'i a: c: .!: E
iii :I 0 t-- E 'iii 300 - - - -- - - - .. - --- - - - - - -- - .. - - - - 30 a: ')( 0 ~ Ill ... (J E ... 0 - m )( (.) ... u 200 . - -- - - - - ------ -. -- - ----- --- --------- - - - 20 (.) ~ ::J c c :-- ~
100 - - - - -- - - --- - . -- -- r- - -- - -- - --- 10
1.1 I -
0 r • rlfll ,__...., I 0 .- .- .- .- .- ~ N ~ ~ ~ ~ N ~ N
<.!J ' <.!J ' ...!. 0 0 0 <!) 0 y <!) <!) u 0 0 CJ z z ~ ~ z z z ~ ~ ± z z z ~ ~ ~ ~ ~ ± ~ ~ ± ::r: ch ch ch ch ch ch ch ch rh if> ch 0 if> 0 ...; ...; ...; uJ uJ uJ uJ 0
...; ...; 0 0 uJ uJ (f) (f) (f) CJ <.!J CJ 0 0 (f) (f) (f) w w w
Figure 5.4- Effect of Joint Precompression on Duct Corrosion
5.5 EFFECT OF GROUT TYPE
Measured macrocell corrosion currents indicated that the prestressing strand was corroding in four specimens; OJ-S-L-NG-1, DJ-S-M-NG-1, DJ-S-M-NG-2 and DJ-S-L-CI-1. Metal loss calculations (based on corrosion current measurements) indicated that specimens OJ-S-M-NG-1 and DJ-S-L-CI-1 had experienced the most significant corrosion damage. Three of these four specimens were autopsied (DJ-SM-NG-2 continues exposure testing). Corrosion ratings for the three autopsied specimens are listed in Table 5.1. The most severe corrosion, including the only pitting corrosion, was found in the specimen with corrosion inhibitor grout
Table 5.1- Effect of Grout Type- Strand Corrosion Ratings
Specimen
DJ-S-L-NG-1
DJ-S-M-NG-1
DJ-S-L-CI-1
Strand Corrosion Rating
26
43
114
Comments
Light to moderate corrosion
Light to moderate corrosion
Light to moderate corrosion with pitting on three wires
Based on this limited data, there does not appear to be any improvement in corrosion protection when calcium nitrite corrosion inhibitor is used in cement grout, and its use may in fact be detrimental.
The dosage of corrosion inhibitor used in this testing program was the same dosage normally used for concrete (- 20 liters/m3 concrete). The effectiveness of calcium nitrite corrosion inhibitor relies on the ratio of calcium nitrite solids to cement solids. Due to the higher cement content of grout in comparison to concrete, the dosage used in this testing program may be too low for the corrosion inhibitor to be effective. In spite of this lack, it is very concerning that calcium nitrite appears to have worsened corrosion in comparison to plain grout.
65
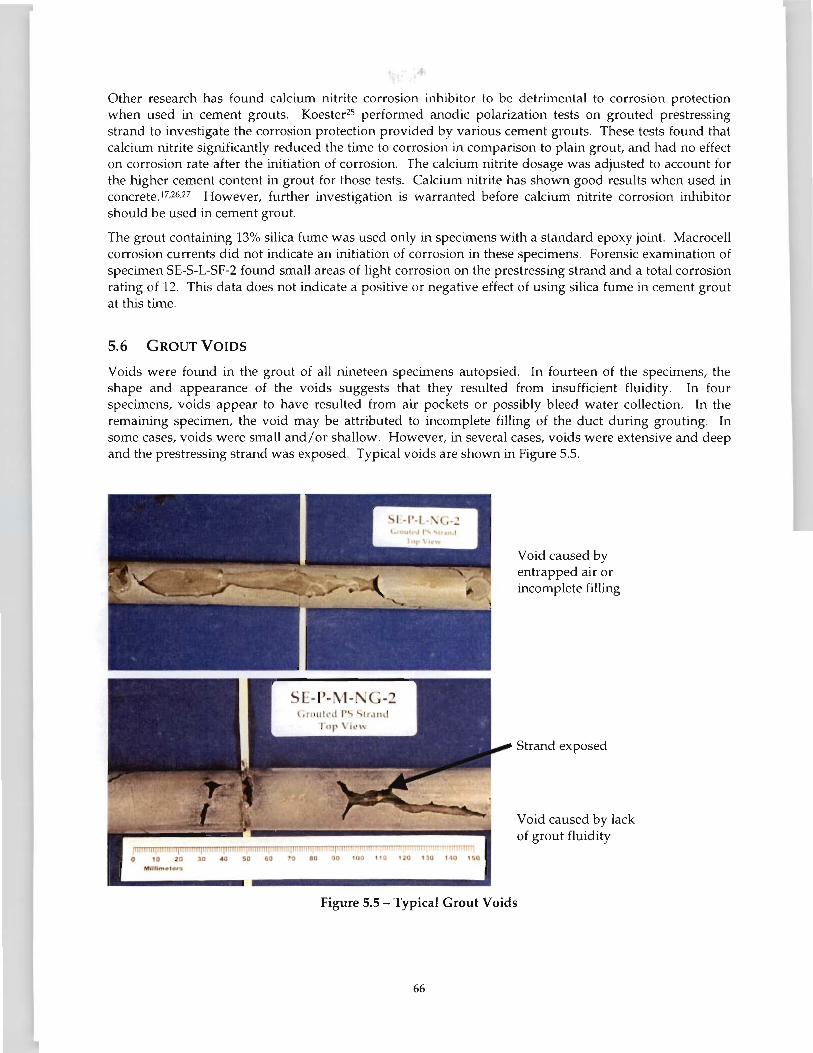
Other research has found calcium nitrite corrosion inhibitor to be detrimental to corrosion protection when used in cement grouts. Koester25 performed anodic polarization tests on grouted prestressing strand to investigate the corrosion protection provided by various cement grouts. These tests found that calcium nitrite significantly reduced the time to corrosion in comparison to plain grout, and had no effect on corrosion rate after the initiation of corrosion. The calcium nitrite dosage was adjusted to account for the higher cement content in grout for those tests. Calcium nitrite has shown good results when used in concrete.17·26·27 However, further investigation is warranted before calcium nitrite corrosion inhibitor should be used in cement grout.
The grout containing 13% silica fume was used only in specimens with a standard epoxy joint. Macrocell corrosion currents did not indicate an initiation of corrosion in these specimens. Forensic examination of specimen SE-S-L-SF-2 found small areas of light corrosion on the prestressing strand and a total corrosion rating of 12. This data does not indicate a positive or negative effect of using silica fume in cement grout at this time.
5.6 GROUT VOIDS
Voids were found in the grout of all nineteen specimens autopsied. In fourteen of the specimens, the shape and appearance of the voids suggests that they resulted from insufficient fluidity. In four specimens, voids appear to have resulted from air pockets or possibly bleed water collection. In the remaining specimen, the void may be attributed to incomplete filling of the duct during grouting. In some cases, voids were small and/ or shallow. However, in several cases, voids were extensive and deep and the prestressing strand was exposed. Typical voids are shown in Figure 5.5.
Void caused by entrapped air or incomplete filling
Strand exposed
Void caused by lack ofgrout fluidity
Figure 5.5 - Typical Grout Voids
66
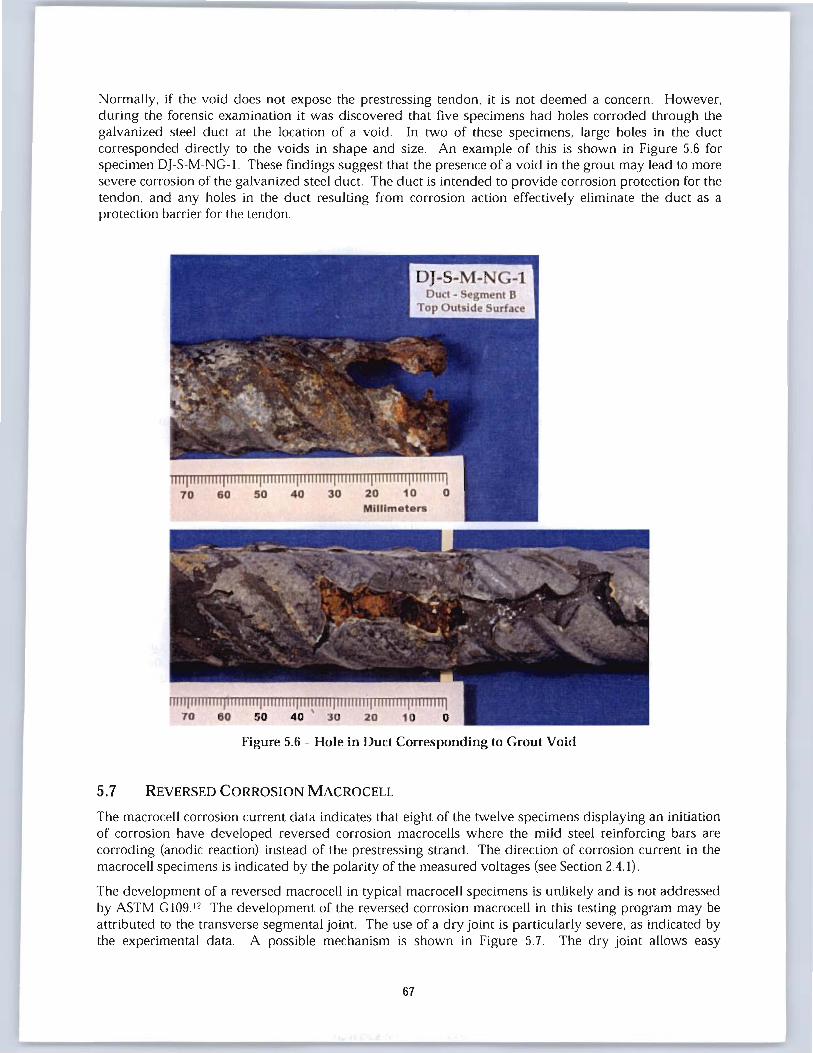
Normally, if the void does not expose the prestressing tendon. it is not deemed a concern. However, during the forensic examination it was discovered that five specimens had holes corroded through the galvanized steel duct at the location of a void. In two of these specimens, large holes in the duct corresponded directly to the voids in shape and size. An example of this is shown in Figure 5.6 for specimen DJ-S-M-NG-1. These findings suggest that the presence of a void in the grout may lead to more severe corrosion of the galvanized steel duct. The duct is intended to provide corrosion protection for the tendon, and any holes in the duct resulting from corrosion action effectively eliminate the duct as a protection barrier for the tendon.
mTiftiiiiiiiiJIIIIIIIIIJIIIIIIIIIJIIIIIIIIIJIIIIIIIIIJIIIIIIIIIjllillllilj 70 60 50 40 ' '30 20 1 0 0
Figure 5.6 - Hole in Duct Corresponding to Grout Void
5.7 REVERSED CORROSION MACROCELL
The macrocell corrosion current data indicates that eight of the twelve specimens displaying an initiation of corrosion have developed reversed corrosion macrocells where the mild steel reinforcing bars are corroding (anodic reaction) instead of the prestressing strand. The direction of corrosion current in the macrocell specimens is indicated by the polarity of the measured voltages (see Section 2.4.1).
The development of a reversed macrocell in typical macrocell specimens is unlikely and is not addressed by ASTM Gl09.12 The development of the reversed corrosion macrocell in this testing program may be attributed to the transverse segmental joint. The use of a dry joint is particularly severe, as indicated by the experimental data. A possible mechanism is shown in Figure 5.7. The dry joint allows easy
67
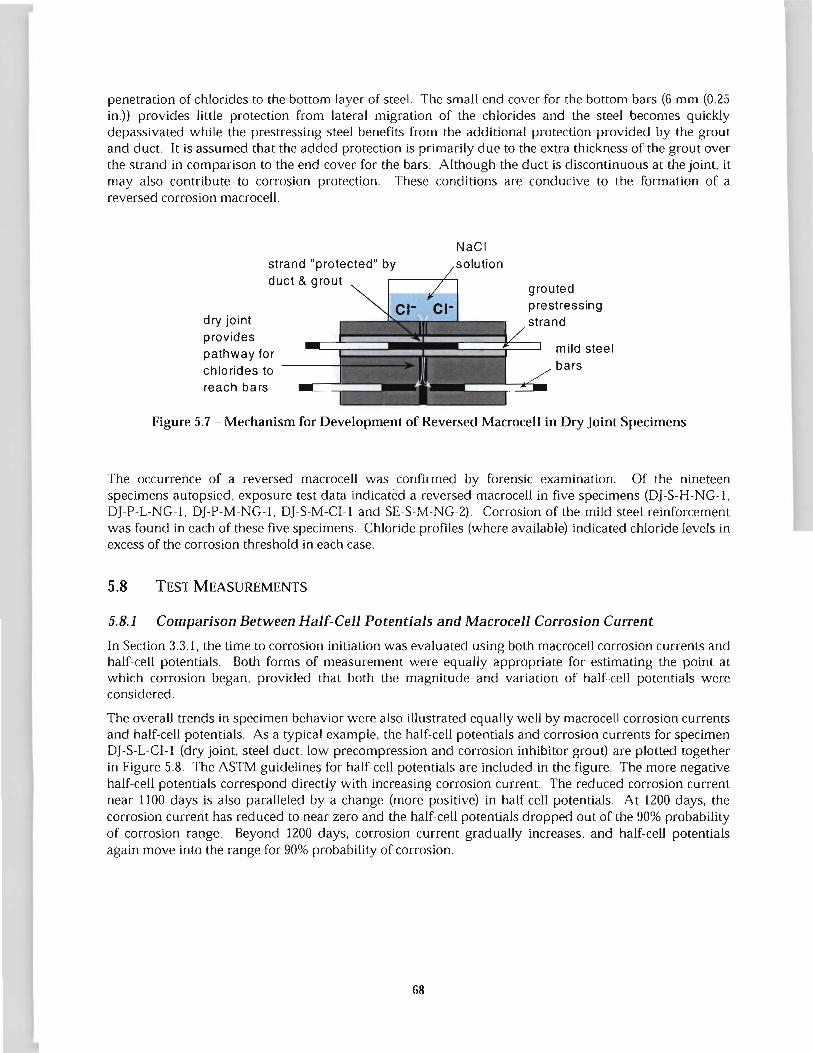
penetration of chlorides to the bottom layer of steel. The small end cover for the bottom bars (6 mm (0.25 in.)) provides little protection from lateral migration of the chlorides and the steel becomes quickly depassivated while the prestressing steel benefits from the additional protection provided by the grout and duct. It is assumed that the added protection is primarily due to the extra thickness of the grout over the strand in comparison to the end cover for the bars. Although the duct is discontinuous at the joint, it may also contribute to corrosion protection. These conditions are conducive to the formation of a reversed corrosion macrocell.
strand "protected" by duct & grout
dry joint provides pathway for chlorides to ---reach bars
NaCI solution
grouted prestressing strand
mild steel bars
Figure 5.7- Mechanism for Development of Reversed Macrocell in Dry joint Specimens
The occurrence of a reversed macrocell was confirmed by forensic examination. Of the nineteen specimens autopsied, exposure test data indicated a reversed macrocell in five specimens (DJ-S-H-NG-1, DJ-P-L-NG-1 , DJ-P-M-NG-1. DJ-S-M-CI-1 and SE-S-M-NG-2). Corrosion of the mild steel reinforcement was found in each of these five specimens. Chloride profiles (where available) indicated chloride levels in excess of the corrosion threshold in each case.
5.8 TEST MEASUREMENTS
5.8.1 Comparison Between Half-Cell Potentials and Macrocell Corrosion Current
In Section 3.3.1, the time to corrosion initiation was evaluated using both macrocell corrosion currents and half-cell potentials. Both forms of measurement were equally appropriate for estimating the point at which corrosion began, provided that both the magnitude and variation of half-cell potentials were considered.
The overall trends in specimen behavior were also illustrated equally well by macrocell corrosion currents and half-cell potentials. As a typical example, the half-cell potentials and corrosion currents for specimen DJ-S-L-CI-1 (dry joint, steel duct, low precompression and corrosion inhibitor grout) are plotted together in Figure 5.8. The ASTM guidelines for half-cell potentials are included in the figure. The more negative half-cell potentials correspond directly with increasing corrosion current. The reduced corrosion current near llOO days is also paralleled by a change (more positive) in half-cell potentials. At 1200 days, the corrosion current has reduced to near zero and the half-cell potentials dropped out of the 90% probability of corrosion range. Beyond 1200 days, corrosion current gradually increases, and half-cell potentials again move into the range for 90% probability of corrosion.
68
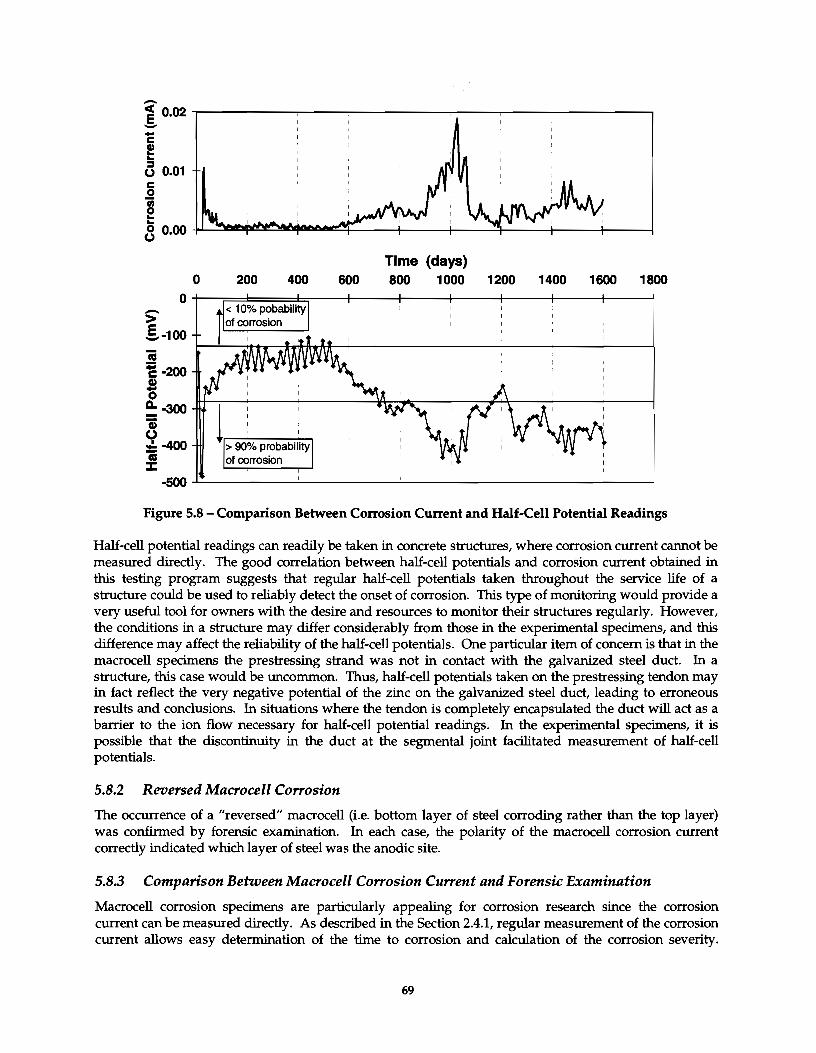
1 0.02 .,-----;---.,---.....,.-----.....,.----,..----------, -'E ~ a o.o1 g g 8 o.oo+L~~~~~~~~~-~--4--~~-4---~-~
Time (days) 200 600 800 1000 1200 1400 1600 1800 0
OT--r=d====~--~----~----r----r----+----+--~
400
> .S.-100
'ii ! -200
~ D. -300 a; (.) ~ -400
"' ::t:
l ~ I
' '
> 90% probability of corrosion
~oo~----~--------------------------~--------------~
Figure 5.8 - Comparison Between Corrosion Current and Half-Cell Potential Readings
Half-cell potential readings can readily be taken in concrete structures, where corrosion current cannot be measured directly. The good correlation between half-cell potentials and corrosion current obtained in this testing program suggests that regular half-cell potentials taken throughout the service life of a structure could be used to reliably detect the onset of corrosion. This type of monitoring would provide a very useful tool for owners with the desire and resources to monitor their structures regularly. However, the conditions in a structure may differ considerably from those in the experimental specimens, and this difference may affect the reliability of the half-cell potentials. One particular item of concern is that in the macrocell specimens the prestressing strand was not in contact with the galvanized steel duct. In a structure, this case would be uncommon. Thus, half-cell potentials taken on the prestressing tendon may in fact reflect the very negative potential of the zinc on the galvanized steel duct, leading to erroneous results and conclusions. In situations where the tendon is completely encapsulated the duct will act as a barrier to the ion flow necessary for half-cell potential readings. In the experimental specimens, it is possible that the discontinuity in the duct at the segmental joint facilitated measurement of half-cell potentials.
5.8.2 Reversed Macrocell Corrosion
The occurrence of a "reversed" macrocell (i.e. bottom layer of steel corroding rather than the top layer) was confirmed by forensic examination. In each case, the polarity of the macrocell corrosion current correctly indicated which layer of steel was the anodic site.
5.8.3 Comparison Between Macrocell Corrosion Current and Forensic Examination
Macrocell corrosion specimens are particularly appealing for corrosion research since the corrosion current can be measured directly. As described in the Section 2.4.1, regular measurement of the corrosion current allows easy determination of the time to corrosion and calculation of the corrosion severity.
69
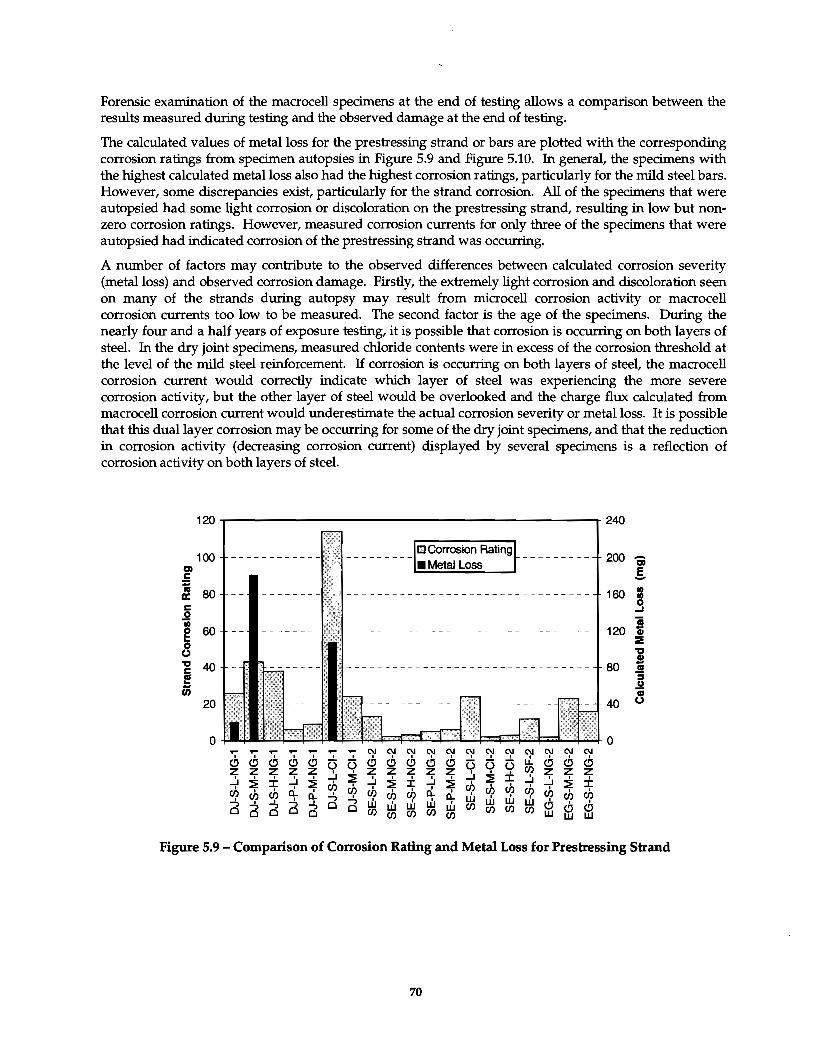
Forensic examination of the macrocell specimens at the end of testing allows a comparison between the results measured during testing and the observed damage at the end of testing.
The calculated values of metal loss for the prestressing strand or bars are plotted with the corresponding corrosion ratings from specimen autopsies in Figure 5.9 and Figure 5.10. In general, the specimens with the highest calculated metal loss also had the highest corrosion ratings, particularly for the mild steel bars. However, some discrepancies exist, particularly for the strand corrosion. All of the specimens that were autopsied had some light corrosion or discoloration on the prestressing strand, resulting in low but nonzero corrosion ratings. However, measured corrosion currents for only three of the specimens that were autopsied had indicated corrosion of the prestressing strand was occurring.
A number of factors may contribute to the observed differences between calculated corrosion severity (metal loss) and observed corrosion damage. Firstly, the extremely light corrosion and discoloration seen on many of the strands during autopsy may result from microcell corrosion activity or macrocell corrosion currents too low to be measured. The second factor is the age of the specimens. During the nearly four and a half years of exposure testing, it is possible that corrosion is occurring on both layers of steel. In the dry joint specimens, measured chloride contents were in excess of the corrosion threshold at the level of the mild steel reinforcement. If corrosion is occurring on both layers of steel, the macrocell corrosion current would correctly indicate which layer of steel was experiencing the more severe corrosion activity, but the other layer of steel would be overlooked and the charge flux calculated from macrocell corrosion current would underestimate the actual corrosion severity or metal loss. It is possible that this dual layer corrosion may be occurring for some of the dry joint specimens, and that the reduction in corrosion activity (decreasing corrosion current) displayed by several specimens is a reflection of corrosion activity on both layers of steel.
120 240
100 m Corrosion Rating
200 '6i 01 •Metal Loss E c -= as 80 160
(I)
a: .§ c .e I ~ 60 120
t; :IE (.) "tt
"tt 40 80 s c as e :; &; .!!
20 40 lJ
0 0 ... ... ... ... ... ... ... C\l C\l C}l C\l C\l C}l C\l C}l C\l C\l C\l C\l I 6 I I I I I I I 6 I I
Ll.. 6 6 I
(.') (.') (.') (.') (3 (3 (.') (.') (.') (.') (3 Q (3 (.') z z z z z ...:. ::E z z z z z ...:. I f./) z z z ...:. I ± ...:. ::E ...:. ::E ± ...:. ::E ::E ::c ...:. ...:. ::E ± ::E 00 00
I
00 00 I
00 I 00 ci. I 00 00 00 ci. ci. f./) f./) I
I 00 f./) 0.. ...; I I
I w I f./) f./) I ...; a I
.., w I w w w w 6 6 .., ...; c w w 6 c .., c w f./) f./) f./) f./) c c c f./) f./) f./) (/) f./) w w w
Figure 5.9 -Comparison of Corrosion Rating and Metal Loss for Prestressing Strand
70
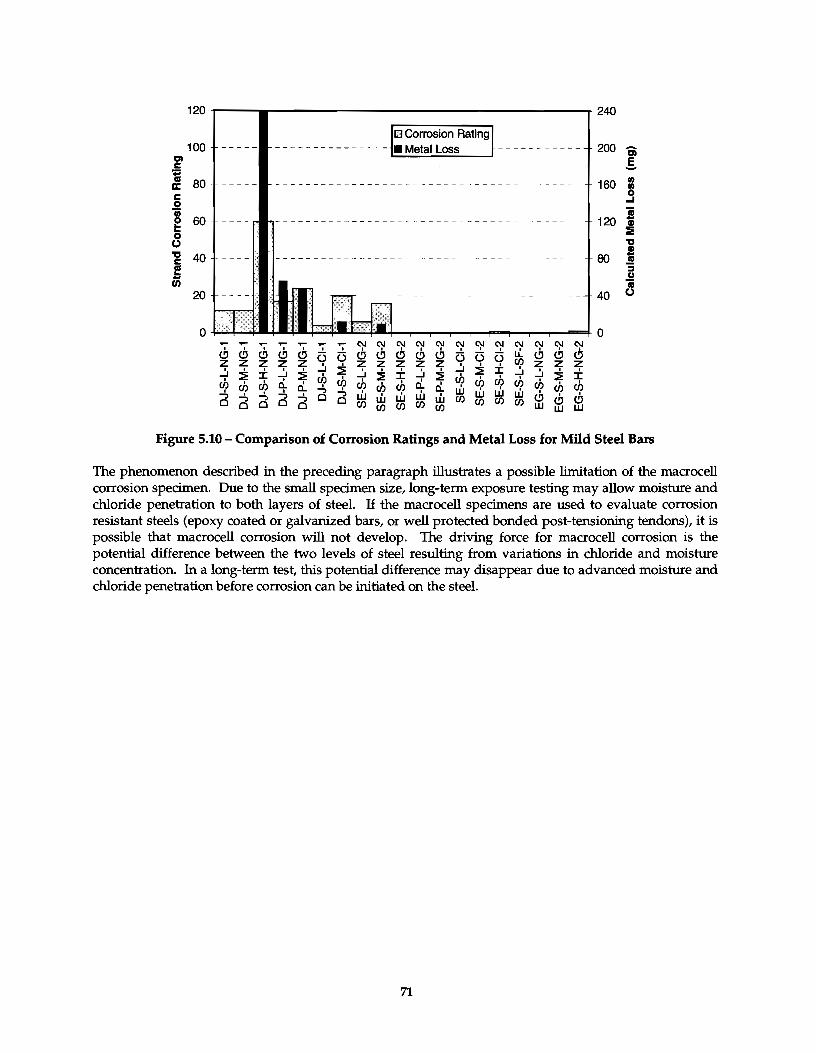
120 240
E1 Corrosion Rating 100 ----- •Metal Loss 200 a
1:71 s c ;: Ill 80 160 ~
1%: ~
c 0 0 ..1
'iii 60 I § 120
(J 1 'a 40 80 c Ill
g :; .!:!
(fJ Ill
20 40 (J
0 0 ..... ..... ..... ..... ..... ..... ..... C\1 ~ C\1 C\1 C\1 ~ C\1 ~ C\1 ~ ~ C\1
6 6 6 6 6 . I 6 . 6 . . tL 6 0 0 (.'j (.'j (.'j 0 0 9 (.'j (.'j z z z z z ~
. z z z z z I . (/) z z z ~
. I ~
. :::! ~ ~ I ~ ~
..1 :::! J: ~ ~ . r. :::! J: :::! ch J: I :::! ch (/) ch
. I
ch ch I ci.. I ch ch
. ci.. ci.. (/) fl( ch ch ch (/) ll.. ....!;, ....!;, ~ uJ uJ . ....!;, ....!;, ....!;, ....!;, . uJ uJ uJ uJ w w 6 I 6 0 0 "') 0 0 (/) (/) (/) (/) (.'j
0 0 0 (/) (/) (/) (/) (/) w w w
Figure 5.10 - Comparison of Corrosion Ratings and Metal Loss for Mild Steel Bars
The phenomenon described in the preceding paragraph illustrates a possible limitation of the rnacrocell corrosion specimen. Due to the small specimen size, long-term exposure testing may allow moisture and chloride penetration to both layers of steel. If the rnacrocell specimens are used to evaluate corrosion resistant steels (epoxy coated or galvanized bars, or well protected bonded post-tensioning tendons), it is possible that macrocell corrosion will not develop. The driving force for rnacrocell corrosion is the potential difference between the two levels of steel resulting from variations in chloride and moisture concentration. In a long-term test, this potential difference may disappear due to advanced moisture and chloride penetration before corrosion can be initiated on the steel.
71

72
Chapter 6: Summary and Conclusions
Several conclusions can be drawn after nearly four and a half years of extreme, accelerated exposure testing. Since the majority of corrosion activity has occurred in specimens with dry joints (eleven of twelve specimens with corrosion), these conclusions are based on a limited data set and therefore could be subject to change.
At the time of reporting, exposure testing is continuing for nineteen specimens (one of each specimen type). Continued exposure testing may provide additional results to assist comparison of variables.
6.1 OVERALL PERFORMANCE
• Overall performance of the segmental macrocell corrosion specimens in this program is very good with only minor corrosion detected in a limited number of specimens.
• Metal loss calculations indicate that corrosion to date is minor or negligible.
• Possible strength degradation, in the form of pitting corrosion on prestressing strand, was found in only one specimen.
6.2 ASSESSING CORROSION ACI1Vl'rY USING HALF-CELL POTENTIAL MEASUREMENTS
• The magnitude of half-cell potential measurements may not necessarily indicate the severity of corrosion activity. Very negative half-cell potentials may result from sources other than significant corrosion activity. Low half-cell potentials (more positive than guidelines for high probability of corrosion) may be measured for conditions of corrosion activity. Therefore, it is important to consider the variation of half-cell potentials over time to assess corrosion activity and detect the initiation of corrosion.
6.3 SEGMENTALJOINTS
• All long-term and significant corrosion has occurred in specimens with dry joints. Seventy-eight percent (eleven of fourteen) of the dry joint specimens displayed corrosion activity. Specimens with dry joints showed increased chloride penetration and increased corrosion of galvanized steel duct, prestressing strand and mild steel reinforcement. Test results indicate that dry joints do not provide corrosion protection for internal tendons where aggressive exposure may occur.
• The mild steel reinforcement is corroding instead of the prestressing strand in seven of the eleven dry joint specimens with corrosion activity. This occurrence is attributed to penetration of chlorides at the dry segmental joint and indicates a possible increased corrosion threat for mild steel reinforcement within the segment when dry joints are used. Increased corrosion of mild reinforcement could occur in bridges with external tendons, and highlights the importance of clear cover over the ends of longitudinal bars in the segments.
• One out of twenty-four specimens with epoxy joints has shown corrosion activity. This specimen was the most recent to display an onset of corrosion, and measured corrosion current was very small. Autopsy of this specimen confirmed that the mild steel reinforcement was corroding rather than the prestressing strand. Measured chloride profiles for this specimen suggested that corrosion resulted from an external source of moisture and chlorides rather than from penetration at the epoxy joint or through the concrete.
73

• Only very minor prestressing strand corrosion was found in specimens with epoxy joints. Corrosion of the galvanized steel duct was reduced in extent and severity in specimens with epoxy joints. The experimental data to date indicates that thin epoxy joints provide substantially improved corrosion protection for internal tendons in segmental construction.
• The use of gaskets in epoxy joints may interfere with epoxy coverage on the joint. Autopsied epoxy I gasket joint specimens found incomplete epoxy coverage near the duct openings, leading to increased chloride penetration and duct corrosion. The observed deficiencies occurred in carefully controlled laboratory conditions, and could possibly be worse under field conditions.
6.4 DUCTS FOR INTERNAL POST-TENSIONING
• Strand corrosion was not detected during exposure testing in any epoxy joint specimens with plastic ducts. Reversed macrocell corrosion developed in the four dry joint specimens with plastic ducts. Formation of the reversed corrosion macrocells indicates that the plastic duct is providing improved corrosion protection for the prestressing strand (tendon), even when penetration of chlorides at the dry joints has caused rebar corrosion.
• Forensic examination revealed only very minor corrosion or discoloration on the prestressing strand from specimens with plastic ducts.
• Galvanized steel ducts were corroded in all cases. Duct corrosion led to concrete cracking along the line of the tendon in many specimens. Ducts were corroded through in nearly two-thirds of the specimens, eliminating the duct as corrosion protection for the prestressing tendon. The concrete cover in the test specimens was lower than specification, contributing to the poor performance of the galvanized duct in such a short period of time. However, test results indicate the potential for durability problems when using galvanized ducts in aggressive exposures.
• Specimens with plastic ducts and epoxy joints had the best overall performance in the testing program (quantified in terms of strand, mild steel and duct corrosion).
6.5 }OINT PRECOMPRESSION
• The range of joint precompression investigated did not affect the time to corrosion or corrosion severity for steel reinforcement.
• In dry joint specimens with steel ducts, corrosion of the steel duct decreased as joint prestress increased.
6.6 GROUTS FOR BONDED POST-TENSIONING
• The most severe corrosion of the prestressing tendon was found where calcium nitrite corrosion inhibitor was used in the grout. Test results suggest calcium nitrite should not be used in cement grouts.
• Two specimens with silica fume in the grout (and epoxy joints) did not show corrosion activity.
• Grout voids resulted in increased corrosion severity of galvanized steel ducts in some cases. This finding highlights that proper grout mix proportioning and grouting procedures are important not only for corrosion protection of the prestressing strand, but may also be required for the duct.
74

Chapter 7: Implementation of Results
The research results to date have generated several findings appropriate for implementation, as listed below.
1. Dry joints should not be used with internal prestressing tendons. This practice is prohibited by the AASHTO Guide Specifications for Segmental Bridges, and the very poor corrosion performance of dry joints illustrates the high potential for corrosion if Guide Specifications are ignored. Match-cast epoxy joints provide excellent corrosion protection for internal tendons in segmental construction.
2. There is an increased risk for corrosion of the segment mild steel reinforcement when dry joints are used as permitted in some exposure conditions with external post-tensioning. Epoxy joints should be used with external post-tensioning in all exposures where corrosion is a concern, including coastal saltwater exposures and deicing chemical exposures.
3. The use of gaskets in epoxy joints does not appear to be beneficial from a durability standpoint. Test results illustrated the potential for incomplete epoxy coverage when gaskets were used around duct openings, leading to increased chloride penetration and corrosion damage. The preferred practice would be to eliminate the use of gaskets and to implement a requirement for thorough swabbing of tendon ducts immediately after initial segment placement and stressing.
4. Plastic ducts for post-tensioning should be used in all situations where aggressive exposure may occur and/ or corrosion is a concern.
5. The use of calcium nitrite corrosion inhibitor in grouts for post-tensioning should not be permitted until it can be shown that it is not detrimental to corrosion protection.
75

76
References
1. AASHTO, Guide Specifications for Design and Construction of Segmental Concrete Bridges, American Association of State Highway and Transportation Officials, Washington, D.C., 1989.
2. Woodward, R.J. and Williams, F.W., "Collapse of the Ynys-y-Gwas Bridge, West Glamorgan," Proceeding of The Institution of Civil Engineers, Part 1, Vol. 84, August 1988, pp. 635-669.
3. Miller, Maurice D., "Durability Survey of Segmental Concrete Bridges," PCI Journal, Vol. 40, No.3, May-June 1995, pp. 110-123.
4. Billington, S.L., "Improving Standard Bridges Through Aesthetic Guidelines and Attractive, Efficient Concrete Substructures," Doctor of Philosophy Dissertation, The University of Texas at Austin, December 1997.
5. Barnes, R.W., ''Development of a High Performance Substructure System for Prestressed Concrete Girder Highway Bridges," Master of Science Thesis, The University of Texas at Austin, 1996.
6. Armstrong. S.D., Salas, R.M., Wood, B.A., Breen, J.E. and Kreger, M.E., "Behavior and Design of Large Structural Bridge Pier Overhangs," Research Report 1364-1, Center for Transportation Research, The University of Texas at Austin, 1997, 272 pp.
7. Vignos, R.P., "Test Method for Evaluating the Corrosion Protection of Internal Tendons Across Segmental Bridge Joints." Master of Science Thesis, The University of Texas at Austin, May 1994.
8. Koester, B.D., "Evaluation of Cement Grouts for Strand Protection Using Accelerated Corrosion Tests," Master of Science Thesis, The University of Texas at Austin, December 1995.
9. Larosche, C.J., "Test Method for Evaluating Corrosion Mechanisms in Standard Bridge Columns," Master of Science Thesis, The University of Texas at Austin, August 1999.
10. Schokker, Andrea J ., "Improving Corrosion Resistance of Post-Tensioned Substructures Emphasizing High Performance Grouts," Doctor of Philosophy Dissertation, The University of Texas at Austin, August 1999.
11. West, J.S., "Durability Design of Post-Tensioned Bridge Substructures," Doctor of Philosophy Dissertation, The University of Texas at Austin, May 1999.
12. AS'IM, "Standard Test Method for Determining the Effects of Chemical Admixtures on the Corrosion of Embedded Steel Reinforcement in Concrete Exposed to Chloride Environments," ASTM G109-92, American Society for Testing and Materials, Philadelphia, PA, 1992.
13. AS'IM, "Standard Test Method for Hall-Cell Potentials of Uncoated Reinforcing Steel in Concrete," ASTM C876-91, American Society for Testing and Materials, Philadelphia, Pa., 1991.
14. Broomfield, J.P., Rodriguez, J., Ortega, L.M., and Garcia, A.M., "Corrosion Rate Measurement and life Prediction for Reinforced Concrete Structures," Proceedings of the 5th International Conference on Structural Faults and Repair held on June 29, 1993, VoL 2, Venue, University of Edinburgh, pp 155-163.
15. Al-Qadi, I.L., Peterson, J.E., and Weyers, R.E., "A Time to Cracking Model for Critically Contaminated Reinforced Concrete Structures," Proceedings of the 5th International Conference on Structural Faults and Repair held on June 29, 1993, Vol. 3, Venue, University of Edinburgh, pp 91-99.
16. Concrete Reinforcing Steel Institute, "CRSI Performance Research: Epoxy-Coated Reinforcing Steel," Interim Report, CRSI, Schaumburg, ill, January 1992.
77
17. Virmani, Y.P., Oear, K.C., and Pasko, T.J., "Time-to-Corrosion of Reinforcing Steel in Concrete Slabs, Vol. 5,: Calcium Nitrite Admixture or Epoxy-Coated Reinforcing Bars as Corrosion Protection Systems," Report No. FHWA/RD-83/012, Federal Highway Administration, Washington, D.C., September 1983, 71p.
18. AASHTO. "Sampling and Testing for Chloride Ion in Concrete and Concrete Raw Materials," AASHTO T 260-94, American Association of State Highway and Transportation Officials, Washington, D.C., 1994.
19. Poston, R.W., "Improving Durability of Bridge Decks by Transverse Prestressing," Doctor of Philosophy Dissertation, The University of Texas at Austin, 1984.
20. Hamilton, H.R., "Investigation of Corrosion Protection Systems for Bridge Stay Cables," Doctor of Philosophy Dissertation, The University of Texas at Austin, 1995.
21. Sason, A.S., "Evaluation of Degree of Rusting on Prestressed Concrete Strand," PCI Journal, Vol. 37, No.3, May-June 1992, pp. 25-30.
22. Wouters, J.P., Personal Communication, Whitlock Dalrymple Poston and Associates, Inc., Manassas, Virginia, July 1998.
23. ACI Committee 222, "Corrosion of Metals in Concrete," ACI 222R-96, American Concrete Institute, Detroit, Michigan, 1996.
24. Vaca-Cortes, Enrique, "Corrosion Performance of Epoxy-Coated Reinforcement in Aggressive Environments," Doctor of Philosophy Dissertation, The University of Texas at Austin, May 1998.
25. Koester, B.D., "Evaluation of Cement Grouts for Strand Protection Using Accelerated Corrosion Tests/' Master of Science Thesis, The University of Texas at Austin, December 1995.
26. Berke, N.S., Dallaire, M.P., Hicks, M.C. and Hoopes, R.J., "Corrosion of Steel in Cracked Concrete," Corrosion, Vol. 49, No. 11, November 1993, pp. 934-943.
27. Pfeifer, D.W., Landgren, J.R. and Zoob, A., "Protective Systems for New Prestressed and Substructure Concrete," FHW A/RD-86/193, Federal Highway Administration, Washington, D.C., April1987.
78