Embed Size (px)
Citation preview

1
Corrosion of the Strand-AnchorageGrouted Asse
Hongbin Wang*, Alberto A. Sague
*Department of Civil and Environmental Engi4202 East Fowler Ave. Ta
+ Florida Department of Transportat 5007 N.E. 39th Avenue, Ga
ABSTRAC
Commercial ductile iron post-tension anchorage strength strand, two types of grout and simulated grintrusion events with fresh and salty (0.01N NaCconductance and potentials were monitored to idPotentials of the galvanic systems at different locatThe results from showed that external water intrutendon failure. Conditions for strand steel depasscarbonation of the grout occurs. Fresh water coucontent of the grout exceeded a relatively small amchloride limits may need revision. Galvanic couplingcould significantly aggravate corrosion of the stranvoid space was observed, especially in a grout thatProjections of the combined effects of the deterioratwith the observation of tendon failures in the field afte Key Words: PT strand, anchorage assemblies, galv
System in Post-Tensioned mblies
s*, and Rodney Powers+
neering, University of South Florida mpa, FL 33620 ion, State Materials Office inesville, FL 32609
T
assemblies containing unstressed high out voids were subject to simulated water l) water. Galvanic current, strand-anchor entify corrosion location and magnitude. ions along the assemblies were recorded. sion can be a major source of corrosion ivation can develop even if only modest ld initiate corrosion if the native chloride ount (e.g. 500 ppm). Currently allowable
between strand steel and anchorage iron ds. Significant corrosion of strands in the supported high internal relative humidity. ion mechanisms identified were consistent r as little as 7 years.
anic current, recharge water

2
INTRODUCTION
Corrosion of high strength steel strands of Post-tensioned (PT) tendons in bridges has received much attention since reported by the Florida Department of Transportation (FDOT) starting in 1999[1,2,3]. Possible causes include void spaces in the anchorage area left by bleed water, intrusion of external chloride and water through "pourbacks" covering the wedge plate, the decrease of alkalinity of grout due to carbonation, and galvanic coupling among different metals in the anchorage system, such as high-strength strand steel and ductile cast iron. Some of these aspects were addressed in two previous publications [1, 4].
This paper shows initial findings of a research program to elucidate the causes of steel depassivation in PT assemblies, the location of the corrosion, the extent of aggravating corrosion macrocell effects, and the amount and timing of corrosion in the life of the structure. To that end, long term experiments are in progress with multiple mock-up anchor assemblies a plain cement and a commercial grout, and subject to periodic simulated recharge events with fresh and chloride-contaminated water.
EXPERIMENTAL SETUP Two series of similarly configured mock-up PT anchorage assemblies (7 total) were constructed using actual anchorage bodies and PT strand. Series P (assemblies P1 to P3) used a plain cement grout with addition of a commercial, aluminum based expansion agent. This grout represented the materials used in previous construction practice which was found to cause bleed water voids. Series S (S1 to S4) used a new-generation commercial low-bleed grout representative of materials used at present. Figure 1 and Table 1 detail configuration and properties. The grouts were prepared using de-ionized water and mixed in 5 gallon buckets using a “Jiffy” paddle at ~2500 rpm per procedure suggested by the commercial grout manufacturer and reported previously[4]. The three Series P assemblies were fastened together on a FMC Syntron VP86C1TM vibrating table operated at its lowest power setting continuously for four hours after casting the grout, simulating vibration that may be encountered in field operations and that may induce bleed water formation.
The anchorage body was made of ductile iron per ASTM A27, Grade 65-45-12 and was attached to a high density polyethylene plastic trumpet. The post-tensioning strands received from commercial supplier were seven-wire, 15.24mm (0.6′′) nominal strand diameter, low relaxation, Grade 1860 per ASTM A416/A416M-98. All the metal components used in the experiments were in “as-received” condition with no signs of preexisting deterioration and contamination. Alloy compositions (Table 2) and microstructures were verified by spectrographic analysis and metallographic examination. Figure 2 shows an optical metallograph of the spheroidal graphite nodules of a ductile cast iron anchor similar to the ones used in present laboratory tests. Figure 3 shows Scanning Electron Microscope (SEM) metallographic cross sections of the nearly eutectoid, fine pearlitic microstructure of the high strength PT wires. Consistent with previous reports[5-10], ferrite and cementite lamellae are aligned with the axis of wire reflecting the cold drawing manufacturing process.. Figure 3(a) reveals the thin layer of oxide mill scale, typically 3 to 10µ thick, present in the wires.

3
The assemblies were set up vertically. An unstressed 7-strand bundle was placed along the center. A full-length counter electrode (CE) made out of mixed-metal oxide activated Ti wire, and embedded reference electrodes (RE) of the same material[11] were placed as shown, carefully avoiding short circuits. The wire REs were placed ~0.5cm from the strand surface and were intended for short term polarization resistance and Electrochemical Impedance Spectroscopy (EIS) measurements. Absolute potential measurements were performed periodically using a Saturated Calomel Electrode (SCE) placed temporarily against the plastic Luggin-style[12] potential measuring ports having a sensing tip next to the embedded REs. To control evaporative water loss, an inverted glass bowl was sealed on top of the anchor and contact with the external air (typically at 65% RH) was permitted only through the grout vent hole (~5 cm2) on the side of the anchor body. This arrangement was intended to simulate imperfect sealing in an assembly in the field. The opening did not promote excessive drying, as shown by the observation of fogging of the bowl for periods of days-weeks after simulated wetting incidents in the P assemblies.
Assuming that only outer surface of strand bundle contacted with the grout, the nominal surface area of anchor steel and strands bundle that was completely immersed in the grout was then calculated to be approximately 760 cm2 and 1280 cm2, respectively. It is possible that the surface area of strand bundles exposed to grout could be higher if the inner surface also is directly contacted with grout.
Due to the shrinkage of S grout, separation at grout-anchor body interface in all three S assemblies was later found and leaks of recharge water through these grout-anchor interstices were observed. Small inter-strand voids were noticed below the level of bulk grout surface in the S (but not in the P) assemblies (#11, Figure 1). Those inter-strand voids extended for 0.5 to 4 inches as determined by inserting thin (~0.5 mm diameter) wires. Recharge water events simulating the effects of leaks in an anchor sealing were conducted periodically with fresh water (S series) and fresh as well as 0.01N NaCl-contaminated water (S series) as shown in Table 3. The anchor and plastic trumpet were screwed together using built-in spiral threads. The outer circumferential joints (#13 in Figure 1) were not sealed to the exterior. For all S series assemblies (and to a much lesser extent in the P series), it was initially noticed that some recharge water flowed immediately out from those joints. All joints were silicone-sealed at day 252 and 138 for the P and S series respectively. Water recharges were repeated when the system reached a relatively steady state or repassivated from previous recharge event. pH paper was used to monitor the pH of any residual recharge water that remained on the top of the grout surface.
The anchor body and the strand bundle were normally electrically connected through a closed external switch allowing macrocell current to flow. Periodically a 0.1 Ω input resistance ammeter or a 97 Hz ac resistance meter were inserted across the momentarily opened switch, to monitor the anchor/strand bundle galvanic current or the intervening grout resistance respectively. The potential of the interconnected assembly with respect to a reference electrode placed in the various electrode ports was monitored as well. Linear polarization resistance (LPR) and (EIS) measurements of the interconnected assembly were conducted periodically at the composite mixed potential, sending the excitation current through the full length CE and the results will be reported elsewhere.

4
RESULTS AND DISCUSSION
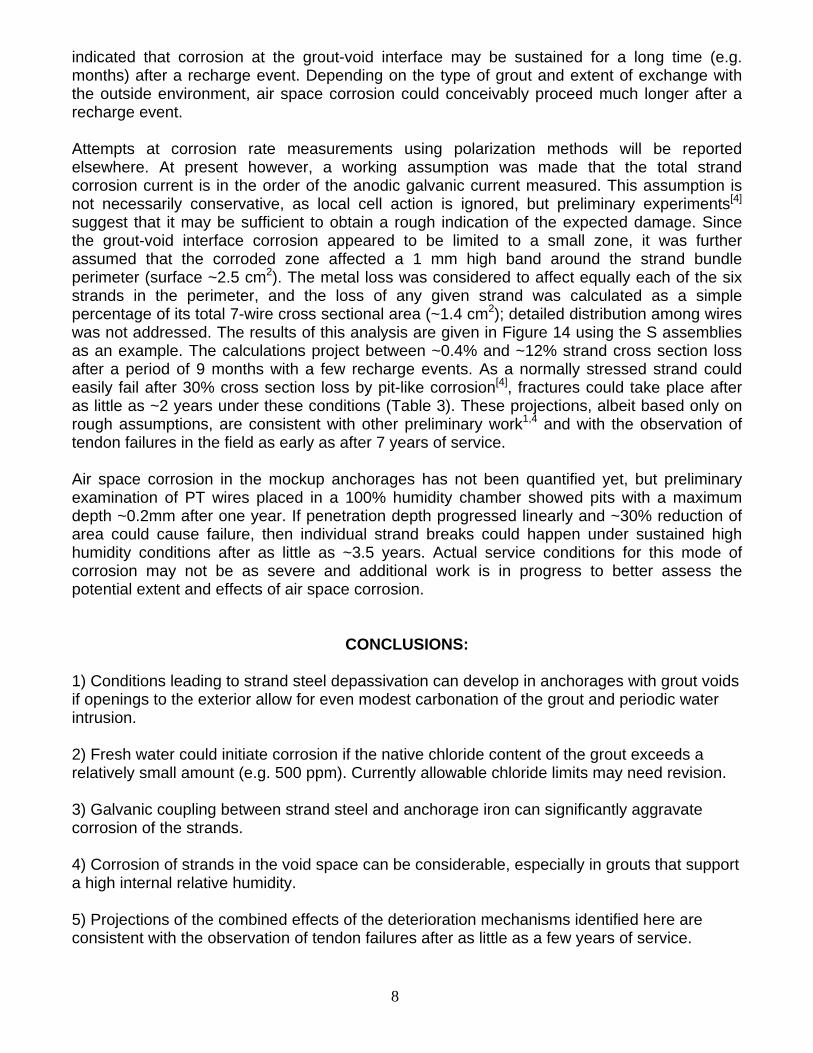
Visual Symptoms Figure 4 illustrates the surface condition of the strand bundles in the P assemblies (plain cement) after 308 days when the P1 assembly had only one fresh water recharge and P2 and P3 had one fresh water recharge and two 0.01N NaCl recharges. There was significant variability (days to months) from assembly to assembly in the length of time recharge water was retained at the surface after a recharge event, partly reflecting differences in the gaps in the anchor body-grout interface. P3 had the greatest downward leakage there; in contrast P2 retained 1-2 mm of water at the surface long after the 3rd recharge event as shown in the picture. The picture shows also variability in the amount of grout residue (from bleed water) at the steel surface. Corrosion was severe in the air space of all three strand bundles, while little attack was present at the grout/void interface even though P2 and P3 had already chloride solution additions. Little air space corrosion was noticed in the areas covered by residual grout. For the strands bundle in P1 assembly, there was no rust from air space corrosion attack on relative thicker grout-covered area. Figure 5 shows the surface condition of strands in S assemblies at day 272. These (except for S2 which was a control with no recharge events) were exposed to fresh water events only. There was nevertheless severe air space corrosion at some spots, as well as corrosion attack at the grout/void interface, although not as severe as in the P assemblies. Control assembly S2 showed no signs of corrosion. Figure 6 illustrates the surface condition of the anchor body ductile iron in P2 and S1 after respective water recharges, showing severe water line corrosion in both. There was some air space corrosion in the P assembly but much less in the S assembly. This may reflect the combined effect of a wider grout-anchor interstice in the S assembly, allowing for faster water drainage, and to lower internal relative humidity (~80%) from self-desiccation of the S grout (RH results to be published elsewhere).
The grout-anchor interstice might have affected corrosion of the strands in various ways. These include increasing the electrical resistance between anchor and strands thus decreasing galvanic current, or conversely allowing faster water penetration down to the locations away from the grout/void interface and then initiate corrosion at those locations. Oxygen, necessary for the cathodic reaction, would also be more easily transported along the opening thus possibly increasing the overall macrocell current for localized corrosion of stands at the grout/void interface. [4]
Electrochemical Observations Figure 7 shows the anchor/strands galvanic current in the P series assemblies. The arrows indicate water recharge events per Table 3. Positive values denote net anode character for the strands. These were initially strongly anodic (current ~ 500 µA) immediately following initial interconnection, but the current dropped to <10 µA after a few days-weeks likely reflecting maturing passivity of the assembly in the alkaline grout environment.

5
The first recharge (fresh water, all three P assemblies) caused only small transient changes in galvanic current. Visual inspection shortly afterwards showed no rust on the strands at the grout/void interface. Galvanic current was small in the following 4-month waiting period. Addition of NaCl-spiked recharge water into P2 and P3 at days 179 and 245 caused sharp transient increases (to 1000 µA) in macrocell current, but with the strands acting as net cathodes. However, in the next salt water recharge event (day 320, all three assemblies) the strands in P3 became anodic and slight yellow or brown rusting was noticed on those strands at the grout/void interface. Visual inspection showed that a tiny water pool existed there as late as 4 days after the event, possibly contributing to the observed corrosion of those strands. It should be noted however that the pH of recharge water (whether fresh or salty) temporarily remaining on top of the grout after wetting events was ~13. The strand-anchorage body conductance evolution in the P assemblies is shown in Figure 8. Each water recharge event was accompanied by an increase in conductance which dissipated after some time, roughly paralleling the length of time recharge water remained visible on the grout surface (see Table 3). Figure 9 shows the galvanic current trends in the S series assemblies. Unlike in the P assemblies, fresh water in the S assemblies triggered strong macrocell action (in agreement with the visual observations), and the strands behaved consistently as net anodes. This difference is partly explained by the greater chloride content in the S grout (500 ppm, Table 1) compared that in the P grout (80 ppm). Despite the relatively high native chloride content, recharge water was still needed to support corrosion at the grout/void interface, as evidenced by the rust free condition of that zone in Assembly S2 which was kept without external water contamination. On the other hand, even a small amount of fresh water (e.g. 10 ml in S3 at day 209) was enough to support significant strand corrosion. Conductance trends in the S assemblies (Figure 10) resembled those in the P assemblies, but with typical conductance values about one order of magnitude lower. Figures 11 and 12 show representative potential trends of the interconnected strands-anchor system, using assemblies P2 and S1 as examples. Comparable trends were observed in the replicate assemblies. The potential trends correlate well with those of the galvanic currents and suggest the presence of activation-passivation cycles linked to each recharge event. Spatial resolution is provided by measurements at ports at the various levels (Figure 1). Figure 11 shows that the first fresh water addition to P2 caused no large change on potentials (all remaining at ~-200 mV vs SCE) at either the top, middle, and bottom locations. This is indicative of passive behavior at all levels, unaffected by the fresh water addition, and in agreement with the macrocell current behavior noted above. However, recharge with the salty solution caused instantaneous excursions to much more negative potentials, indicative of depassivation and consistent with the macrocell current increase. The potential excursions at the upper levels (by the grout-void interface) were larger, in agreement with the externally observed locus of corrosion. Comparable trends are seen in Figure 12 for assembly S1. However, in this case the potentials at the top and grout surface locations gradually increased to above -200 mV as repassivation followed a recharge event, but the potential readings at the middle and bottom locations did not completely recover to about -200 mV before next water recharge event. This suggests that some corrosion might extend to regions far below the main grout/void interface. Significance of Findings

6
In the following the results are examined in view of the main issues to be resolved in this ongoing investigation. 1. Steel/Iron Depassivation: In the grout: In the absence of recharge water either type of grout provided an environment conducive to passivation, at the grout-embedded zone, of both the strand steel and anchor ductile iron. Carbonation of the grout at the grout/void interface (from contact with the external air through the always-open port on the side) did not appear to have progressed to a large enough extent to spontaneously depassivate either material. Fresh recharge water in the low-chloride (80 ppm) P grout did not cause depassivation, but 0.01 N NaCl recharge water did for both strand and anchorage although not necessarily at the same time. For the higher chloride content (500 ppm) S grout depassivation occurred with just fresh water addition. The eventual return to potentials commonly indicative of passive conditions [13] after long term drying is often observed in cementitious systems[13], and may partly reflect enrichment of the increasingly small amount of pore water with metal ions leading to formation of protective precipitates. The response to recharge events may be considered in the light of Figure 13, which summarizes results[14,15] on the chloride content needed to initiate corrosion of plain steel as function of solution pH. Values of pH expected for the pore solution of a typical grout (not carbonated) and in a fully carbonated condition[16] are shown as well. For a given hydrated grout saturated with external fresh water, the chloride content of the pore water depends on factors that include the native chloride content and the porosity ε of the hydrated grout, and the chloride binding isotherm of the system[14]. Those factors can vary greatly, but for discussion representative values of ε=0.2, concrete density 2 g/cm3, and roughly linear binding (on account of the low native chloride levels considered here) with a bound/free chloride ratio of 10:1[14] may be assumed. In such case the 80 ppm and 500 ppm native chloride levels would correspond to pore water concentrations in the order of ~0.0015 N and ~0.01 N respectively. Thus, a pore water pH of ~13 (as observed in the surface water) would still suffice to retain passivity in either case. However, if at some spots the pH were to fall by just ~1/2 unit (e.g. by localized carbonation) or if modest chloride evaporative concentration would occur, corrosion initiation could easily take place in the 500 ppm case. Conditions would have to be proportionally more severe to initiate corrosion by fresh water contact in the 80 ppm case. These scenarios are consistent with the observation of corrosion upon fresh water addition in the S but not in the P grout, as well as the onset of corrosion in the P grout upon addition of 0.01 N NaCl recharge water. It may be concluded that conditions are dangerously close to steel depassivation in voided anchorages if openings to the exterior allow for even modest carbonation of the grout and periodic intrusion of even fresh water, if sufficient native chloride is present in the grout. The responsible native chloride does not need to be very high, since 500 ppm in the hydrated grout corresponds to only ~600 ppm (0.06%) in the initial bagged product. Such content is below common current product specifications [0.08% per FDOT Specification 938] which may merit revision to lower levels in view of these findings. In the air space: A thin layer of hydrated grout on the metal surface, left after bleed water receded, is not expected to be highly protective since it would become rapidly carbonated upon intrusion of external air. Depassivation in the air space would then be expected to develop relatively early, and the subsequent extent of corrosion would then be determined by the relative humidity in the air space as discussed below. Where the residual grout is thicker, depassivation and subsequent corrosion may be determined by the degree of contact with water leaking in. In the assemblies examined here, conditions at thick grout residues just

7
above the air-grout interface were relatively benign but it is not certain how general that situation may be. 2. Corrosion location Grout/void interface: The findings confirmed the vulnerability of the system to corrosion at the grout-void interface, where depassivation is likely as indicated above. Whether corrosion in that region favors the strands or the anchorage depends in part on the nature of the mutual galvanic interaction, but it is of concern that the structurally critical strands were attacked in all three of the S assemblies and at least one of the P assemblies. Inter-strand and grout-anchor voids: Recharge fresh water trapped in inter-strand voids (observed only in the S assemblies) appeared to have extended corrosion of the strands to those inter-strand voids locations, as suggested by the potential differences between top and middle/bottom port readings noted above (Figure 12). This would not be surprising, as these interstices were likely efficiently exposed to external air during dry periods and the depassivation mechanism considered above for the main grout/void interface would apply equally. Corrosion of the anchorage at grout-anchor interstices would be suggested as well by the same potential observations and mechanism. Air Space Corrosion: Severe corrosion of this type was observed primarily in the P series assemblies, on the interior surface of anchor and on the strands. The rust from air space corrosion was not uniformly distributed on the anchor but nevertheless covered about half of exposed surface area. Rust distribution on the strands varied greatly among the three assemblies depending on the amount of grout residue on the strands bundles left by bleed water. The incidence of air space corrosion in the P assemblies seems to be a direct consequence of the high internal relative humidity of this material (~90%) as determined elsewhere), which often resulted in condensation visible on the glass bell despite some contact with the external air. The observation of corrosion under these conditions is consistent with the sharp increase in corrosion rate when relative humidity exceeds about 75% to 80% noted in studies of atmospheric corrosion of metals[17]. In contrast, the S grout (terminal internal RH ~ 75% [H. Wang, to be published]) showed fewer indications of severe air space corrosion. 3. Macrocell Development
The experiments showed substantial macrocell currents (e.g. 400 µA) developing between strand and anchorage in both types of grouts during simulated recharge events. The current persisted at lower levels (10 µA) for extended periods even in those cases where surface water was no longer present, indicating that the hydrated grout itself has significant conductivity to support galvanic action. The galvanic effect was always adverse to the strand (it became the net anode) in the S grout and in one of the recharge events in the P grout. These findings confirm similar effects observed in preliminary experiments. Moreover, numerical simulation detailed in a previous paper[4] showed that under typical tendon conditions macrocell current between the active and passive regions on the strands could sustain a highly increased corrosion rate at an active area in the grout-void interface, even in the presence of only a moderate oxygen supply. 4. Extent/Timing of Corrosion The results suggest that much of the corrosion in the life of a bridge may result from recharge events associated with rainfall or condensation. The macrocell and potential measurements
8
indicated that corrosion at the grout-void interface may be sustained for a long time (e.g. months) after a recharge event. Depending on the type of grout and extent of exchange with the outside environment, air space corrosion could conceivably proceed much longer after a recharge event. Attempts at corrosion rate measurements using polarization methods will be reported elsewhere. At present however, a working assumption was made that the total strand corrosion current is in the order of the anodic galvanic current measured. This assumption is not necessarily conservative, as local cell action is ignored, but preliminary experiments[4] suggest that it may be sufficient to obtain a rough indication of the expected damage. Since the grout-void interface corrosion appeared to be limited to a small zone, it was further assumed that the corroded zone affected a 1 mm high band around the strand bundle perimeter (surface ~2.5 cm2). The metal loss was considered to affect equally each of the six strands in the perimeter, and the loss of any given strand was calculated as a simple percentage of its total 7-wire cross sectional area (~1.4 cm2); detailed distribution among wires was not addressed. The results of this analysis are given in Figure 14 using the S assemblies as an example. The calculations project between ~0.4% and ~12% strand cross section loss after a period of 9 months with a few recharge events. As a normally stressed strand could easily fail after 30% cross section loss by pit-like corrosion[4], fractures could take place after as little as ~2 years under these conditions (Table 3). These projections, albeit based only on rough assumptions, are consistent with other preliminary work1,4 and with the observation of tendon failures in the field as early as after 7 years of service. Air space corrosion in the mockup anchorages has not been quantified yet, but preliminary examination of PT wires placed in a 100% humidity chamber showed pits with a maximum depth ~0.2mm after one year. If penetration depth progressed linearly and ~30% reduction of area could cause failure, then individual strand breaks could happen under sustained high humidity conditions after as little as ~3.5 years. Actual service conditions for this mode of corrosion may not be as severe and additional work is in progress to better assess the potential extent and effects of air space corrosion.
CONCLUSIONS:
1) Conditions leading to strand steel depassivation can develop in anchorages with grout voids if openings to the exterior allow for even modest carbonation of the grout and periodic water intrusion. 2) Fresh water could initiate corrosion if the native chloride content of the grout exceeds a relatively small amount (e.g. 500 ppm). Currently allowable chloride limits may need revision. 3) Galvanic coupling between strand steel and anchorage iron can significantly aggravate corrosion of the strands. 4) Corrosion of strands in the void space can be considerable, especially in grouts that support a high internal relative humidity. 5) Projections of the combined effects of the deterioration mechanisms identified here are consistent with the observation of tendon failures after as little as a few years of service.

9
ACKNOWLEDGMENTS This investigation was supported by the Florida Department of Transportation (FDOT). The opinions, findings and conclusions expressed here are those of the authors and not necessarily those of the supporting agencies.
REFERENCES
1. Powers, R.G., Sagüés, A.A., Virmani, Y.P., “Corrosion of Post-Tensioned Tendons in Florida Bridges”, Florida Department of Transportation, Tallahassee, Florida, 2001
2. Powers, R.G., “Corrosion Evaluation of Post-Tensioned Tendons on the Niles Channel Bridge,” Florida Department of Transportation, Gainesville, FL, June 1999
3. Covern, J. “Mid Bay Bridge Post-Tensioning Evaluation,” Final Report, Florida Department of Transportation, Tallahassee, October, 2001
4. Sagues, A.A., Powers, Rodney, G., Wang, H.B., “Mechanism Of Corrosion Of Steel Strands In Post Tensioned Grouted Assemblies,” NACE2003, Paper No. 03312, 2003
5. Proverbio, E., and Longo, P., “Failure Mechanisms of High Strength Steels in Bicarbonate Solutions Under Anodic Polarization,” Corrosion Science, 45, 2003, p2017
6. Krumbach, R., Konig, G., “Hydrogen Induced Stress Corrosion of Pre-stressing Steels-Introducing A New Testing Method,” 2nd Int. PhD Symposium in Civil Engineering, 1998, Budapest
7. Enos, D.G., Williams, A.J., Scully, J.R., “Long-Term Effects of Cathodic Protection on Pre-stressed Concrete Structures: Hydrogen Embrittlement of Pre-stressing Steel,” Corrosion, 53, 11, 1997, p891
8. Toribio, J., Ovejero, E., “Microstructure Evolution in a Pearlitic Steel Subjected to Progressive Plastic Deformation,” Materials Science and Engineering, A234-236, 1997, p579
9. Toribio, J., Ovejero, E., “Microstructure Evolution in a Pearlitic Steel Subjected to Progressive Plastic Deformation,” Materials Science and Engineering, A234-236, 1997, p579
10. Preston, H.K., “Handling Prestressed Concrete Strand,” PCI Journal, November, 1990, p68
11. Castro, P., Sagüés, A.A., Moreno, E.I., “Characterization of Activated Titanium Solid Reference Electrodes for Corrosion Testing of Steel in Concrete”, Corrosion, 52(8), 1996, p609
12. Jones, D., “Principles and Prevention of Corrosion,” 2nd ed., Prentice Hall, 1996 13. Glass, G. K. and Buenfeld, N. R. (1997). “The Presentation of the Chloride Threshold
Level for Corrosion of Steel in Concrete”, Corrosion Science, 39 (5), 1001-1013 14. Li, L., Sagues, A.A., “Chloride Corrosion Threshold of Reinforcing Steel in Alkanline
Solution-Open-Circuit Immersion Tests,” Corrosion, 57(1), 2001, p19 15. Hausmann, D.A., Materials Protection, 6(10), 1967 p19 16. Andrade, C. and Page, C. L. (1986). “Pore solution chemistry and corrosion in hydrated
cement systems containing chloride salts: a study of cation specific effects” Br. Corros. J. 21(1), p49
17. Metals Handbook, Vol. 13, 9th. Ed. ASM International, Metals Park, 1987, p.82

10
Table 1 Properties of the Anchor-Strands-Grout Assemblies
Non-commercial grout P series Commercial grout S series Number of assemblies 3 4
Grout type used in the assemblies
Plain cement paste (Type I) at 0.45 water to cement ratio with
1%w aluminum based expanding admixture
Commercial grout S from FDOT qualified product list, received from commercial
supplier (0.21water to grout ratio)
Assembly designations P1, P2, P3 S1, S2, S3, S4 Cast date 8/13/2003 12/5/2003
Number of strands 7 7 Vibration* Yes No
Expansion of grout ~5.0 cm in depth No Grout bleeding ~1.5 cm in depth No
Day anchor and strands were connected for galvanic coupling
2 0
Chloride Content in original grout powder ~5 ppm ~550 ppm
Total Chloride Content in hardened grout ~80 ppm ~500 ppm
Table 2 Chemical Analysis of Alloys
C Si P Cr Ni Mn Cu Mo Fe
PT Strand 0.81 0.26 0.009 0.12 0.04 0.71 0.1 <0.01 Bal.
Cast-Iron 3.61 2.88 0.012 0.02 0.01 0.25 0.11 <0.005 Bal.

11
Table 3 Test Matrix (Water Recharge Events to the Assemblies)
Recharge Events Non-commercial grout P series Commercial grout S series Assembly # P1 P2 P3 S1 S2 S3 S4
Days bleed water present on top 10 5 2 No bleed water from the very beginning
Addition day At day 35* At day 56
Amount and type of recharge water
100 mL fresh water
100 mL fresh water
100 mL fresh water
100 mL fresh water NO NO 100 mL
fresh water First
Days of water present on the top of the grout surface 162 78 6 <1 - - <1
Addition day At day 179 At day 133
Amount and type of recharge water NO 100 mL
0.01N NaCl 100 mL
0.01N NaCl 100 mL fresh
water NO 100mL fresh water
100 mL fresh water Second
Days of water present on the top of the grout surface - 69 5 <1 - 1 <1
Addition day At day 245 At day 209
Amount and type of recharge water NO 100 mL
0.01N NaCl 100 mL
0.01N NaCl 100 mL fresh
water NO 10 mL fresh water
100 mL fresh water Third
Days of water present on the top of the grout surface - 70 2 9 - <1 9
Addition day At day 321
Amount and type of recharge water
100 mL 0.01N NaCl
100 mL 0.01N NaCl
100 mL 0.01N NaCl Fourth
Days of water present on the top of the grout surface 1 >68 6
Notes: *calculate from the day that grout was cast into assemblies

12
26-3
/8′′
(~67
cm)
8-5/
8′′ (
~22c
m)
21′′
(~53
cm)
11-5
/8′′
(~30
cm)
17-6
/8′′
(~45
cm)
4-3/
8′′
(~11
cm)
10
4
1
9
12
5-2
2
7
6
8-1
11
3
8-2
8-3
5-3
5-1
13
Figure 1 Schematic of Test Assembly 1. 7 PT strands bundle 2. Cast-iron anchor 3. HDPE trumpet 4. glass vessel 5-1,2,3. Potential ports at top, middle, and bottom, respectively 6. grout 7. Base built using cement Paste 8-1,2,3. Ti wire reference electrodes at top, middle, and bottom, respectively 9. Ti Counter electrode 10. Void 11. Inter-strands void if present, 12. Plastic pan, 13. Joint of plastic trumpet and anchor

13
(a) Transverse section with thin oxide film
Figure 2 Micrograph Of Ductile Cast-Iron Anchor Body Steel Showing Spheroidal Graphite Nodules
100 µm
Epoxy
Oxide
Pearlitic Microstructure of
Epoxy

14
Figure 3. Microstructure Of High-Strength PT Strand Wire
Figure 4. Rusting On Strands In P Series Assemblies At Day 308 (After Three Water Recharge Events) Severe air space corrosion on all three bundles. Slight grout/void interface rusting in P3. White grout residues left by bleed water.
15
Figure 5. Corrosion On PT Strands In S Series Assemblies (Day 272)
(S1, S3, and S4 showed corrosion attack at the grout/void interface; S2 showed almost no corrosion attack.)

16
(a) (b)
Figure 6 Corrosion On Anchor Body a: severe water line corrosion in P assembly after 0.01N NaCl recharge, b: water line corrosion attack in S assembly after fresh water recharge.
-500
-400
-300
-200
-100
0
100
200
300
400
500
0 50 100 150 200 250 300 350 400
P1P2P3
Figure 7 Galvanic Current Between Anchor And Strands In P Series Assemblies (arrows present the water recharge events listed in the test matrix; negative current sign indicates that strands serve as the cathodes)
Time (Days)
Gal
vani
c C
urre
nt (µ
A) 100 mL
fresh water 100 mL 0.01N NaCl

17
0.001
0.010
0.100
1.000
0 50 100 150 200 250 300 350 400
P1
P2
P3
Figure 8 Conductance Between Anchor And Strands In P Series Assemblies (arrows present the water recharge events listed in the test matrix)
-100
0
100
200
300
400
500
0 50 100 150 200 250 300
S1S2S3S4
Figure 9 Galvanic Current Between Anchor And Strands In S Series Assemblies (arrows present the water recharge events listed in the test matrix; Positive current sign indicates that strands serve as the anodes)
Con
duct
ance
(ohm
-1)
Gal
vani
c C
urre
nt (µ
A)
Time (Days)
Time (Days)

18
0.0001
0.0010
0.0100
0.1000
1.0000
0.1 1 10 100 1000
S1S2S3S4
Figure 10 Conductance Between Anchor And Strands In S Series Assemblies (arrows present the water recharge events listed in the test matrix)
-600
-500
-400
-300
-200
-100
0
0 50 100 150 200 250 300 350 400
grout surfaceTop #1Top #2Middle #1Middle #2Bottom #1Bottom #2
Figure 11 Potential Change Of The Anchor-Strands System With Time For P2 Assembly (arrows present the water recharge events listed in the test matrix; locations for potential readings measured at top, middle and bottom was listed as 5-1,2,3 in Figure 1)
Con
duct
ance
(ohm
-1)
Time (Days)
Pot
entia
l (m
V v
s S
CE
)
Time (Days)

19
-600
-500
-400
-300
-200
-100
0
0 50 100 150 200 250 300
Grout surfaceTop #1Top #2Middle #1Middle #2Bottom #1Bottom #2
Figure 12 Potential Change Of The Anchor-Strands System With Time For S1 Assembly (arrows present the water recharge events listed in the table 3; locations for potential readings measured at the top, middle and bottom was listed as 5-1,2,3 in Figure 1)
Pot
entia
l (m
V v
s S
CE
)
Time (Days)
0.00001
0.0001
0.001
0.01
0.1
1
10
8 9 10 11 12 13 14
pH
[Cl-]
/M
Li - as received/prerusted
Li - sandblasted
Hausmann
Typ. GroutFully Carbonated Grout
0.00001
0.0001
0.001
0.01
0.1
1
10
8 9 10 11 12 13 14
pH
[Cl-]
/M
Li - as received/prerusted
Li - sandblasted
Hausmann
Li - as received/prerusted
Li - sandblasted
Hausmann
Typ. GroutFully Carbonated Grout
Figure 13. Chloride Concentration Threshold to Initiate Corrosion as Function of pH for Rebar Steel (data from references 14, 15)

20
0%
2%
4%
6%
8%
10%
12%
14%
0 1000 2000 3000 4000 5000 6000 7000
S1
S2
S3
S4
Figure 14 Nominal Cross Section Loss of A Single Strand
(Assume that all metal loss is in a 1 mm high band around the strand bundle at air/grout interface and anodic galvanic current in Figure 9 equals to corrosion current)
Nom
inal
Cro
ss S
ectio
n lo
ss