Embed Size (px)
Citation preview

14th European Conference on Mixing Warszawa, 10-13 September 2012
CORRELATION OF DROP SIZE WITH SHEAR TIP SPEED
T. L. Rodgersa, M. Cookeb
a BSI, Chemistry Department, Durham University, Durham, DH1 3LE, UK; b SCEAS, The Mill, The University of Manchester, Manchester, M13 9PL, UK.
Abstract. Many products produced in the process industries involve emulsification where the drop size distribution affects the processing and the product properties, e.g. food, cosmetic, pharmaceutical, and health care products. Therefore, an understanding of the mechanisms for drop break-up is key for any design process. For inviscid systems, there are two main mechanisms that are thought to break drops: break-up due to turbulent eddies, i.e. energy dissipation rate; and break-up due to the agitator shear rate. This paper presents a new correlating parameter, the shear tip speed (KsND), based around the agitator shear rate mechanism. Drop size data for a wide variety of agitators can be correlated against the shear tip speed, which is proportional to the maximum shear rate generated by the agitator. This new parameter provides a better correlation compared to an energy dissipation rate correlation over several decades of drop size for a wide variety of agitators. Keywords: Shear tip speed, drop size, two-phase mixtures.
1. INTRODUCTION For emulsification, the drop size distribution affects the processing and the product properties. In a two-phase process, the mass transfer rate between the phases is proportional to the interfacial area. The interfacial area changes with the drop size distribution, which varies with the conditions inside the vessel and time. Successful process design therefore depends on developing a mechanistic understanding of drop break-up in reactors. There are two competing theories on drop break-up mechanisms. These are break-up due to turbulent eddies, i.e. energy dissipation rate, and break-up due to the agitator shear rate.
Break-up due to turbulent eddies is generally based on the work of Kolmogorov (1949) [1] and Hinze (1955) [2] which utilize the concept of eddy turbulence to define a limiting drop size. It is usually assumed that drop break-up occurs due to the interactions of drops with the turbulent eddies of sufficient energy to break the drop [3].
For a given fluid system the effective equilibrium drop size (this is the drop size after a sensible processing time, when the drop size reduction with time is very small and almost unmeasurable) is dependent on the energy per unit mass and thus should scale-up with this value when using geometrically similar vessels. For low viscosity dispersed phase dilute liquid–liquid systems, the drops are inviscid as the internal viscous stresses are negligible and only the interfacial tension surface force contributes to stability. The maximum stable equilibrium drop size, dmax, can be related to the maximum local energy dissipation rate, εmax, by Equation 1 for isotropic turbulence [4,5].
(1)
407

This theory applies to isotropic turbulence in the universal equilibrium regime, whereas it is known that break-up occurs close to the agitator where the turbulence is both non-isotropic and intermittent.
Break-up due to the agitator shear rate is based on a balance between the external viscous stresses and the surface tension forces [3]. If the break-up is due to the agitator shear rate then the effective equilibrium drop size is related to the maximum shear rate. This would mean that lower power number agitators can produce smaller drops than higher power number agitators, as low power number agitators may have a higher shear rate. This has been seen experimentally [6]. When scale-up is performed on a constant energy dissipation rate, smaller drops are observed at larger scales [7]. This is likely due to the shear rate increasing at larger scales when the energy dissipation rate is kept constant.
This paper examines this second mechanism and compares the correlation produced to a large selection of experimental systems.
2. METHODOLOGY
2.1. Experimental The experimental rig consists of a standard geometry agitated vessel of 0.286 m diameter with a liquid height of 0.4 m. The vessel has four equally spaced baffles of width, w=T/10. The vessel can be fitted with a large selection of impellers or connected via a recycle loop to an in-line Silverson 150/250 rotor-stator mixer. The impellers were set to a clearance of c=T/3. The impeller shaft is fitted with a tachometer enabling the measurement of agitation rate and a torque meter allowing calculation of the agitator power. The agitators and their properties are given in Table 1. The Silverson rotor–stator mixer has a double concentric rotor with a diameter of 0.0635 m which sits within close fitting screens. The fitted screens are standard double emulsifier screens [8]. The recycle flow rate was 0.167 kg s−1.
Agitator Diameter, D / m Po Ks 2-blade small turbine 0.192 1.68 9.62 2-blade large turbine 0.192 3.35 8.96 6-blade turbine 0.192 2.52 8.10 8-blade turbine 0.192 7.30 8.63 Saw-tooth 0.103 0.20 6.00 Silverson 0.0635 0.24 6.60
Table 1. Agitators used to produce the drops.
The systems were mixtures of silicon oil in water. Samples of the solutions were collected and analysed using a Mastersizer X long bed laser diffraction particle analyser to determine the drop size distribution.
2.2 Theory Visualization of drop break-up and measurements of local drop size distributions show
that the most important area for drop breakage is at the agitator blades, Figure 1 and Figure 2.
408

(a) 0 s (b) 2 s (c) 4 s Figure 1. Large drops ( (0.01 m)) of 1×10⁻² Pa s silicon oil (coloured black with hydrophobic Nigrosine dye from Fisher) are stable in the vessel bulk and are not broken.
(a) 0 s (b) 0.033 s (c) 0.067 s (d) 0.100 s (e) 0.133 s
Figure 2. Drops are broken due to high shear rates at the agitator blades. Hydrodynamics conditions close to the impeller blades can be characterised as a
boundary layer with a maximum shear rate at the blade tips. The maximum shear-rate has been measured experimentally for simple agitators in Newtonian liquids and can be given by Equation 2.
(2) The values of β and δ tend to vary depending on the experiments from about 1.5 [9,10] to
1. If β = δ then the maximum shear rate is proportional to the agitator tip speed [11]. If μc ≥ μd then the velocity on the drop surface is the velocity of the continuous phase
which must be proportional to . If μc < μd then the shear rate in the drop is scaled by the viscosity difference and the velocity on the drop surface is proportional to / . Therefore the velocity at the surface can be given by Equation 3.
(3)
The hydrodynamic force on the surface can be given by Equation 4.
(4)
Where Cd is the drag coefficient which is dependant on the particle Reynold number, Rep. This relationship is fairly complex but can be approximated to a power law dependence with three regimes:
• Cd ∝ Rep–1, Stokes’ law regime Rep < 0.2
409

• Cd ∝ Rep−0.5, increased drag due to increasing turbulence
• Cd ∝ Rep0, drag coefficient is constant Rep > 1000
Therefore, the hydrodynamic force can be given by Equation 5.
(5)
If the hydrodynamic force exceeds the drop surface tension force, σ d, the drop will break. At the equilibrium of these two forces there is theoretically no more drop breakage; this condition is given by Equation 6.
(6)
This means that the correlation for the drop size depends on the regime of the drops, which is determined by the viscosity of the drops and the vessel conditions.
The maximum shear rate is dependant on a maximum shear rate constant, K, which is
difficult to measure, as evidenced by the absence of values for many agitator types. It makes physical sense that this maximum shear rate constant is proportional to an average shear rate constant [10]. Although it is only strictly applicable in the laminar regime [12], the Metzner–Otto constant, KS, is a good measure of the average shear rate near the impeller. It has been claimed that for power law fluids Ks varies with the power law index, although for practical considerations this effect is found to be small. Therefore, a constant value of KS can be considered for shear thinning, shear thickening, and Newtonian fluids [13]. KS has been found to vary linearly with the agitator flow number, which is a function of the Reynolds number [14]. However, in the turbulent regime the flow number is constant, so again we have a constant (though higher) value of KS.
This means the correlative equation taken will be Equation 7, including only the variables varied in this study, where a is a constant that is dependant on α.
(7)
3. RESULTS
The drop size data does not correlate with the maximum power per unit mass, Figure 3. Different types of agitator produce parallel lines, so the power number is not useful for predicting drop sizes. The collected drop size data is also plotted against Equation 7 with the values of a, β, δ, and α fitted, Figure 3. The best fit occurs when β and δ are equal to 1.5 and α is equal to -0.5.
410

Figure 3shear tipm to 0.6
Theacross tThis is mthe resu(calculadrop ReRe-plottdrop siz
Figure 4d3,2 fromSame da
4. CON
Dromaximulayer ardrop sur
DroEquatioKsND.
3. Variationp speed (rig61 m Dotted
e correlatiothree ordersmost likely ults. To testated from theynolds numting these vze data, Figu
4. Variationm Equation ata as in Fig
NCLUSION
op breakagum value atround the arface, the drop size dataon 7 with a =
n of d3,2 corght). Data fd lines are 2
on with the s of magnitdue to the
t this the drhe fit in Figumber less thvalues usingure 4.
n of d3,2 corr7 with α =
gure 3.
NS
e is controt the agitat
agitator bladroplet viscoa for a wid= –0.5. This
rrelated agaifrom 1 [6] 220% deviati
shear tip stude, but is assumptionrop diameteure 3), Figu
han 0.2 whicg α = –1 in
related again–1 for all d
olled by thor tip. Thedes. As the osity is impode variety os produces E
inst the max2 [15] 3 [16on.
speed (KsNDnot as goo
n for Cd ∝ Rer can be pure 4. The hch puts it inEquation 7
nst the dropdata with μd
he agitator intensity ibreakage i
ortant to theof agitators Equation 8 w
ximum pow6]. The vess
D) produceod when theRep
–0.5 not blotted again
high viscosinto the Stok produces a
p Reynolds > 2 Pa s an
shear rate,is controlledis dependane breakage.
and drop vwhich is de
wer per unitsels diamete
es a good fie drops arebeing applicnst the dropity (larger dkes’ law rega good pred
number (lefnd α = –0.5
, which is d by the shnt on the ve
viscosity capendant on
t mass (left)ers range fr
fit for the de larger thancable througp Reynolds
drop size) dagime where
diction for th
ft) and predfor the rest
dominatedhear flow belocity field
an be correthe shear ti
) and the rom 0.14
drop size n 1 mm. ghout all number
ata has a e α = –1. he larger
dicted
(right).
d by the boundary d on the
elated by ip speed,
411
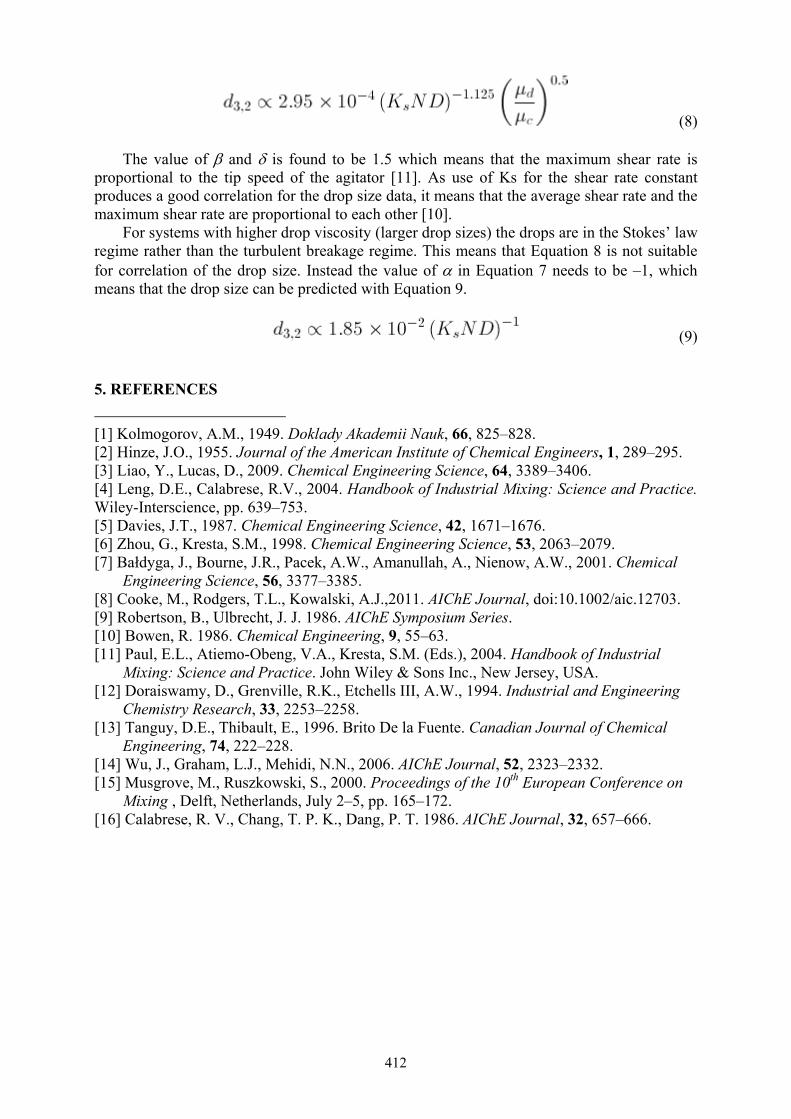
(8)
The value of β and δ is found to be 1.5 which means that the maximum shear rate is proportional to the tip speed of the agitator [11]. As use of Ks for the shear rate constant produces a good correlation for the drop size data, it means that the average shear rate and the maximum shear rate are proportional to each other [10].
For systems with higher drop viscosity (larger drop sizes) the drops are in the Stokes’ law regime rather than the turbulent breakage regime. This means that Equation 8 is not suitable for correlation of the drop size. Instead the value of α in Equation 7 needs to be –1, which means that the drop size can be predicted with Equation 9.
(9)
5. REFERENCES [1] Kolmogorov, A.M., 1949. Doklady Akademii Nauk, 66, 825–828. [2] Hinze, J.O., 1955. Journal of the American Institute of Chemical Engineers, 1, 289–295. [3] Liao, Y., Lucas, D., 2009. Chemical Engineering Science, 64, 3389–3406. [4] Leng, D.E., Calabrese, R.V., 2004. Handbook of Industrial Mixing: Science and Practice. Wiley-Interscience, pp. 639–753. [5] Davies, J.T., 1987. Chemical Engineering Science, 42, 1671–1676. [6] Zhou, G., Kresta, S.M., 1998. Chemical Engineering Science, 53, 2063–2079. [7] Bałdyga, J., Bourne, J.R., Pacek, A.W., Amanullah, A., Nienow, A.W., 2001. Chemical
Engineering Science, 56, 3377–3385. [8] Cooke, M., Rodgers, T.L., Kowalski, A.J.,2011. AIChE Journal, doi:10.1002/aic.12703. [9] Robertson, B., Ulbrecht, J. J. 1986. AIChE Symposium Series. [10] Bowen, R. 1986. Chemical Engineering, 9, 55–63. [11] Paul, E.L., Atiemo-Obeng, V.A., Kresta, S.M. (Eds.), 2004. Handbook of Industrial
Mixing: Science and Practice. John Wiley & Sons Inc., New Jersey, USA. [12] Doraiswamy, D., Grenville, R.K., Etchells III, A.W., 1994. Industrial and Engineering
Chemistry Research, 33, 2253–2258. [13] Tanguy, D.E., Thibault, E., 1996. Brito De la Fuente. Canadian Journal of Chemical
Engineering, 74, 222–228. [14] Wu, J., Graham, L.J., Mehidi, N.N., 2006. AIChE Journal, 52, 2323–2332. [15] Musgrove, M., Ruszkowski, S., 2000. Proceedings of the 10th European Conference on
Mixing , Delft, Netherlands, July 2–5, pp. 165–172. [16] Calabrese, R. V., Chang, T. P. K., Dang, P. T. 1986. AIChE Journal, 32, 657–666.
412