Embed Size (px)
Citation preview

Volume 4 Issue 2 Article 9
2020
Correlation Between Simulation and Fieldwork Performance in Correlation Between Simulation and Fieldwork Performance in
Adult Physical Rehabilitation Adult Physical Rehabilitation
Whitney Lucas Molitor University of South Dakota
Ranelle Nissen University of South Dakota
Follow this and additional works at: https://encompass.eku.edu/jote
Part of the Adult and Continuing Education Commons, and the Occupational Therapy Commons
Recommended Citation Recommended Citation Lucas Molitor, W., & Nissen, R. (2020). Correlation Between Simulation and Fieldwork Performance in Adult Physical Rehabilitation. Journal of Occupational Therapy Education, 4 (2). https://doi.org/10.26681/jote.2020.040209
This Original Research is brought to you for free and open access by the Journals at Encompass. It has been accepted for inclusion in Journal of Occupational Therapy Education by an authorized editor of Encompass. For more information, please contact [email protected].

Correlation Between Simulation and Fieldwork Performance in Adult Physical Correlation Between Simulation and Fieldwork Performance in Adult Physical Rehabilitation Rehabilitation
Abstract Abstract The purpose of this study was to explore the relationship between performance in simulation used as a learning method in an adult physical rehabilitation and Level II fieldwork. A retrospective cohort research design was utilized to analyze data gathered from occupational therapy student cohorts between 2011-2017 enrolled in an entry-level Masters (MS) and Doctor of Occupational Therapy (OTD) program located in the Midwest United States. Course performance on skills checks, which utilized simulation methods, as well as final exam and course grades were analyzed and compared to performance scores on the FWPE. The overall course exam performance is the strongest predictor of Level II fieldwork success. The strongest relationship was for Level IIA fieldwork, with no correlation found between any didactic variable and performance on Level IIB fieldwork. Performance on Level II fieldwork can, in part, be determined by didactic performance in simulated experiences as indicated by the final course exam in adult physical rehabilitation.
Keywords Keywords Fieldwork, simulation, experiential learning, occupational therapy education
Creative Commons License Creative Commons License
This work is licensed under a Creative Commons Attribution-Noncommercial-No Derivative Works 4.0 License.
This original research is available in Journal of Occupational Therapy Education: https://encompass.eku.edu/jote/vol4/iss2/9
Volume 4, Issue 2
Correlation Between Simulation and Fieldwork Performance
in Adult Physical Rehabilitation
Whitney Lucas Molitor, OTD, OTR/L, BCG
Ranelle Nissen, PhD, OTR/L
University of South Dakota
United States
ABSTRACT The purpose of this study was to explore the relationship between performance in simulation used as a learning method in an adult physical rehabilitation and Level II fieldwork. A retrospective cohort research design was utilized to analyze data gathered from occupational therapy student cohorts between 2011-2017 enrolled in an entry-level Masters (MS) and Doctor of Occupational Therapy (OTD) program located in the Midwest United States. Course performance on skills checks, which utilized simulation methods, as well as final exam and course grades were analyzed and compared to performance scores on the FWPE. The overall course exam performance is the strongest predictor of Level II fieldwork success. The strongest relationship was for Level IIA fieldwork, with no correlation found between any didactic variable and performance on Level IIB fieldwork. Performance on Level II fieldwork can, in part, be determined by didactic performance in simulated experiences as indicated by the final course exam in adult physical rehabilitation.
INTRODUCTION Level II fieldwork constitutes a critical component of occupational therapy education (American Occupational Therapy Association [AOTA], 2018). Designed to prepare students for future practice, Level II fieldwork is an in-depth experiential learning opportunity carried out after successful completion of “necessary and relevant didactic coursework” (AOTA, 2018, p. 1). Success during fieldwork is often linked to student performance in the didactic portion of their program, with positive fieldwork performance seen as an indicator of strong academic preparation. However, occupational therapy education preparation constitutes varied and diverse learning experiences, making it
Published by Encompass, 2020

challenging to point out exactly which learning opportunities promote success on fieldwork and provide students with the critical thinking skills necessary for clinical practice. Ensuring success on fieldwork is dynamic and multifaceted, with both didactic preparation and professional development being essential components of student success, among others (AOTA, 2018). Occupational therapy education increasingly utilizes simulated experiences, carried out with standardized patients, virtual reality, student-led clinical opportunities, and others as a means of better preparing students for Level II fieldwork (Bennett, Rodger, Fitzgerald, & Gibson, 2017). Limited evidence for the effectiveness of simulation in predicting future fieldwork success exists necessitating additional inquiry on this topic (Giles, Carson, Breland, Coker-Bolt, & Bowman, 2017; Tomlin, 2005). BACKGROUND Simulation Simulation is a method designed to serve as a “bridge” between the classroom and real-life experiences (Society for Simulation in Healthcare [SSH], 2019). In health science education, simulation can include experiences designed for exploration of learning (often considered low stakes) to testing situations (high stakes), which aim to bolster confidence and prepare the student for clinical practice (Brannan, White, & Bezanson, 2008; Rutherford-Hemming & Jennrich, 2013; SSH, 2019; Thomas, Rybski, Apke, Kegelemeyer, & Kloos, 2017). Initially utilized as a means of incorporating adult learning theory into nursing and medical curricula, the use of simulation has expanded rapidly in recent years. In many instances, the use of simulation is the standard educational practice in health science education (Rutherford-Hemming, 2012). Advantages of simulation include a safe space to make and learn from mistakes, customization of learning opportunities, in-depth opportunities for feedback and evaluation, and increased safety and ethical practice of healthcare delivery (SSH, 2019). Simulation is often viewed favorably among occupational therapy students (Giles et al., 2017; Herge et al., 2013; Velde, Lane, & Clay, 2009 ) as it provides a sense of psychological safety through structured, safe learning environments that promote critical thinking and the ability to learn from errors without the threat of harm to actual clients (Issenberg, McGaghie, Petrusa, Gordon, & Scalese, 2005). Authenticity, or fidelity, of simulation is based on the real-world application, not the technology used in the experience (Gaba, 2004). Fidelity ranges from low to high, based upon the learning objectives, resources, and intent of the experience (Bennett et al., 2017; Issenberg et al., 2005). Low fidelity experiences may focus solely on a single skill or may be carried out in a classroom. As skills are mastered, the simulation may include a hospital-like set-up, real equipment, mannequins, and patient actors. This type of simulation is referred to as high fidelity (Bennett et al., 2017). Simulation in occupational therapy education is often incorporated during intervention courses. The use of mannequins is reported for skills such as transfer training (Baird, Raina, Rogers, O’Donnell, & Holm, 2015a; Baird et al., 2015b). Higher fidelity
2Journal of Occupational Therapy Education, Vol. 4 [2020], Iss. 2, Art. 9
https://encompass.eku.edu/jote/vol4/iss2/9DOI: 10.26681/jote.2020.040209

experiences involve the utilization of standardized patients (Bethea, Castillo, & Harvison, 2014). A standardized patient includes either a simulated patient specially trained to depict a condition or set of characteristics, or a real patient (Barrows, 1993; Lopreiato et al., 2016). In recent literature, standardized patient and simulated patient are often used interchangeably. Standardized patients are used in education settings to provide a similar experience to all students through standardized, pre-determined criteria established to meet the aims of the simulation (Barrows, 1993). In occupational therapy, standardized patients have been referred to as “perhaps the most authentic simulation modality used in occupational therapy curricula” (Bennett et al., 2017, p. 323). A variety of benefits exist when considering the use of simulation in occupational therapy education. Thus, not only can psychomotor skills be practiced, critiqued, reviewed, and reflected upon, so too can client interaction, interview skills, and development of therapeutic rapport skills (Bennett et al., 2017; Cook et al., 2011; Rutherford-Hemming & Jennrich, 2013). As such, student performance during a simulation may provide clues regarding readiness for fieldwork (Giles et al., 2014); however, this has yet to be fully explored in the occupational therapy literature. Fieldwork Education Site expectations for student proficiency in clinical skills and critical thinking aligning with the practice setting are increasing (Gustafsson, 2016; Lindstrom-Hazel & West-Frasier, 2004). Models and methods of supervision are changing to keep pace with current trends in practice, models of reimbursement, and as a means of matching the demands placed upon fieldwork educators (Thomas et al., 2007). Along with psychomotor aptitude, emotional intelligence (Andonian, 2013) and cultural humility are also increasingly emphasized during fieldwork. These skills can be incorporated into simulated experiences as a means of allowing students to gain competence, through both instructor feedback and individual reflection, prior to entering fieldwork (Giles et al., 2014). Enhanced student perceptions regarding one’s own ability to perform on fieldwork may be increased using simulated experiences leading to increased fieldwork readiness and improved self-confidence (Gibbs, Dietrich, Dagnan, 2017; Knecht-Sabres, Kovic, Wallingford, & St. Amand, 2013). The inherent value of simulation is to foster reflective practice in a safe but realistic way (Nagle, McHale, Alexander, & French, 2009). When carried out effectively through the incorporation of timely feedback, clear integrated objectives, adequate environment, and active reproducible learning experience, simulation can be an effective method to increase knowledge, skills, and attitudes (Issenberg et al., 2005). Current literature regarding simulation most often explores student perceptions and satisfaction of these experiences or effectiveness of simulation itself with few studies to date examining the link between student performance during simulation and Level II fieldwork performance (Giles et al., 2014; Tomlin, 2005; Yeung, Dubrowski, & Carnahan, 2013). As such, the purpose of this study was to determine if student performance in simulated learning experiences during an adult physical rehabilitation course correlated with success on Level II fieldwork.
3Lucas Molitor and Nissen: Simulation and Fieldwork Performance
Published by Encompass, 2020

METHODS A retrospective cohort research design was utilized for this study (Portney & Watkins, 2009). Prior to initiating the study approval from the university’s Institutional Review Board (IRB) was obtained. Data was gathered from occupational therapy student cohorts from 2011-2017 enrolled in an entry-level Masters (MS) and Doctor of Occupational Therapy (OTD) program located in the Midwest United States. Participants A convenience sample was utilized for this study. Data were gathered retrospectively. Student records were selected for inclusion in this study if they met the following inclusion criteria: were a second-year occupational therapy student, enrolled in the select entry-level occupational therapy program, completed the Occupational Therapy Assessment & Intervention: Adult Physical Rehabilitation course between 2011-2016 and completed Level II fieldwork between 2012-2017 in a practice setting with a minimum of 50% of the caseload being adult clients. In total, data from six student cohorts (N=156) were included for analysis. Of these students, those that enrolled in a Level II A or B fieldwork that constituted 50% time or greater with adult physical rehabilitation were included. Each fieldwork rotation was considered as a separate record. In total, 224 records were included for analysis. Course Structure Simulation was incorporated throughout the adult physical disability course through a variety of methods during labs. Of these experiences, only skills checks and the final practical examination, which were completed for grading (versus for lab participation), were compiled and analyzed. Skills checks were designed to demonstrate one’s ability to perform key clinical assessments, interventions, therapeutic interaction, and standard safety procedures. These opportunities aligned with ‘high stakes’ simulation. Most skills checks were conducted using the university’s simulation center, which is equipped with three hospital simulation rooms, camera and audio recording, three debrief rooms, and a control room. The number of simulated opportunities varied from 6-9 across the six years of data included. Topics and descriptions for skills checks are included in Table 1. Students were allowed between 5-7 minutes to conduct the given assessment or intervention technique using a standardized patient. Prior to entering the simulation room students were given a 5-minute preparation session in which their given scenario was provided. Students could take notes, and in some cases review assessment instructions during this time. Following the simulation, students completed reflective debriefing and clinical reasoning questions, which took 20 minutes. Students were required to complete each experience with a minimum of 80% of total points. If students failed to accomplish this, remediation attempts were completed following a mandatory reflection session in which students viewed his or her video and discussed opportunities for improvement with the course instructor.
4Journal of Occupational Therapy Education, Vol. 4 [2020], Iss. 2, Art. 9
https://encompass.eku.edu/jote/vol4/iss2/9DOI: 10.26681/jote.2020.040209

Table 1 Simulation Topics and Descriptions
Topic Description
Clinical Documentation a Video analysis and SOAP note documentation ADL / IADL Assessment a Rating levels of assistance using video analysis Functional Mobility Complete functional transfer Vital Sign Assessment Assess blood pressure/heart rate Cognition and Perception Assessment
Administer cognitive assessment
Upper Extremity Function Assessment
Assess one area of the upper extremity (range of motion/grip/fine motor control/ dexterity)
Vision Assessment Assess oculomotor function, visual acuity, or field of vision
Intervention Session Plan and conduct an intervention session Final Practical Examination Conduct an occupational therapy evaluation
Note. a Indicates video analysis experience. All others include a standardized patient. ADL= activity of daily living; IADL= instrumental activity of daily living. The final practical examination consisted of students completing a 20-minute occupational therapy evaluation. Students again conducted this session in the simulation center using a standardized patient. Information regarding client diagnosis and condition was made available 10 minutes before the scheduled session. Students were provided a list of available equipment and supplies prior to the day of the examination. Students were required to pass this examination at 80% or above or complete a remediation attempt. If remediation was required, the original score was reflected in the final score calculation for data included in this study. Level II Fieldwork Information from the AOTA (2002) Fieldwork Performance Evaluation (FWPE) was collected for analysis. Despite this assessment not providing a standardized score, it was deemed an appropriate method for analyzing a student’s performance at midterm and final during Level II fieldwork. Scores from each reporting period, along with fieldwork educator comments regarding student performance were collected, de-identified, and analyzed in comparison to performance in the adult physical disabilities course. Items on the FWPE include seven performance categories. Each performance item is ranked from 0-4. The total points possible is 168. DATA ANALYSIS To answer the research question, variables of student scores from the adult physical rehabilitation assessment and intervention course and scores from the FWPE were analyzed to assess the strength of correlation and identify a regression model based upon correlated variables. The student’s average percentage scores on the four skills checks, final exam, and final course grade were analyzed to determine the relationship to sections I, III, IV, and VI and the midterm and final composite scores on the FWPE.
5Lucas Molitor and Nissen: Simulation and Fieldwork Performance
Published by Encompass, 2020
Sections I, III, IV, and VI were aggregated by determining the total number of ratings at Unsatisfactory (1) and Needs Improvement (2). This aggregate score of rating 1 and 2 are herein referred collectively as Needs Improvement. To further analyze the relationship between a student’s performance in physical disabilities didactic coursework and fieldwork, we coded the comments made at midterm and final for sections I, III, IV, and VI on the FWPE. Each author coded half of the comments. To ensure the reliability of coding, the authors completed a series of coding and checking processes until there was a high agreement on the codes (kappa=0.877). The coding process utilized the four-scale measure used for scoring the FWPE. Comments were identified as indicating Unsatisfactory (1), Needs Improvement (2), Meets Standards (3), or Exceeds Standards (4). Each coder identified keywords or phrases consistent with each rating level, such as excellent or above and beyond for a level 4 rating or Needs Improvement or skills not at entry level for a level 2 rating. The codes were then converted into a percentage of total comments at the level 1 and 2 ratings indicating the percentage of comments out of the total comments on sections I, III, IV and VI that indicated the student was not performing at satisfactory or entry-level. All data were analyzed in the Statistical Package for Social Sciences (SPSS) version 25 for Windows (IBM Corp, 2017). RESULTS Individual skills check scores and FWPE section scores were aggregated to provide a composite score of a student’s performance in practical clinical skills. The authors determined this was a more appropriate method to align accurately with the composite skill demonstration expected of students. Data were also aggregated into three separate groups and analyzed. The three groups were all data, Level IIA, and Level IIB. The three groups were analyzed to assess if the timing of the student’s rotation was more accurate in assessing the prediction of performance based upon didactic performance. All variables were tested for normal distribution prior to completing the correlational analyses. The composite score of Needs Improvement in sections I, III, IV, and VI at the final FWPE was skewed in all three groups. The skewed data was not unexpected because a score of Needs Improvement was not commonly given at final evaluation for students demonstrating overall entry-level skills. The authors attempted to transform this data to be normally distributed, but the data remained skewed. Due to the degree of skewness of this variable, this variable was not used in subsequent correlation and regression analyses. The variable of final comments was also skewed in all three groups, but the data were able to be transformed into an acceptable range in the Level IIA and Level IIB groups. The variables of midterm FWPE score and composite section midterm scores were skewed in the Level IIA group. These two variables were transformed for use in the analyses. Finally, the variable of final course grade was skewed so it was transformed for use in the analyses. See tables 2, 3, and 4 for descriptive data of all variables used.
6Journal of Occupational Therapy Education, Vol. 4 [2020], Iss. 2, Art. 9
https://encompass.eku.edu/jote/vol4/iss2/9DOI: 10.26681/jote.2020.040209
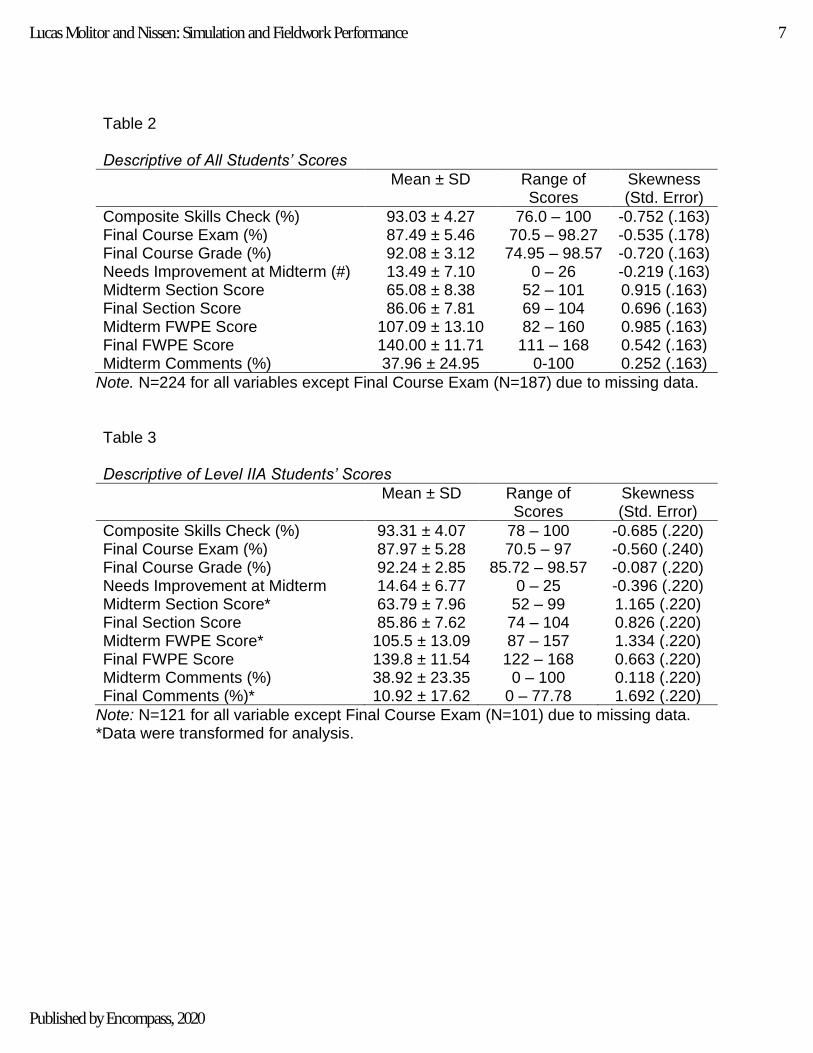
Table 2 Descriptive of All Students’ Scores
Mean ± SD Range of Scores
Skewness (Std. Error)
Composite Skills Check (%) 93.03 ± 4.27 76.0 – 100 -0.752 (.163) Final Course Exam (%) 87.49 ± 5.46 70.5 – 98.27 -0.535 (.178) Final Course Grade (%) 92.08 ± 3.12 74.95 – 98.57 -0.720 (.163) Needs Improvement at Midterm (#) 13.49 ± 7.10 0 – 26 -0.219 (.163) Midterm Section Score 65.08 ± 8.38 52 – 101 0.915 (.163) Final Section Score 86.06 ± 7.81 69 – 104 0.696 (.163) Midterm FWPE Score 107.09 ± 13.10 82 – 160 0.985 (.163) Final FWPE Score 140.00 ± 11.71 111 – 168 0.542 (.163) Midterm Comments (%) 37.96 ± 24.95 0-100 0.252 (.163)
Note. N=224 for all variables except Final Course Exam (N=187) due to missing data. Table 3 Descriptive of Level IIA Students’ Scores
Mean ± SD Range of Scores
Skewness (Std. Error)
Composite Skills Check (%) 93.31 ± 4.07 78 – 100 -0.685 (.220) Final Course Exam (%) 87.97 ± 5.28 70.5 – 97 -0.560 (.240) Final Course Grade (%) 92.24 ± 2.85 85.72 – 98.57 -0.087 (.220) Needs Improvement at Midterm 14.64 ± 6.77 0 – 25 -0.396 (.220) Midterm Section Score* 63.79 ± 7.96 52 – 99 1.165 (.220) Final Section Score 85.86 ± 7.62 74 – 104 0.826 (.220) Midterm FWPE Score* 105.5 ± 13.09 87 – 157 1.334 (.220) Final FWPE Score 139.8 ± 11.54 122 – 168 0.663 (.220) Midterm Comments (%) 38.92 ± 23.35 0 – 100 0.118 (.220) Final Comments (%)* 10.92 ± 17.62 0 – 77.78 1.692 (.220)
Note: N=121 for all variable except Final Course Exam (N=101) due to missing data. *Data were transformed for analysis.
7Lucas Molitor and Nissen: Simulation and Fieldwork Performance
Published by Encompass, 2020

Table 4 Descriptive of Level IIB Students’ Scores
Mean ± SD Range of Scores
Skewness (Std. Error)
Composite Skills Check (%) 92.71 ± 4.49 76 – 100 -0.787 (.238) Final Course Exam (%) 86.93 ± 5.64 70.5 – 98.27 -0.495 (.260) Final Course Grade (%)* 91.90 ± 3.40 70.5 – 98.27 -1.112 (.238) Needs Improvement at Midterm 12.14 ± 7.27 0 – 26 0.004 (.238) Midterm Section Score 66.58 ± 8.64 52 – 101 0.687 (.238) Final Section Score 86.30 ± 8.05 69 – 104 0.566 (.238) Midterm FWPE Score 108.95 ± 12.93 82 – 106 0.642 (.238) Final FWPE Score 140.23 ± 11.96 111 – 167 0.419 (.238) Midterm Comments (%) 36.83 ± 26.78 0 – 100 0.390 (.238) Final Comments (%)* 12.40 ± 19.71 0 – 100 1.866 (.238)
Note: N=103 for all variables except Final Course Exam (N=86) due to missing data. *Data were transformed for analysis. Correlations A Pearson correlation coefficient was calculated to determine the strength of the relationship between each variable in each group. The results of correlations found between variables of the didactic (composite skills check, final course exam, and final course grade) and fieldwork (Needs Improvement at midterm, midterm section score, midterm FWPE score, midterm comments, final section score, final comments, and final FWPE score) will be reported here. All students. A significant small positive correlation was found between final course exam and final FWPE score (r(187) = 0.242); final course grade and final FWPE score (r(187)=0.164); and between the final section score and composite skills check (r(187) = 0.159); final course exam (r(187) = 0.227); final course grade (r(187) = 0.154). Level IIA rotation. A significant small positive correlation was found between the final FWPE score and final course grade (r(101) = 0.222); composite skills check and composite section final (r(101) = 0.215); final FWPE score (r(101) = 0.199); final course exam and composite section final (r(101) = 0.274). A significant medium positive correlation was found between final course exam and final FWPE score (r(101) = 0.304). A significant small negative correlation was found between the composite skills check and midterm comments (r(101) = -0.206); final comments (r(101) = -0.216); final course grade and final comments (r(101) = -0.201). Level IIB rotation. There were no didactic variables that correlated with any of the fieldwork variables. Two correlations approached significance for a small positive correlation between the final course exam and final section score (r(86) = 0.186, p=0.087) and between final course exam and final FWPE score (r(86) = 0.182, p=0.093).
8Journal of Occupational Therapy Education, Vol. 4 [2020], Iss. 2, Art. 9
https://encompass.eku.edu/jote/vol4/iss2/9DOI: 10.26681/jote.2020.040209

Regression Analysis To determine if performance in an adult physical rehabilitation course can predict performance in an adult physical rehabilitation Level II Fieldwork, a linear regression was completed for each group. The variable of the final FWPE score was chosen as the dependent variable for the fieldwork variables because this was the fieldwork variable that was most highly correlated with the didactic variables. Regression analysis was only completed for the data and Level IIA rotation groups because there were no didactic variables correlated with any fieldwork variables in the Level IIB rotation group. All students. The final course exam score and final course grade were used to determine if they predicted the final FWPE score. A significant regression equation was found (F(2,184) = 5.74, p=0.004), with a R-squared value of 0.059. This indicates that 5.9% of the variance in the final FWPE score was predicted by the final course exam score. This is a small to medium effect size (Cohen, 1988). The final course grade was the only variable significantly contributing to the equation (p=0.013), so the regression analysis was repeated with only final course grade as a variable. This did not improve the level of variance predicted (R²=0.059). Level IIA rotation. The composite skills check, final course exam score, and final course grade were used to determine if they predicted the final FWPE score. A significant regression equation was found (F(3,97) = 3.904, p=0.011), with a R-squared value of 0.108. This indicates that 10.8% of the variance in the final FWPE score is predicted by the composite skills check final course exam score, and final course grade. This is a medium effect size (Cohen, 1988). The final course exam score was the only variable significantly contributing to the equation (p=0.013), so the regression analysis was repeated with only the final course exam score as a variable. This did not improve the level of variance predicted (R²=0.093). DISCUSSION The ability to determine student performance on fieldwork is complex and multi-faceted. The incidence of student failure on Level II fieldwork often represents a minimal number of students in a given occupational therapy program. Even when combining these students over the course of several years, reasons for fieldwork failure may relate to many variables, including professional development, critical reasoning, and clinical psychomotor skills. As the outcome of poor performance on fieldwork is challenging for the student, Academic Fieldwork Coordinator, the occupational therapy program, and the site, it is important to study methods to prevent failure on Level II fieldwork, while also promoting efficacy of current didactic instruction used in occupational therapy education, which this study aimed to do. Findings from this study highlight that performance on fieldwork can be determined, in part, by the final course exam. In this case, the adult physical rehabilitation course final exam was correlated to performance on Level II fieldwork. While this finding may seem obvious, evidence of such relationships is often reported only anecdotally within the profession and are nearly absent in the literature. Unlike the present study, previous research includes analysis of student performance on a single simulated experience
9Lucas Molitor and Nissen: Simulation and Fieldwork Performance
Published by Encompass, 2020

versus throughout an entire course (Tomlin, 2005). Occupational therapy instructors should consider incorporating ‘low stakes’ simulation designed for learning in addition to the ‘high stakes’ experiences outlined in this study as a means of being more equipped to judge skills such as therapeutic communication, client interaction, and ability to adjust and modify based on environmental factors and client performance. Perhaps the most significant finding reported in this study is the regression analysis which yielded a 10.8% prediction of variance when considering composite skills check, final course exam score, and final course grade. Thus, the combination of multiple aspects of an intervention and evaluation course played a part in determining how a student will perform in Level II fieldwork. The final practical exam and combined performance on several simulations (skills checks), in addition to their overall course performance, was the strongest method to determine success on fieldwork. This aligns with previous research which outlines that use of simulation provides an instructor an indication of future performance (Rutherford-Hemming & Jennrich, 2013) and while potentially anxiety-provoking (Baird et al., 2015a; Giles et al., 2014), simulated experiences present benefits for fieldwork preparation, a finding supported by previous research within occupational therapy. The use of standardized patients increases the fidelity of simulation and enhances real-world applicability. Interestingly, no correlations were found between any didactic variable and performance on Level IIB fieldwork. This indicated that other factors determine performance on a student’s second fieldwork rotation. As expected, a student may incorporate additional clinical experience, feedback received on Level IIA fieldwork, and increased experiential opportunities into overall performance on the second rotation. Didactic instruction at this point plays less of a factor. This is a positive finding, as the intent of Level II fieldwork is that students can adapt based on experiences and modify their performance going forward to ensure success as a student and future clinician (AOTA, 2018). Limitations Several limitations are recognized in this study. As is typical with course design, small changes were made each year this course was instructed. For example, the number of points each skill check was assigned varied slightly, meaning that in some cohorts simulations may have been viewed as higher stakes. While all simulations were carried out in the same simulation center, multiple standardized patients were utilized each year this course was instructed. Further, two different faculty taught the course during the timeframe for which data was collected. Slight variability in actors may have influenced student performance. Additionally, data were collected during a transition from MS to OTD at this university. While the adult physical disabilities course remained the same regardless of degree, this may have had a small influence on outcomes. Authors recognize the subjectivity and complexity to rating a Level II student’s performance. This was minimized by coding results from the FWPE and ensuring an acceptable kappa value was reached between each author. Study authors completed both the coding and analysis of data. While this is recognized as a potential limitation, the risk of bias was minimized by de-identifying student information to limit potential bias
10Journal of Occupational Therapy Education, Vol. 4 [2020], Iss. 2, Art. 9
https://encompass.eku.edu/jote/vol4/iss2/9DOI: 10.26681/jote.2020.040209

during the coding process. Other factors outside didactic instruction were not considered in this study. Thus, a student who had outside influences on performance (family issues, anxiety, etc.) may have increased or decreased performance once these factors were addressed. In addition, other variables aside from performance in simulation, could have played a role in student fieldwork performance. Including multiple didactic and fieldwork indicators helped to minimize this consideration, yet it is impossible to fully remove outside factors. IMPLICATIONS FOR OCCUPATIONAL THERAPY EDUCATION As the use of simulation varies widely between occupational therapy programs, occupational therapy educators can utilize results of this study to adjust the curriculum to include simulation. Discussion between student and faculty regarding the link between performance in simulation and the relationship to fieldwork may serve as a method of increasing the relevance from the student perspective. This study highlights the need for additional inquiry in the occupational therapy literature regarding the utilization of simulation and best practice methods for simulation to be utilized as a method for fieldwork preparation. Occupational therapy educators who identify students who struggle with performance in simulation may provide additional opportunities to students prior to the onset of fieldwork. Exploring if additional high or low stakes experiences resulted in future fieldwork success is an area of future study. Occupational therapy educators should continue to study the outcomes of simulation in course instruction. Reporting broad approaches and practices can only serve to advance the professional education of current and future students. Further, research should be carried out that incorporates the viewpoint of standardized patients and their experiences in interacting with occupational therapy students during simulation in lab or during examination. This can provide additional insight into student therapeutic rapport, professionalism, hands-on skills, and client interaction as well as demeanor and ability to engage in an inclusive and culturally relevant manner. Finally, as demand on clinical sites for increasingly more fieldwork students continues to increase, it is essential that students are equipped to succeed on Level II fieldwork. Research should explore the perceptions of fieldwork educators, and students themselves as they transition to and complete these experiences. CONCLUSION If the intent of didactic instruction is to transfer learning to practice, then the use of simulated opportunities is critical to occupational therapy education. Despite the inclusion of simulation into curricula, a dearth of literature within occupational therapy specifically outlines the benefits of simulation on fieldwork performance. The current study explored this critical topic, noting positive implications for the use of simulation and practical examinations as one predictor of success on a first Level II fieldwork rotation.
11Lucas Molitor and Nissen: Simulation and Fieldwork Performance
Published by Encompass, 2020
References
American Occupational Therapy Association (2002). AOTA Fieldwork Performance Evaluation for the Occupational Therapy Student. Bethesda, MD: Author.
American Occupational Therapy Association. (2018). Fieldwork Level II and occupational therapy students. American Journal of Occupational Therapy, 72(Suppl. 2), 7212410020. https://doi.org/10.5014/ajot.2018.72S205
Andonian, L. (2013). Emotional intelligence, self-efficacy, and occupational therapy students’ fieldwork performance. Occupational Therapy in Health Care, 27(3), 201-215. https://doi.org/10.3109/07380577.2012.763199
Baird, J. M., Raina, K. D., Rogers, J. C., O’Donnell, J., & Holm, M. B. (2015a). Wheelchair transfer simulations to enhance procedural skills and clinical reasoning. American Journal of Occupational Therapy, 69(Suppl. 2), 6912185020. https://doi.org/10.5014/ajot.2015.018697
Baird, J. M., Raina, K. D., Rogers, J. C., O’Donnell, J., Terhorst, L., & Holm, M. B. (2015b). Simulation strategies to teach patient transfers: Self-efficacy by strategy. American Journal of Occupational Therapy, 69 (Suppl. 2), 6912185030. https://doi.org/10.5014/ajot.2015.018705
Barrows, H. S. (1993). An overview of the uses of standardized patients for teaching and evaluating clinical skills. Academic Medicine, 68(6), 443-451. https://doi.org/10.1097/00001888-199306000-00002
Bennett, S., Rodger, S., Fitzgerald, C., & Gibson, L. (2017). Simulation in occupational therapy curricula: A literature review. Australian Occupational Therapy Journal, 64, 314-327. https://doi.org/10.1111/1440-1630.12372
Bethea, D. P., Castillo, D. C., & Harvison, N. (2014). Use of simulation in occupational therapy education: Way of the future? American Journal of Occupational Therapy, 68(Supplement 2), S32-S39. https://doi.org/10.5014/ajot.2014.012716
Brannan, J. D., White, A., & Bezanson, J.L. (2008). Simulator effects on cognitive skills and confidence levels. Journal of Nursing Education, 47(11), 495-500. https://doi.org/10.3928/01484834-20081101-01
Cohen, J. (1988). Statistical power and analysis for the behavioral sciences (2nd ed.). Hillsdale, NJ: Lawrence Erlbaum.
Cook, D. A., Hatala, R., Brydges, R., Zendejas, B., Szostek, J. H., Wang, A. T….Hamstra, S.J. (2011). Technology-enhanced simulation for health professions education: A systematic review and meta-analysis. Journal of the American Medical Association, 306, 978-988. https://doi.org/10.1001/jama.2011.1234
Gaba, D. M. (2004). The future vision of simulation in health care. Quality and Safety in Health Care, 13(Suppl. 1), i2–i10. https://doi.org/10.1136/qshc.2004.009878
Gibbs, D. M., Dietrich, M., & Dagnan, E. (2017). Using high fidelity simulation to impact occupational therapy student knowledge, comfort, and confidence in acute care. Open Journal of Occupational Therapy, 5(1), 10-18. https://doi.org/10.15453/2168-6408.1225
12Journal of Occupational Therapy Education, Vol. 4 [2020], Iss. 2, Art. 9
https://encompass.eku.edu/jote/vol4/iss2/9DOI: 10.26681/jote.2020.040209

Giles, A. K., Carson, N. E., Breland, H. L., Coker-Bolt, P., & Bowman, P. J. (2014). Conference Proceedings - Use of simulated patients and reflective video analysis to assess occupational therapy students’ preparedness for fieldwork. American Journal of Occupational Therapy, 68(Supplement 2), S57-S66. https://doi.org/10.5014/ajot.2014.685S03
Gustafsson, L. (2016). Visioning the future for practice education. Australian Journal of Occupational Therapy, 63, 301-302. https://doi.org/10.1111/1440-1630.12332
Herge, E. A., Lorch, A., DeAngelis, T., Vause-Earland, T., Mollo, K. & Zapletal, A. (2013). The standardized patient encounter: A dynamic educational approach to enhance students’ clinical healthcare skills. Journal of Allied Health, 42, 229-235.
IBM Corp. (2017). Statistical Pack for Social Sciences. Version 25.0. Armonk, NY: IBM Corp.
Issenberg, S. B., McGaghie, W. C., Petrusa, E. R., Gordon, D.L., & Scalese, R. J. (2005). Features and uses of high-fidelity medical simulations that lead to effective learning: A BEME systematic review. Medical Teacher, 27(1), 10-28. https://doi.org/10.1080/01421590500046924
Knecht-Sabres, L.J., Kovic, M., Wallingford, M., & St. Amand, L.E. (2013). Preparing occupational therapy students for the complexities of clinical practice. Open Journal of Occupational Therapy, 1(3), 1-16. https://doi.org/10.15453/2168-6408.1047
Lindstrom-Hazel, D., & West-Frasier, J. (2004). Preparing students to hit the ground running with problem-based learning standardized simulations. American Journal of Occupational Therapy, 58(2), 236-239. https://doi.org/10.5014/ajot.58.2.236
Lopreiato, J. O. (Ed.), Downing, D., Gammon, W., Lioce, L., Sittner, B., Slot, V., & Spain, A. E. (Associate Eds.). (2016). Healthcare Simulation Dictionary. Retrieved from http://www.ssih.org/dictionary
Nagle, B. M., McHale, J. M., Alexander, G. A., French, B. M. (2009). Incorporating scenario-based simulation into a hospital nursing education program. Journal of Continuing Education in Nursing, 40(1), 18-25. https://doi.org/10.3928/00220124-20090101-02
Portney, L. G., & Watkins, M. P. (2009). Foundations of clinical research: Applications to practice (3rd ed.). Upper Saddle River, NJ: Pearson/ Prentice Hall.
Rutherford-Hemming, T. (2012). Simulation methodology in nursing education and adult learning theory. Adult Learning, 23(3), 129-137. https://doi.org/10.1177/1045159512452848
Rutherford-Hemming, T., & Jennrich, J. A. (2013). Using standardized patients to strengthen nurse practitioner competency in the clinical setting. Nursing Education Perspectives, 34(2), 118-121. https://doi.org/10.5480/1536-5026-34.2.118
Society for Simulation in Helathcare. (2019). About Simulation. Retrieved from https://www.ssih.org/About-SSH/About-Simulation
Thomas, E. M., Rybski, M. F., Apke, T. L., Kefelmeyer, D. A., & Kloos, A. D. (2017). An acute interprofessional simulation experience for occupational therapy and physical therapy students: Key findings from a survey study. Journal of International Care, 31(3), 317-324. https://doi.org/10.1080/13561820.2017.1280006
13Lucas Molitor and Nissen: Simulation and Fieldwork Performance
Published by Encompass, 2020

Thomas, Y., Dickson, D., Broadbridge, J., Hopper, L., Hawkins, R., Edwards, A., & McBryde, C. (2007). Benefits and challenges of supervising occupational therapy fieldwork students: Supervisors’ perspectives. Australian Occupational Therapy Journal, 54, S2-S12. https://doi.org/10.1111/j.1440-1630.2007.00694.x
Tomlin, G. (2005). The use of interactive video client simulation scores to predict clinical performance of occupational therapy students. American Journal of Occupational Therapy, 59(1), 50-56. https://doi.org/10.5014/ajot.59.1.50
Velde, B. P., Lane, H. & Clay, M. (2009). Hands on learning: The use of simulated clients in intervention cases. Journal of Allied Health, 38, E17-E21.
Yeung, E., Dubrowski, A. & Carnahan, H. (2013). Simulation-augmented education in the rehabilitation professions: A scoping review. International Journal of Therapy & Rehabilitation, 20(5), 228-236. https://doi.org/10.12968/ijtr.2013.20.5.228
14Journal of Occupational Therapy Education, Vol. 4 [2020], Iss. 2, Art. 9
https://encompass.eku.edu/jote/vol4/iss2/9DOI: 10.26681/jote.2020.040209