Embed Size (px)
Citation preview

2013 ANNUAL REPORT
This document was printed using soy–based inks and paper containing 30% postconsumer recycled fiber. The paper was produced by a Forest Stewardship Council™ (FSC®) Chain of Custody supplier. Printing was done according to ISO workflow procedures. © 2014 TE Connectivity Ltd. All Rights Reserved.001-AR-2013 TE Connectivity and TE Connectivity (logo) are trademarks. Other logos, product and/or company names might be trademarks of their respective owners.
CORPORATE DATAREGISTERED & PRINCIPALEXECUTIVE OFFICETE Connectivity Ltd.Rheinstrasse 20CH-8200 SchaffhausenSwitzerland+41.0.52.633.66.61 INDEPENDENT AUDITORSDeloitte & Touche LLP1700 Market StreetPhiladelphia, PA 19103 Deloitte AGGeneral Guisan-Quai 38CH-8022 ZurichSwitzerland STOCK EXCHANGEThe company’s common shares are traded on the New York Stock Exchange (NYSE) under the ticker symbol TEL. FORM 10-KCopies of the company’s Annual Report on Form 10-K for the fiscal year ended September 27, 2013 may be obtained by shareholders without charge upon written request toTE Connectivity Ltd., Rheinstrasse 20,CH-8200 Schaffhausen, Switzerland.The Annual Report on Form 10-K is also available on the company’s website at www.te.com
SHAREHOLDER SERVICESRegistered shareholders (shares held in your own name with our transfer agent) with requests such as change of address or dividend checks should contact TE Connectivity’s transfer agent at: Wells Fargo Shareowner Services1110 Centre Pointe Curve, Suite 101Mendota Heights, MN 55120-4100866.258.4745www.shareowneronline.com
Beneficial shareholders (shares held with a bank or broker) should contact the bank or brokerage holding their shares with their requests. Other shareholder inquiries may be directed to TE Connectivity Shareholder Services at the company’s registered and principal executive office above.
www.te.com
20
13 A
NN
UA
L R
EP
OR
T

TE Connectivity is a technology leader that designs and manufactures the electronic connectors, components and systems inside the products that are changing the world—making them smarter, safer, greener and more connected.
*See Non-GAAP MeasuresAll figures FY13 unless otherwise noted
EVERY CONNECTION COUNTS
ABOUT OUR COVER DESIGNThis year’s annual report cover features TE Connectivity engineers who reflect the engineering spirit of our company. These individuals were featured in our new advertising campaign. To learn more about the campaign, please visit www.everyconnectioncounts.com.
$13.3BIN SALES
14.2%ADJUSTED
OPERATINGMARGIN*
$1.5BFREE CASH FLOW*
2013 ANNUAL REPORT
BOARD OF DIRECTORS
LEADERSHIP TEAM AND OFFICERS
Thomas J. Lynch Chairman & Chief Executive Officer, TE Connectivity Ltd.
Dr. Pierre R. Brondeau President, Chair & Chief Executive Officer, FMC Corporation
Dr. Juergen W. Gromer Retired President, Tyco Electronics
Dr. William A. JeffreyChief Executive Officer & President,HRL Laboratories, LLC
Yong NamAdvisor to the CEO,Daelim Industrial Co. Ltd.
Daniel J. Phelan Retired Chief of Staff, GlaxoSmithKline plc
Frederic M. Poses* Chief Executive Officer & Partner, Ascend Performance Materials Lawrence S. Smith Retired Executive Vice President & Co-CFO, Comcast Corporation
Paula A. Sneed Chair & Chief Executive Officer, Phelps Prescott Group, LLC
David P. Steiner President, Chief Executive Officer & Director, Waste Management, Inc.
John C. Van Scoter President, Chief Executive Officer & Director, eSolar, Inc.
* Lead Independant Director of the TE Connectivity Ltd. Board of Directors
Thomas J. Lynch Chairman & Chief Executive Officer
Mario CalastriSenior Vice President,Treasurer
Terrence R. CurtinPresident, Industrial Solutions
Joseph B. DonahueExecutive Vice President,Chief Operating OfficerPresident, Network Solutions
Joseph F. Eckroth, Jr.Senior Vice President,Chief Information Officer
Bradley A. GambillSenior Vice President, Strategy & Business Development
Robert W. HauExecutive Vice President,Chief Financial Officer
John S. Jenkins, Jr.Executive Vice President,General Counsel
Jane A. LeipoldSenior Vice President,Global Human Resources
Steven T. Merkt President, Transportation Solutions
Minoru OkamotoSenior Advisor to the CEO
James O’ToolePresident, Consumer Solutions
Robert J. OttSenior Vice President,Corporate Controller
Eric J. ReschSenior Vice President,Chief Tax Officer
Robert N. ShaddockExecutive Vice President,Chief Technology Officer
Amy B. ShahSenior Vice President,Chief Marketing Officer
Joan E. WainwrightPresident, Channel & Customer Experience

TE offers the broadest range of products to address just about every connectivity challenge our customers face.
CONNECTORS
PRECISIONWIRE & CABLES
ANTENNAS
FIBER OPTICSSEALING &PROTECTING
HARSH ENVIRONMENTS
RELAYSSENSORS
UNMATCHED CONNECTIVITY PORTFOLIO

TOM LYNCH | CHAIRMAN & CEOMESSAGE TO OUR STAKEHOLDERS
It is an exciting time for TE Connectivity. The world’s need for more efficient and greener energy and information anytime, anywhere continues to grow rapidly. This demand requires more electronics, more connections and more TE products than ever. As the leading supplier of electronic connections, we are in a great position to capitalize on these technology trends.
In fiscal 2013, TE led the industry with $13.3 billion in revenue and delivered adjusted earnings per share of $3.23, up 13 percent from the prior year and a new record for the company. We generated over $1.5 billion of free cash flow, another record for the company. Importantly, we exceeded 15 percent adjusted operating margin in the fourth quarter at an annualized revenue rate of less than $14 billion.
TOM LYNCH | CHAIRMAN & CEO
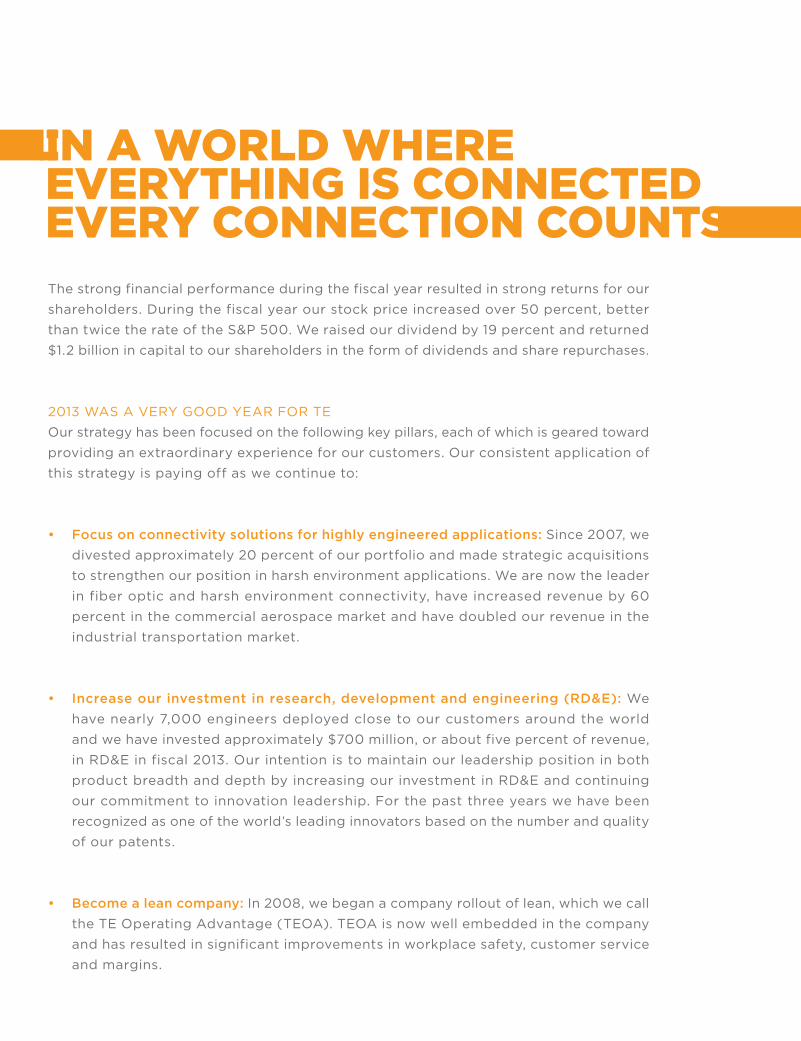
The strong financial performance during the fiscal year resulted in strong returns for our shareholders. During the fiscal year our stock price increased over 50 percent, better than twice the rate of the S&P 500. We raised our dividend by 19 percent and returned $1.2 billion in capital to our shareholders in the form of dividends and share repurchases.
2013 WAS A VERY GOOD YEAR FOR TEOur strategy has been focused on the following key pillars, each of which is geared toward providing an extraordinary experience for our customers. Our consistent application of this strategy is paying off as we continue to:
• Focus on connectivity solutions for highly engineered applications: Since 2007, we divested approximately 20 percent of our portfolio and made strategic acquisitions to strengthen our position in harsh environment applications. We are now the leader in fiber optic and harsh environment connectivity, have increased revenue by 60 percent in the commercial aerospace market and have doubled our revenue in the industrial transportation market.
• Increase our investment in research, development and engineering (RD&E): We have nearly 7,000 engineers deployed close to our customers around the world and we have invested approximately $700 million, or about five percent of revenue, in RD&E in fiscal 2013. Our intention is to maintain our leadership position in both product breadth and depth by increasing our investment in RD&E and continuing our commitment to innovation leadership. For the past three years we have been recognized as one of the world’s leading innovators based on the number and quality of our patents.
• Become a lean company: In 2008, we began a company rollout of lean, which we call the TE Operating Advantage (TEOA). TEOA is now well embedded in the company and has resulted in significant improvements in workplace safety, customer service and margins.

• Invest aggressively and for the long-term in emerging markets: We are especially strong across the globe in our Transportation Solutions segment and have solid businesses in the Industrial Solutions and Network Solutions segments. In the past year, our Consumer Solutions segment relocated its base to China in order to strengthen our position in this industry. Across our segments, we have 2,300 engineers in emerging markets and now have strong design capabilities in all our key high-growth markets.
• Reshape our manufacturing and supply chain footprint and reduce our fixed costs: In 2013, we invested significantly in restructuring to continue to balance our footprint with future demand. These actions are substantially complete and, as a result, we are a much more efficient company.
Looking ahead, I am bullish about the prospects for TE in fiscal 2014 and beyond. Our leadership position at the heart of the rapid growth of electronics should enable us to achieve
TE operates through four reporting segments aligned to our strategy and vertical markets.
organic sales growth of five to seven percent over the long-term. The significant operational improvements we have made should enable us to deliver consistent double-digit earnings growth and continue to generate free cash flow in excess of 10 percent of sales. Our financial strength enables us to continue to increase our investments in technology, make strategic acquisitions and consistently return capital to our shareholders.
In closing, I would like to thank our employees around the world for their continued commitment to our customers, the communities we serve, and for making TE an even better company. I look forward to a strong fiscal 2014 and thank you for your continued support.
Tom Lynch
Chairman and Chief Executive Officer
January 7, 2014
See Non-GAAP Measures for adjusted earnings per share, free cash flow, adjusted operating margin, and organic sales growth descriptions and reconciliations.
FY13 Sales
TE SEGMENTS

(seated l to r) Bob Hau, Jane Leipold, James O’Toole, Tom Lynch, Steve Merkt, Rob Shaddock
(standing l to r)
Joe Donahue, Amy Shah, Brad Gambill, Terrence Curtin, Joe Eckroth, John Jenkins, Joan Wainwright
Not present: Minoru Okamoto
Executive titles can be found on the back inside cover.
TE LEADERSHIP TEAM

SAFE, GREEN AND CONNECTED
$5.5B #1SALES BY MARKET:ChinaNorth AmericaKoreaJapanEMEASouth AmericaFY13 SALES
TOP AUTOMOTIVE CONNECTOR SUPPLIER IN ALL MAJOR AUTOMOTIVE MARKETS
12
3
317
16
6–8%TE Long-Term Growth Rate
TE Market Share in Connectors
40% $17BAutomotive Market
TRANSPORTATION SOLUTIONS
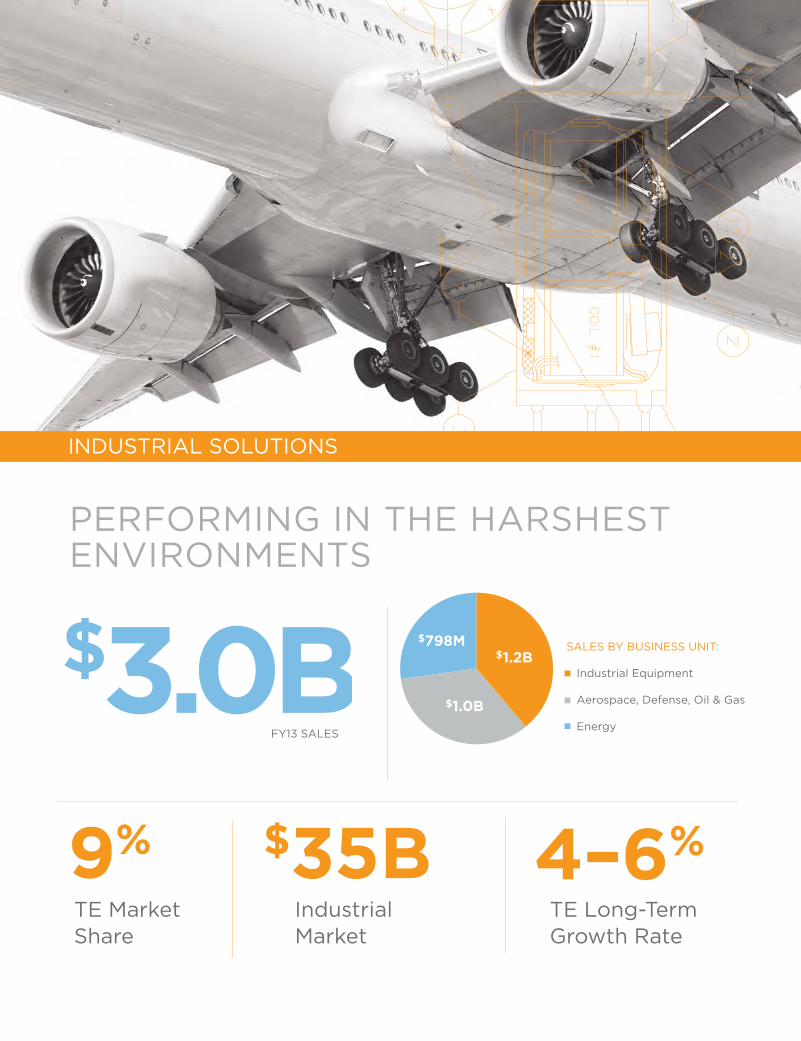
$3.0B $1.2B$798M
$1.0B
SALES BY BUSINESS UNIT:
Industrial Equipment
Aerospace, Defense, Oil & Gas
EnergyFY13 SALES
4–6%TE Long-Term Growth Rate
TE Market Share
9% $35BIndustrial Market
PERFORMING IN THE HARSHEST ENVIRONMENTS
INDUSTRIAL SOLUTIONS
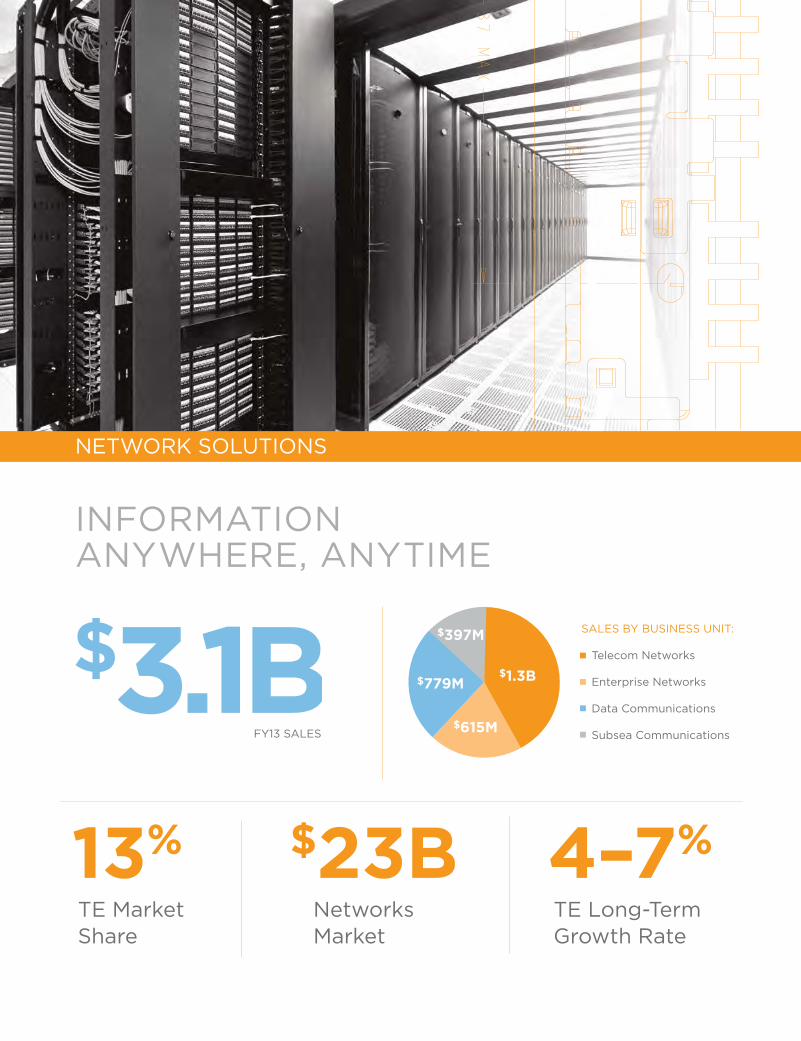
$3.1B SALES BY BUSINESS UNIT:
Telecom Networks
Enterprise Networks
Data Communications
Subsea Communications
$1.3B
$615M
$397M
4–7%
FY13 SALES
TE Long-Term Growth Rate
$779M
INFORMATION ANYWHERE, ANYTIME
TE Market Share
13% $23BNetworks Market
NETWORK SOLUTIONS

$1.7B SALES BY BUSINESS UNIT:
Appliances
Consumer Devices
$711M
FY13 SALES
$1.0B
LIFE, ALWAYS CONNECTED
3–5%TE Long-Term Growth Rate
TE Market Share
9% $19BConsumer Market
CONSUMER SOLUTIONS

DRIVING OPERATIONAL EXCELLENCE

TE Operating Advantage (TEOA) began in 2008 with a goal of accelerating and improving our supply chain , product development processes and manufacturing operations. In just five years, TEOA is now the companywide philosophy and operating management system that is helping us achieve significantly higher customer satisfaction, greater employee engagement and improved operating and financial results.
Embedding TEOA into our daily work — across all functions and around the globe — and integrating it into what we do is the key to driving higher levels of performance. TEOA empowers our employees and helps our teams deliver exceptional results for our customers and shareholders.
13,000
2X
90%
EMPLOYEES TRAINED ON TEOA
ON-TIME DELIVERY
IMPROVEMENT IN CUSTOMER SATISFACTION IN 5 YEARS(AS MEASURED BY NET PROMOTER SCORE SURVEY)
David Carter, Manager of TE’s Braintree, UK operationswhich achieved “Star Level 5” status in 2013, the company’s highest level of performance
“ EMPLOYEE OWNERSHIP OF PROCESS IMPROVEMENTS AT ALL LEVELS IS DELIVERING BREAKTHROUGH PERFORMANCE.”
DRIVING OPERATIONAL EXCELLENCE

INNOVATION THROUGH ENGINEERING
12
INNOVATION THROUGH ENGINEERING
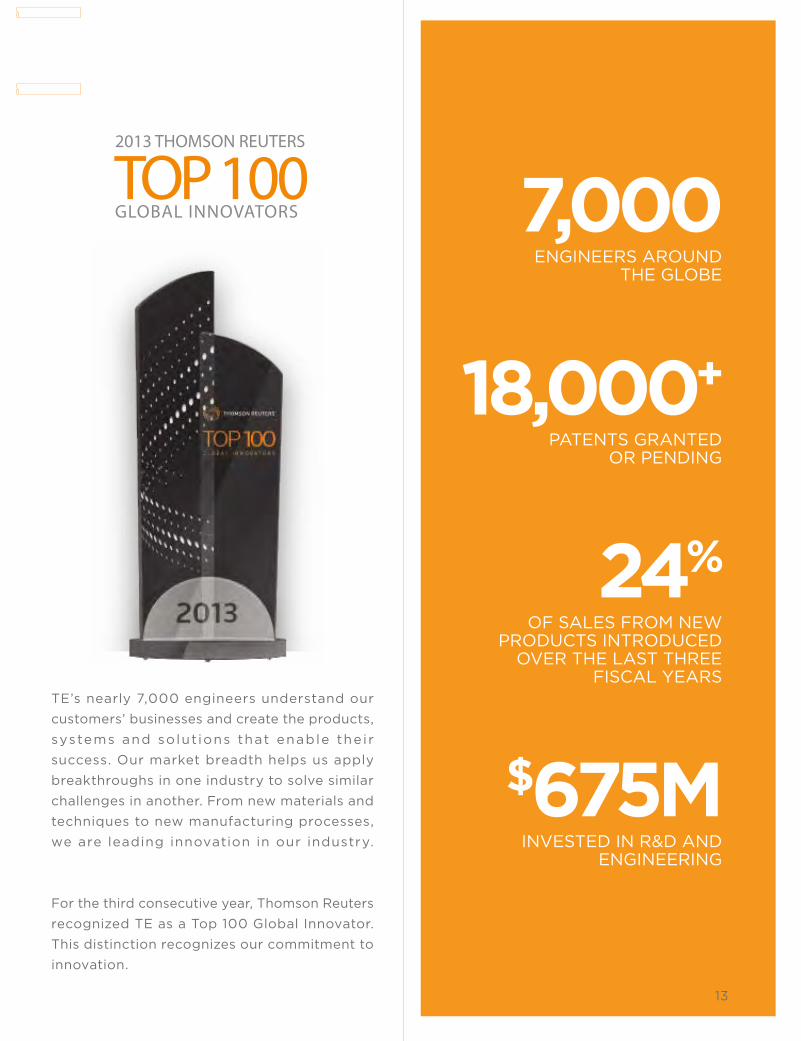
7,000
18,000+
$675M
24%
ENGINEERS AROUNDTHE GLOBE
PATENTS GRANTEDOR PENDING
INVESTED IN R&D AND ENGINEERING
OF SALES FROM NEWPRODUCTS INTRODUCED
OVER THE LAST THREEFISCAL YEARS
TE’s nearly 7,000 engineers understand our customers’ businesses and create the products, systems and solutions that enable the ir success. Our market breadth helps us apply breakthroughs in one industry to solve similar challenges in another. From new materials and techniques to new manufacturing processes, we are leading innovation in our industry.
For the third consecutive year, Thomson Reuters recognized TE as a Top 100 Global Innovator. This distinction recognizes our commitment to innovation.
13
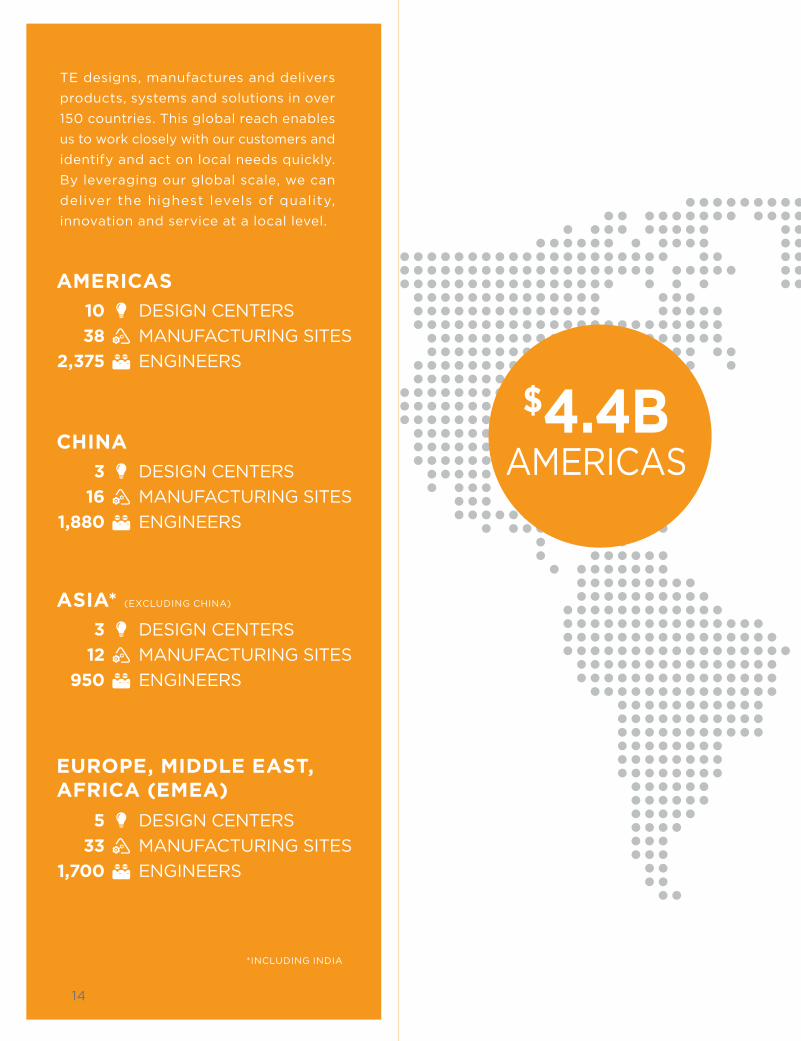
TE designs, manufactures and delivers products, systems and solutions in over 150 countries. This global reach enables us to work closely with our customers and identify and act on local needs quickly. By leveraging our global scale, we can deliver the highest levels of quality, innovation and service at a local level.
AMERICAS
CHINA
ASIA* (EXCLUDING CHINA)
EUROPE, MIDDLE EAST,AFRICA (EMEA)
$4.4BAMERICAS
LOCAL PRESENCE SUPPORTED BY GLOBAL SCALE
1038
2,375
DESIGN CENTERSMANUFACTURING SITESENGINEERS
316
1,880
DESIGN CENTERSMANUFACTURING SITESENGINEERS
312
950
DESIGN CENTERSMANUFACTURING SITESENGINEERS
533
1,700
DESIGN CENTERSMANUFACTURING SITESENGINEERS
*INCLUDING INDIA
14

$2.3BASIA*
(excluding China)
$2.2BCHINA
$4.4BEMEA
SALES WORLDWIDE
$13.3B
LOCAL PRESENCE SUPPORTED BY GLOBAL SCALE

SUPPORTING OUR COMMUNITIES
Our communities, customers, suppliers, employees and businesses are all connected. TE is committed to being a responsible steward of the environment and helping our communities become stronger.
In 2013, TE responded to major disasters around the globe, including Hurricane Sandy in the United States and the earthquake in China’s Sichuan province. TE employees in India gave to Oxfam India to help the estimated 100,000 people affected by the floods in the Uttarakhand region. And in the Czech Republic, employees helped their neighbors rebuild after the devastating floods by donating pumps, generators and other much-needed goods.
We support our communities through our global giving program and employee volunteerism. It is our desire to achieve a positive impact in the communities where TE does business.
HELPING COMMUNITIES
1,500CHARITABLE ORGANIZATIONS

SUPPORTING OUR COMMUNITIES
OUR CORE VALUES
At TE, we believe that it takes more than strong performance to bui ld a great company. It also requires an unwavering commitment to our core values and the highest standards of ethics and integrity.
INTEGRITY We must demand of ourselves and of each other the highest standards of individual and corporate integrity. We safeguard company assets. We comply with all laws and company policies. We are dedicated to diversity, fair treatment, mutual respect and trust.
ACCOUNTABILITY We honor the commitments we make and take personal responsibility for all actions and results. We create an operating discipline of continuous improvement that is an integral part of our culture.
TEAMWORK We foster an environment that encourages innovation, creativity, excellence and results through teamwork. We practice leadership that teaches, inspires and promotes full participation and career development. We encourage open and effective communication and interaction.
INNOVATION We recognize that innovation is the foundation of our business. We challenge ourselves to develop new and improved ideas for all that we do. We encourage, expect and value creativity, openness to change and fresh approaches.
TE’s active corporate social responsibility program emphasizes employee volunteerism. Skills-based volunteering is one unique way that TE’s law department participates in these social responsibility efforts. Our lawyers and our legal support staff are making a meaningful impact by using their legal skills and services to assist business owners, non-profit organization leaders and first responders who are serving our communities. TE was recognized by two organizations in 2013 for our pro bono work. The Association of Corporate Counsel (ACC) presented TE with the 2013 ACC Corporate Pro Bono Award for outstanding achievement and the Philadelphia Bar Association awarded TE with its 2013 Pro Bono Award.
The Dow Jones Sustainability Indices are the first global sustainability benchmarks that track the financial performance of the world’s leading companies in terms of economic, environmental and social criteria. Being environmentally and socially responsible has always been important to TE. This acknowledgement is a testament to the success of our efforts.
CORPORATESOCIAL RESPONSIBILITY
DOW JONES SUSTAINABILITY INDICES
MEMBER 2012/2013
17
NON-GAAP MEASURES
“Organic Sales Growth,” “Adjusted Operating Margin,” “Adjusted Operating Income,” “Adjusted Earnings Per Share,” and “Free Cash Flow” (FCF) are non-GAAP measures and should not be considered replacements for GAAP* results. (*U.S. Generally Accepted Accounting Principles)
“Organic Sales Growth” is a useful measure used by us to measure the underlying results and trends in the business. The difference between reported net sales growth (the most comparable GAAP measure) and Organic Sales Growth (the non-GAAP measure) consists of the impact from foreign currency exchange rates and acquisitions and divestitures, if any. Organic Sales Growth is a useful measure of our performance because it excludes items that: i) are not completely under management’s control, such as the impact of changes in foreign currency exchange rates; or ii) do not reflect the underlying growth of the company, such as acquisition and divestiture activity. The limitation of this measure is that it excludes items that have an impact on our sales. This limitation is best addressed by using Organic Sales Growth in combination with the GAAP results.
We present operating margin before special items including charges or income related to legal settlements and reserves, restructuring and other charges, acquisition related charges, impairment charges and other income or charges, if any (“Adjusted Operating Margin”). We present Adjusted Operating Margin before special items to give investors a perspective on the underlying business results. It also is a significant component in our incentive compensation plans. This measure should be considered in conjunction with operating margin calculated using our GAAP results in order to understand the amounts, character and impact of adjustments to operating margin.
We present operating income before special items including charges or income related to legal settlements and reserves, restructuring and other charges, acquisition related charges, impairment charges and other income or charges, if any (“Adjusted Operating Income”). We utilize Adjusted Operating Income to assess segment-level core operating performance and to provide insight to management in evaluating segment operating plan execution and underlying market conditions. It also is a significant component in our incentive compensation plans. Adjusted Operating Income is a useful measure for investors because it provides insight into our underlying operating results, trends and the comparability of these results between periods. The difference between Adjusted Operating Income and operating income (the most comparable GAAP measure) consists of the impact of charges or income related to legal settlements and reserves, restructuring and other charges, acquisition related charges, impairment charges and other income or charges, if any, that may mask the underlying operating results and/or business trends. The limitation of this measure is that it excludes the financial impact of items that would otherwise either increase or decrease our reported operating income. This limitation is best addressed by using Adjusted Operating Income in combination with operating income (the most comparable GAAP measure) in order to better understand the amounts, character and impact of any increase or decrease on reported results.
We present diluted earnings per share from continuing operations attributable to TE Connectivity Ltd. before special items, including charges or income related to legal settlements and reserves, restructuring and other charges, acquisition related charges, impairment charges, tax sharing income related to certain proposed adjustments to prior period tax returns and other tax items, certain significant special tax items, other income or charges, if any, and, if applicable, related tax effects (“Adjusted Earnings Per Share”). We present Adjusted Earnings Per Share because we believe that it is appropriate for investors to consider results excluding these items in addition to results in accordance with GAAP. We believe such a measure provides a picture of our results that is more comparable
among periods since it excludes the impact of special items, which may recur, but tend to be irregular as to timing, thereby making comparisons between periods more difficult. It also is a significant component in our incentive compensation plans. The limitation of this measure is that it excludes the financial impact of items that would otherwise either increase or decrease our reported results. This limitation is best addressed by using Adjusted Earnings Per Share in combination with diluted earnings per share from continuing operations attributable to TE Connectivity Ltd. (the most comparable GAAP measure) in order to better understand the amounts, character and impact of any increase or decrease on reported results.
“Free Cash Flow” (FCF) is a useful measure of our ability to generate cash. It also is a significant component in our incentive compensation plans. The difference between net cash provided by continuing operating activities (the most comparable GAAP measure) and FCF (the non-GAAP measure) consists mainly of significant cash outflows and inflows that we believe are useful to identify. We believe free cash flow provides useful information to investors as it provides insight into the primary cash flow metric used by management to monitor and evaluate cash flows generated from our operations.
FCF is defined as net cash provided by continuing operating activities excluding voluntary pension contributions and the cash impact of special items, if any, minus net capital expenditures. Net capital expenditures consist of capital expenditures less proceeds from the sale of property, plant and equipment. They are subtracted because they represent long-term commitments. Voluntary pension contributions are excluded from the GAAP measure because this activity is driven by economic financing decisions rather than operating activity. Certain special items, including net payments related to pre-separation tax matters, also are considered by management in evaluating free cash flow. We believe investors should also consider these items in evaluating our free cash flow. We forecast our cash flow results excluding any voluntary pension contributions because we have not yet made a determination about the amount and timing of any such future contributions. In addition, our forecast excludes the cash impact of special items because we cannot predict the amount and timing of such items.
FCF as presented herein may not be comparable to similarly-titled measures reported by other companies. The primary limitation of this measure is that it excludes items that have an impact on our GAAP cash flow. Also, it subtracts certain cash items that are ultimately within management’s and the Board of Directors’ discretion to direct and may imply that there is less or more cash available for our programs than the most comparable GAAP measure indicates. This limitation is best addressed by using FCF in combination with the GAAP cash flow results. It should not be inferred that the entire free cash flow amount is available for future discretionary expenditures, as our definition of free cash flow does not consider certain non-discretionary expenditures, such as debt payments. In addition, we may have other discretionary expenditures, such as discretionary dividends, share repurchases and business acquisitions, that are not considered in the calculation of free cash flow.
Because we do not predict the amount and timing of special items that might occur in the future, and our forecasts are developed at a level of detail different than that used to prepare GAAP-based f inancial measures , we do not provide reconciliations to GAAP of our forward-looking financial measures.

RECONCILIATION OF NON-GAAP FINANCIAL MEASURES TO GAAP FINANCIAL MEASURES US$ IN MILLIONS, ExCEPT PEr ShArE DATA
Operating Income
Operating Margin
Diluted Earnings per Share from Continuing Operations Attributable to TE Connectivity Ltd.
$ 1,556
11.7%
$ 3.02
U.S. GAAP
Acquisition- related Charges
restructuringand Other
Charges, NetTax Items (1)
Adjusted(Non-GAAP) (2)
$ 14
$ 0.02
$ 311
$ 0.52
$ -
$ (0.33)
$ 1,881
14.2%
$ 3.23
ADjUSTMENTS
(1) Includes $331 million of income tax benefits associated with the settlement of an audit of prior-year income tax returns as well as the related impact of $231 million to other expense pursuant to the tax sharing agreement with Tyco International and Covidien. Also includes income tax expense related to adjustments to prior year income tax returns, income tax benefits recognized in connection with a reduction in the valuation
allowance associated with certain tax loss carryforwards and income tax benefits recognized in connection with the lapse of statutes of limitations for examinations of prior year income tax returns. In addition, includes other income adjustment related to reimbursements by Tyco International and Covidien in connection with pre-separation tax matters.
(2) See description of non-GAAP measures contained in this report.
FISCAL YEAr 2013
Diluted Earnings per Share from Continuing Operations Attributable to TE Connectivity Ltd. $ 2.70
U.S. GAAP
Acquisition- related
Charges (1)
restructuringand Other
Charges, NetTax Items (2)
Adjusted(Non-GAAP) (3)
$ 0.21 $ 0.19 $ (0.25) $ 2.86
ADjUSTMENTS
(1) Includes $75 million of non-cash amortization associated with fair value adjustments primarily related to acquired inventories and customer order backlog recorded in cost of sales, $27 million of acquisition and integration costs, and $14 million of restructuring charges.
(2) Includes other income adjustment related to reimbursements by Tyco International and Covidien in connection with pre-separation tax
matters. Also includes income tax expense adjustments related to income tax benefits recognized in connection with a reduction in the valuation allowance associated with certain tax loss carryforwards and income tax expense associated with certain non-U.S. tax rate changes.
(3) See description of non-GAAP measures contained in this report.
FISCAL YEAr 2012
Operating Income
Operating Margin
$ 465
13.5%
U.S. GAAP
Acquisition- related Charges
restructuringand Other
Charges, Net
Adjusted(Non-GAAP) (1)
$ 3 $ 71 $ 539
15.7%
ADjUSTMENTS
(1) See description of non-GAAP measures contained in this report.
FOr ThE QUArTEr ENDED SEPTEMBEr 27, 2013
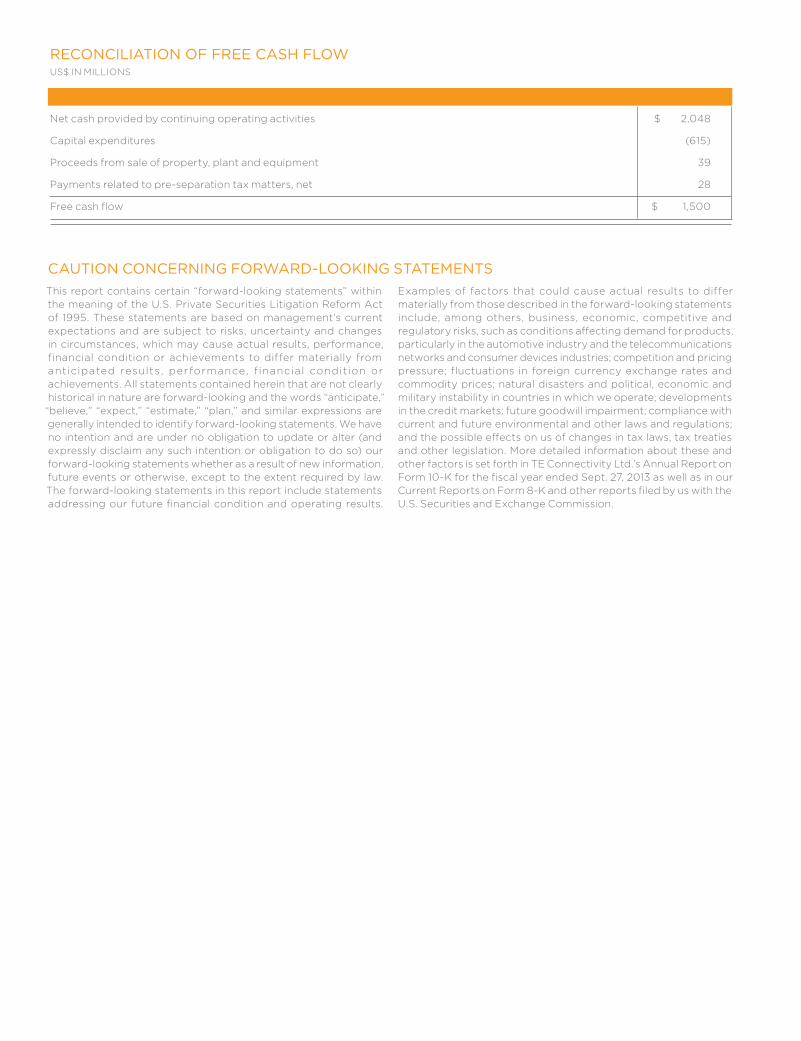
Net cash provided by continuing operating activities
Capital expenditures
Proceeds from sale of property, plant and equipment
Payments related to pre-separation tax matters, net
Free cash flow
$ 2,048
(615)
39
28
$ 1,500
FISCAL YEAr 2013
This report contains certain “forward-looking statements” within the meaning of the U.S. Private Securities Litigation reform Act of 1995. These statements are based on management’s current expectations and are subject to risks, uncertainty and changes in circumstances, which may cause actual results, performance, financial condition or achievements to differ materially from anticipated results , performance, f inancial condition or achievements. All statements contained herein that are not clearly historical in nature are forward-looking and the words “anticipate,” “believe,” “expect,” “estimate,” “plan,” and similar expressions are generally intended to identify forward-looking statements. We have no intention and are under no obligation to update or alter (and expressly disclaim any such intention or obligation to do so) our forward-looking statements whether as a result of new information, future events or otherwise, except to the extent required by law. The forward-looking statements in this report include statements addressing our future financial condition and operating results.
Examples of factors that could cause actual results to differ materially from those described in the forward-looking statements include, among others, business, economic, competitive and regulatory risks, such as conditions affecting demand for products, particularly in the automotive industry and the telecommunications networks and consumer devices industries; competition and pricing pressure; fluctuations in foreign currency exchange rates and commodity prices; natural disasters and political, economic and military instability in countries in which we operate; developments in the credit markets; future goodwill impairment; compliance with current and future environmental and other laws and regulations; and the possible effects on us of changes in tax laws, tax treaties and other legislation. More detailed information about these and other factors is set forth in TE Connectivity Ltd.’s Annual report on Form 10-K for the fiscal year ended Sept. 27, 2013 as well as in our Current reports on Form 8-K and other reports filed by us with the U.S. Securities and Exchange Commission.
CAUTION CONCERNING FORWARD-LOOKING STATEMENTS
RECONCILIATION OF FREE CASH FLOWUS$ IN MILLIONS
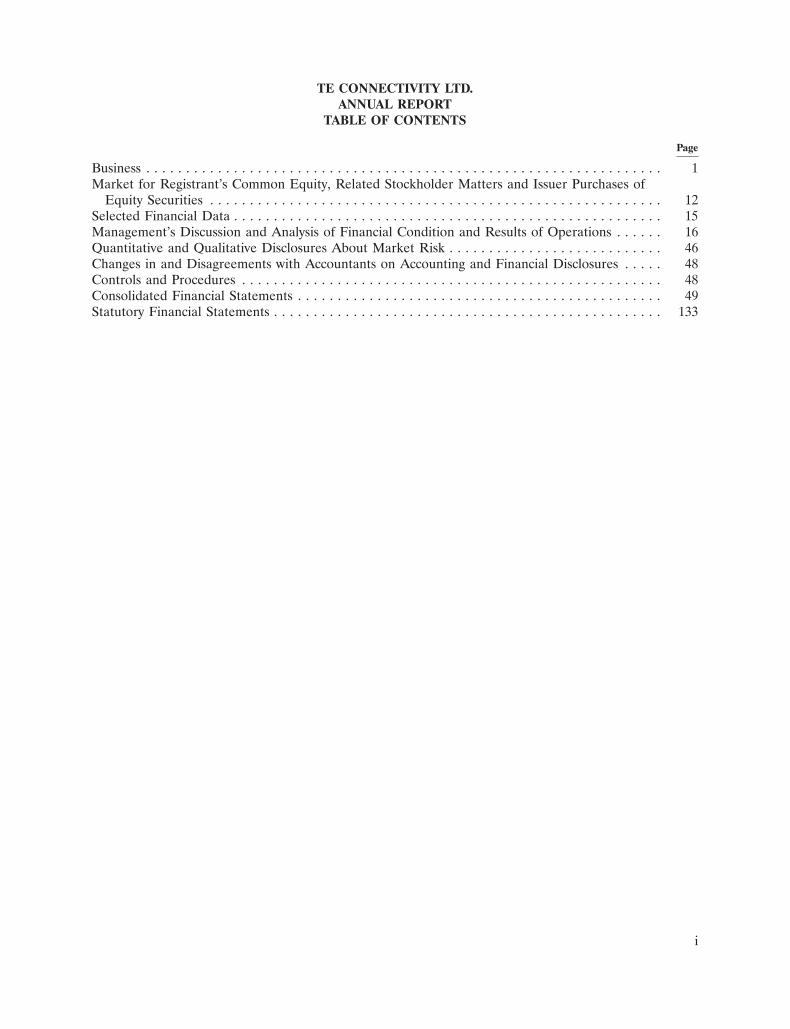
TE CONNECTIVITY LTD.ANNUAL REPORT
TABLE OF CONTENTS
Page
Business . . . . . . . . . . . . . . . . . . . . . . . . . . . . . . . . . . . . . . . . . . . . . . . . . . . . . . . . . . . . . . . . . 1Market for Registrant’s Common Equity, Related Stockholder Matters and Issuer Purchases of
Equity Securities . . . . . . . . . . . . . . . . . . . . . . . . . . . . . . . . . . . . . . . . . . . . . . . . . . . . . . . . . 12Selected Financial Data . . . . . . . . . . . . . . . . . . . . . . . . . . . . . . . . . . . . . . . . . . . . . . . . . . . . . . 15Management’s Discussion and Analysis of Financial Condition and Results of Operations . . . . . . 16Quantitative and Qualitative Disclosures About Market Risk . . . . . . . . . . . . . . . . . . . . . . . . . . . 46Changes in and Disagreements with Accountants on Accounting and Financial Disclosures . . . . . 48Controls and Procedures . . . . . . . . . . . . . . . . . . . . . . . . . . . . . . . . . . . . . . . . . . . . . . . . . . . . . 48Consolidated Financial Statements . . . . . . . . . . . . . . . . . . . . . . . . . . . . . . . . . . . . . . . . . . . . . . 49Statutory Financial Statements . . . . . . . . . . . . . . . . . . . . . . . . . . . . . . . . . . . . . . . . . . . . . . . . . 133
i

SPECIAL NOTE ABOUT FORWARD-LOOKING STATEMENTS
We have made forward-looking statements in this Annual Report, including in the sections entitled‘‘Business,’’ ‘‘Management’s Discussion and Analysis of Financial Condition and Results ofOperations,’’ and ‘‘Quantitative and Qualitative Disclosures about Market Risk,’’ that are based on ourmanagement’s beliefs and assumptions and on information currently available to our management.Forward-looking statements include, among others, the information concerning our possible or assumedfuture results of operations, business strategies, financing plans, competitive position, potential growthopportunities, potential operating performance improvements, acquisitions, the effects of competition,and the effects of future legislation or regulations. Forward-looking statements include all statementsthat are not historical facts and can be identified by the use of forward-looking terminology such as thewords ‘‘believe,’’ ‘‘expect,’’ ‘‘plan,’’ ‘‘intend,’’ ‘‘anticipate,’’ ‘‘estimate,’’ ‘‘predict,’’ ‘‘potential,’’‘‘continue,’’ ‘‘may,’’ ‘‘should,’’ or the negative of these terms or similar expressions.
Forward-looking statements involve risks, uncertainties, and assumptions. Actual results may differmaterially from those expressed in these forward-looking statements. You should not put unduereliance on any forward-looking statements. We do not have any intention or obligation to updateforward-looking statements after we file this report except as required by law.
The risk factors identified in this Annual Report and those discussed in our Annual Report ofForm 10-K for the fiscal year ended September 27, 2013 filed with the United States Securities andExchange Commission (the ‘‘SEC’’) could cause our results to differ materially from those expressed inforward-looking statements. There may be other risks and uncertainties that we are unable to predict atthis time or that we currently do not expect to have a material adverse effect on our business.
ii

BUSINESS
General
TE Connectivity Ltd. (‘‘TE Connectivity’’ or the ‘‘Company,’’ which may be referred to as ‘‘we,’’‘‘us,’’ or ‘‘our’’) is a world leader in connectivity. We design and manufacture products to connectpower, data, and signal in a broad array of industries including automotive, energy, industrial,broadband communications, consumer devices, healthcare, and aerospace and defense. We help ourcustomers solve the need for more energy efficiency, always-on communications, and ever-increasingproductivity.
Effective for the first quarter of fiscal 2013, we reorganized our management and segments tobetter align the organization around our strategy. We now operate through four reporting segments:Transportation Solutions, Network Solutions, Industrial Solutions, and Consumer Solutions. Ourreporting segments manufacture and distribute our products and solutions to a number of end markets.The table below provides a summary of our reporting segments, the fiscal 2013 net sales contribution ofeach segment, and the key products and industry end markets that we serve:
Transportation Network Industrial ConsumerSegment Solutions Solutions Solutions Solutions
% of Fiscal 2013 Net Sales 41% 23% 23% 13%
Key Products . . . . . . . . • Terminals and • Terminals and • Terminals and • Terminals andconnector systems connector systems connector systems connector systems
• Relays • Fiber optics • Heat shrink tubing • Circuit protection• Circuit protection • Wire and cable • Relays devices
devices • Racks and panels • Wire and cable • Relays• Sensors • Wireless • Antennas• Application tooling • Undersea • Heat shrink tubing• Wire and heat telecommunication
shrink tubing systems
Key Markets . . . . . . . . • Automotive • Telecom networks • Industrial • Consumer devices• Data • Aerospace, defense, • Appliances
communications and marine• Enterprise networks • Energy• Subsea
communications
Our Competitive Strengths
We believe that we have the following competitive strengths:
• Portfolio of market-leading connectivity businesses. We are a leader in many of the markets weserve, and the opportunity for growth in those markets is significant. We believe our foursegments serve a combined market of approximately $100 billion that is expected to grow at anestimated annual growth rate of approximately 5% over the next five years.
• Global leader in passive components. With net sales of $13.3 billion in fiscal 2013, we aresignificantly larger than many of our competitors. In the fragmented connector industry, whichwe estimated to be approximately $50 billion in fiscal 2013, our net sales were approximately$8.5 billion. We have established a global leadership position in the connector industry withleading market positions in the following markets: automotive—#1, industrial—#1, telecom/datacommunications—#2, and consumer electronics—#2.
Our scale provides us the opportunity to accelerate our sales growth by making largerinvestments in existing and new technologies and businesses in our core markets, and to expandour presence in emerging markets. Our leadership position also provides us the opportunity to
1

lower our purchasing costs by developing lower cost sources of supply and to maintain a flexiblemanufacturing footprint worldwide that is close to our customers’ locations.
• Strong customer relationships. As an industry leader, we have established close workingrelationships with many of our customers. These relationships allow us to better anticipate andrespond to customer needs when designing new products and new technical solutions. Byworking with our customers in developing new products and technologies, we believe we are ableto identify and act on trends and leverage knowledge about next-generation technology acrossour products.
• Process and product technology leadership. We employ approximately 6,900 engineers dedicated toproduct research, development, and engineering. Our investment of $675 million in product andprocess engineering and development, together with our capital spending of $615 million in fiscal2013, enable us to consistently provide innovative, high-quality products with efficientmanufacturing methods. In fiscal 2013, we derived approximately 24% of our net sales from newproducts, including product extensions, introduced within the previous three fiscal years.
• Diverse product mix and customer base. We manufacture and sell a broad portfolio of products tocustomers in various industries. Our customers include many of the leaders in their respectiveindustries, and our relationships with them typically date back many years. We believe that thisdiversified customer base provides us an opportunity to leverage our skills and experience acrossmarkets and reduces our exposure to individual end markets, thereby reducing the variability ofour financial performance. Additionally, we believe that the diversity of our customer basereduces the level of cyclicality in our results and distinguishes us from our competitors.
• Global presence. We have an established manufacturing presence in over 20 countries and globalsales distribution. Our global coverage positions us near our customers’ locations and allows usto assist them in consolidating their supply base and lowering their production costs. We believeour balanced sales distribution lowers our exposure to any particular geography and improvesour financial profile.
• Strong management team and employee base. We believe our management team has theexperience necessary to effectively execute our strategy and advance our product and technologyleadership. Our Chief Executive Officer and segment leaders average more than 20 years ofindustry experience. They are supported by an experienced and talented management team whois dedicated to maintaining and expanding our position as a global leader in the industry.
We have approximately 84,000 employees located throughout the world. We continue toemphasize employee development and training, and we embrace diversity and inclusion. Ourstrong employee base, along with their commitment to uncompromising values, provides thefoundation of our company’s success.
Segments
Below is a description of our reporting segments and the primary products sold by each segment.See Notes 1 and 23 to the Consolidated Financial Statements for additional segment and geographicfinancial information relating to our business. Prior period segment results have been revised toconform to the current segment reporting structure.
Transportation Solutions
The Transportation Solutions segment is a leader in electronic components, including terminals andconnectors, relays, and sensors, as well as application tooling, wire and heat shrink tubing, and othercustom-engineered solutions for the automotive market including the industrial and commercial vehicle
2

and hybrid and electric vehicle markets. The following are the primary product families sold by thesegment:
• Terminals and connector systems and components. We offer an extensive range of electrical andelectronic interconnection products. These connectors include a wide variety of pin and socket,terminal, USB, coaxial, input/output, fiber optic, power, and circular connectors, as well asambient lighting assemblies, special purpose cable assemblies, sophisticated interconnectionproducts used in complex commercial equipment, and custom connectivity solutions for harshenvironment applications. This product family represents over 75% of the segment’s net sales.
• Relays. Our relay products can be used in a wide range of applications in the automotive andcommercial vehicle industries, including electric sunroofs, anti-lock braking systems, and fuelinjection coils.
• Circuit protection devices. We offer a diverse range of circuit protection devices, which limit theflow of current during fault conditions and automatically reset after the fault is cleared andpower to the circuit is restored.
• Sensors. We offer a customized engineered portfolio of non-contact position and speed sensortechnologies mainly for the automotive and commercial vehicle industries that include highmeasurement standards, robust housing technologies, and temperature stable designs for avariety of powertrain, safety, and chassis applications.
• Application tooling. We offer a broad portfolio of hand tools, semi-automatic bench machines,and fully-automatic machine systems for processing terminal products.
• Wire and heat shrink tubing. We offer reliable, cost-effective products to seal, connect, insulate,protect, hold, and bundle high-performance electrical harnesses. We also provide hightemperature wire for harsh environments on passenger and commercial vehicles.
The above product families represent over 90% of the Transportation Solutions segment’s netsales.
Network Solutions
The Network Solutions segment is one of the world’s largest suppliers of infrastructurecomponents and systems for the telecommunications market and electronic components for the datacommunications market. Our products include connectors, fiber optics, wire and cable, racks andpanels, and wireless products. We also are a leader in developing, manufacturing, installing, andmaintaining some of the world’s most advanced subsea fiber optic communications systems. Thefollowing are the primary product families sold by the segment:
• Terminals and connector systems and components. We offer an extensive range of low, medium,and high-voltage connectors and splices, cable assemblies, sealing systems, terminals, fittings, lugsand clamps, transmission line fittings, splice closures, grounding hardware, and wall and flooroutlets for voice and data connection to local area networks.
• Fiber optics. We provide fiber optic connectors, splices, splice closures, fiber managementsystems, high density cable assemblies, couplers and splitters, and complete cabling systems.These products find use in both local-area and wide-area networks and ‘‘last-mile’’fiber-to-the-home installations.
• Wire and cable. We provide wire and cable for indoor and outdoor use in office, factory floor,school, and residential voice, data, and video networks, including copper and fiber opticdistribution cables, shielded and unshielded twisted-pair cables, armored cable, and patch cords.
3

• Racks and panels. We provide racks and panels that are used to integrate, organize, and managefiber and copper cables and splices, thereby simplifying installation, maintenance, and upgradesfor both exchange/head end and customer premise environments.
• Wireless. We offer solutions for radio frequency distribution and distributed antenna systems.These products provide wireless coverage and capacity, and operate as an extension of thewireless network, expanding the reach of both in-building and outdoor signals.
• Undersea telecommunication systems. We design, build, maintain, and test undersea fiber opticnetworks for the telecommunication and oil and gas markets.
The above product families represent over 90% of the Network Solutions segment’s net sales.
Industrial Solutions
The Industrial Solutions segment is a leading supplier of products that connect and distributepower and data, including connectors, heat shrink tubing, relays, and wire and cable, as well as custom-engineered solutions. Our products are used primarily in the industrial; aerospace, defense, and marine;and energy markets. The following are the primary product families sold by the segment:
• Terminals and connector systems and components. We offer connector products including a widevariety of pin and socket, terminal, USB, coaxial, input/output, fiber optic, and powerconnectors, as well as sophisticated interconnection products used in equipment offered to theaerospace, defense, marine, and medical industries. Additionally, we serve the aerospace,defense, and marine industries by offering custom connectivity solutions for harsh environmentapplications.
• Heat shrink tubing. We offer hundreds of reliable, cost-effective products to seal, connect,insulate, protect, hold, and bundle high-performance electrical harnesses. We also providecustomized harnessing design, prototype, and build services.
• Relays. Our relay products can be used in a variety of applications in the industrial and highperformance applications for the aerospace, defense, and marine industries.
• Wire and cable. We provide wire and cable for indoor and outdoor use in office, factory floor,and extreme environment applications, including copper and fiber optic distribution cables,shielded and unshielded twisted-pair cables, armored cable, and patch cords. Additionally, weprovide highly-engineered cable and wire products and a broad range of cables suitable for usein rugged applications within the aerospace, defense, and marine industries.
The above product families represent over 90% of the Industrial Solutions segment’s net sales.
Consumer Solutions
The Consumer Solutions segment is a top supplier of electronic components, including connectors,circuit protection devices, relays, antennas, and heat shrink tubing, for the consumer devices andappliances markets. The following are the primary product families sold by the segment:
• Terminals and connector systems and components. We provide connector products including awide variety of electronic grounding, shielding, and contact, SIM memory card, terminal, USB,input/output, and a variety of board level signal and power connectors as well as memory andCPU sockets. Also, we design and manufacture power cables and cable assemblies for high datarate transmission and sophisticated interconnection products used in smartphone, computing,tablet computer, appliances, and consumer electronics OEM products.
• Circuit protection devices. We offer a diverse range of circuit protection devices, which limit theflow of current during fault conditions and automatically reset after the fault is cleared and
4
power to the circuit is restored. We also offer surface-mount chip fuses, gas discharge tubes forovervoltage protection, electrostatic discharge protection devices, and hybrid protection devices.
• Relays. We provide relay products for a wide range of applications in the consumer devices andappliances markets.
• Antennas. We offer application specific and standard antenna products in a variety of structuresto enable our customers to complete the transmission of wireless voice and data over a fullrange of protocols.
• Heat shrink tubing. We offer hundreds of reliable, cost-effective products to seal, connect,insulate, protect, hold, and bundle high-performance electrical harnesses.
The above product families represent over 90% of the Consumer Solutions segment’s net sales.
Markets
We sell our products to manufacturers and distributors in a number of major markets. Theapproximate percentage of our total net sales by market in fiscal 2013 was as follows:
Markets Percentage
Automotive . . . . . . . . . . . . . . . . . . . . . . . . . . . . . . . . . . . . . . . . . . . . . . 41%Telecom Networks . . . . . . . . . . . . . . . . . . . . . . . . . . . . . . . . . . . . . . . . . 9Industrial . . . . . . . . . . . . . . . . . . . . . . . . . . . . . . . . . . . . . . . . . . . . . . . 9Aerospace, Defense, and Marine . . . . . . . . . . . . . . . . . . . . . . . . . . . . . . 8Consumer Devices . . . . . . . . . . . . . . . . . . . . . . . . . . . . . . . . . . . . . . . . . 8Energy . . . . . . . . . . . . . . . . . . . . . . . . . . . . . . . . . . . . . . . . . . . . . . . . . 6Data Communications . . . . . . . . . . . . . . . . . . . . . . . . . . . . . . . . . . . . . . 6Appliances . . . . . . . . . . . . . . . . . . . . . . . . . . . . . . . . . . . . . . . . . . . . . . 5Enterprise Networks . . . . . . . . . . . . . . . . . . . . . . . . . . . . . . . . . . . . . . . 5Subsea Communications . . . . . . . . . . . . . . . . . . . . . . . . . . . . . . . . . . . . . 3
Total . . . . . . . . . . . . . . . . . . . . . . . . . . . . . . . . . . . . . . . . . . . . . . . . . . . 100%
Our major markets are as follows:
• Automotive. The automotive and industrial transportation industry uses our products inautomotive technologies for body and chassis systems, convenience applications, driverinformation, infotainment solutions, miniaturization solutions, motor and powertrainapplications, sensor technologies, and safety and security systems. Hybrid and electronic mobilitysolutions include in-vehicle technologies, battery technologies, and charging solutions. Ourindustrial and commercial transportation products are used in on- and off-highway vehicles andrecreational vehicles.
• Telecom networks. Our products are used by communication service providers to facilitate thehigh-speed delivery of services from central offices to customer premises. We offer fiber andcopper infrastructure, power distribution, fiber-to-the-premises, and fiber-to-the-nodeconnectivity solutions for the central office and data center, to the outside plant, cell site, andmulti-dwelling unit buildings. We develop and manufacture telecommunication products whichare used to build out broadband communications infrastructure as well as upgrade networks.Our networking products are used in routers, switches, optical transport, and access equipmentfor converged voice and data transmission. We offer solutions for distributed antenna systems,wireless infrastructure equipment, and high speed wireless indoor/outdoor base stations.
5
• Industrial. Our products are used in factory automation and process control systems such asindustrial controls, robotics, human machine interface, industrial communication, and powerdistribution. Our intelligent building products are used to connect lighting, HVAC, elevators/escalators, and security. Our rail products are used in high-speed trains, metros, light railvehicles, locomotives, and signaling switching equipment. The medical industry uses our productsin diagnostic, therapeutic, surgical, and interventional applications. Also, our products are usedby the solar and lighting industry.
• Aerospace, defense, and marine. We provide components and solutions for the commercialaerospace industry, from the initial stages of aircraft design to aftermarket support. Our defenseproducts include ruggedized electronic interconnects serving military aviation, marine, andground vehicles including electronic warfare and space systems. Our marine products includecables and electronics used for harsh subsea environments in the offshore oil and gas and civilmarine industries and in shipboard, subsea, and sonar applications.
• Consumer devices. Our products and connectivity solutions are used in numerous consumerdevices, including smart phones, tablet computers, desktop computers, televisions, gamingsystems, digital and video cameras, printers and copiers, and business and retail equipment.
• Energy. Our products are used in the electrical power industry and include a wide range ofsolutions for the electrical power generation, transmission, distribution, smart grid, and industrialmarkets.
• Data communications. Our products and solutions are used in a variety of equipmentarchitectures within the networking equipment, data center equipment, and wirelessinfrastructure industries.
• Appliances. Our products are used in many household appliances, including washers and dryers,refrigerators, air conditioners, dishwashers, cooking appliances, water heaters, and microwaves.
• Enterprise networks. We provide cable, connectivity, and cable management solutions fornetworks that enable high-bandwidth voice and data communications throughout facilitiesincluding data centers, commercial buildings, and office campuses. Our products supportnetworks in a variety of industries, including healthcare, government, gaming and hospitality,financial services, education, and transportation.
• Subsea communications. Our products are used in undersea fiber optic telecommunicationsystems. With vertically integrated undersea communications systems and services, we supportthe telecommunications and oil and gas industries, and other customers seeking marine services.
Customers
We collaborate closely with our customers to meet their product needs. Our approach to ourcustomers is driven by our dedication to further develop our product families and ensure that we areglobally positioned to best provide our customers with sales and engineering support. We believe thatas electronic component technologies continue to proliferate, our broad product portfolio andengineering capability give us a potential competitive advantage when addressing the needs of ourglobal customers.
6
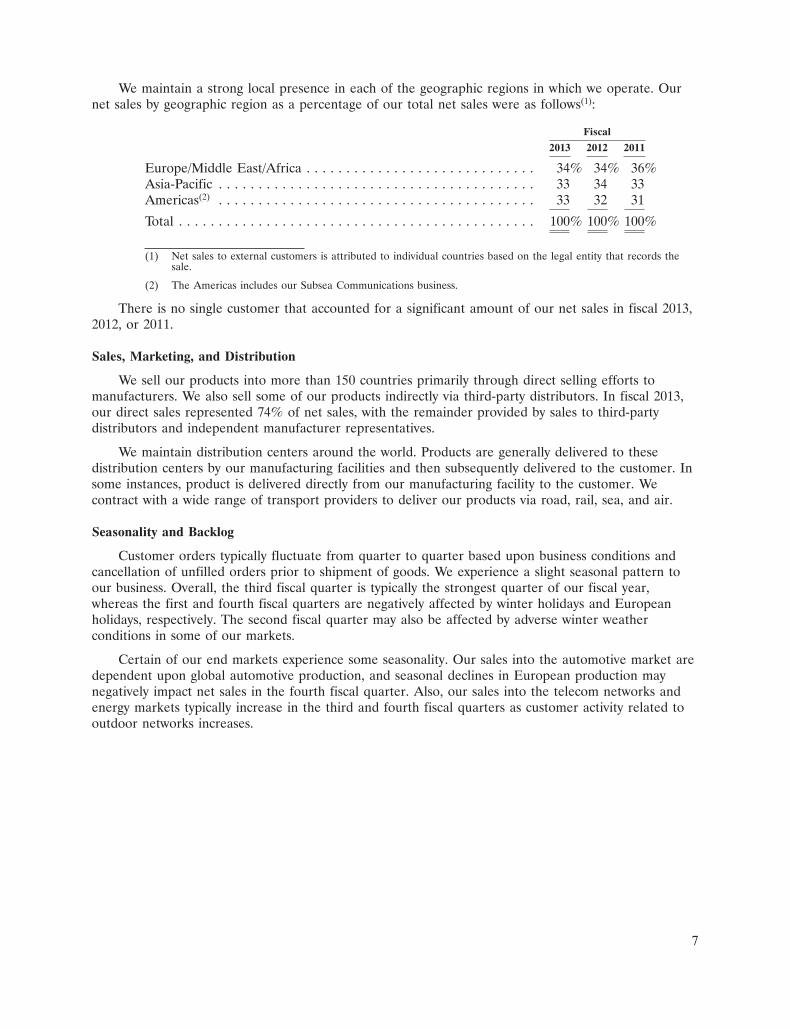
We maintain a strong local presence in each of the geographic regions in which we operate. Ournet sales by geographic region as a percentage of our total net sales were as follows(1):
Fiscal
2013 2012 2011
Europe/Middle East/Africa . . . . . . . . . . . . . . . . . . . . . . . . . . . . . 34% 34% 36%Asia-Pacific . . . . . . . . . . . . . . . . . . . . . . . . . . . . . . . . . . . . . . . . 33 34 33Americas(2) . . . . . . . . . . . . . . . . . . . . . . . . . . . . . . . . . . . . . . . . 33 32 31
Total . . . . . . . . . . . . . . . . . . . . . . . . . . . . . . . . . . . . . . . . . . . . . 100% 100% 100%
(1) Net sales to external customers is attributed to individual countries based on the legal entity that records thesale.
(2) The Americas includes our Subsea Communications business.
There is no single customer that accounted for a significant amount of our net sales in fiscal 2013,2012, or 2011.
Sales, Marketing, and Distribution
We sell our products into more than 150 countries primarily through direct selling efforts tomanufacturers. We also sell some of our products indirectly via third-party distributors. In fiscal 2013,our direct sales represented 74% of net sales, with the remainder provided by sales to third-partydistributors and independent manufacturer representatives.
We maintain distribution centers around the world. Products are generally delivered to thesedistribution centers by our manufacturing facilities and then subsequently delivered to the customer. Insome instances, product is delivered directly from our manufacturing facility to the customer. Wecontract with a wide range of transport providers to deliver our products via road, rail, sea, and air.
Seasonality and Backlog
Customer orders typically fluctuate from quarter to quarter based upon business conditions andcancellation of unfilled orders prior to shipment of goods. We experience a slight seasonal pattern toour business. Overall, the third fiscal quarter is typically the strongest quarter of our fiscal year,whereas the first and fourth fiscal quarters are negatively affected by winter holidays and Europeanholidays, respectively. The second fiscal quarter may also be affected by adverse winter weatherconditions in some of our markets.
Certain of our end markets experience some seasonality. Our sales into the automotive market aredependent upon global automotive production, and seasonal declines in European production maynegatively impact net sales in the fourth fiscal quarter. Also, our sales into the telecom networks andenergy markets typically increase in the third and fourth fiscal quarters as customer activity related tooutdoor networks increases.
7

Backlog by reportable segment was as follows:
Fiscal Year End
2013 2012
(in millions)
Transportation Solutions . . . . . . . . . . . . . . . . . . . . . . . . . . . . . . . . $ 996 $ 874Network Solutions(1) . . . . . . . . . . . . . . . . . . . . . . . . . . . . . . . . . . . 475 744Industrial Solutions . . . . . . . . . . . . . . . . . . . . . . . . . . . . . . . . . . . 791 743Consumer Solutions . . . . . . . . . . . . . . . . . . . . . . . . . . . . . . . . . . . 307 272
Total . . . . . . . . . . . . . . . . . . . . . . . . . . . . . . . . . . . . . . . . . . . . . . $2,569 $2,633
(1) Includes our Subsea Communications business’s backlog of $138 million and $352 million at fiscal year end 2013and 2012, respectively.
We expect that the majority of our backlog at September 27, 2013 will be filled during fiscal 2014.
Competition
The industries in which we operate are highly competitive, and we compete with thousands ofcompanies that range from large multinational corporations to local manufacturers. Competition isgenerally on the basis of breadth of product offering, product innovation, price, quality, delivery, andservice. Our markets have generally been growing but with downward pressure on prices. The followingis a listing of our major competitors by segment:
• Transportation Solutions. This segment primarily competes against Yazaki, Delphi, Sumitomo,Molex, Amphenol, and Rosenberger.
• Network Solutions. This segment’s major competitors include CommScope, Corning, HuaweiTechnologies, Amphenol, and Molex. Also, the Subsea Communications business competesagainst Alcatel-Lucent.
• Industrial Solutions. This segment primarily competes against Amphenol, Esterline, Molex,Phoenix Contact, Hubbell, and 3M.
• Consumer Solutions. This segment’s major competitors include Molex, JST Connectors, JapanAviation Electronics, Amphenol, and Foxconn Technology Group.
Raw Materials
We use a wide variety of raw materials in the manufacture of our products. The principal rawmaterials that we use include plastic resins for molding, precious metals such as gold and silver forplating, and other metals such as copper, aluminum, brass, and steel for manufacturing cable, contacts,and other parts that are used for cable and component bodies and inserts. Many of these raw materialsare produced in a limited number of countries around the world or are only available from a limitednumber of suppliers. The prices of these materials are driven by global supply and demand.
Research and Development
We are engaged in both internal and external research and development in an effort to introducenew products to enhance the effectiveness, ease of use, safety, and reliability of our existing products,and to expand the applications for which the uses of our products are appropriate. We continuallyevaluate developing technologies in areas where we may have technological or marketing expertise forpossible investment or acquisition.
8

Our research and development expense was as follows:
Fiscal
2013 2012 2011
(in millions)
Transportation Solutions . . . . . . . . . . . . . . . . . . . . . . . . . . . . . $193 $185 $180Network Solutions . . . . . . . . . . . . . . . . . . . . . . . . . . . . . . . . . 197 200 192Industrial Solutions . . . . . . . . . . . . . . . . . . . . . . . . . . . . . . . . 119 132 135Consumer Solutions . . . . . . . . . . . . . . . . . . . . . . . . . . . . . . . . 67 78 86
Total . . . . . . . . . . . . . . . . . . . . . . . . . . . . . . . . . . . . . . . . . . . $576 $595 $593
Intellectual Property
Patents and other proprietary rights are important to our business. We also rely upon trade secrets,manufacturing know-how, continuing technological innovations, and licensing opportunities to maintainand improve our competitive position. We review third-party proprietary rights, including patents andpatent applications, as available, in an effort to develop an effective intellectual property strategy, avoidinfringement of third-party proprietary rights, identify licensing opportunities, and monitor theintellectual property claims of others.
We own a large portfolio of patents that principally relate to electrical, optical, and electronicproducts. We also own a portfolio of trademarks and are a licensee of various patents and trademarks.Patents for individual products extend for varying periods according to the date of patent filing or grantand the legal term of patents in the various countries where patent protection is obtained. Trademarkrights may potentially extend for longer periods of time and are dependent upon national laws and useof the trademarks.
While we consider our patents and trademarks to be valued assets, we do not believe that ourcompetitive position or our operations are dependent upon or would be materially impacted by anysingle patent or group of related patents.
Employees
As of September 27, 2013, we employed approximately 84,000 people worldwide, of whom 27,000were in the Americas region, 27,000 were in the Europe/Middle East/Africa region, and 30,000 were inthe Asia-Pacific region. Of our total employees, approximately 49,000 were employed in manufacturing.
Government Regulation and Supervision
The import and export of products are subject to regulation by the United States (‘‘U.S.’’) andother countries. A small portion of our products, including defense-related products, may requiregovernmental import and export licenses, whose issuance may be influenced by geopolitical and otherevents. We have a trade compliance organization and other systems in place to apply for licenses andotherwise comply with such regulations. Any failure to maintain compliance with domestic and foreigntrade regulation could limit our ability to import and export raw materials and finished goods into orfrom the relevant jurisdiction.
Environmental
Our operations are subject to numerous environmental, health, and safety laws and regulations,including those regulating the discharge of materials into the environment, greenhouse gas emissions,hazardous materials in products, chemical usage, and others. We are committed to complying withthese laws and to the protection of our employees and the environment. We maintain a global
9

environmental, health, and safety program that includes appropriate policies and standards, staffdedicated to environmental, health, and safety issues, periodic compliance auditing, training, and othermeasures. We have a program for compliance with the European Union (‘‘EU’’) Restriction ofHazardous Substances and Waste Electrical and Electronics Equipment Directives, the ChinaRestriction of Hazardous Substances law, the EU REACH (chemical registration and evaluation)Regulation, and similar laws.
Compliance with these laws has in the past and may in the future increase our costs of doingbusiness in a variety of ways. For example, laws regarding product content and chemical registrationrequire extensive and costly data collection, management, and reporting, and laws regulatinggreenhouse gas emissions are likely to increase our costs for energy and certain materials and products.We also have projects underway at a number of current and former manufacturing facilities toinvestigate and remediate environmental contamination resulting from past operations. Based upon ourexperience, current information, and applicable laws, we believe that it is probable that we will incurremedial costs in the range of approximately $12 million to $24 million. As of September 27, 2013, webelieve that the best estimate within this range is approximately $13 million. We do not anticipate anymaterial capital expenditures during fiscal 2014 for environmental control facilities or other costs ofcompliance with laws or regulations relating to greenhouse gas emissions.
Corporate History
Tyco Electronics Ltd. was incorporated in Bermuda in fiscal 2000 as a wholly-owned subsidiary ofTyco International Ltd. (‘‘Tyco International’’). Effective June 29, 2007, Tyco International distributedall of our shares, as well as its shares of its former healthcare business, to its common shareholders(referred to in this report as the ‘‘separation’’). We became an independent, publicly traded companyowning the former electronics businesses of Tyco International.
Our business was formed principally through a series of acquisitions, from fiscal 1999 throughfiscal 2002, of established electronics companies and divisions, including the acquisition of AMPIncorporated and Raychem Corporation in fiscal 1999, and the Electromechanical Components Divisionof Siemens and OEM Division of Thomas & Betts in fiscal 2000. These companies each had more than50 years of history in engineering and innovation excellence. We operated as a segment of TycoInternational prior to our separation.
Effective June 25, 2009, we discontinued our existence as a Bermuda company and, in accordancewith article 161 of the Swiss Federal Code on International Private Law, continued our existence as aSwiss corporation under articles 620 et seq. of the Swiss Code of Obligations. The rights of holders ofour shares are governed by Swiss law, our Swiss articles of association, and our Swiss organizationalregulations.
In March 2011, our shareholders approved an amendment to our articles of association to changeour name from ‘‘Tyco Electronics Ltd.’’ to ‘‘TE Connectivity Ltd.’’ The name change was effectiveMarch 10, 2011. Our ticker symbol ‘‘TEL’’ on the New York Stock Exchange remained unchanged.
We acquired Deutsch Group SAS (‘‘Deutsch’’) and ADC Telecommunications, Inc. (‘‘ADC’’) infiscal 2012 and 2011, respectively. See Note 5 to the Consolidated Financial Statements for additionalinformation relating to these acquisitions.
10

Available Information
All periodic and current reports, registration filings, and other filings that we are required to filewith the SEC, including Annual Reports on Form 10-K, Quarterly Reports on Form 10-Q, CurrentReports on Form 8-K, and amendments to those reports filed or furnished pursuant to Section 13(a) or15(d) of the Securities Exchange Act of 1934 (‘‘Exchange Act’’) are available free of charge throughour internet website at www.te.com. Such documents are available as soon as reasonably practicableafter electronic filing or furnishing of the material with the SEC.
The public may also read and copy any document that we file, including this Annual Report, at theSEC’s Public Reference Room at 100 F Street, N.E., Washington, DC 20549. Investors may obtaininformation on the operation of the Public Reference Room by calling the SEC at 1-800-SEC-0330. Inaddition, the SEC maintains an internet site at www.sec.gov that contains reports, proxy and informationstatements, and other information regarding issuers that file electronically with the SEC, from whichinvestors can electronically access our SEC filings.
TE Connectivity and TE Connectivity (logo) are trademarks. � 2013 TE Connectivity Ltd. AllRights Reserved.
11
MARKET FOR REGISTRANT’S COMMON EQUITY, RELATED STOCKHOLDER MATTERS ANDISSUER PURCHASES OF EQUITY SECURITIES
Market Information
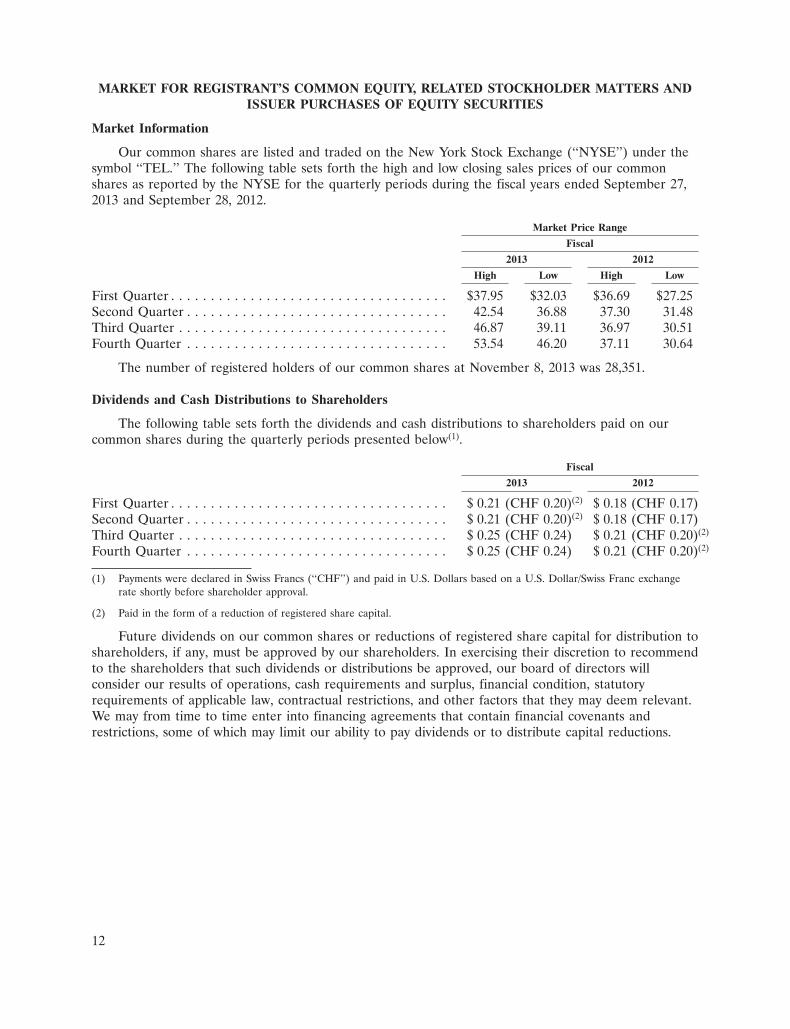
Our common shares are listed and traded on the New York Stock Exchange (‘‘NYSE’’) under thesymbol ‘‘TEL.’’ The following table sets forth the high and low closing sales prices of our commonshares as reported by the NYSE for the quarterly periods during the fiscal years ended September 27,2013 and September 28, 2012.
Market Price Range
Fiscal
2013 2012
High Low High Low
First Quarter . . . . . . . . . . . . . . . . . . . . . . . . . . . . . . . . . . . $37.95 $32.03 $36.69 $27.25Second Quarter . . . . . . . . . . . . . . . . . . . . . . . . . . . . . . . . . 42.54 36.88 37.30 31.48Third Quarter . . . . . . . . . . . . . . . . . . . . . . . . . . . . . . . . . . 46.87 39.11 36.97 30.51Fourth Quarter . . . . . . . . . . . . . . . . . . . . . . . . . . . . . . . . . 53.54 46.20 37.11 30.64
The number of registered holders of our common shares at November 8, 2013 was 28,351.
Dividends and Cash Distributions to Shareholders
The following table sets forth the dividends and cash distributions to shareholders paid on ourcommon shares during the quarterly periods presented below(1).
Fiscal
2013 2012
First Quarter . . . . . . . . . . . . . . . . . . . . . . . . . . . . . . . . . . . $ 0.21 (CHF 0.20)(2) $ 0.18 (CHF 0.17)Second Quarter . . . . . . . . . . . . . . . . . . . . . . . . . . . . . . . . . $ 0.21 (CHF 0.20)(2) $ 0.18 (CHF 0.17)Third Quarter . . . . . . . . . . . . . . . . . . . . . . . . . . . . . . . . . . $ 0.25 (CHF 0.24) $ 0.21 (CHF 0.20)(2)
Fourth Quarter . . . . . . . . . . . . . . . . . . . . . . . . . . . . . . . . . $ 0.25 (CHF 0.24) $ 0.21 (CHF 0.20)(2)
(1) Payments were declared in Swiss Francs (‘‘CHF’’) and paid in U.S. Dollars based on a U.S. Dollar/Swiss Franc exchangerate shortly before shareholder approval.
(2) Paid in the form of a reduction of registered share capital.
Future dividends on our common shares or reductions of registered share capital for distribution toshareholders, if any, must be approved by our shareholders. In exercising their discretion to recommendto the shareholders that such dividends or distributions be approved, our board of directors willconsider our results of operations, cash requirements and surplus, financial condition, statutoryrequirements of applicable law, contractual restrictions, and other factors that they may deem relevant.We may from time to time enter into financing agreements that contain financial covenants andrestrictions, some of which may limit our ability to pay dividends or to distribute capital reductions.
12

10DEC201300271163
Performance Graph
Set forth below is a graph comparing the cumulative total shareholder return on our commonshares against the cumulative return on the S&P 500 Index and the Dow Jones Electrical Componentsand Equipment Index. The graph assumes the investment of $100 in our common shares and in eachindex on September 26, 2008 and assumes the reinvestment of all dividends and distributions. Thegraph shows the cumulative total return as of the fiscal years ended September 25, 2009, September 24,2010, September 30, 2011, September 28, 2012, and September 27, 2013. The comparisons in the graphbelow are based upon historical data and are not indicative of, nor intended to forecast, futureperformance of our common shares.
COMPARISON OF CUMULATIVE TOTAL RETURNAMONG TE CONNECTIVITY LTD., S&P 500 INDEX, AND
DOW JONES ELECTRICAL COMPONENTS AND EQUIPMENT INDEX
50
70
90
130
110
150
190
170
230
210
Fiscal 2008 Fiscal 2009 Fiscal 2010 Fiscal 2013Fiscal 2012Fiscal 2011
DO
LLA
RS
TE Connectivity Ltd. S&P 500 Index Dow Jones Electrical Components and Equipment Index
Fiscal
2008* 2009 2010 2011 2012 2013
TE Connectivity Ltd. . . . . . . . . . . . . . . . . $100.00 $85.35 $112.01 $109.89 $135.94 $212.30S&P 500 Index . . . . . . . . . . . . . . . . . . . . . 100.00 88.42 99.23 99.74 129.87 155.92Dow Jones Electrical Components and
Equipment Index . . . . . . . . . . . . . . . . . . 100.00 97.01 112.80 107.92 142.97 196.41
* $100 invested on September 26, 2008 in TE Connectivity’s common shares and in indexes. Indexes calculated on month-endbasis.
13
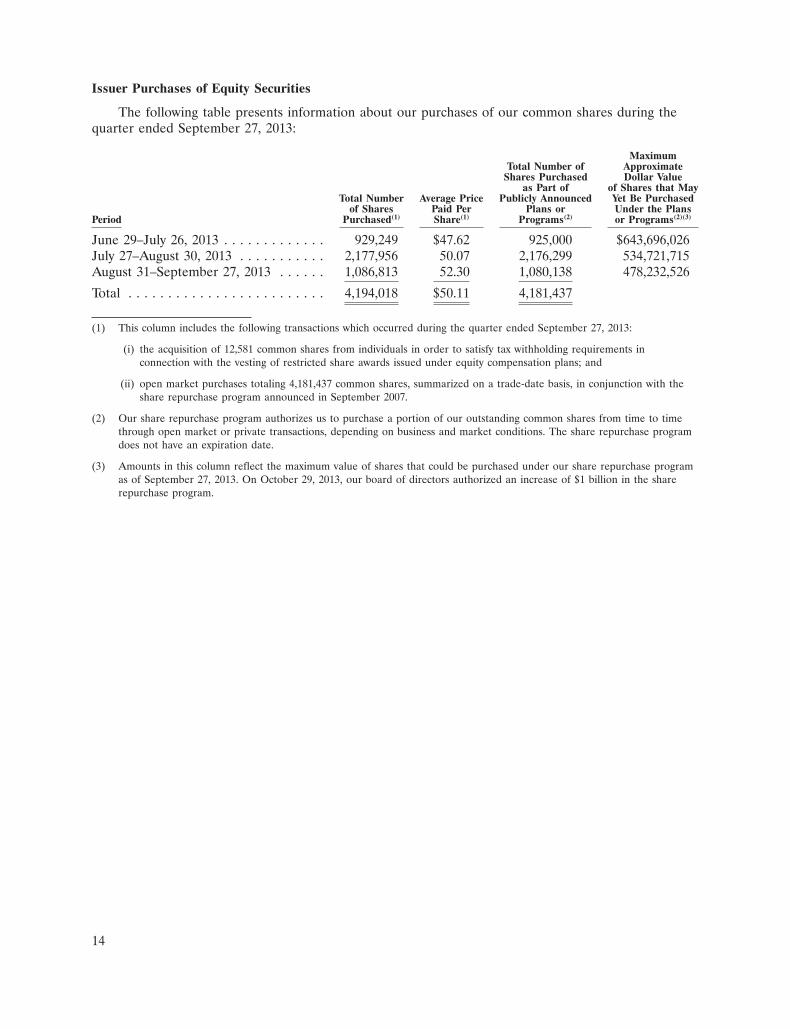
Issuer Purchases of Equity Securities
The following table presents information about our purchases of our common shares during thequarter ended September 27, 2013:
MaximumTotal Number of Approximate
Shares Purchased Dollar Valueas Part of of Shares that May
Total Number Average Price Publicly Announced Yet Be Purchasedof Shares Paid Per Plans or Under the Plans
Period Purchased(1) Share(1) Programs(2) or Programs(2)(3)
June 29–July 26, 2013 . . . . . . . . . . . . . 929,249 $47.62 925,000 $643,696,026July 27–August 30, 2013 . . . . . . . . . . . 2,177,956 50.07 2,176,299 534,721,715August 31–September 27, 2013 . . . . . . 1,086,813 52.30 1,080,138 478,232,526
Total . . . . . . . . . . . . . . . . . . . . . . . . . 4,194,018 $50.11 4,181,437
(1) This column includes the following transactions which occurred during the quarter ended September 27, 2013:
(i) the acquisition of 12,581 common shares from individuals in order to satisfy tax withholding requirements inconnection with the vesting of restricted share awards issued under equity compensation plans; and
(ii) open market purchases totaling 4,181,437 common shares, summarized on a trade-date basis, in conjunction with theshare repurchase program announced in September 2007.
(2) Our share repurchase program authorizes us to purchase a portion of our outstanding common shares from time to timethrough open market or private transactions, depending on business and market conditions. The share repurchase programdoes not have an expiration date.
(3) Amounts in this column reflect the maximum value of shares that could be purchased under our share repurchase programas of September 27, 2013. On October 29, 2013, our board of directors authorized an increase of $1 billion in the sharerepurchase program.
14
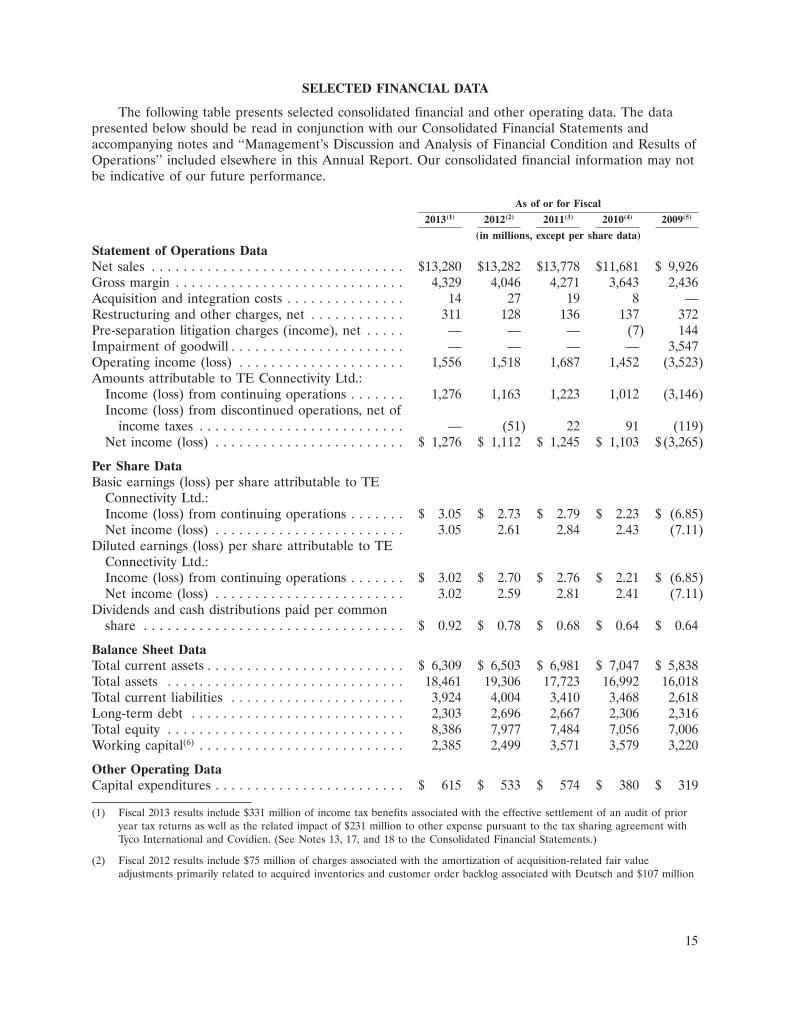
SELECTED FINANCIAL DATA
The following table presents selected consolidated financial and other operating data. The datapresented below should be read in conjunction with our Consolidated Financial Statements andaccompanying notes and ‘‘Management’s Discussion and Analysis of Financial Condition and Results ofOperations’’ included elsewhere in this Annual Report. Our consolidated financial information may notbe indicative of our future performance.
As of or for Fiscal
2013(1) 2012(2) 2011(3) 2010(4) 2009(5)
(in millions, except per share data)
Statement of Operations DataNet sales . . . . . . . . . . . . . . . . . . . . . . . . . . . . . . . . $13,280 $13,282 $13,778 $11,681 $ 9,926Gross margin . . . . . . . . . . . . . . . . . . . . . . . . . . . . . 4,329 4,046 4,271 3,643 2,436Acquisition and integration costs . . . . . . . . . . . . . . . 14 27 19 8 —Restructuring and other charges, net . . . . . . . . . . . . 311 128 136 137 372Pre-separation litigation charges (income), net . . . . . — — — (7) 144Impairment of goodwill . . . . . . . . . . . . . . . . . . . . . . — — — — 3,547Operating income (loss) . . . . . . . . . . . . . . . . . . . . . 1,556 1,518 1,687 1,452 (3,523)Amounts attributable to TE Connectivity Ltd.:
Income (loss) from continuing operations . . . . . . . 1,276 1,163 1,223 1,012 (3,146)Income (loss) from discontinued operations, net of
income taxes . . . . . . . . . . . . . . . . . . . . . . . . . . — (51) 22 91 (119)Net income (loss) . . . . . . . . . . . . . . . . . . . . . . . . $ 1,276 $ 1,112 $ 1,245 $ 1,103 $(3,265)
Per Share DataBasic earnings (loss) per share attributable to TE
Connectivity Ltd.:Income (loss) from continuing operations . . . . . . . $ 3.05 $ 2.73 $ 2.79 $ 2.23 $ (6.85)Net income (loss) . . . . . . . . . . . . . . . . . . . . . . . . 3.05 2.61 2.84 2.43 (7.11)
Diluted earnings (loss) per share attributable to TEConnectivity Ltd.:Income (loss) from continuing operations . . . . . . . $ 3.02 $ 2.70 $ 2.76 $ 2.21 $ (6.85)Net income (loss) . . . . . . . . . . . . . . . . . . . . . . . . 3.02 2.59 2.81 2.41 (7.11)
Dividends and cash distributions paid per commonshare . . . . . . . . . . . . . . . . . . . . . . . . . . . . . . . . . $ 0.92 $ 0.78 $ 0.68 $ 0.64 $ 0.64
Balance Sheet DataTotal current assets . . . . . . . . . . . . . . . . . . . . . . . . . $ 6,309 $ 6,503 $ 6,981 $ 7,047 $ 5,838Total assets . . . . . . . . . . . . . . . . . . . . . . . . . . . . . . 18,461 19,306 17,723 16,992 16,018Total current liabilities . . . . . . . . . . . . . . . . . . . . . . 3,924 4,004 3,410 3,468 2,618Long-term debt . . . . . . . . . . . . . . . . . . . . . . . . . . . 2,303 2,696 2,667 2,306 2,316Total equity . . . . . . . . . . . . . . . . . . . . . . . . . . . . . . 8,386 7,977 7,484 7,056 7,006Working capital(6) . . . . . . . . . . . . . . . . . . . . . . . . . . 2,385 2,499 3,571 3,579 3,220
Other Operating DataCapital expenditures . . . . . . . . . . . . . . . . . . . . . . . . $ 615 $ 533 $ 574 $ 380 $ 319
(1) Fiscal 2013 results include $331 million of income tax benefits associated with the effective settlement of an audit of prioryear tax returns as well as the related impact of $231 million to other expense pursuant to the tax sharing agreement withTyco International and Covidien. (See Notes 13, 17, and 18 to the Consolidated Financial Statements.)
(2) Fiscal 2012 results include $75 million of charges associated with the amortization of acquisition-related fair valueadjustments primarily related to acquired inventories and customer order backlog associated with Deutsch and $107 million
15

of income tax benefits recognized in connection with a reduction in the valuation allowance associated with tax losscarryforwards in certain non-U.S. locations. (See Notes 5 and 17 to the Consolidated Financial Statements.)
(3) Fiscal 2011 results include $39 million of charges associated with the amortization of acquisition-related fair valueadjustments primarily related to acquired inventories and customer order backlog associated with ADC and $35 million ofincome tax benefits associated with the completion of fieldwork and the settlement of certain U.S. tax matters as well asthe related impact of $14 million of other expense pursuant to the Tax Sharing Agreement with Tyco International andCovidien. (See Notes 5, 13, 17, and 18 to the Consolidated Financial Statements.)
(4) Fiscal 2010 results include $178 million of other income pursuant to the Tax Sharing Agreement with Tyco Internationaland Covidien, $307 million of income tax charges primarily associated with certain proposed adjustments to prior yearincome tax returns and related accrued interest, $101 million of income tax benefits related to the completion of certainnon-U.S. audits of prior year income tax returns, and $72 million of income tax benefits recognized in connection with areduction in the valuation allowance associated with tax loss carry forwards in certain non-U.S. locations.
(5) Fiscal 2009 results include a $22 million gain on retirement of debt, $68 million of other expense pursuant to the TaxSharing Agreement with Tyco International and Covidien, and $49 million of income tax benefits attributable toadjustments to prior year income tax returns.
(6) Working capital is defined as current assets minus current liabilities.
MANAGEMENT’S DISCUSSION AND ANALYSIS OF FINANCIAL CONDITION AND RESULTS OFOPERATIONS
The following discussion and analysis of our financial condition and results of operations should beread in conjunction with our Consolidated Financial Statements and the accompanying notes includedelsewhere in this Annual Report. The following discussion may contain forward-looking statements thatreflect our plans, estimates, and beliefs. Our actual results could differ materially from those discussedin these forward-looking statements. Factors that could cause or contribute to these differences includethose factors discussed below and elsewhere in this Annual Report, particularly in ‘‘Forward-LookingInformation’’ and in ‘‘Part I. Item 1A. Risk Factors’’ as set forth in our Annual Report on Form 10-Kfor the fiscal year ended September 27, 2013 as filed with the SEC.
Our Consolidated Financial Statements have been prepared in U.S. Dollars, in accordance withaccounting principles generally accepted in the U.S. (‘‘GAAP’’).
Organic net sales growth and free cash flow are non-GAAP financial measures which are discussedin Management’s Discussion and Analysis of Financial Condition and Results of Operations. We believethese non-GAAP financial measures, together with GAAP financial measures, provide usefulinformation to investors because they reflect the financial measures that management uses in evaluatingthe underlying results of our operations. See ‘‘Non-GAAP Financial Measures’’ for more informationabout these non-GAAP financial measures, including our reasons for including the measures andmaterial limitations with respect to the usefulness of the measures.
Overview
We are a world leader in connectivity. We design and manufacture products to connect power,data, and signal in a broad array of industries including automotive, energy, industrial, broadbandcommunications, consumer devices, healthcare, and aerospace and defense. We help our customerssolve the need for more energy efficiency, always-on communications, and ever-increasing productivity.
Effective for the first quarter of fiscal 2013, we reorganized our management and segments toalign the organization around our strategy. We now operate through four reporting segments:Transportation Solutions, Network Solutions, Industrial Solutions, and Consumer Solutions. See Notes 1and 23 to the Consolidated Financial Statements for additional information regarding our segments.Prior period segment results have been restated to conform to the current segment reporting structure.
Our business and operating results have been and will continue to be affected by worldwideeconomic conditions. Our sales are dependent on certain industry end markets that are impacted by
16
consumer as well as industrial and infrastructure spending, and our operating results can be affected bychanges in demand in those markets.
Overall, our fiscal 2013 net sales and organic net sales were consistent with fiscal 2012 levels. Onan organic basis, our sales into industrial- and infrastructure-based markets declined, primarily as aresult of weakness in the subsea communications and data communications end markets in the NetworkSolutions segment and the industrial end market in the Industrial Solutions segment. Also, on anorganic basis, our sales into consumer-based markets increased with growth in the automotive endmarket in the Transportation Solutions segment, partially offset by declines in the consumer devices andappliances end markets in the Consumer Solutions segment.
Overall, our net sales decreased 3.6% in fiscal 2012 as compared to fiscal 2011. On an organicbasis, net sales decreased 2.7% in fiscal 2012 from fiscal 2011 levels. On an organic basis, our sales intoindustrial- and infrastructure-based markets decreased, primarily as a result of weakness in the datacommunications, subsea communications, and telecom networks end markets in the Network Solutionssegment and the industrial end market in the Industrial Solutions segment. Our sales into consumer-based markets experienced modest growth, on an organic basis, as growth in the automotive endmarket in the Transportation Solutions segment was partially offset by declines in the appliances andconsumer devices end markets in the Consumer Solutions segment.
The acquisition of Deutsch in April 2012 benefited the automotive and aerospace, defense, andmarine end markets in the Transportation Solutions and Industrial Solutions segments, respectively, andcontributed net sales of $327 million in fiscal 2012. Also, Deutsch contributed incremental net sales of$320 million in the first six months of fiscal 2013 over the same period of fiscal 2012. Fiscal 2011included an additional week which contributed $267 million in net sales and $0.08 per share to dilutedearnings per share. ADC, which was acquired in December 2010, contributed net sales of $843 million,of which $24 million related to the additional week, during fiscal 2011. Also, the acquisition of ADCresulted in incremental net sales of $154 million in the first quarter of fiscal 2012 over the same periodof fiscal 2011.
The March 2011 earthquake, subsequent tsunami, and aftershocks in Japan caused disruptions inour customers’ operations and the supply chains that support their operations. We estimate that ourfiscal 2011 net sales and diluted earnings per share were negatively impacted by $99 million and $0.07per share, respectively, as a result of these disruptions. Our facilities in Japan were not materiallydamaged, and we did not experience further negative impacts after 2011.
Outlook
We expect net sales in the first quarter of fiscal 2014 to be between $3.225 billion and$3.325 billion. This reflects sales increases in the Transportation Solutions segment and, to a lesserdegree, the Industrial Solutions segment, partially offset by sales decreases in the Consumer Solutionsand Network Solutions segments relative to the first quarter of fiscal 2013. In the TransportationSolutions segment, we expect our sales to increase approximately 10%, and we expect globalautomotive production to increase 3% in the first quarter of fiscal 2014 as compared to the sameperiod of fiscal 2013. In the Industrial Solutions segment, we expect our sales to increase approximately10% in the industrial end market with smaller increases in the aerospace, defense, and marine andenergy end markets in the first quarter of fiscal 2014 as compared to the first quarter of fiscal 2013. Inthe Consumer Solutions segment, we expect our sales to decline in the consumer devices end market,with this decline partially offset by a modest increase in our sales in the appliances end market in thefirst quarter of fiscal 2014 as compared to the same period of fiscal 2013. In the Network Solutionssegment, we expect our sales to decline during the first quarter of fiscal 2014, reflecting continuedweakness in the subsea communications and data communications end markets. We expect this decline
17

to be partially offset by sales increases in the telecom networks end market. We expect diluted earningsper share to be in the range of $0.71 to $0.75 per share in the first quarter of fiscal 2014.
For fiscal 2014, we expect net sales to be between $13.65 billion and $14.15 billion, reflectingexpected sales increases in the Transportation Solutions and Industrial Solutions segments and, to alesser degree, the Consumer Solutions segment from fiscal 2013 levels. In the Transportation Solutionssegment, we expect our sales growth to exceed an anticipated increase in global automotive productionof approximately 4% from fiscal 2013 levels. In the Industrial Solutions segment, we expect our sales toincrease in fiscal 2014 from fiscal 2013 levels in all end markets, with growth primarily in theaerospace, defense, and marine end market due to strength in commercial aviation and oil and gasmarkets. In the Consumer Solutions segment, we expect a slight increase in our sales in the appliancesend market in fiscal 2014 while our sales in the consumer devices end market are expected to beconsistent with fiscal 2013 levels. In the Network Solutions segment, we expect our fiscal 2014 sales tobe consistent with fiscal 2013 levels, with increased sales in the telecom networks end market offset bydecreased sales in the data communications end market. We expect diluted earnings per share to be inthe range of $3.41 to $3.71 per share in fiscal 2014.
The above outlook is based on foreign exchange rates and commodity prices that are consistentwith current levels.
We are monitoring the current macroeconomic environment and its potential effects on ourcustomers and the end markets we serve. Additionally, we continue to closely manage our costs in linewith economic conditions. We also are managing our capital resources and monitoring capitalavailability to ensure that we have sufficient resources to fund future capital needs. (See furtherdiscussion in ‘‘Liquidity and Capital Resources.’’)
Acquisitions
On April 3, 2012, we acquired 100% of the outstanding shares of Deutsch. The total value paid forthe transaction amounted to A1.55 billion (approximately $2.05 billion using an exchange rate of $1.33per A1.00), net of cash acquired. The total value paid included $659 million related to the repayment ofDeutsch’s financial debt and accrued interest. The acquired Deutsch businesses have been reported inthe Transportation Solutions and Industrial Solutions segments from the date of acquisition. Duringfiscal 2012, Deutsch contributed net sales of $327 million and an operating loss of $54 million to ourConsolidated Statement of Operations. The operating loss included charges of $75 million associatedwith the amortization of acquisition-related fair value adjustments primarily related to acquiredinventories and customer order backlog, acquisition costs of $21 million, restructuring charges of$14 million, and integration costs of $6 million.
In July 2010, we entered into an Agreement and Plan of Merger to acquire 100% of theoutstanding stock of ADC, a provider of broadband communications network connectivity products andrelated solutions. On December 9, 2010, upon effecting a short-form merger under Minnesota law, weowned 100% of the outstanding shares of ADC for a total purchase price of approximately$1,263 million in cash (excluding cash acquired of $546 million) and $22 million representing the fairvalue of ADC share-based awards exchanged for TE Connectivity share options and stock appreciationrights. The acquired ADC businesses have been included in the Network Solutions segment from thedate of acquisition. During fiscal 2011, ADC contributed net sales of $843 million and an operating lossof $53 million to our Consolidated Statement of Operations. The operating loss included restructuringcharges of $80 million, charges of $39 million associated with the amortization of acquisition-relatedfair value adjustments primarily related to acquired inventories and customer order backlog, integrationcosts of $10 million, and acquisition costs of $9 million.
See Note 5 to the Consolidated Financial Statements for additional information regardingacquisitions.
18

Restructuring
We plan to continue to simplify our global manufacturing footprint by migrating facilities fromhigher-cost to lower-cost countries, consolidating within countries, and transferring product lines tolower-cost countries. These initiatives are designed to help us maintain our competitiveness in theindustry, improve our operating leverage, and position us for growth in the years ahead. In connectionwith these initiatives and in response to market conditions, we incurred net restructuring charges of$314 million during fiscal 2013 and expect to incur net restructuring charges of approximately$50 million during fiscal 2014. Cash spending related to restructuring was $151 million during fiscal2013, and we expect total spending, which will be funded with cash from operations, to beapproximately $175 million in fiscal 2014. Annualized cost savings related to these actions are expectedto be approximately $115 million and are expected to be realized by the end of fiscal 2015. Cost savingswill be reflected primarily in cost of sales and selling, general, and administrative expenses.
Discontinued Operations
During fiscal 2012, we sold our Touch Solutions business for net cash proceeds of $380 million andrecognized an insignificant pre-tax gain on the transaction. Also, during fiscal 2012, we sold our TEProfessional Services business for net cash proceeds of $28 million and recognized an insignificantpre-tax gain on the transaction. See Note 4 to the Consolidated Financial Statements for additionalinformation regarding discontinued operations.
Results of Operations
Key business factors that influenced our results of operations for the periods discussed in thisreport include:
• Raw material prices. We purchased approximately 172 million pounds of copper, 133,000 troyounces of gold, and 2.5 million troy ounces of silver in fiscal 2013. Prices continue to fluctuate.The following table sets forth the average prices incurred related to copper, gold, and silver.
Fiscal
Measure 2013 2012 2011
Copper . . . . . . . . . . . . . . . . . . . . . . . . . . . . . . Lb. $ 3.51 $ 3.90 $ 3.99Gold . . . . . . . . . . . . . . . . . . . . . . . . . . . . . . . Troy oz. $1,613 $1,599 $1,382Silver . . . . . . . . . . . . . . . . . . . . . . . . . . . . . . . Troy oz. $29.18 $34.30 $30.27
In fiscal 2014, we expect to purchase copper, gold, and silver in quantities similar to fiscal 2013levels.
• Foreign exchange. Approximately 53% of our net sales are invoiced in currencies other than theU.S. Dollar. Our results of operations are influenced by changes in foreign currency exchangerates. Increases or decreases in the value of the U.S. Dollar, compared to other currencies, willdirectly affect our reported results as we translate those currencies into U.S. Dollars at the end
19
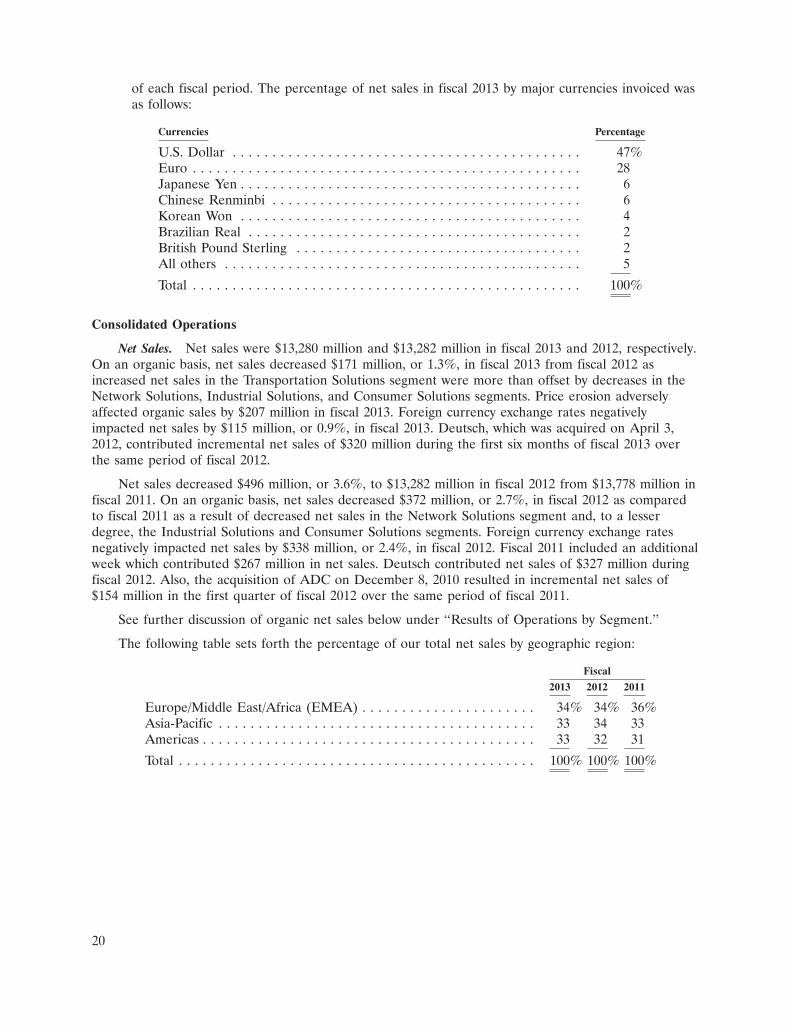
of each fiscal period. The percentage of net sales in fiscal 2013 by major currencies invoiced wasas follows:
Currencies Percentage
U.S. Dollar . . . . . . . . . . . . . . . . . . . . . . . . . . . . . . . . . . . . . . . . . . . . 47%Euro . . . . . . . . . . . . . . . . . . . . . . . . . . . . . . . . . . . . . . . . . . . . . . . . . 28Japanese Yen . . . . . . . . . . . . . . . . . . . . . . . . . . . . . . . . . . . . . . . . . . . 6Chinese Renminbi . . . . . . . . . . . . . . . . . . . . . . . . . . . . . . . . . . . . . . . 6Korean Won . . . . . . . . . . . . . . . . . . . . . . . . . . . . . . . . . . . . . . . . . . . 4Brazilian Real . . . . . . . . . . . . . . . . . . . . . . . . . . . . . . . . . . . . . . . . . . 2British Pound Sterling . . . . . . . . . . . . . . . . . . . . . . . . . . . . . . . . . . . . 2All others . . . . . . . . . . . . . . . . . . . . . . . . . . . . . . . . . . . . . . . . . . . . . 5
Total . . . . . . . . . . . . . . . . . . . . . . . . . . . . . . . . . . . . . . . . . . . . . . . . . 100%
Consolidated Operations
Net Sales. Net sales were $13,280 million and $13,282 million in fiscal 2013 and 2012, respectively.On an organic basis, net sales decreased $171 million, or 1.3%, in fiscal 2013 from fiscal 2012 asincreased net sales in the Transportation Solutions segment were more than offset by decreases in theNetwork Solutions, Industrial Solutions, and Consumer Solutions segments. Price erosion adverselyaffected organic sales by $207 million in fiscal 2013. Foreign currency exchange rates negativelyimpacted net sales by $115 million, or 0.9%, in fiscal 2013. Deutsch, which was acquired on April 3,2012, contributed incremental net sales of $320 million during the first six months of fiscal 2013 overthe same period of fiscal 2012.
Net sales decreased $496 million, or 3.6%, to $13,282 million in fiscal 2012 from $13,778 million infiscal 2011. On an organic basis, net sales decreased $372 million, or 2.7%, in fiscal 2012 as comparedto fiscal 2011 as a result of decreased net sales in the Network Solutions segment and, to a lesserdegree, the Industrial Solutions and Consumer Solutions segments. Foreign currency exchange ratesnegatively impacted net sales by $338 million, or 2.4%, in fiscal 2012. Fiscal 2011 included an additionalweek which contributed $267 million in net sales. Deutsch contributed net sales of $327 million duringfiscal 2012. Also, the acquisition of ADC on December 8, 2010 resulted in incremental net sales of$154 million in the first quarter of fiscal 2012 over the same period of fiscal 2011.
See further discussion of organic net sales below under ‘‘Results of Operations by Segment.’’
The following table sets forth the percentage of our total net sales by geographic region:
Fiscal
2013 2012 2011
Europe/Middle East/Africa (EMEA) . . . . . . . . . . . . . . . . . . . . . . 34% 34% 36%Asia-Pacific . . . . . . . . . . . . . . . . . . . . . . . . . . . . . . . . . . . . . . . . 33 34 33Americas . . . . . . . . . . . . . . . . . . . . . . . . . . . . . . . . . . . . . . . . . . 33 32 31
Total . . . . . . . . . . . . . . . . . . . . . . . . . . . . . . . . . . . . . . . . . . . . . 100% 100% 100%
20
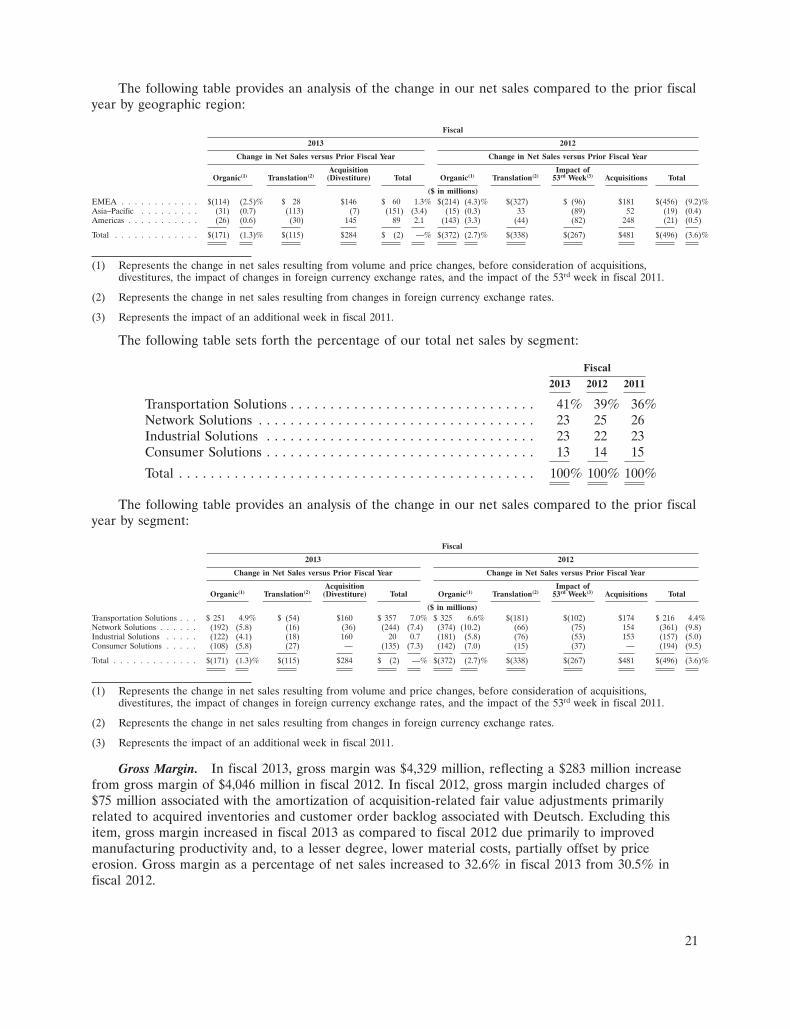
The following table provides an analysis of the change in our net sales compared to the prior fiscalyear by geographic region:
Fiscal
2013 2012
Change in Net Sales versus Prior Fiscal Year Change in Net Sales versus Prior Fiscal Year
Acquisition Impact ofOrganic(1) Translation(2) (Divestiture) Total Organic(1) Translation(2) 53rd Week(3) Acquisitions Total
($ in millions)EMEA . . . . . . . . . . . . $(114) (2.5)% $ 28 $146 $ 60 1.3% $(214) (4.3)% $(327) $ (96) $181 $(456) (9.2)%Asia–Pacific . . . . . . . . . (31) (0.7) (113) (7) (151) (3.4) (15) (0.3) 33 (89) 52 (19) (0.4)Americas . . . . . . . . . . . (26) (0.6) (30) 145 89 2.1 (143) (3.3) (44) (82) 248 (21) (0.5)
Total . . . . . . . . . . . . . $(171) (1.3)% $(115) $284 $ (2) —% $(372) (2.7)% $(338) $(267) $481 $(496) (3.6)%
(1) Represents the change in net sales resulting from volume and price changes, before consideration of acquisitions,divestitures, the impact of changes in foreign currency exchange rates, and the impact of the 53rd week in fiscal 2011.
(2) Represents the change in net sales resulting from changes in foreign currency exchange rates.
(3) Represents the impact of an additional week in fiscal 2011.
The following table sets forth the percentage of our total net sales by segment:
Fiscal
2013 2012 2011
Transportation Solutions . . . . . . . . . . . . . . . . . . . . . . . . . . . . . . . 41% 39% 36%Network Solutions . . . . . . . . . . . . . . . . . . . . . . . . . . . . . . . . . . . 23 25 26Industrial Solutions . . . . . . . . . . . . . . . . . . . . . . . . . . . . . . . . . . 23 22 23Consumer Solutions . . . . . . . . . . . . . . . . . . . . . . . . . . . . . . . . . . 13 14 15
Total . . . . . . . . . . . . . . . . . . . . . . . . . . . . . . . . . . . . . . . . . . . . . 100% 100% 100%
The following table provides an analysis of the change in our net sales compared to the prior fiscalyear by segment:
Fiscal
2013 2012
Change in Net Sales versus Prior Fiscal Year Change in Net Sales versus Prior Fiscal Year
Acquisition Impact ofOrganic(1) Translation(2) (Divestiture) Total Organic(1) Translation(2) 53rd Week(3) Acquisitions Total
($ in millions)Transportation Solutions . . . $ 251 4.9% $ (54) $160 $ 357 7.0% $ 325 6.6% $(181) $(102) $174 $ 216 4.4%Network Solutions . . . . . . (192) (5.8) (16) (36) (244) (7.4) (374) (10.2) (66) (75) 154 (361) (9.8)Industrial Solutions . . . . . (122) (4.1) (18) 160 20 0.7 (181) (5.8) (76) (53) 153 (157) (5.0)Consumer Solutions . . . . . (108) (5.8) (27) — (135) (7.3) (142) (7.0) (15) (37) — (194) (9.5)
Total . . . . . . . . . . . . . $(171) (1.3)% $(115) $284 $ (2) —% $(372) (2.7)% $(338) $(267) $481 $(496) (3.6)%
(1) Represents the change in net sales resulting from volume and price changes, before consideration of acquisitions,divestitures, the impact of changes in foreign currency exchange rates, and the impact of the 53rd week in fiscal 2011.
(2) Represents the change in net sales resulting from changes in foreign currency exchange rates.
(3) Represents the impact of an additional week in fiscal 2011.
Gross Margin. In fiscal 2013, gross margin was $4,329 million, reflecting a $283 million increasefrom gross margin of $4,046 million in fiscal 2012. In fiscal 2012, gross margin included charges of$75 million associated with the amortization of acquisition-related fair value adjustments primarilyrelated to acquired inventories and customer order backlog associated with Deutsch. Excluding thisitem, gross margin increased in fiscal 2013 as compared to fiscal 2012 due primarily to improvedmanufacturing productivity and, to a lesser degree, lower material costs, partially offset by priceerosion. Gross margin as a percentage of net sales increased to 32.6% in fiscal 2013 from 30.5% infiscal 2012.
21

In fiscal 2012, gross margin was $4,046 million, reflecting a $225 million decrease from grossmargin of $4,271 million in fiscal 2011. In fiscal 2012, gross margin included charges of $75 millionassociated with the acquisition of Deutsch, whereas in fiscal 2011, gross margin included similar chargesof $39 million associated with the acquisition of ADC. Excluding these items, gross margin decreased infiscal 2012 as compared to fiscal 2011. The decrease resulted from lower sales levels and, to a lesserdegree, increased material costs, partially offset by improved manufacturing productivity. Gross marginas a percentage of net sales decreased to 30.5% in fiscal 2012 from 31.0% in fiscal 2011.
Selling, General, and Administrative Expenses. Selling, general, and administrative expensesincreased $88 million to $1,773 million in fiscal 2013 from $1,685 million in fiscal 2012. The increaseresulted primarily from additional selling, general, and administrative expenses of Deutsch, increasedincentive compensation costs, and impairment charges on certain assets held for sale, partially offset bybenefits attributable to restructuring actions. Selling, general, and administrative expenses as apercentage of net sales increased to 13.4% in fiscal 2013 from 12.7% in fiscal 2012.
Selling, general, and administrative expenses decreased $43 million to $1,685 million in fiscal 2012from $1,728 million in fiscal 2011. The decrease resulted primarily from cost control measures andbenefits attributable to restructuring actions, partially offset by the additional selling, general, andadministrative expenses of Deutsch. Selling, general, and administrative expenses as a percentage of netsales increased to 12.7% in fiscal 2012 from 12.5% in fiscal 2011 primarily as a result of the decrease insales.
Acquisition and Integration Costs. In connection with the acquisition of Deutsch, we incurredacquisition and integration costs of $14 million and $27 million during fiscal 2013 and 2012,respectively. In connection with the acquisition of ADC, we incurred acquisition and integration costsof $19 million during fiscal 2011.
Restructuring and Other Charges, Net. Net restructuring and other charges were $311 million,$128 million, and $136 million in fiscal 2013, 2012, and 2011, respectively. During fiscal 2013, weinitiated a restructuring program associated with headcount reductions and manufacturing site closuresimpacting all segments. During fiscal 2012, we initiated a restructuring program to reduce headcountacross all segments. Also, we initiated a restructuring program in the Transportation Solutions andIndustrial Solutions segments associated with the acquisition of Deutsch. We initiated a restructuringprogram during fiscal 2011 which was primarily associated with the acquisition of ADC and relatedheadcount reductions in the Network Solutions segment. Additionally, in fiscal 2011, we institutedreductions-in-force across all segments as a result of economic conditions. See Note 3 to theConsolidated Financial Statements for additional information regarding net restructuring and othercharges.
Operating Income. Operating income was $1,556 million and $1,518 million in fiscal 2013 and2012, respectively. Results for fiscal 2013 included $311 million of net restructuring and other chargesand $14 million of acquisition and integration costs. Results for fiscal 2012 included $116 million ofcharges related to the acquisition of Deutsch, including $75 million of charges associated with theamortization of acquisition-related fair value adjustments primarily related to acquired inventories andcustomer order backlog, $27 million of acquisition and integration costs, and $14 million of netrestructuring and other charges. Results for fiscal 2012 also included $114 million of additional netrestructuring and other charges.
Operating income was $1,518 million and $1,687 million in fiscal 2012 and 2011, respectively. Asdiscussed above, results for fiscal 2012 included $116 million of charges related to the acquisition ofDeutsch. Results for fiscal 2012 also included $114 million of additional net restructuring and othercharges. Results for fiscal 2011 included $138 million of charges related to the acquisition of ADC,including $80 million of net restructuring and other charges, $39 million of charges associated with the
22

amortization of acquisition-related fair value adjustments primarily related to acquired inventories andcustomer order backlog, and $19 million of acquisition and integration costs. Results for fiscal 2011 alsoincluded $56 million of additional net restructuring and other charges and an additional week whichcontributed $52 million of operating income.
Non-Operating Items
Interest Expense, Net. Net interest expense was $125 million, $153 million, and $139 million infiscal 2013, 2012, and 2011, respectively. The decrease of $28 million in fiscal 2013 from fiscal 2012 wasdue to lower average debt levels, while the increase of $14 million in fiscal 2012 from fiscal 2011resulted from higher average debt levels.
Other Income (Expense), Net. In fiscal 2013, 2012, and 2011, we recorded net other expense of$183 million, net other income of $50 million, and net other income of $27 million, respectively,primarily pursuant to the Tax Sharing Agreement with Tyco International and Covidien. See Note 12 tothe Consolidated Financial Statements for further information regarding the Tax Sharing Agreement.The net other expense in fiscal 2013 included $231 million related to the effective settlement of allundisputed tax matters for the period 1997 through 2000. See Note 13 to the Consolidated FinancialStatements for additional information.
Income Taxes. Our operations are conducted through our various subsidiaries in a number ofcountries throughout the world. We have provided for income taxes based upon the tax laws and ratesin the countries in which our operations are conducted and income and loss from operations is subjectto taxation.
The tax benefit for fiscal 2013 reflects an income tax benefit of $331 million related to theeffective settlement of all undisputed tax matters for the period 1997 through 2000. In addition, the taxbenefit for fiscal 2013 reflects $23 million of net tax benefits primarily consisting of income tax benefitsrecognized in connection with a reduction in the valuation allowance associated with certain ADC taxloss carryforwards and income tax benefits recognized in connection with the lapse of statutes oflimitations for examinations of prior year income tax returns, partially offset by income tax expenserelated to adjustments to prior year income tax returns.
We assessed the realization of ADC’s tax loss and credit carryforwards that we acquired inconnection with our purchase of ADC, and we believe it is more likely than not that a tax benefit willbe realized on additional U.S. federal and state net operating losses. Based upon the fiscal years 2011through 2013 U.S. operating results of the ADC business under our management, we reduced thevaluation allowance provided at the date of acquisition and recorded a tax benefit of $63 million. As offiscal year end 2013, we continue to maintain a valuation allowance of $177 million related to U.S.federal and state ADC tax attributes due to the uncertainty of their realization in the future.
The tax provision for fiscal 2012 reflects an income tax benefit of $107 million recognized inconnection with a reduction in the valuation allowance associated with tax loss carryforwards in certainnon-U.S. locations. In addition, the tax provision for fiscal 2012 reflects $17 million of income taxexpense associated with certain non-U.S. tax rate changes enacted in the quarter ended December 30,2011.
The tax provision for fiscal 2011 reflects income tax benefits of $35 million associated with thecompletion of fieldwork and the settlement of certain U.S. tax matters.
The valuation allowance for deferred tax assets of $1,816 million and $1,719 million at fiscal yearend 2013 and 2012, respectively, relates principally to the uncertainty of the utilization of certaindeferred tax assets, primarily tax loss, capital loss, and credit carryforwards in various jurisdictions. Webelieve that we will generate sufficient future taxable income to realize the income tax benefits relatedto the remaining net deferred tax assets on our Consolidated Balance Sheet. The valuation allowance
23
was calculated in accordance with the provisions of ASC 740, Income Taxes, which require that avaluation allowance be established or maintained when it is more likely than not that all or a portion ofdeferred tax assets will not be realized.
The calculation of our tax liabilities includes estimates for uncertainties in the application ofcomplex tax regulations across multiple global jurisdictions where we conduct our operations. Underthe uncertain tax position provisions of ASC 740, we recognize liabilities for tax and related interest forissues in the U.S. and other tax jurisdictions based on our estimate of whether, and the extent to which,additional taxes and related interest will be due. These tax liabilities and related interest are reflectednet of the impact of related tax loss carryforwards, as such tax loss carryforwards will be applied againstthese tax liabilities and will reduce the amount of cash tax payments due upon the eventual settlementwith the tax authorities. These estimates may change due to changing facts and circumstances. Due tothe complexity of these uncertainties, the ultimate resolution may result in a settlement that differsfrom our current estimate of the tax liabilities and related interest. Furthermore, management hasreviewed with tax counsel the issues raised by certain taxing authorities and the adequacy of theserecorded amounts. If our current estimate of tax and interest liabilities is less than the ultimatesettlement, an additional charge to income tax expense may result. If our current estimate of tax andinterest liabilities is more than the ultimate settlement, income tax benefits may be recognized.
We have provided income taxes for earnings that are currently distributed as well as the taxesassociated with several subsidiaries’ earnings that are expected to be distributed in the future. Noadditional provision has been made for Swiss or non-Swiss income taxes on the undistributed earningsof subsidiaries or for unrecognized deferred tax liabilities for temporary differences related to basisdifferences in investments in subsidiaries, as such earnings are expected to be permanently reinvested,the investments are essentially permanent in duration, or we have concluded that no additional taxliability will arise as a result of the distribution of such earnings. As of September 27, 2013, certainsubsidiaries had approximately $18 billion of cumulative undistributed earnings that have been retainedindefinitely and reinvested in our global manufacturing operations, including working capital, property,plant, and equipment, intangible assets, and research and development activities. A liability could ariseif our intention to permanently reinvest such earnings were to change and amounts are distributed bysuch subsidiaries or if such subsidiaries are ultimately disposed. It is not practicable to estimate theadditional income taxes related to permanently reinvested earnings or the basis differences related toinvestments in subsidiaries. As of September 27, 2013, we had approximately $4.5 billion of cash, cashequivalents, and intercompany deposits, principally in our subsidiaries, that we have the ability todistribute to Tyco Electronics Group S.A. (‘‘TEGSA’’), our Luxembourg subsidiary, which is the obligorof substantially all of our debt, and to TE Connectivity Ltd., our Swiss parent company, but weconsider to be permanently reinvested. We estimate that up to approximately $1.5 billion of tax expensewould be recognized on our Consolidated Financial Statements if our intention to permanently reinvestthese amounts were to change. Our current plans do not demonstrate a need to repatriate cash, cashequivalents, and intercompany deposits that are designated as permanently reinvested in order to fundour operations, including investing and financing activities.
Income (Loss) from Discontinued Operations, Net of Income Taxes. During fiscal 2012, we sold ourTouch Solutions business for net cash proceeds of $380 million and recognized an insignificant pre-taxgain on the transaction. The agreement includes contingent earn-out provisions through 2015 based onbusiness performance. In connection with the divestiture, we incurred an income tax charge of$65 million, which is included in income (loss) from discontinued operations, net of income taxes onthe Consolidated Statement of Operations for fiscal 2012. This charge was primarily driven by theinability to fully realize a tax benefit associated with the write-off of goodwill at the time of the sale.
During fiscal 2012, we sold our TE Professional Services business for net cash proceeds of$28 million and recognized an insignificant pre-tax gain on the transaction. Additionally, during fiscal2012, we recorded a pre-tax impairment charge of $28 million, which is included in income (loss) from
24
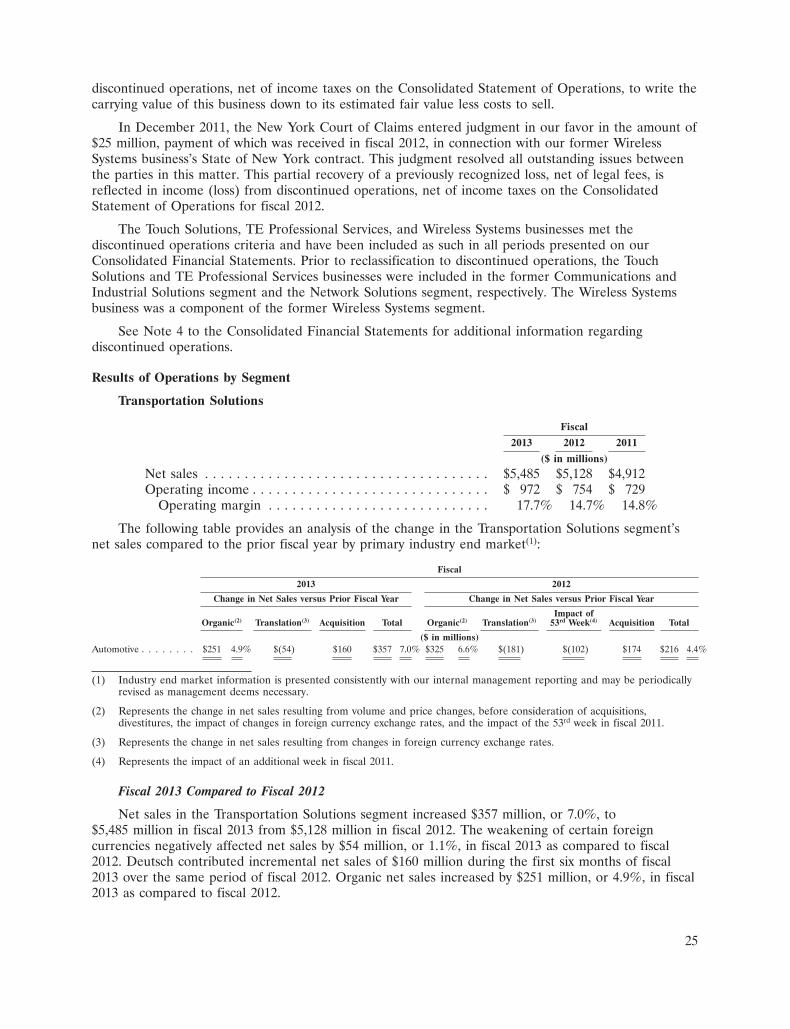
discontinued operations, net of income taxes on the Consolidated Statement of Operations, to write thecarrying value of this business down to its estimated fair value less costs to sell.
In December 2011, the New York Court of Claims entered judgment in our favor in the amount of$25 million, payment of which was received in fiscal 2012, in connection with our former WirelessSystems business’s State of New York contract. This judgment resolved all outstanding issues betweenthe parties in this matter. This partial recovery of a previously recognized loss, net of legal fees, isreflected in income (loss) from discontinued operations, net of income taxes on the ConsolidatedStatement of Operations for fiscal 2012.
The Touch Solutions, TE Professional Services, and Wireless Systems businesses met thediscontinued operations criteria and have been included as such in all periods presented on ourConsolidated Financial Statements. Prior to reclassification to discontinued operations, the TouchSolutions and TE Professional Services businesses were included in the former Communications andIndustrial Solutions segment and the Network Solutions segment, respectively. The Wireless Systemsbusiness was a component of the former Wireless Systems segment.
See Note 4 to the Consolidated Financial Statements for additional information regardingdiscontinued operations.
Results of Operations by Segment
Transportation Solutions
Fiscal
2013 2012 2011
($ in millions)
Net sales . . . . . . . . . . . . . . . . . . . . . . . . . . . . . . . . . . . . $5,485 $5,128 $4,912Operating income . . . . . . . . . . . . . . . . . . . . . . . . . . . . . . $ 972 $ 754 $ 729
Operating margin . . . . . . . . . . . . . . . . . . . . . . . . . . . . 17.7% 14.7% 14.8%
The following table provides an analysis of the change in the Transportation Solutions segment’snet sales compared to the prior fiscal year by primary industry end market(1):
Fiscal
2013 2012
Change in Net Sales versus Prior Fiscal Year Change in Net Sales versus Prior Fiscal Year
Impact ofOrganic(2) Translation(3) Acquisition Total Organic(2) Translation(3) 53rd Week(4) Acquisition Total
($ in millions)Automotive . . . . . . . . $251 4.9% $(54) $160 $357 7.0% $325 6.6% $(181) $(102) $174 $216 4.4%
(1) Industry end market information is presented consistently with our internal management reporting and may be periodicallyrevised as management deems necessary.
(2) Represents the change in net sales resulting from volume and price changes, before consideration of acquisitions,divestitures, the impact of changes in foreign currency exchange rates, and the impact of the 53rd week in fiscal 2011.
(3) Represents the change in net sales resulting from changes in foreign currency exchange rates.
(4) Represents the impact of an additional week in fiscal 2011.
Fiscal 2013 Compared to Fiscal 2012
Net sales in the Transportation Solutions segment increased $357 million, or 7.0%, to$5,485 million in fiscal 2013 from $5,128 million in fiscal 2012. The weakening of certain foreigncurrencies negatively affected net sales by $54 million, or 1.1%, in fiscal 2013 as compared to fiscal2012. Deutsch contributed incremental net sales of $160 million during the first six months of fiscal2013 over the same period of fiscal 2012. Organic net sales increased by $251 million, or 4.9%, in fiscal2013 as compared to fiscal 2012.
25

In the automotive end market, our organic net sales increased 4.9% in fiscal 2013 as compared tofiscal 2012. The increase was due primarily to growth of 9.9% in the Americas region, 5.1% in theAsia-Pacific region, and 2.2% in the EMEA region. Growth in the Americas region was driven bystrong consumer demand resulting in increased vehicle production. In the Asia-Pacific region, growthwas driven by increasing demand in China partially offset by declines in Japan. In the EMEA region,growth resulted primarily from increased exports to other regions while automotive demand was weakin the EMEA region.
In fiscal 2013, operating income in the Transportation Solutions segment increased $218 million to$972 million from $754 million in fiscal 2012. Segment results for fiscal 2013 included $38 million ofnet restructuring and other charges and $7 million of acquisition and integration costs related to theacquisition of Deutsch. Segment results for fiscal 2012 included $67 million of charges related to theacquisition of Deutsch, including $42 million of charges associated with the amortization of acquisition-related fair value adjustments primarily related to acquired inventories and customer order backlog,$16 million of acquisition and integration costs, and $9 million of net restructuring and other charges.Segment results also included $9 million of additional net restructuring and other charges in fiscal 2012.Excluding these items, operating income increased in fiscal 2013 as compared to fiscal 2012. Theincrease resulted primarily from higher volume, improved manufacturing productivity, and lowermaterial costs, partially offset by price erosion.
Fiscal 2012 Compared to Fiscal 2011
In fiscal 2012, net sales in the Transportation Solutions segment increased $216 million, or 4.4%,to $5,128 million from $4,912 million in fiscal 2011. The weakening of certain foreign currenciesnegatively affected net sales by $181 million, or 3.7%, in fiscal 2012 as compared to fiscal 2011. Fiscal2011 included an additional week which contributed approximately $102 million in net sales. Deutschcontributed net sales of $174 million during fiscal 2012. Organic net sales increased by $325 million, or6.6%, in fiscal 2012 as compared to fiscal 2011.
In the automotive end market, our organic net sales increased 6.6% in fiscal 2012 as compared tofiscal 2011. The increase was due primarily to growth of 15.3% in the Asia-Pacific region and 11.0% inthe Americas region, partially offset by declines of 1.1% in the EMEA region. Growth in theAsia-Pacific region resulted from higher automotive production and continued recovery following theearthquake in Japan. We estimate that the earthquake in Japan negatively impacted our sales in theautomotive end market by $38 million in fiscal 2011. In the Americas region, growth resulted fromincreased production in North America, partially offset by weakness in South America. In the EMEAregion, production levels decreased as a result of financial uncertainty in Europe.
Operating income in the Transportation Solutions segment increased $25 million to $754 million infiscal 2012 from $729 million in fiscal 2011. As discussed above, segment results for fiscal 2012 included$67 million of charges related to the acquisition of Deutsch. Segment results also included $9 million ofnet charges and $13 million of net credits to restructuring and other charges (credits) in fiscal 2012 and2011, respectively. Excluding these items, operating income increased in fiscal 2012 as compared tofiscal 2011. The increase resulted primarily from higher volume and, to a lesser degree, pricing actionsand improved manufacturing productivity.
26
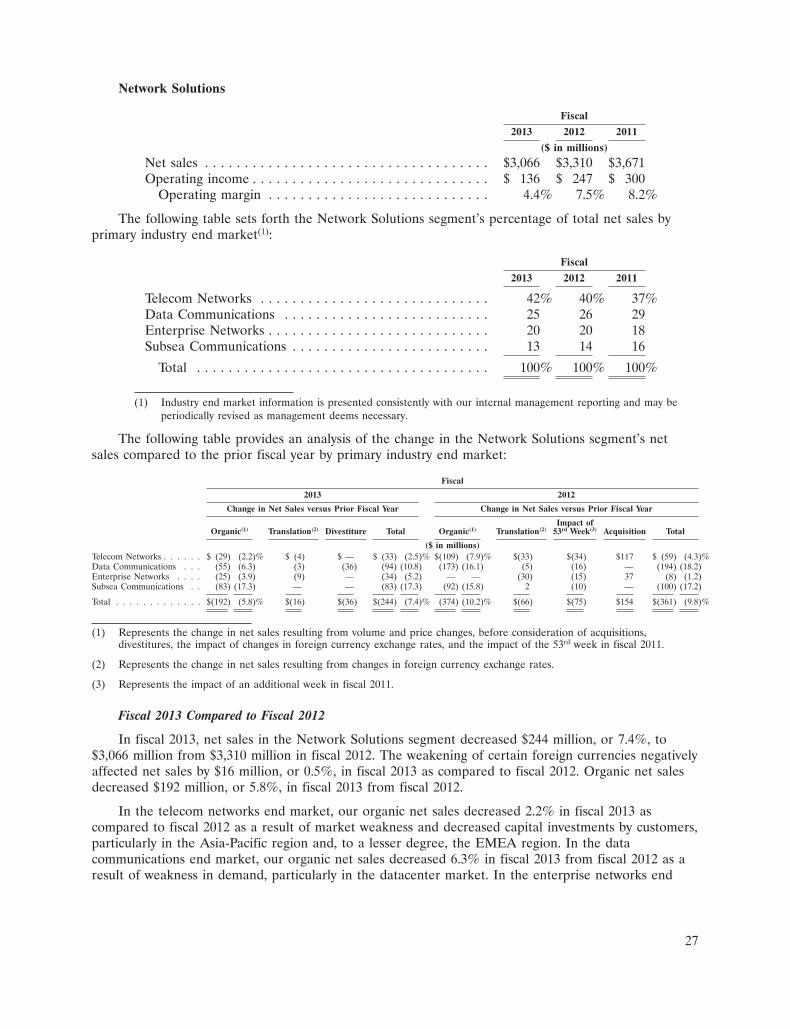
Network Solutions
Fiscal
2013 2012 2011
($ in millions)
Net sales . . . . . . . . . . . . . . . . . . . . . . . . . . . . . . . . . . . . $3,066 $3,310 $3,671Operating income . . . . . . . . . . . . . . . . . . . . . . . . . . . . . . $ 136 $ 247 $ 300
Operating margin . . . . . . . . . . . . . . . . . . . . . . . . . . . . 4.4% 7.5% 8.2%
The following table sets forth the Network Solutions segment’s percentage of total net sales byprimary industry end market(1):
Fiscal
2013 2012 2011
Telecom Networks . . . . . . . . . . . . . . . . . . . . . . . . . . . . . 42% 40% 37%Data Communications . . . . . . . . . . . . . . . . . . . . . . . . . . 25 26 29Enterprise Networks . . . . . . . . . . . . . . . . . . . . . . . . . . . . 20 20 18Subsea Communications . . . . . . . . . . . . . . . . . . . . . . . . . 13 14 16
Total . . . . . . . . . . . . . . . . . . . . . . . . . . . . . . . . . . . . . 100% 100% 100%
(1) Industry end market information is presented consistently with our internal management reporting and may beperiodically revised as management deems necessary.
The following table provides an analysis of the change in the Network Solutions segment’s netsales compared to the prior fiscal year by primary industry end market:
Fiscal
2013 2012
Change in Net Sales versus Prior Fiscal Year Change in Net Sales versus Prior Fiscal Year
Impact ofOrganic(1) Translation(2) Divestiture Total Organic(1) Translation(2) 53rd Week(3) Acquisition Total
($ in millions)Telecom Networks . . . . . . $ (29) (2.2)% $ (4) $ — $ (33) (2.5)% $(109) (7.9)% $(33) $(34) $117 $ (59) (4.3)%Data Communications . . . (55) (6.3) (3) (36) (94) (10.8) (173) (16.1) (5) (16) — (194) (18.2)Enterprise Networks . . . . (25) (3.9) (9) — (34) (5.2) — — (30) (15) 37 (8) (1.2)Subsea Communications . . (83) (17.3) — — (83) (17.3) (92) (15.8) 2 (10) — (100) (17.2)
Total . . . . . . . . . . . . . $(192) (5.8)% $(16) $(36) $(244) (7.4)% (374) (10.2)% $(66) $(75) $154 $(361) (9.8)%
(1) Represents the change in net sales resulting from volume and price changes, before consideration of acquisitions,divestitures, the impact of changes in foreign currency exchange rates, and the impact of the 53rd week in fiscal 2011.
(2) Represents the change in net sales resulting from changes in foreign currency exchange rates.
(3) Represents the impact of an additional week in fiscal 2011.
Fiscal 2013 Compared to Fiscal 2012
In fiscal 2013, net sales in the Network Solutions segment decreased $244 million, or 7.4%, to$3,066 million from $3,310 million in fiscal 2012. The weakening of certain foreign currencies negativelyaffected net sales by $16 million, or 0.5%, in fiscal 2013 as compared to fiscal 2012. Organic net salesdecreased $192 million, or 5.8%, in fiscal 2013 from fiscal 2012.
In the telecom networks end market, our organic net sales decreased 2.2% in fiscal 2013 ascompared to fiscal 2012 as a result of market weakness and decreased capital investments by customers,particularly in the Asia-Pacific region and, to a lesser degree, the EMEA region. In the datacommunications end market, our organic net sales decreased 6.3% in fiscal 2013 from fiscal 2012 as aresult of weakness in demand, particularly in the datacenter market. In the enterprise networks end
27
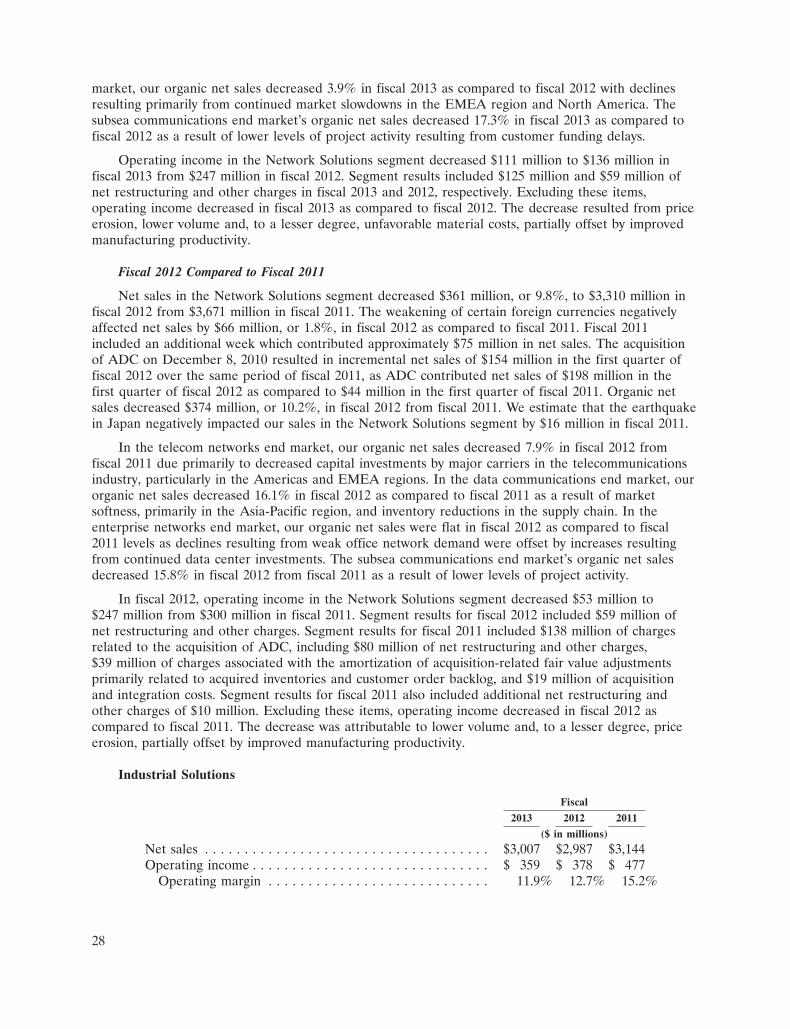
market, our organic net sales decreased 3.9% in fiscal 2013 as compared to fiscal 2012 with declinesresulting primarily from continued market slowdowns in the EMEA region and North America. Thesubsea communications end market’s organic net sales decreased 17.3% in fiscal 2013 as compared tofiscal 2012 as a result of lower levels of project activity resulting from customer funding delays.
Operating income in the Network Solutions segment decreased $111 million to $136 million infiscal 2013 from $247 million in fiscal 2012. Segment results included $125 million and $59 million ofnet restructuring and other charges in fiscal 2013 and 2012, respectively. Excluding these items,operating income decreased in fiscal 2013 as compared to fiscal 2012. The decrease resulted from priceerosion, lower volume and, to a lesser degree, unfavorable material costs, partially offset by improvedmanufacturing productivity.
Fiscal 2012 Compared to Fiscal 2011
Net sales in the Network Solutions segment decreased $361 million, or 9.8%, to $3,310 million infiscal 2012 from $3,671 million in fiscal 2011. The weakening of certain foreign currencies negativelyaffected net sales by $66 million, or 1.8%, in fiscal 2012 as compared to fiscal 2011. Fiscal 2011included an additional week which contributed approximately $75 million in net sales. The acquisitionof ADC on December 8, 2010 resulted in incremental net sales of $154 million in the first quarter offiscal 2012 over the same period of fiscal 2011, as ADC contributed net sales of $198 million in thefirst quarter of fiscal 2012 as compared to $44 million in the first quarter of fiscal 2011. Organic netsales decreased $374 million, or 10.2%, in fiscal 2012 from fiscal 2011. We estimate that the earthquakein Japan negatively impacted our sales in the Network Solutions segment by $16 million in fiscal 2011.
In the telecom networks end market, our organic net sales decreased 7.9% in fiscal 2012 fromfiscal 2011 due primarily to decreased capital investments by major carriers in the telecommunicationsindustry, particularly in the Americas and EMEA regions. In the data communications end market, ourorganic net sales decreased 16.1% in fiscal 2012 as compared to fiscal 2011 as a result of marketsoftness, primarily in the Asia-Pacific region, and inventory reductions in the supply chain. In theenterprise networks end market, our organic net sales were flat in fiscal 2012 as compared to fiscal2011 levels as declines resulting from weak office network demand were offset by increases resultingfrom continued data center investments. The subsea communications end market’s organic net salesdecreased 15.8% in fiscal 2012 from fiscal 2011 as a result of lower levels of project activity.
In fiscal 2012, operating income in the Network Solutions segment decreased $53 million to$247 million from $300 million in fiscal 2011. Segment results for fiscal 2012 included $59 million ofnet restructuring and other charges. Segment results for fiscal 2011 included $138 million of chargesrelated to the acquisition of ADC, including $80 million of net restructuring and other charges,$39 million of charges associated with the amortization of acquisition-related fair value adjustmentsprimarily related to acquired inventories and customer order backlog, and $19 million of acquisitionand integration costs. Segment results for fiscal 2011 also included additional net restructuring andother charges of $10 million. Excluding these items, operating income decreased in fiscal 2012 ascompared to fiscal 2011. The decrease was attributable to lower volume and, to a lesser degree, priceerosion, partially offset by improved manufacturing productivity.
Industrial Solutions
Fiscal
2013 2012 2011
($ in millions)
Net sales . . . . . . . . . . . . . . . . . . . . . . . . . . . . . . . . . . . . $3,007 $2,987 $3,144Operating income . . . . . . . . . . . . . . . . . . . . . . . . . . . . . . $ 359 $ 378 $ 477
Operating margin . . . . . . . . . . . . . . . . . . . . . . . . . . . . 11.9% 12.7% 15.2%
28
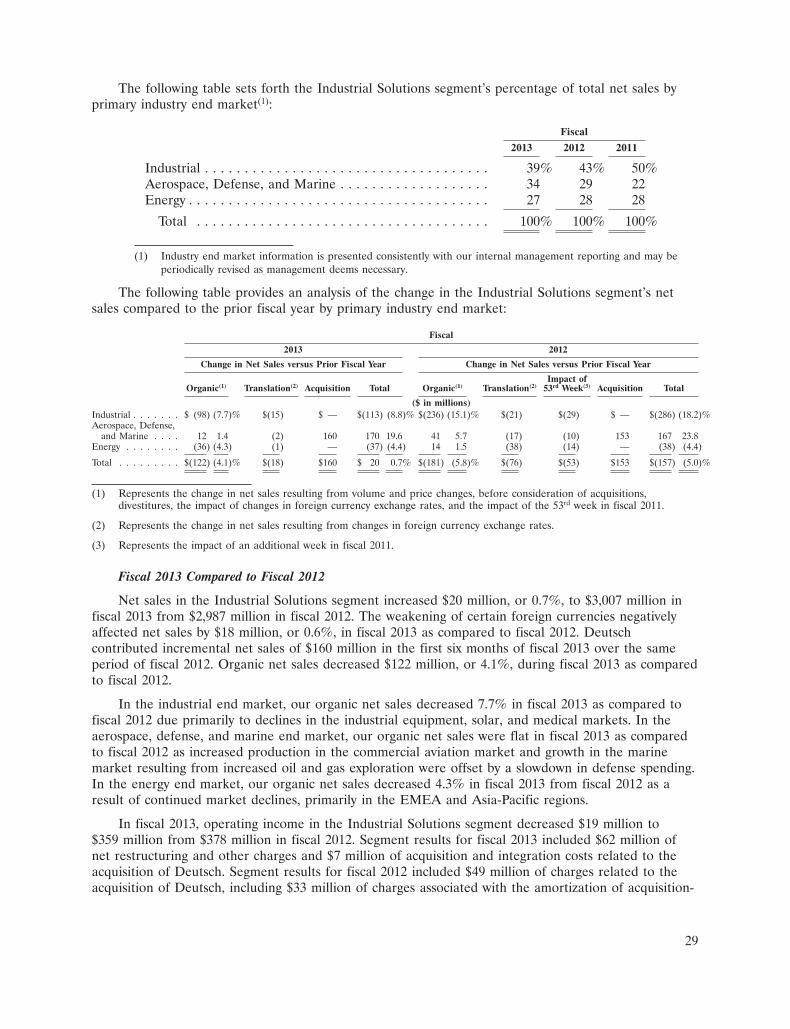
The following table sets forth the Industrial Solutions segment’s percentage of total net sales byprimary industry end market(1):
Fiscal
2013 2012 2011
Industrial . . . . . . . . . . . . . . . . . . . . . . . . . . . . . . . . . . . . 39% 43% 50%Aerospace, Defense, and Marine . . . . . . . . . . . . . . . . . . . 34 29 22Energy . . . . . . . . . . . . . . . . . . . . . . . . . . . . . . . . . . . . . . 27 28 28
Total . . . . . . . . . . . . . . . . . . . . . . . . . . . . . . . . . . . . . 100% 100% 100%
(1) Industry end market information is presented consistently with our internal management reporting and may beperiodically revised as management deems necessary.
The following table provides an analysis of the change in the Industrial Solutions segment’s netsales compared to the prior fiscal year by primary industry end market:
Fiscal
2013 2012
Change in Net Sales versus Prior Fiscal Year Change in Net Sales versus Prior Fiscal Year
Impact ofOrganic(1) Translation(2) Acquisition Total Organic(1) Translation(2) 53rd Week(3) Acquisition Total
($ in millions)Industrial . . . . . . . $ (98) (7.7)% $(15) $ — $(113) (8.8)% $(236) (15.1)% $(21) $(29) $ — $(286) (18.2)%Aerospace, Defense,
and Marine . . . . 12 1.4 (2) 160 170 19.6 41 5.7 (17) (10) 153 167 23.8Energy . . . . . . . . (36) (4.3) (1) — (37) (4.4) 14 1.5 (38) (14) — (38) (4.4)
Total . . . . . . . . . $(122) (4.1)% $(18) $160 $ 20 0.7% $(181) (5.8)% $(76) $(53) $153 $(157) (5.0)%
(1) Represents the change in net sales resulting from volume and price changes, before consideration of acquisitions,divestitures, the impact of changes in foreign currency exchange rates, and the impact of the 53rd week in fiscal 2011.
(2) Represents the change in net sales resulting from changes in foreign currency exchange rates.
(3) Represents the impact of an additional week in fiscal 2011.
Fiscal 2013 Compared to Fiscal 2012
Net sales in the Industrial Solutions segment increased $20 million, or 0.7%, to $3,007 million infiscal 2013 from $2,987 million in fiscal 2012. The weakening of certain foreign currencies negativelyaffected net sales by $18 million, or 0.6%, in fiscal 2013 as compared to fiscal 2012. Deutschcontributed incremental net sales of $160 million in the first six months of fiscal 2013 over the sameperiod of fiscal 2012. Organic net sales decreased $122 million, or 4.1%, during fiscal 2013 as comparedto fiscal 2012.
In the industrial end market, our organic net sales decreased 7.7% in fiscal 2013 as compared tofiscal 2012 due primarily to declines in the industrial equipment, solar, and medical markets. In theaerospace, defense, and marine end market, our organic net sales were flat in fiscal 2013 as comparedto fiscal 2012 as increased production in the commercial aviation market and growth in the marinemarket resulting from increased oil and gas exploration were offset by a slowdown in defense spending.In the energy end market, our organic net sales decreased 4.3% in fiscal 2013 from fiscal 2012 as aresult of continued market declines, primarily in the EMEA and Asia-Pacific regions.
In fiscal 2013, operating income in the Industrial Solutions segment decreased $19 million to$359 million from $378 million in fiscal 2012. Segment results for fiscal 2013 included $62 million ofnet restructuring and other charges and $7 million of acquisition and integration costs related to theacquisition of Deutsch. Segment results for fiscal 2012 included $49 million of charges related to theacquisition of Deutsch, including $33 million of charges associated with the amortization of acquisition-
29

related fair value adjustments primarily related to acquired inventories and customer order backlog,$11 million of acquisition and integration costs, and $5 million of net restructuring and other charges.Segment results also included $23 million of additional net restructuring and other charges in fiscal2012. Excluding these items, operating income decreased in fiscal 2013 as compared to fiscal 2012. Thedecrease was due to lower volume and, to a lesser degree, price erosion, partially offset by improvedmanufacturing productivity and benefits attributable to Deutsch.
Fiscal 2012 Compared to Fiscal 2011
In fiscal 2012, net sales in the Industrial Solutions segment decreased $157 million, or 5.0%, to$2,987 million from $3,144 million in fiscal 2011. The weakening of certain foreign currencies negativelyaffected net sales by $76 million, or 2.4%, in fiscal 2012 as compared to fiscal 2011. Fiscal 2011included an additional week which contributed approximately $53 million in net sales. Deutschcontributed net sales of $153 million in fiscal 2012. Organic net sales decreased $181 million, or 5.8%,during fiscal 2012 as compared to fiscal 2011. We estimate that the earthquake in Japan negativelyimpacted our sales in the Industrial Solutions segment by $11 million in fiscal 2011.
In the industrial end market, our organic net sales decreased 15.1% in fiscal 2012 from fiscal 2011due to market weakness across all regions. In the aerospace, defense, and marine end market, ourorganic net sales increased 5.7% in fiscal 2012 as compared to fiscal 2011. The increase wasattributable to increased production in the commercial aviation market, and growth in the marinemarket resulting from share gains and increased oil and gas exploration driven by increased crude oilprices. In the energy end market, our organic net sales were flat in fiscal 2012 as compared to fiscal2011 as growth in the Americas and Asia-Pacific regions was offset by declines in the EMEA region.
Operating income in the Industrial Solutions segment decreased $99 million to $378 million infiscal 2012 from $477 million in fiscal 2011. As discussed above, segment results for fiscal 2012 included$49 million of charges related to the acquisition of Deutsch. Segment results also included $23 millionand $24 million of additional net restructuring and other charges in fiscal 2012 and 2011, respectively.Excluding these items, operating income decreased in fiscal 2012 as compared to fiscal 2011. Thedecrease resulted from lower volume and, to a lesser degree, increased materials costs, partially offsetby improved manufacturing productivity and pricing actions.
Consumer Solutions
Fiscal
2013 2012 2011
($ in millions)
Net sales . . . . . . . . . . . . . . . . . . . . . . . . . . . . . . . . . . . . $1,722 $1,857 $2,051Operating income . . . . . . . . . . . . . . . . . . . . . . . . . . . . . . $ 89 $ 139 $ 181
Operating margin . . . . . . . . . . . . . . . . . . . . . . . . . . . . 5.2% 7.5% 8.8%
The following table sets forth the Consumer Solutions segment’s percentage of total net sales byprimary industry end market(1):
Fiscal
2013 2012 2011
Consumer Devices . . . . . . . . . . . . . . . . . . . . . . . . . . . . . 59% 60% 59%Appliances . . . . . . . . . . . . . . . . . . . . . . . . . . . . . . . . . . . 41 40 41
Total . . . . . . . . . . . . . . . . . . . . . . . . . . . . . . . . . . . . . 100% 100% 100%
(1) Industry end market information is presented consistently with our internal management reporting and may beperiodically revised as management deems necessary.
30

The following table provides an analysis of the change in the Consumer Solutions segment’s netsales compared to the prior fiscal year by primary industry end market:
Fiscal
2013 2012
Change in Net Sales versus Prior Fiscal Year Change in Net Sales versus Prior Fiscal Year
Impact ofOrganic(1) Translation(2) Total Organic(1) Translation(2) 53rd Week(3) Total
($ in millions)Consumer Devices . . . $ (86) (7.6)% $(22) $(108) (9.7)% $ (75) (6.2)% $ 1 $(23) $ (97) (8.0)%Appliances . . . . . . . (22) (3.0) (5) (27) (3.7) (67) (8.2) (16) (14) (97) (11.6)
Total . . . . . . . . . . . $(108) (5.8)% $(27) $(135) (7.3)% $(142) (7.0)% $(15) $(37) $(194) (9.5)%
(1) Represents the change in net sales resulting from volume and price changes, before consideration of acquisitions,divestitures, the impact of changes in foreign currency exchange rates, and the impact of the 53rd week in fiscal 2011.
(2) Represents the change in net sales resulting from changes in foreign currency exchange rates.
(3) Represents the impact of an additional week in fiscal 2011.
Fiscal 2013 Compared to Fiscal 2012
Net sales in the Consumer Solutions segment decreased $135 million, or 7.3%, to $1,722 million infiscal 2013 from $1,857 million in fiscal 2012. The weakening of certain foreign currencies negativelyaffected net sales by $27 million, or 1.5%, in fiscal 2013 as compared to fiscal 2012. Organic net salesdecreased $108 million, or 5.8%, during fiscal 2013 as compared to fiscal 2012.
In the consumer devices end market, our organic net sales decreased 7.6% in fiscal 2013 fromfiscal 2012 due to continuing weakness in the personal computer market, partially offset by increaseddemand in the mobile phone and tablet computer markets. In the appliances end market, our organicnet sales decreased 3.0% in fiscal 2013 as compared to fiscal 2012 due primarily to declines in theEMEA and Americas regions.
In fiscal 2013, operating income in the Consumer Solutions segment decreased $50 million to$89 million from $139 million in fiscal 2012. Segment results included net restructuring and othercharges of $86 million and $23 million in fiscal 2013 and 2012, respectively. Excluding these items,operating income increased in fiscal 2013 as compared to fiscal 2012. The increase resulted fromimproved manufacturing productivity, partially offset by price erosion and lower volume.
Fiscal 2012 Compared to Fiscal 2011
In fiscal 2012, net sales in the Consumer Solutions segment decreased $194 million, or 9.5%, to$1,857 million from $2,051 million in fiscal 2011. The weakening of certain foreign currencies negativelyaffected net sales by $15 million, or 0.7%, in fiscal 2012 as compared to fiscal 2011. Fiscal 2011included an additional week which contributed approximately $37 million in net sales. Organic net salesdecreased $142 million, or 7.0%, during fiscal 2012 as compared to fiscal 2011. We estimate that theearthquake in Japan negatively impacted our sales in the Consumer Solutions segment by $34 millionin fiscal 2011.
In the consumer devices end market, our organic net sales decreased 6.2% in fiscal 2012 ascompared to fiscal 2011 as a result of weaker demand in the personal computer and consumerelectronics markets, partially offset by strong demand in the tablet computer market and increaseddemand in the mobile phone market. In the appliances end market, our organic net sales decreased8.2% in fiscal 2012 from fiscal 2011 due primarily to weakness in the Asia-Pacific and EMEA regions,resulting from lower demand and inventory reductions in the supply chain, partially offset by growth inthe Americas region.
31
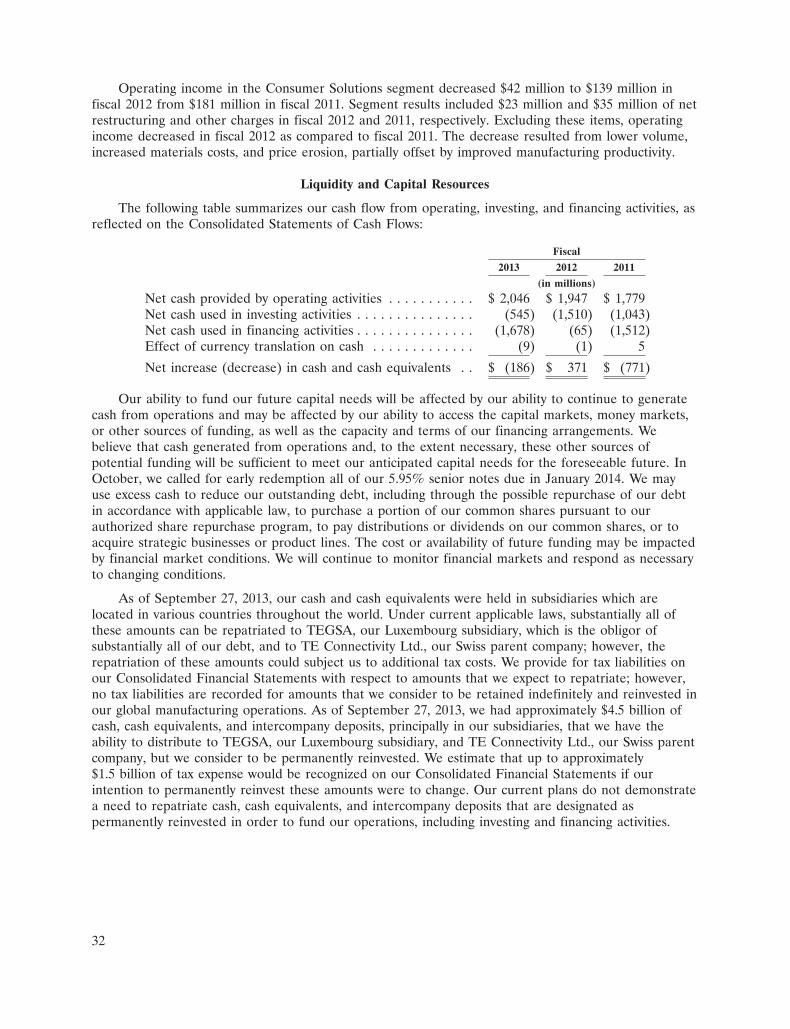
Operating income in the Consumer Solutions segment decreased $42 million to $139 million infiscal 2012 from $181 million in fiscal 2011. Segment results included $23 million and $35 million of netrestructuring and other charges in fiscal 2012 and 2011, respectively. Excluding these items, operatingincome decreased in fiscal 2012 as compared to fiscal 2011. The decrease resulted from lower volume,increased materials costs, and price erosion, partially offset by improved manufacturing productivity.
Liquidity and Capital Resources
The following table summarizes our cash flow from operating, investing, and financing activities, asreflected on the Consolidated Statements of Cash Flows:
Fiscal
2013 2012 2011
(in millions)
Net cash provided by operating activities . . . . . . . . . . . $ 2,046 $ 1,947 $ 1,779Net cash used in investing activities . . . . . . . . . . . . . . . (545) (1,510) (1,043)Net cash used in financing activities . . . . . . . . . . . . . . . (1,678) (65) (1,512)Effect of currency translation on cash . . . . . . . . . . . . . (9) (1) 5
Net increase (decrease) in cash and cash equivalents . . $ (186) $ 371 $ (771)
Our ability to fund our future capital needs will be affected by our ability to continue to generatecash from operations and may be affected by our ability to access the capital markets, money markets,or other sources of funding, as well as the capacity and terms of our financing arrangements. Webelieve that cash generated from operations and, to the extent necessary, these other sources ofpotential funding will be sufficient to meet our anticipated capital needs for the foreseeable future. InOctober, we called for early redemption all of our 5.95% senior notes due in January 2014. We mayuse excess cash to reduce our outstanding debt, including through the possible repurchase of our debtin accordance with applicable law, to purchase a portion of our common shares pursuant to ourauthorized share repurchase program, to pay distributions or dividends on our common shares, or toacquire strategic businesses or product lines. The cost or availability of future funding may be impactedby financial market conditions. We will continue to monitor financial markets and respond as necessaryto changing conditions.
As of September 27, 2013, our cash and cash equivalents were held in subsidiaries which arelocated in various countries throughout the world. Under current applicable laws, substantially all ofthese amounts can be repatriated to TEGSA, our Luxembourg subsidiary, which is the obligor ofsubstantially all of our debt, and to TE Connectivity Ltd., our Swiss parent company; however, therepatriation of these amounts could subject us to additional tax costs. We provide for tax liabilities onour Consolidated Financial Statements with respect to amounts that we expect to repatriate; however,no tax liabilities are recorded for amounts that we consider to be retained indefinitely and reinvested inour global manufacturing operations. As of September 27, 2013, we had approximately $4.5 billion ofcash, cash equivalents, and intercompany deposits, principally in our subsidiaries, that we have theability to distribute to TEGSA, our Luxembourg subsidiary, and TE Connectivity Ltd., our Swiss parentcompany, but we consider to be permanently reinvested. We estimate that up to approximately$1.5 billion of tax expense would be recognized on our Consolidated Financial Statements if ourintention to permanently reinvest these amounts were to change. Our current plans do not demonstratea need to repatriate cash, cash equivalents, and intercompany deposits that are designated aspermanently reinvested in order to fund our operations, including investing and financing activities.
32

Cash Flows from Operating Activities
Net cash provided by continuing operating activities was $2,048 million in fiscal 2013 as comparedto $1,888 million in fiscal 2012. The increase of $160 million in fiscal 2013 over fiscal 2012 resultedprimarily from higher income levels.
Net cash provided by continuing operating activities was $1,888 million in fiscal 2012 as comparedto $1,722 million in fiscal 2011. The increase of $166 million in fiscal 2012 over fiscal 2011 resultedprimarily from improved working capital, partially offset by lower income levels.
Pension and postretirement benefit contributions in fiscal 2013, 2012, and 2011 were $98 million,$98 million, and $90 million, respectively. We expect pension and postretirement benefit contributionsto be $90 million in fiscal 2014, before consideration of any voluntary contributions. There were novoluntary pension contributions in fiscal 2013, 2012, and 2011.
The amount of income taxes paid, net of refunds, during fiscal 2013, 2012, and 2011 was$312 million, $290 million, and $299 million, respectively.
In fiscal 2013 and 2012, cash payments included $67 million and $70 million, respectively, for taxdeficiencies related to U.S. tax matters for the years 1997 through 2000. Also during fiscal 2013 and2012, we received net reimbursements of $39 million and $51 million, respectively, from TycoInternational and Covidien pursuant to their indemnifications for pre-separation U.S. tax matters. Netcash payments related to pre-separation tax matters were $129 million in fiscal 2011. We expect tomake net cash payments related to pre-separation tax matters of approximately $182 million over thenext twelve months. These amounts include payments in which we are the primary obligor to the taxingauthorities and for which we expect a portion to be reimbursed by Tyco International and Covidienunder the Tax Sharing Agreement as well as indemnification payments to Tyco International andCovidien under the Tax Sharing Agreement for tax matters where they are the primary obligor to thetaxing authorities. See Note 13 to the Consolidated Financial Statements for additional informationrelated to pre-separation tax matters.
In addition to net cash provided by operating activities, we use free cash flow, a non-GAAPfinancial measure, as a useful measure of our ability to generate cash. Free cash flow was$1,500 million in fiscal 2013 as compared to $1,434 million in fiscal 2012 and $1,342 million in fiscal2011. The increase in free cash flow in fiscal 2013 as compared to fiscal 2012 was primarily driven byhigher income levels, partially offset by higher capital expenditures as reduced by proceeds from thesale of property, plant, and equipment. The increase in free cash flow in fiscal 2012 as compared tofiscal 2011 was primarily driven by improved working capital, as adjusted for net payments forpre-separation tax matters and certain Deutsch acquisition-related payments totaling $37 million,partially offset by lower income levels.
33
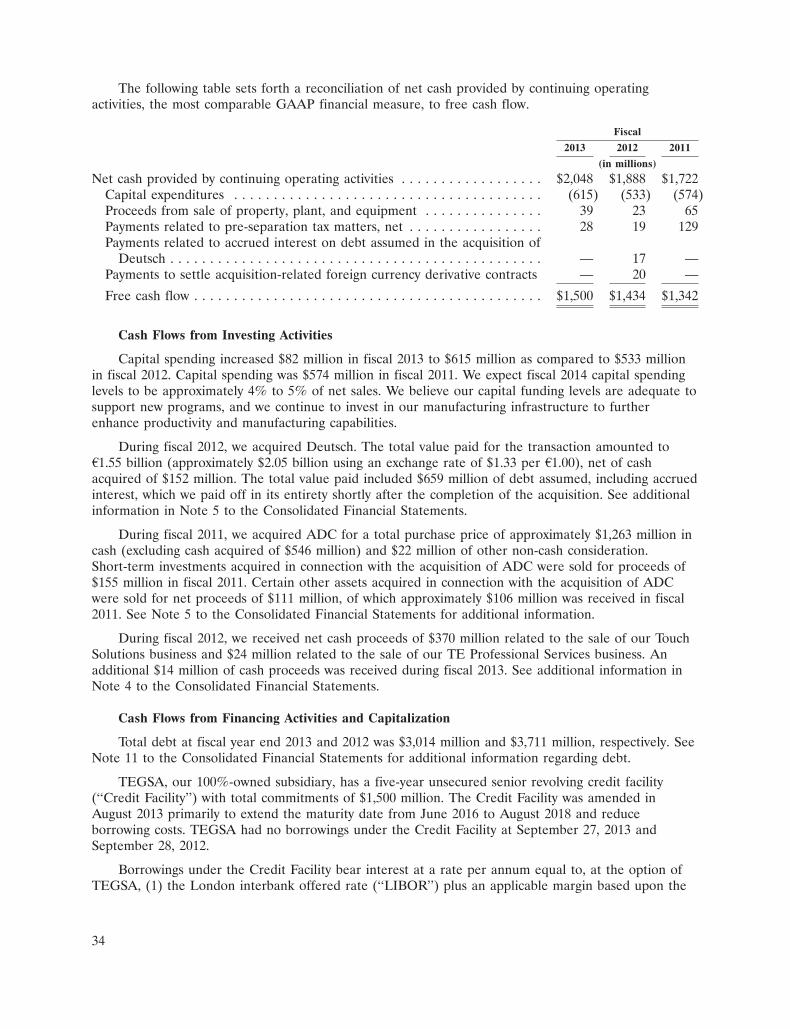
The following table sets forth a reconciliation of net cash provided by continuing operatingactivities, the most comparable GAAP financial measure, to free cash flow.
Fiscal
2013 2012 2011
(in millions)
Net cash provided by continuing operating activities . . . . . . . . . . . . . . . . . . $2,048 $1,888 $1,722Capital expenditures . . . . . . . . . . . . . . . . . . . . . . . . . . . . . . . . . . . . . . . (615) (533) (574)Proceeds from sale of property, plant, and equipment . . . . . . . . . . . . . . . 39 23 65Payments related to pre-separation tax matters, net . . . . . . . . . . . . . . . . . 28 19 129Payments related to accrued interest on debt assumed in the acquisition of
Deutsch . . . . . . . . . . . . . . . . . . . . . . . . . . . . . . . . . . . . . . . . . . . . . . . — 17 —Payments to settle acquisition-related foreign currency derivative contracts — 20 —
Free cash flow . . . . . . . . . . . . . . . . . . . . . . . . . . . . . . . . . . . . . . . . . . . . $1,500 $1,434 $1,342
Cash Flows from Investing Activities
Capital spending increased $82 million in fiscal 2013 to $615 million as compared to $533 millionin fiscal 2012. Capital spending was $574 million in fiscal 2011. We expect fiscal 2014 capital spendinglevels to be approximately 4% to 5% of net sales. We believe our capital funding levels are adequate tosupport new programs, and we continue to invest in our manufacturing infrastructure to furtherenhance productivity and manufacturing capabilities.
During fiscal 2012, we acquired Deutsch. The total value paid for the transaction amounted toA1.55 billion (approximately $2.05 billion using an exchange rate of $1.33 per A1.00), net of cashacquired of $152 million. The total value paid included $659 million of debt assumed, including accruedinterest, which we paid off in its entirety shortly after the completion of the acquisition. See additionalinformation in Note 5 to the Consolidated Financial Statements.
During fiscal 2011, we acquired ADC for a total purchase price of approximately $1,263 million incash (excluding cash acquired of $546 million) and $22 million of other non-cash consideration.Short-term investments acquired in connection with the acquisition of ADC were sold for proceeds of$155 million in fiscal 2011. Certain other assets acquired in connection with the acquisition of ADCwere sold for net proceeds of $111 million, of which approximately $106 million was received in fiscal2011. See Note 5 to the Consolidated Financial Statements for additional information.
During fiscal 2012, we received net cash proceeds of $370 million related to the sale of our TouchSolutions business and $24 million related to the sale of our TE Professional Services business. Anadditional $14 million of cash proceeds was received during fiscal 2013. See additional information inNote 4 to the Consolidated Financial Statements.
Cash Flows from Financing Activities and Capitalization
Total debt at fiscal year end 2013 and 2012 was $3,014 million and $3,711 million, respectively. SeeNote 11 to the Consolidated Financial Statements for additional information regarding debt.
TEGSA, our 100%-owned subsidiary, has a five-year unsecured senior revolving credit facility(‘‘Credit Facility’’) with total commitments of $1,500 million. The Credit Facility was amended inAugust 2013 primarily to extend the maturity date from June 2016 to August 2018 and reduceborrowing costs. TEGSA had no borrowings under the Credit Facility at September 27, 2013 andSeptember 28, 2012.
Borrowings under the Credit Facility bear interest at a rate per annum equal to, at the option ofTEGSA, (1) the London interbank offered rate (‘‘LIBOR’’) plus an applicable margin based upon the
34
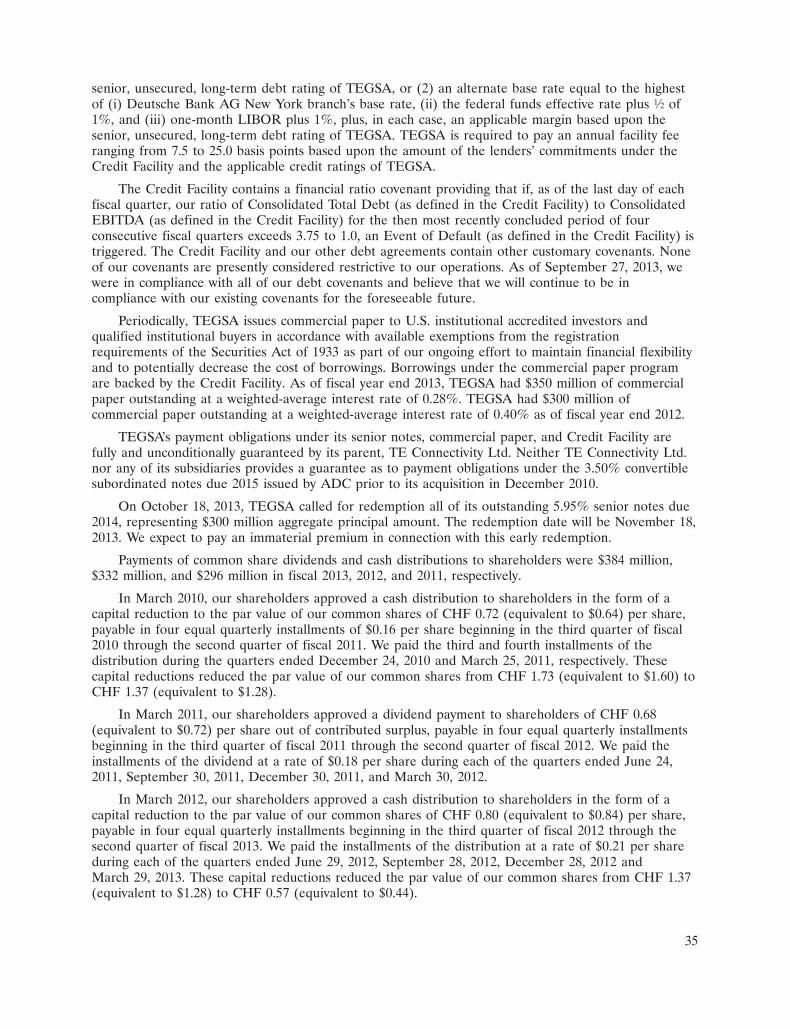
senior, unsecured, long-term debt rating of TEGSA, or (2) an alternate base rate equal to the highestof (i) Deutsche Bank AG New York branch’s base rate, (ii) the federal funds effective rate plus 1⁄2 of1%, and (iii) one-month LIBOR plus 1%, plus, in each case, an applicable margin based upon thesenior, unsecured, long-term debt rating of TEGSA. TEGSA is required to pay an annual facility feeranging from 7.5 to 25.0 basis points based upon the amount of the lenders’ commitments under theCredit Facility and the applicable credit ratings of TEGSA.
The Credit Facility contains a financial ratio covenant providing that if, as of the last day of eachfiscal quarter, our ratio of Consolidated Total Debt (as defined in the Credit Facility) to ConsolidatedEBITDA (as defined in the Credit Facility) for the then most recently concluded period of fourconsecutive fiscal quarters exceeds 3.75 to 1.0, an Event of Default (as defined in the Credit Facility) istriggered. The Credit Facility and our other debt agreements contain other customary covenants. Noneof our covenants are presently considered restrictive to our operations. As of September 27, 2013, wewere in compliance with all of our debt covenants and believe that we will continue to be incompliance with our existing covenants for the foreseeable future.
Periodically, TEGSA issues commercial paper to U.S. institutional accredited investors andqualified institutional buyers in accordance with available exemptions from the registrationrequirements of the Securities Act of 1933 as part of our ongoing effort to maintain financial flexibilityand to potentially decrease the cost of borrowings. Borrowings under the commercial paper programare backed by the Credit Facility. As of fiscal year end 2013, TEGSA had $350 million of commercialpaper outstanding at a weighted-average interest rate of 0.28%. TEGSA had $300 million ofcommercial paper outstanding at a weighted-average interest rate of 0.40% as of fiscal year end 2012.
TEGSA’s payment obligations under its senior notes, commercial paper, and Credit Facility arefully and unconditionally guaranteed by its parent, TE Connectivity Ltd. Neither TE Connectivity Ltd.nor any of its subsidiaries provides a guarantee as to payment obligations under the 3.50% convertiblesubordinated notes due 2015 issued by ADC prior to its acquisition in December 2010.
On October 18, 2013, TEGSA called for redemption all of its outstanding 5.95% senior notes due2014, representing $300 million aggregate principal amount. The redemption date will be November 18,2013. We expect to pay an immaterial premium in connection with this early redemption.
Payments of common share dividends and cash distributions to shareholders were $384 million,$332 million, and $296 million in fiscal 2013, 2012, and 2011, respectively.
In March 2010, our shareholders approved a cash distribution to shareholders in the form of acapital reduction to the par value of our common shares of CHF 0.72 (equivalent to $0.64) per share,payable in four equal quarterly installments of $0.16 per share beginning in the third quarter of fiscal2010 through the second quarter of fiscal 2011. We paid the third and fourth installments of thedistribution during the quarters ended December 24, 2010 and March 25, 2011, respectively. Thesecapital reductions reduced the par value of our common shares from CHF 1.73 (equivalent to $1.60) toCHF 1.37 (equivalent to $1.28).
In March 2011, our shareholders approved a dividend payment to shareholders of CHF 0.68(equivalent to $0.72) per share out of contributed surplus, payable in four equal quarterly installmentsbeginning in the third quarter of fiscal 2011 through the second quarter of fiscal 2012. We paid theinstallments of the dividend at a rate of $0.18 per share during each of the quarters ended June 24,2011, September 30, 2011, December 30, 2011, and March 30, 2012.
In March 2012, our shareholders approved a cash distribution to shareholders in the form of acapital reduction to the par value of our common shares of CHF 0.80 (equivalent to $0.84) per share,payable in four equal quarterly installments beginning in the third quarter of fiscal 2012 through thesecond quarter of fiscal 2013. We paid the installments of the distribution at a rate of $0.21 per shareduring each of the quarters ended June 29, 2012, September 28, 2012, December 28, 2012 andMarch 29, 2013. These capital reductions reduced the par value of our common shares from CHF 1.37(equivalent to $1.28) to CHF 0.57 (equivalent to $0.44).
35

In March 2013, our shareholders approved a dividend payment to shareholders of CHF 0.96(equivalent to $1.00) per share out of contributed surplus, payable in four equal quarterly installmentsbeginning in the third quarter of fiscal 2013 through the second quarter of fiscal 2014. We paid the firstand second installments of the dividend at a rate of $0.25 per share during each of the quarters endedJune 28, 2013 and September 27, 2013.
Future dividends on our common shares or reductions of registered share capital for distribution toshareholders, if any, must be approved by our shareholders. In exercising their discretion to recommendto the shareholders that such dividends or distributions be approved, our board of directors willconsider our results of operations, cash requirements and surplus, financial condition, statutoryrequirements of applicable law, contractual restrictions, and other factors that they may deem relevant.
During fiscal 2013, 2012, and 2011, we repurchased approximately 20 million of our commonshares for $829 million, approximately 6 million of our common shares for $194 million, andapproximately 25 million of our common shares for $867 million, respectively. At September 27, 2013,we had $478 million of availability remaining under our share repurchase authorization. On October 29,2013, our board of directors authorized an increase of $1 billion in the share repurchase program.
Commitments and Contingencies
The following table provides a summary of our contractual obligations and commitments for debt,minimum lease payment obligations under non-cancelable leases, and other obligations at fiscal yearend 2013:
Payments Due by Fiscal Year
Total 2014 2015 2016 2017 2018 Thereafter
(in millions)
Long-term debt, including current maturities . . . . . . . . $3,014 $ 711 $339 $ — $ — $727 $1,237Interest on long-term debt(1) . . . . . . . . . . . . . . . . . . . . 1,304 128 115 110 110 87 754Operating leases . . . . . . . . . . . . . . . . . . . . . . . . . . . . 420 125 96 58 41 30 70Purchase obligations(2) . . . . . . . . . . . . . . . . . . . . . . . . 226 226 — — — — —
Total contractual cash obligations(3)(4)(5) . . . . . . . . . . . . $4,964 $1,190 $550 $168 $151 $844 $2,061
(1) Interest payments exclude the impact of our interest rate swaps.
(2) Purchase obligations consist of commitments for purchases of goods and services.
(3) The table above does not reflect unrecognized income tax benefits of $1,620 million and related accrued interest andpenalties of $1,018 million, the timing of which is uncertain. See Note 17 to the Consolidated Financial Statements foradditional information regarding unrecognized income tax benefits, interest, and penalties.
(4) The table above does not reflect pension and postretirement benefit obligations to certain employees and formeremployees. We are obligated to make contributions to our pension plans and postretirement benefit plans; however, we areunable to determine the amount of plan contributions due to the inherent uncertainties of obligations of this type, includingtiming, interest rate charges, investment performance, and amounts of benefit payments. We expect to contribute$90 million to pension and postretirement benefit plans in fiscal 2014, before consideration of voluntary contributions.These plans and our estimates of future contributions and benefit payments are more fully described in Note 16 to theConsolidated Financial Statements.
(5) Other long-term liabilities of $393 million are excluded from the table above as we are unable to estimate the timing ofpayment for these items.
Income Tax Matters
In connection with our separation from Tyco International in 2007, we entered into a Tax SharingAgreement that generally governs our, Tyco International’s, and Covidien’s respective rights,responsibilities, and obligations after the distribution with respect to taxes, including ordinary course of
36
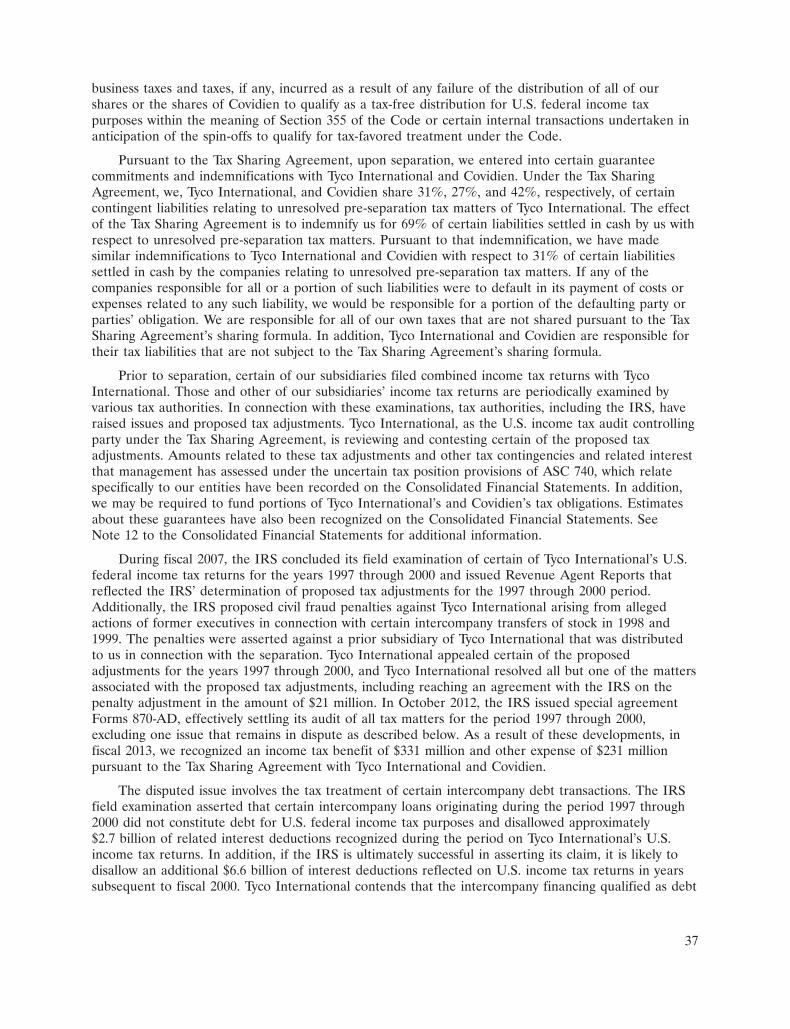
business taxes and taxes, if any, incurred as a result of any failure of the distribution of all of ourshares or the shares of Covidien to qualify as a tax-free distribution for U.S. federal income taxpurposes within the meaning of Section 355 of the Code or certain internal transactions undertaken inanticipation of the spin-offs to qualify for tax-favored treatment under the Code.
Pursuant to the Tax Sharing Agreement, upon separation, we entered into certain guaranteecommitments and indemnifications with Tyco International and Covidien. Under the Tax SharingAgreement, we, Tyco International, and Covidien share 31%, 27%, and 42%, respectively, of certaincontingent liabilities relating to unresolved pre-separation tax matters of Tyco International. The effectof the Tax Sharing Agreement is to indemnify us for 69% of certain liabilities settled in cash by us withrespect to unresolved pre-separation tax matters. Pursuant to that indemnification, we have madesimilar indemnifications to Tyco International and Covidien with respect to 31% of certain liabilitiessettled in cash by the companies relating to unresolved pre-separation tax matters. If any of thecompanies responsible for all or a portion of such liabilities were to default in its payment of costs orexpenses related to any such liability, we would be responsible for a portion of the defaulting party orparties’ obligation. We are responsible for all of our own taxes that are not shared pursuant to the TaxSharing Agreement’s sharing formula. In addition, Tyco International and Covidien are responsible fortheir tax liabilities that are not subject to the Tax Sharing Agreement’s sharing formula.
Prior to separation, certain of our subsidiaries filed combined income tax returns with TycoInternational. Those and other of our subsidiaries’ income tax returns are periodically examined byvarious tax authorities. In connection with these examinations, tax authorities, including the IRS, haveraised issues and proposed tax adjustments. Tyco International, as the U.S. income tax audit controllingparty under the Tax Sharing Agreement, is reviewing and contesting certain of the proposed taxadjustments. Amounts related to these tax adjustments and other tax contingencies and related interestthat management has assessed under the uncertain tax position provisions of ASC 740, which relatespecifically to our entities have been recorded on the Consolidated Financial Statements. In addition,we may be required to fund portions of Tyco International’s and Covidien’s tax obligations. Estimatesabout these guarantees have also been recognized on the Consolidated Financial Statements. SeeNote 12 to the Consolidated Financial Statements for additional information.
During fiscal 2007, the IRS concluded its field examination of certain of Tyco International’s U.S.federal income tax returns for the years 1997 through 2000 and issued Revenue Agent Reports thatreflected the IRS’ determination of proposed tax adjustments for the 1997 through 2000 period.Additionally, the IRS proposed civil fraud penalties against Tyco International arising from allegedactions of former executives in connection with certain intercompany transfers of stock in 1998 and1999. The penalties were asserted against a prior subsidiary of Tyco International that was distributedto us in connection with the separation. Tyco International appealed certain of the proposedadjustments for the years 1997 through 2000, and Tyco International resolved all but one of the mattersassociated with the proposed tax adjustments, including reaching an agreement with the IRS on thepenalty adjustment in the amount of $21 million. In October 2012, the IRS issued special agreementForms 870-AD, effectively settling its audit of all tax matters for the period 1997 through 2000,excluding one issue that remains in dispute as described below. As a result of these developments, infiscal 2013, we recognized an income tax benefit of $331 million and other expense of $231 millionpursuant to the Tax Sharing Agreement with Tyco International and Covidien.
The disputed issue involves the tax treatment of certain intercompany debt transactions. The IRSfield examination asserted that certain intercompany loans originating during the period 1997 through2000 did not constitute debt for U.S. federal income tax purposes and disallowed approximately$2.7 billion of related interest deductions recognized during the period on Tyco International’s U.S.income tax returns. In addition, if the IRS is ultimately successful in asserting its claim, it is likely todisallow an additional $6.6 billion of interest deductions reflected on U.S. income tax returns in yearssubsequent to fiscal 2000. Tyco International contends that the intercompany financing qualified as debt
37

for U.S. tax purposes and that the interest deductions reflected on the income tax returns areappropriate. The IRS and Tyco International were unable to resolve this matter through the IRSappeals process. On June 20, 2013, Tyco International advised us that it had received Notices ofDeficiency from the IRS for certain former U.S. subsidiaries of Tyco International increasing taxableincome by approximately $2.9 billion in connection with the audit of Tyco International’s fiscal years1997 through 2000. The Notices of Deficiency assert that Tyco International owes additional taxestotaling $778 million, associated penalties of $154 million, and withholding taxes of $105 million. Inaddition, Tyco International received Final Partnership Administrative Adjustments for certain U.S.partnerships owned by former U.S. subsidiaries with respect to which Tyco International estimates anadditional tax deficiency of approximately $30 million will be asserted. The amounts asserted by theIRS exclude any applicable deficiency interest, and do not reflect any impact to subsequent period taxliabilities in the event that the IRS were to prevail on some or all of its assertions. We understand thatTyco International strongly disagrees with the IRS position and has filed petitions in the U.S. Tax Courtcontesting the IRS’ proposed adjustments. Tyco International has advised us that it believes there aremeritorious defenses for the tax filings in question and that the IRS positions with regard to thesematters are inconsistent with the applicable tax laws and existing Treasury regulations.
Resolution of this matter in the U.S. Tax Court could take several years and no payments to theIRS with respect to these matters would be required until the matter is fully and finally resolved. Inaccordance with the terms of a tax sharing agreement, we, Tyco International, and Covidien wouldshare 31%, 27%, and 42%, respectively, of any payments made in connection with these matters.
However, as the ultimate outcome is uncertain and if the IRS were to prevail on its assertions, ourshare of the assessed tax, deficiency interest, and applicable withholding taxes and penalties could havea material adverse impact on our results of operations, financial position, and cash flows. We havereviewed the Notices of Deficiency, the relevant facts surrounding the intercompany debt transactions,relevant tax regulations, and applicable case law, and we continue to believe that we are appropriatelyreserved for this matter.
During fiscal 2013 and 2012, we made payments of $67 million and $70 million, respectively, fortax deficiencies related to undisputed tax adjustments for the years 1997 through 2000. Concurrent withremitting these payments, during fiscal 2013 and 2012, we were reimbursed $39 million and $51 million,respectively, from Tyco International and Covidien pursuant to their indemnifications for pre-separationtax matters.
During fiscal 2011, the IRS completed its field examination of certain Tyco International incometax returns for the years 2001 through 2004, issued Revenue Agent Reports which reflect the IRS’determination of proposed tax adjustments for the 2001 through 2004 period, and issued certain noticesof deficiency. As a result of the completion of fieldwork and the settlement of certain tax matters infiscal 2011, we recognized income tax benefits of $35 million and other expense of $14 million pursuantto the Tax Sharing Agreement. Also, in fiscal 2011, we made net cash payments of $154 million relatedto pre-separation deficiencies.
Tyco International’s income tax returns for the years 2001 through 2004 remain subject toadjustment by the IRS upon ultimate resolution of the disputed issue involving certain intercompanyloans originated during the period 1997 through 2000. The IRS commenced its audit of certain TycoInternational income tax returns for the years 2005 through 2007 in fiscal 2011, and it is ourunderstanding that fieldwork for this audit period is expected to be completed in fiscal 2014. Also,during fiscal 2012, the IRS commenced its audit of our income tax returns for the years 2008 through2010. We expect fieldwork for the 2008 through 2010 audit to conclude in fiscal 2014. Over the nexttwelve months, we expect to pay approximately $182 million, inclusive of related indemnificationpayments, in connection with pre-separation tax matters.
38

At September 27, 2013 and September 28, 2012, we have reflected $15 million and $71 million,respectively, of income tax liabilities related to the audits of Tyco International’s and our income taxreturns in accrued and other current liabilities as certain of these matters could be resolved within thenext twelve months.
We believe that the amounts recorded on our Consolidated Financial Statements relating to thematters discussed above are appropriate. However, the ultimate resolution is uncertain and could resultin a material impact to our results of operations, financial position, or cash flows.
Legal Proceedings
In the ordinary course of business, we are subject to various legal proceedings and claims,including patent infringement claims, product liability matters, employment disputes, disputes onagreements, other commercial disputes, environmental matters, antitrust claims, and tax matters,including non-income tax matters such as value added tax, sales and use tax, real estate tax, andtransfer tax. Management believes that these legal proceedings and claims likely will be resolved overan extended period of time. Although it is not feasible to predict the outcome of these proceedings,based upon our experience, current information, and applicable law, we do not expect that the outcomeof these proceedings, either individually or in the aggregate, will have a material effect on our resultsof operations, financial position, or cash flows. However, the proceedings discussed above in ‘‘IncomeTax Matters’’ could have a material effect on our results of operations, financial position, or cash flows.See ‘‘Part I. Item 3. Legal Proceedings’’ of our Annual Report on Form 10-K for the fiscal year endedSeptember 27, 2013 filed with the SEC and Note 13 to the Consolidated Financial Statements forfurther information regarding legal proceedings.
At September 27, 2013, we had a contingent purchase price commitment of $80 million related toour fiscal 2001 acquisition of Com-Net. This represents the maximum amount payable to the formershareholders of Com-Net only after the construction and installation of a communications system wascompleted for and approved by the State of Florida in accordance with guidelines set forth in thecontract. Under the terms of the purchase and sale agreement, we do not believe we have anyobligation to the sellers. However, the sellers have contested our position and initiated a lawsuit inJune 2006 in the Court of Common Pleas in Allegheny County, Pennsylvania, which is in the discoveryphase. A liability for this contingency has not been recorded on the Consolidated Financial Statementsas we do not believe that any payment is probable at this time.
Off-Balance Sheet Arrangements
In certain instances, we have guaranteed the performance of third parties and provided financialguarantees for uncompleted work and financial commitments. The terms of these guarantees vary withend dates ranging from fiscal 2014 through the completion of such transactions. The guarantees wouldbe triggered in the event of nonperformance, and the potential exposure for nonperformance under theguarantees would not have a material effect on our results of operations, financial position, or cashflows.
In disposing of assets or businesses, we often provide representations, warranties, and/orindemnities to cover various risks including unknown damage to assets, environmental risks involved inthe sale of real estate, liability for investigation and remediation of environmental contamination atwaste disposal sites and manufacturing facilities, and unidentified tax liabilities and legal fees related toperiods prior to disposition. We do not expect that these uncertainties will have a material adverseeffect on our results of operations, financial position, or cash flows.
At September 27, 2013, we had outstanding letters of credit and letters of guarantee in the amountof $376 million.
39
We have recorded liabilities for known indemnifications included as part of environmentalliabilities. See Note 13 to the Consolidated Financial Statements for a discussion of these liabilities.
In the normal course of business, we are liable for contract completion and product performance.In the opinion of management, such obligations will not significantly affect our results of operations,financial position, or cash flows.
Pursuant to the Tax Sharing Agreement, upon separation, we entered into certain guaranteecommitments and indemnifications with Tyco International and Covidien. Under the Tax SharingAgreement, we, Tyco International, and Covidien share 31%, 27%, and 42%, respectively, of certaincontingent liabilities relating to unresolved pre-separation tax matters of Tyco International. The effectof the Tax Sharing Agreement is to indemnify us for 69% of certain liabilities settled in cash by us withrespect to unresolved pre-separation tax matters. Pursuant to that indemnification, we have madesimilar indemnifications to Tyco International and Covidien with respect to 31% of certain liabilitiessettled in cash by the companies relating to unresolved pre-separation tax matters. If any of thecompanies responsible for all or a portion of such liabilities were to default in its payment of costs orexpenses related to any such liability, we would be responsible for a portion of the defaulting party orparties’ obligation. These arrangements have been valued upon our separation from Tyco Internationalin accordance with ASC 460 and, accordingly, liabilities amounting to $223 million were recorded onthe Consolidated Balance Sheet at September 27, 2013. See Notes 12 and 13 to the ConsolidatedFinancial Statements for additional information.
Critical Accounting Policies and Estimates
The preparation of the Consolidated Financial Statements in conformity with GAAP requiresmanagement to make estimates and assumptions that affect the reported amounts of assets andliabilities, the disclosure of contingent assets and liabilities, and the reported amounts of revenue andexpenses. Our significant accounting policies are summarized in Note 2 to the Consolidated FinancialStatements. The following accounting policies are considered to be the most critical as they requiresignificant judgments and assumptions that involve inherent risks and uncertainties. Management’sestimates are based on the relevant information available at the end of each period.
Revenue Recognition
Our revenue recognition policies are in accordance with ASC 605, Revenue Recognition. Ourrevenues are generated principally from the sale of our products. Revenue from the sale of products isrecognized at the time title and the risks and rewards of ownership pass to the customer. This generallyoccurs when the products reach the shipping point, the sales price is fixed and determinable, andcollection is reasonably assured. For those items where title has not yet transferred, we have deferredthe recognition of revenue. A reserve for estimated returns is established at the time of sale based onhistorical return experience and is recorded as a reduction of sales. Other allowances include customerquantity and price discrepancies. A reserve for other allowances is generally established at the time ofsale based on historical experience and is also recorded as a reduction of sales.
Contract revenues for construction related projects, which are generated in the Network Solutionssegment, are recorded primarily using the percentage-of-completion method. Profits recognized oncontracts in process are based upon estimated contract revenue and related cost to complete.Percentage-of-completion is measured based on the ratio of actual costs incurred to total estimatedcosts. Revisions in cost estimates as contracts progress have the effect of increasing or decreasingprofits in the current period. Provisions for anticipated losses are made in the period in which they firstbecome determinable. In addition, provisions for credit losses related to construction related projectsare recorded as reductions of revenue in the period in which they first become determinable.
40
Goodwill and Other Intangible Assets
Acquired intangible assets include both indeterminable-lived residual goodwill and determinable-lived identifiable intangible assets. Intangible assets with a determinable life include primarilyintellectual property, consisting of patents, trademarks, and unpatented technology, as well as customerrelationships. Estimates of recoverability range from 1 to 50 years and are generally amortized on astraight-line basis. An evaluation of the remaining useful life of determinable-lived intangible assets isperformed on a periodic basis and when events and circumstances warrant an evaluation. We assessdeterminable-lived intangible assets for impairment consistent with our policy for assessing otherlong-lived assets for impairment. Goodwill is assessed for impairment separately from determinable-lived intangible assets by comparing the carrying value of each reporting unit to its fair value on thefirst day of the fourth fiscal quarter of each year or whenever we believe a triggering event requiring amore frequent assessment has occurred. In assessing the existence of a triggering event, managementrelies on a number of reporting-unit-specific factors including operating results, business plans,economic projections, anticipated future cash flows, transactions, and market place data. There areinherent uncertainties related to these factors and management’s judgment in applying these factors tothe goodwill impairment analysis.
A reporting unit is generally an operating segment or one level below an operating segment thatconstitutes a business for which discrete financial information is available and regularly reviewed bysegment management. At fiscal year end 2013, we had eight reporting units, seven of which containedgoodwill. There is one reporting unit in the Transportation Solutions segment, three reporting units inthe Network Solutions segment, and two reporting units in both the Industrial Solutions and ConsumerSolutions segments. We review our reporting unit structure each year as part of our annual goodwillimpairment test, or more frequently based on changes in our structure.
When testing for goodwill impairment, we follow the guidance prescribed in ASC 350,Intangibles—Goodwill and Other. First, we perform a step I goodwill impairment test to identify apotential impairment. In doing so, we compare the fair value of a reporting unit with its carryingamount. If the carrying amount of a reporting unit exceeds its fair value, goodwill may be impaired anda step II goodwill impairment test is performed to measure the amount of impairment, if any. In thestep II goodwill impairment test, we compare the implied fair value of reporting unit goodwill with thecarrying amount of that goodwill. If the carrying amount of reporting unit goodwill exceeds the impliedfair value of that goodwill, an impairment loss is recognized in an amount equal to the excess. Theimplied fair value of goodwill is determined in a manner consistent with how goodwill is recognized ina business combination. We allocate the fair value of a reporting unit to all of the assets and liabilitiesof that unit, including intangible assets, as if the reporting unit had been acquired in a businesscombination. Any excess of the fair value of a reporting unit over the amounts assigned to its assetsand liabilities is the implied fair value of goodwill.
Fair value estimates used in the step I goodwill impairment tests are calculated using an incomeapproach based on the present value of future cash flows of each reporting unit. The income approachgenerally has been supported by guideline analyses (a market approach). These approaches incorporatea number of assumptions including future growth rates, discount rates, income tax rates, and marketactivity in assessing fair value and are reporting unit specific. Changes in economic and operatingconditions impacting these assumptions could result in goodwill impairments in future periods.
We completed our annual goodwill impairment test in the fourth quarter of fiscal 2013 anddetermined that no impairment existed.
Income Taxes
In determining income for financial statement purposes, we must make certain estimates andjudgments. These estimates and judgments affect the calculation of certain tax liabilities and the
41

determination of the recoverability of certain deferred tax assets, which arise from temporarydifferences between the income tax return and financial statement recognition of revenue and expense.
In evaluating our ability to recover our deferred tax assets, we consider all available positive andnegative evidence including our past operating results, the existence of cumulative losses in the mostrecent years, and our forecast of future taxable income. In estimating future taxable income, wedevelop assumptions including the amount of future state, federal, and non-U.S. pre-tax operatingincome, the reversal of temporary differences, and the implementation of feasible and prudent taxplanning strategies. These assumptions require significant judgment about the forecasts of futuretaxable income and are consistent with the plans and estimates we are using to manage the underlyingbusinesses.
We currently have recorded significant valuation allowances that we intend to maintain until it ismore likely than not the deferred tax assets will be realized. Our income tax expense recorded in thefuture will be reduced to the extent of decreases in our valuation allowances. The realization of ourremaining deferred tax assets is primarily dependent on future taxable income in the appropriatejurisdictions. Any reduction in future taxable income including any future restructuring activities mayrequire that we record an additional valuation allowance against our deferred tax assets. An increase inthe valuation allowance would result in additional income tax expense in such period and could have asignificant impact on our future earnings. Any changes in a valuation allowance that was established inconnection with an acquisition will be reflected in the income tax provision.
Changes in tax laws and rates also could affect recorded deferred tax assets and liabilities in thefuture. Management is not aware of any such changes that would have a material effect on our resultsof operations, financial position, or cash flows.
In addition, the calculation of our tax liabilities includes estimates for uncertainties in theapplication of complex tax regulations across multiple global jurisdictions where we conduct ouroperations. Under the uncertain tax position provisions of ASC 740, Income Taxes, we recognizeliabilities for tax and related interest for issues in the U.S. and other tax jurisdictions based on ourestimate of whether, and the extent to which, additional taxes and related interest will be due. Thesetax liabilities and related interest are reflected net of the impact of related tax loss carryforwards, assuch tax loss carryforwards will be applied against these tax liabilities and will reduce the amount ofcash tax payments due upon the eventual settlement with the tax authorities. These estimates maychange due to changing facts and circumstances. Due to the complexity of these uncertainties, theultimate resolution may result in a settlement that differs from our current estimate of the tax liabilitiesand related interest. Furthermore, management has reviewed with tax counsel the issues raised bycertain taxing authorities and the adequacy of these recorded amounts. If our current estimate of taxand interest liabilities is less than the ultimate settlement, an additional charge to income tax expensemay result. If our current estimate of tax and interest liabilities is more than the ultimate settlement,income tax benefits may be recognized. These tax liabilities and related interest are recorded in incometaxes and accrued and other current liabilities on the Consolidated Balance Sheets.
Pension and Postretirement Benefits
Our pension expense and obligations are developed from actuarial assumptions. The funded statusof our defined benefit pension and postretirement benefit plans is recognized on the ConsolidatedBalance Sheets and is measured as the difference between the fair value of plan assets and the benefitobligation at the measurement date. For defined benefit pension plans, the benefit obligation is theprojected benefit obligation, which represents the actuarial present value of benefits expected to bepaid upon retirement factoring in estimated future compensation levels. For the postretirement benefitplans, the benefit obligation is the accumulated postretirement benefit obligation, which represents theactuarial present value of postretirement benefits attributed to employee services already rendered. The
42
fair value of plan assets represents the current market value of cumulative company and participantcontributions made to irrevocable trust funds, held for the sole benefit of participants, which areinvested by the trustee of the funds. The benefits under pension and postretirement plans are based onvarious factors, such as years of service and compensation.
Net periodic pension benefit cost is based on the utilization of the projected unit credit method ofcalculation and is charged to earnings on a systematic basis over the expected average remainingservice lives of current participants.
Two critical assumptions in determining pension expense and obligations are the discount rate andexpected long-term return on plan assets. We evaluate these assumptions at least annually. Otherassumptions reflect demographic factors such as retirement, mortality, and employee turnover. Theseassumptions are evaluated periodically and updated to reflect our actual experience. Actual results maydiffer from actuarial assumptions. The discount rate represents the market rate for high-quality fixedincome investments and is used to calculate the present value of the expected future cash flows forbenefit obligations to be paid under our pension plans. A decrease in the discount rate increases thepresent value of pension benefit obligations. At fiscal year end 2013, a 25 basis point decrease in thediscount rate would have increased the present value of our pension obligations by $124 million; a 25basis point increase would have decreased the present value of our pension obligations by $112 million.We consider the current and expected asset allocations of our pension plans, as well as historical andexpected long-term rates of return on those types of plan assets, in determining the expected long-termrate of return on plan assets. A 50 basis point decrease or increase in the expected long-term return onplan assets would have increased or decreased, respectively, our fiscal 2013 pension expense by$10 million.
During fiscal 2012, our investment committee made the decision to change the target assetallocation of the U.S. plans’ master trust from a previous target of 30% equity and 70% fixed incometo 10% equity and 90% fixed income in an effort to better protect the funded status of the U.S. plans’master trust. Asset reallocation will continue over a multi-year period based on the funded status, asdefined by the Pension Protection Act of 2006 (‘‘the Pension Act Funded Status’’), of the U.S. plans’master trust and market conditions. We expect to reach our target allocation when the Pension ActFunded Status exceeds 100%. Based on the Pension Act Funded Status as of September 27, 2013, ourtarget asset allocation is 45% equity and 55% fixed income.
Acquisitions
We account for acquired businesses using the acquisition method of accounting. This methodrequires, among other things, that most assets acquired and liabilities assumed be recognized at fairvalue as of the acquisition date. We allocate the purchase price of acquired businesses to the tangibleand intangible assets acquired and liabilities assumed based on the estimated fair values, or as requiredby ASC 805, Business Combinations. The excess of the purchase price over the identifiable assetsacquired and liabilities assumed is recorded as goodwill. We may engage independent third-partyappraisal firms to assist us in determining the fair values of assets acquired and liabilities assumed.Such valuations require management to make significant estimates and assumptions, especially withrespect to intangible assets.
Critical estimates in valuing certain intangible assets include but are not limited to: future expectedcash flows from customer and distributor relationships, acquired developed technologies, and patents;expected costs to develop in-process research and development into commercially viable products andestimated cash flows from projects when completed; brand awareness and market position, as well asassumptions about the period of time the brand will continue to be used in our product portfolio;customer and distributor attrition rates; royalty rates; and discount rates. Management’s estimates offair value are based upon assumptions believed to be reasonable, but which are inherently uncertainand unpredictable. As a result, actual results may differ from estimates.
43
Contingent Liabilities
We record a loss contingency when the available information indicates it is probable that we haveincurred a liability and the amount of the loss is reasonably estimable. When a range of possible losseswith equal likelihood exists, we record the low end of the range. The likelihood of a loss with respectto a particular contingency is often difficult to predict, and determining a meaningful estimate of theloss or a range of loss may not be practicable based on information available. In addition, it is notuncommon for such matters to be resolved over many years, during which time relevant developmentsand new information must continuously be evaluated to determine whether a loss is probable and areasonable estimate of that loss can be made. When a loss is probable but a reasonable estimate cannotbe made, or when a loss is at least reasonably possible, disclosure is provided.
Non-GAAP Financial Measures
Organic Net Sales Growth
Organic net sales growth is a non-GAAP financial measure. The difference between reported netsales growth (the most comparable GAAP measure) and organic net sales growth (the non-GAAPmeasure) consists of the impact from foreign currency exchange rates, acquisitions, divestitures, and anadditional week in the fourth quarter of the fiscal year for fiscal years which are 53 weeks in length.Organic net sales growth is a useful measure of the underlying results and trends in our business. Itexcludes items that are not completely under management’s control, such as the impact of changes inforeign currency exchange rates, and items that do not reflect the underlying growth of the company,such as acquisition and divestiture activity and the impact of an additional week in the fourth quarterof the fiscal year for fiscal years which are 53 weeks in length. The impact of the 53rd week wasestimated using an average weekly sales figure for the last month of the fiscal year.
We believe organic net sales growth provides useful information to investors because it reflects theunderlying growth from the ongoing activities of our business. Furthermore, it provides investors with aview of our operations from management’s perspective. We use organic net sales growth to monitorand evaluate performance, as it is an important measure of the underlying results of our operations.Management uses organic net sales growth together with GAAP measures such as net sales growth andoperating income in its decision making processes related to the operations of our reporting segmentsand our overall company. We believe that investors benefit from having access to the same financialmeasures that management uses in evaluating operations. The discussion and analysis of organic netsales growth in ‘‘Results of Operations’’ above utilizes organic net sales growth as management doesinternally. Because organic net sales growth calculations may vary among other companies, organic netsales growth amounts presented above may not be comparable with similarly titled measures of othercompanies. Organic net sales growth is a non-GAAP financial measure that is not meant to beconsidered in isolation or as a substitute for GAAP measures. The primary limitation of this measure isthat it excludes items that have an impact on our net sales. This limitation is best addressed byevaluating organic net sales growth in combination with our GAAP net sales. The tables presented in‘‘Results of Operations’’ above provide reconciliations of organic net sales growth to net sales growthcalculated under GAAP.
Free Cash Flow
Free cash flow is a non-GAAP financial measure. The difference between net cash provided bycontinuing operating activities (the most comparable GAAP measure) and free cash flow (thenon-GAAP measure) consists mainly of significant cash outflows and inflows that we believe are usefulto identify. Free cash flow is a useful measure of our ability to generate cash. It also is a significantcomponent in our incentive compensation plans. We believe free cash flow provides useful information
44
to investors as it provides insight into the primary cash flow metric used by management to monitorand evaluate cash flows generated from our operations.
Free cash flow is defined as net cash provided by continuing operating activities excludingvoluntary pension contributions and the cash impact of special items, minus net capital expenditures.Net capital expenditures consist of capital expenditures less proceeds from the sale of property, plant,and equipment. They are subtracted because they represent long-term commitments. Voluntary pensioncontributions are excluded from the GAAP measure because this activity is driven by economicfinancing decisions rather than operating activity. Certain special items, including net payments relatedto pre-separation tax matters, also are considered by management in evaluating free cash flow. Webelieve investors should also consider these items in evaluating our free cash flow.
Free cash flow as presented herein may not be comparable to similarly-titled measures reported byother companies. The primary limitation of this measure is that it excludes items that have an impacton our GAAP cash flow. Also, it subtracts certain cash items that are ultimately within management’sand the board of directors’ discretion to direct and may imply that there is less or more cash availablefor our programs than the most comparable GAAP measure indicates. This limitation is best addressedby using free cash flow in combination with the GAAP cash flow results. It should not be inferred thatthe entire free cash flow amount is available for future discretionary expenditures, as our definition offree cash flow does not consider certain non-discretionary expenditures, such as debt payments. Inaddition, we may have other discretionary expenditures, such as discretionary dividends, sharerepurchases, and business acquisitions, that are not considered in the calculation of free cash flow.
The tables presented in ‘‘Liquidity and Capital Resources’’ above provide reconciliations of freecash flow to cash flows from continuing operating activities calculated under GAAP.
Forward-Looking Information
Certain statements in this report are ‘‘forward-looking statements’’ within the meaning of the U.S.Private Securities Litigation Reform Act of 1995. These statements are based on our management’sbeliefs and assumptions and on information currently available to our management. Forward-lookingstatements include, among others, the information concerning our possible or assumed future results ofoperations, business strategies, financing plans, competitive position, potential growth opportunities,potential operating performance improvements, acquisitions, the effects of competition, and the effectsof future legislation or regulations. Forward-looking statements include all statements that are nothistorical facts and can be identified by the use of forward-looking terminology such as the words‘‘believe,’’ ‘‘expect,’’ ‘‘plan,’’ ‘‘intend,’’ ‘‘anticipate,’’ ‘‘estimate,’’ ‘‘predict,’’ ‘‘potential,’’ ‘‘continue,’’‘‘may,’’ ‘‘should,’’ or the negative of these terms or similar expressions.
Forward-looking statements involve risks, uncertainties, and assumptions. Actual results may differmaterially from those expressed in these forward-looking statements. You should not put unduereliance on any forward-looking statements. We do not have any intention or obligation to updateforward-looking statements after we file this report except as required by law.
The following and other risks, which are described in greater detail in ‘‘Part I. Item 1A. RiskFactors’’ of our Annual Report on Form 10-K for the fiscal year ended September 27, 2013 filed withthe SEC, as well as other risks described in this Annual Report, could also cause our results to differmaterially from those expressed in forward-looking statements:
• conditions in the global or regional economies and global capital markets, and cyclical industryconditions;
• conditions affecting demand for products in the industries we serve, particularly the automotiveindustry;
45
• competition and pricing pressure;
• market acceptance of new product introductions and product innovations and product life cycles;
• raw material availability, quality, and cost;
• fluctuations in foreign currency exchange rates;
• financial condition and consolidation of customers and vendors;
• reliance on third-party suppliers;
• risks associated with future acquisitions and divestitures;
• global risks of business interruptions such as natural disasters and political, economic, andmilitary instability;
• risks related to compliance with current and future environmental and other laws andregulations;
• our ability to protect our intellectual property rights;
• risks of litigation;
• our ability to operate within the limitations imposed by our debt instruments;
• risks relating to our separation on June 29, 2007 from Tyco International Ltd.;
• the possible effects on us of various U.S. and non-U.S. legislative proposals and other initiativesthat, if adopted, could materially increase our worldwide corporate effective tax rate andnegatively impact our U.S. government contracts business;
• various risks associated with being a Swiss corporation;
• the impact of fluctuations in the market price of our shares; and
• the impact of certain provisions of our articles of association on unsolicited takeover proposals.
There may be other risks and uncertainties that we are unable to predict at this time or that wecurrently do not expect to have a material adverse effect on our business.
QUANTITATIVE AND QUALITATIVE DISCLOSURES ABOUT MARKET RISK
In the normal course of business, our financial position is routinely subject to a variety of risks,including market risks associated with interest rate and currency movements on outstanding debt andnon-U.S. Dollar denominated assets and liabilities and commodity price movements. We utilizeestablished risk management policies and procedures in executing derivative financial instrumenttransactions to manage a portion of these risks.
We do not execute transactions or hold derivative financial instruments for trading or speculativepurposes. Substantially all counterparties to derivative financial instruments are limited to majorfinancial institutions with at least an A/A2 credit rating. There is no significant concentration ofexposures with any one counterparty.
Foreign Currency Exposures
As part of managing the exposure to changes in foreign currency exchange rates, we utilize foreigncurrency forward and swap contracts, a portion of which are designated as cash flow hedges. Theobjective of these contracts is to minimize impacts to cash flows and profitability due to changes inforeign currency exchange rates on intercompany and other cash transactions. A 10% appreciation ordepreciation of the underlying currency in our foreign currency forward or swap contracts from the
46

September 27, 2013 market rates would have changed the unrealized value of our forward and swapcontracts by $27 million. A 10% appreciation or depreciation of the underlying currency in our foreigncurrency forward or swap contracts from the September 28, 2012 market rates would have changed theunrealized value of our forward and swap contracts by $35 million. Such gains or losses on thesecontracts would be generally offset by the gains or losses on the revaluation or settlement of theunderlying transactions.
Interest Rate and Investment Exposures
We issue debt, as needed, to fund our operations and capital requirements. Such borrowings canresult in interest rate exposure. To manage the interest rate exposure, we use interest rate swaps toconvert a portion of fixed-rate debt into variable-rate debt. We use forward starting interest rate swapsand options to enter into interest rate swaps (‘‘swaptions’’) to manage interest rate exposure in periodsprior to the anticipated issuance of fixed-rate debt. We also utilize investment swaps to manageearnings exposure on certain non-qualified deferred compensation liabilities.
During fiscal 2011, we entered into interest rate swaps designated as fair value hedges on$150 million principal amount of the 4.875% senior notes due 2021. The maturity dates of the interestrate swaps coincide with the maturity date of the notes. Under these contracts, we receive fixedamounts of interest applicable to the underlying notes and pay a floating amount based upon the three-month U.S. Dollar LIBOR.
Based on our floating rate debt balances of approximately $150 million at September 27, 2013 and$200 million at September 28, 2012, an increase in the levels of the U.S. Dollar interest rates by 0.5%,with all other variables held constant, would have resulted in an increase of annual interest expense ofapproximately $1 million in fiscal 2013 and 2012.
Commodity Exposures
Our worldwide operations and product lines may expose us to risks from fluctuations in commodityprices. To limit the effects of fluctuations in the future market price paid and related volatility in cashflows, we utilize commodity swap contracts designated as cash flow hedges. We continually evaluate thecommodity market with respect to our forecasted usage requirements over the next eighteen monthsand periodically enter into commodity swap contracts in order to hedge a portion of usagerequirements over that period. At September 27, 2013, our commodity hedges, which related toexpected purchases of gold, silver, and copper, were in a net loss position of $27 million and had anotional value of $278 million. At September 28, 2012, our commodity hedges, which related toexpected purchases of gold and silver, were in a net gain position of $17 million and had a notionalvalue of $246 million. A 10% appreciation or depreciation of the price of a troy ounce of gold, a troyounce of silver, and a pound of copper, from the September 27, 2013 prices would have changed theunrealized value of our forward contracts by $25 million. A 10% appreciation or depreciation of theprice of a troy ounce of gold and a troy ounce of silver from the September 28, 2012 prices would havechanged the unrealized value of our forward contracts by $26 million.
See Note 14 to the Consolidated Financial Statements for additional information on financialinstruments.
47
CHANGES IN AND DISAGREEMENTS WITH ACCOUNTANTS ON ACCOUNTING ANDFINANCIAL DISCLOSURE
None.
CONTROLS AND PROCEDURES
Evaluation of Disclosure Controls and Procedures
Our management, with the participation of our chief executive officer and chief financial officer,evaluated the effectiveness of our disclosure controls and procedures (as defined in Rule 13a-15(e)under the Exchange Act) as of September 27, 2013. Based on that evaluation, our chief executiveofficer and chief financial officer concluded that our disclosure controls and procedures were effectiveas of September 27, 2013.
Management’s Report on Internal Control Over Financial Reporting
Our management is responsible for establishing and maintaining adequate internal control overfinancial reporting (as defined in Rule 13a-15(f) under the Exchange Act). Management, with theparticipation of our chief executive officer and chief financial officer, evaluated the effectiveness of ourinternal control over financial reporting based on the framework in Internal Control—IntegratedFramework (1992) issued by the Committee of Sponsoring Organizations of the Treadway Commission.Based on this evaluation, management has concluded our internal control over financial reporting waseffective as of September 27, 2013.
Because of its inherent limitations, internal control over financial reporting may not prevent ordetect misstatements. Also, projections of any evaluation of effectiveness to future periods are subjectto the risk that controls may become inadequate because of changes in conditions, or that the degreeof compliance with policies and procedures may deteriorate.
Deloitte & Touche LLP, an independent registered public accounting firm, has issued an attestationreport on our internal control over financial reporting as of September 27, 2013, which is included inthis Annual Report.
Changes in Internal Control Over Financial Reporting
During the quarter ended September 27, 2013, there were no changes in our internal control overfinancial reporting that have materially affected, or are reasonably likely to materially affect, ourinternal control over financial reporting.
48
TE CONNECTIVITY LTD.
INDEX TO CONSOLIDATED FINANCIAL STATEMENTS
Page
Reports of Independent Registered Public Accounting Firm . . . . . . . . . . . . . . . . . . . . . . . . . . . 50
Consolidated Statements of Operations for the Fiscal Years Ended September 27, 2013,September 28, 2012, and September 30, 2011 . . . . . . . . . . . . . . . . . . . . . . . . . . . . . . . . . . . . 53
Consolidated Statements of Comprehensive Income for the Fiscal Years Ended September 27,2013, September 28, 2012, and September 30, 2011 . . . . . . . . . . . . . . . . . . . . . . . . . . . . . . . 54
Consolidated Balance Sheets as of September 27, 2013 and September 28, 2012 . . . . . . . . . . . . 55
Consolidated Statements of Equity for the Fiscal Years Ended September 27, 2013,September 28, 2012, and September 30, 2011 . . . . . . . . . . . . . . . . . . . . . . . . . . . . . . . . . . . . 56
Consolidated Statements of Cash Flows for the Fiscal Years Ended September 27, 2013,September 28, 2012, and September 30, 2011 . . . . . . . . . . . . . . . . . . . . . . . . . . . . . . . . . . . . 57
Notes to Consolidated Financial Statements . . . . . . . . . . . . . . . . . . . . . . . . . . . . . . . . . . . . . . 58
Schedule II—Valuation and Qualifying Accounts . . . . . . . . . . . . . . . . . . . . . . . . . . . . . . . . . . . 129
Report of Statutory Auditor . . . . . . . . . . . . . . . . . . . . . . . . . . . . . . . . . . . . . . . . . . . . . . . . . . 130
49

REPORT OF INDEPENDENT REGISTERED PUBLIC ACCOUNTING FIRM
To the Board of Directors and Shareholders of TE Connectivity Ltd.:
We have audited the accompanying consolidated balance sheets of TE Connectivity Ltd. andsubsidiaries (the ‘‘Company’’) as of September 27, 2013 and September 28, 2012, and the relatedconsolidated statements of operations, comprehensive income, equity, and cash flows for each of thethree fiscal years in the period ended September 27, 2013. Our audits also included the financialstatement schedule listed in the Index. These consolidated financial statements and financial statementschedule are the responsibility of the Company’s management. Our responsibility is to express anopinion on the consolidated financial statements and financial statement schedule based on our audits.
We conducted our audits in accordance with the standards of the Public Company AccountingOversight Board (United States). Those standards require that we plan and perform the audit to obtainreasonable assurance about whether the financial statements are free of material misstatement. Anaudit includes examining, on a test basis, evidence supporting the amounts and disclosures in thefinancial statements. An audit also includes assessing the accounting principles used and significantestimates made by management, as well as evaluating the overall financial statement presentation. Webelieve that our audits provide a reasonable basis for our opinion.
In our opinion, such consolidated financial statements present fairly, in all material respects, thefinancial position of the Company as of September 27, 2013 and September 28, 2012, and the results ofits operations and its cash flows for each of the three fiscal years in the period ended September 27,2013, in conformity with accounting principles generally accepted in the United States of America.Also, in our opinion, such financial statement schedule, when considered in relation to the basicconsolidated financial statements taken as a whole, presents fairly, in all material respects, theinformation set forth therein.
We have also audited, in accordance with the standards of the Public Company AccountingOversight Board (United States), the Company’s internal control over financial reporting as ofSeptember 27, 2013, based on the criteria established in Internal Control—Integrated Framework (1992)issued by the Committee of Sponsoring Organizations of the Treadway Commission and our reportdated November 15, 2013 expressed an unqualified opinion on the Company’s internal control overfinancial reporting.
/s/ Deloitte & Touche LLP
Philadelphia, PennsylvaniaNovember 15, 2013
50

REPORT OF INDEPENDENT REGISTERED PUBLIC ACCOUNTING FIRM
To the Board of Directors and Shareholders of TE Connectivity Ltd.:
We have audited the internal control over financial reporting of TE Connectivity Ltd. andsubsidiaries (the ‘‘Company’’) as of September 27, 2013, based on criteria established in InternalControl—Integrated Framework (1992) issued by the Committee of Sponsoring Organizations of theTreadway Commission. The Company’s management is responsible for maintaining effective internalcontrol over financial reporting and for its assessment of the effectiveness of internal control overfinancial reporting, included in the accompanying Management’s Report on Internal Control OverFinancial Reporting. Our responsibility is to express an opinion on the Company’s internal control overfinancial reporting based on our audit.
We conducted our audit in accordance with the standards of the Public Company AccountingOversight Board (United States). Those standards require that we plan and perform the audit to obtainreasonable assurance about whether effective internal control over financial reporting was maintainedin all material respects. Our audit included obtaining an understanding of internal control overfinancial reporting, assessing the risk that a material weakness exists, testing and evaluating the designand operating effectiveness of internal control based on the assessed risk, and performing such otherprocedures as we considered necessary in the circumstances. We believe that our audit provides areasonable basis for our opinion.
A company’s internal control over financial reporting is a process designed by, or under thesupervision of, the company’s principal executive and principal financial officers, or persons performingsimilar functions, and effected by the company’s board of directors, management, and other personnelto provide reasonable assurance regarding the reliability of financial reporting and the preparation offinancial statements for external purposes in accordance with generally accepted accounting principles.A company’s internal control over financial reporting includes those policies and procedures that(1) pertain to the maintenance of records that, in reasonable detail, accurately and fairly reflect thetransactions and dispositions of the assets of the company; (2) provide reasonable assurance thattransactions are recorded as necessary to permit preparation of financial statements in accordance withgenerally accepted accounting principles, and that receipts and expenditures of the company are beingmade only in accordance with authorizations of management and directors of the company; and(3) provide reasonable assurance regarding prevention or timely detection of unauthorized acquisition,use, or disposition of the company’s assets that could have a material effect on the financial statements.
Because of the inherent limitations of internal control over financial reporting, including thepossibility of collusion or improper management override of controls, material misstatements due toerror or fraud may not be prevented or detected on a timely basis. Also, projections of any evaluationof the effectiveness of the internal control over financial reporting to future periods are subject to therisk that the controls may become inadequate because of changes in conditions, or that the degree ofcompliance with the policies or procedures may deteriorate.
In our opinion, the Company maintained, in all material respects, effective internal control overfinancial reporting as of September 27, 2013, based on the criteria established in Internal Control—Integrated Framework (1992) issued by the Committee of Sponsoring Organizations of the TreadwayCommission.
51

We have also audited, in accordance with the standards of the Public Company AccountingOversight Board (United States), the consolidated financial statements and financial statement scheduleof the Company as of and for the fiscal year ended September 27, 2013, and our report datedNovember 15, 2013 expressed an unqualified opinion on those consolidated financial statements andfinancial statement schedule.
/s/ Deloitte & Touche LLP
Philadelphia, PennsylvaniaNovember 15, 2013
52
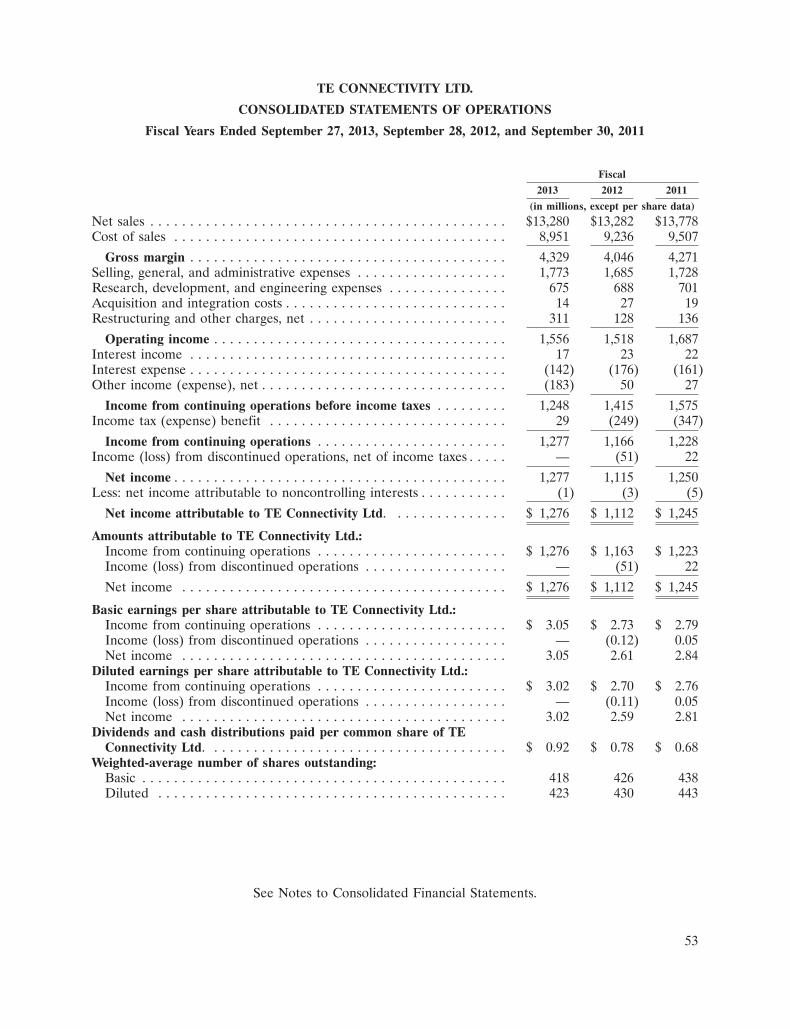
TE CONNECTIVITY LTD.
CONSOLIDATED STATEMENTS OF OPERATIONS
Fiscal Years Ended September 27, 2013, September 28, 2012, and September 30, 2011
Fiscal
2013 2012 2011
(in millions, except per share data)
Net sales . . . . . . . . . . . . . . . . . . . . . . . . . . . . . . . . . . . . . . . . . . . . . $13,280 $13,282 $13,778Cost of sales . . . . . . . . . . . . . . . . . . . . . . . . . . . . . . . . . . . . . . . . . . 8,951 9,236 9,507
Gross margin . . . . . . . . . . . . . . . . . . . . . . . . . . . . . . . . . . . . . . . . 4,329 4,046 4,271Selling, general, and administrative expenses . . . . . . . . . . . . . . . . . . . 1,773 1,685 1,728Research, development, and engineering expenses . . . . . . . . . . . . . . . 675 688 701Acquisition and integration costs . . . . . . . . . . . . . . . . . . . . . . . . . . . . 14 27 19Restructuring and other charges, net . . . . . . . . . . . . . . . . . . . . . . . . . 311 128 136
Operating income . . . . . . . . . . . . . . . . . . . . . . . . . . . . . . . . . . . . . 1,556 1,518 1,687Interest income . . . . . . . . . . . . . . . . . . . . . . . . . . . . . . . . . . . . . . . . 17 23 22Interest expense . . . . . . . . . . . . . . . . . . . . . . . . . . . . . . . . . . . . . . . . (142) (176) (161)Other income (expense), net . . . . . . . . . . . . . . . . . . . . . . . . . . . . . . . (183) 50 27
Income from continuing operations before income taxes . . . . . . . . . 1,248 1,415 1,575Income tax (expense) benefit . . . . . . . . . . . . . . . . . . . . . . . . . . . . . . 29 (249) (347)
Income from continuing operations . . . . . . . . . . . . . . . . . . . . . . . . 1,277 1,166 1,228Income (loss) from discontinued operations, net of income taxes . . . . . — (51) 22
Net income . . . . . . . . . . . . . . . . . . . . . . . . . . . . . . . . . . . . . . . . . . 1,277 1,115 1,250Less: net income attributable to noncontrolling interests . . . . . . . . . . . (1) (3) (5)
Net income attributable to TE Connectivity Ltd. . . . . . . . . . . . . . . $ 1,276 $ 1,112 $ 1,245
Amounts attributable to TE Connectivity Ltd.:Income from continuing operations . . . . . . . . . . . . . . . . . . . . . . . . $ 1,276 $ 1,163 $ 1,223Income (loss) from discontinued operations . . . . . . . . . . . . . . . . . . — (51) 22
Net income . . . . . . . . . . . . . . . . . . . . . . . . . . . . . . . . . . . . . . . . . $ 1,276 $ 1,112 $ 1,245
Basic earnings per share attributable to TE Connectivity Ltd.:Income from continuing operations . . . . . . . . . . . . . . . . . . . . . . . . $ 3.05 $ 2.73 $ 2.79Income (loss) from discontinued operations . . . . . . . . . . . . . . . . . . — (0.12) 0.05Net income . . . . . . . . . . . . . . . . . . . . . . . . . . . . . . . . . . . . . . . . . 3.05 2.61 2.84
Diluted earnings per share attributable to TE Connectivity Ltd.:Income from continuing operations . . . . . . . . . . . . . . . . . . . . . . . . $ 3.02 $ 2.70 $ 2.76Income (loss) from discontinued operations . . . . . . . . . . . . . . . . . . — (0.11) 0.05Net income . . . . . . . . . . . . . . . . . . . . . . . . . . . . . . . . . . . . . . . . . 3.02 2.59 2.81
Dividends and cash distributions paid per common share of TEConnectivity Ltd. . . . . . . . . . . . . . . . . . . . . . . . . . . . . . . . . . . . . . $ 0.92 $ 0.78 $ 0.68
Weighted-average number of shares outstanding:Basic . . . . . . . . . . . . . . . . . . . . . . . . . . . . . . . . . . . . . . . . . . . . . . 418 426 438Diluted . . . . . . . . . . . . . . . . . . . . . . . . . . . . . . . . . . . . . . . . . . . . 423 430 443
See Notes to Consolidated Financial Statements.
53

TE CONNECTIVITY LTD.
CONSOLIDATED STATEMENTS OF COMPREHENSIVE INCOME
Fiscal Years Ended September 27, 2013, September 28, 2012, and September 30, 2011
Fiscal
2013 2012 2011
(in millions)
Net income . . . . . . . . . . . . . . . . . . . . . . . . . . . . . . . . . . . . . . . . . . . . . . . . $1,277 $1,115 $1,250Other comprehensive income (loss):
Currency translation . . . . . . . . . . . . . . . . . . . . . . . . . . . . . . . . . . . . . . . . (28) (131) 50Adjustments to unrecognized pension and postretirement benefit costs,
net of income taxes . . . . . . . . . . . . . . . . . . . . . . . . . . . . . . . . . . . . . . 131 (88) 152Gain (loss) on cash flow hedges, net of income taxes . . . . . . . . . . . . . . . . (29) 20 (20)
Other comprehensive income (loss) . . . . . . . . . . . . . . . . . . . . . . . . . . . . . 74 (199) 182
Comprehensive income . . . . . . . . . . . . . . . . . . . . . . . . . . . . . . . . . . . . . . . 1,351 916 1,432Less: comprehensive income attributable to noncontrolling interests . . . . . . . (1) (3) (5)
Comprehensive income attributable to TE Connectivity Ltd. . . . . . . . . . . . . $1,350 $ 913 $1,427
See Notes to Consolidated Financial Statements.
54

TE CONNECTIVITY LTD.
CONSOLIDATED BALANCE SHEETS
As of September 27, 2013 and September 28, 2012
Fiscal Year End
2013 2012
(in millions, exceptshare data)
AssetsCurrent assets:
Cash and cash equivalents . . . . . . . . . . . . . . . . . . . . . . . . . . . . . . . . . . . . . . . . . . . . . $ 1,403 $ 1,589Accounts receivable, net of allowance for doubtful accounts of $48 and $41, respectively . . . 2,323 2,343Inventories . . . . . . . . . . . . . . . . . . . . . . . . . . . . . . . . . . . . . . . . . . . . . . . . . . . . . . . . 1,762 1,808Prepaid expenses and other current assets . . . . . . . . . . . . . . . . . . . . . . . . . . . . . . . . . . . 487 474Deferred income taxes . . . . . . . . . . . . . . . . . . . . . . . . . . . . . . . . . . . . . . . . . . . . . . . . 334 289
Total current assets . . . . . . . . . . . . . . . . . . . . . . . . . . . . . . . . . . . . . . . . . . . . . . . . 6,309 6,503Property, plant, and equipment, net . . . . . . . . . . . . . . . . . . . . . . . . . . . . . . . . . . . . . . . . 3,166 3,213Goodwill . . . . . . . . . . . . . . . . . . . . . . . . . . . . . . . . . . . . . . . . . . . . . . . . . . . . . . . . . . . 4,326 4,308Intangible assets, net . . . . . . . . . . . . . . . . . . . . . . . . . . . . . . . . . . . . . . . . . . . . . . . . . . 1,244 1,352Deferred income taxes . . . . . . . . . . . . . . . . . . . . . . . . . . . . . . . . . . . . . . . . . . . . . . . . . 2,146 2,460Receivable from Tyco International Ltd. and Covidien plc . . . . . . . . . . . . . . . . . . . . . . . . . 1,002 1,180Other assets . . . . . . . . . . . . . . . . . . . . . . . . . . . . . . . . . . . . . . . . . . . . . . . . . . . . . . . . 268 290
Total Assets . . . . . . . . . . . . . . . . . . . . . . . . . . . . . . . . . . . . . . . . . . . . . . . . . . . . . $18,461 $19,306
Liabilities and EquityCurrent liabilities:
Current maturities of long-term debt . . . . . . . . . . . . . . . . . . . . . . . . . . . . . . . . . . . . . . $ 711 $ 1,015Accounts payable . . . . . . . . . . . . . . . . . . . . . . . . . . . . . . . . . . . . . . . . . . . . . . . . . . . 1,383 1,292Accrued and other current liabilities . . . . . . . . . . . . . . . . . . . . . . . . . . . . . . . . . . . . . . 1,762 1,576Deferred revenue . . . . . . . . . . . . . . . . . . . . . . . . . . . . . . . . . . . . . . . . . . . . . . . . . . . 68 121
Total current liabilities . . . . . . . . . . . . . . . . . . . . . . . . . . . . . . . . . . . . . . . . . . . . . . 3,924 4,004Long-term debt . . . . . . . . . . . . . . . . . . . . . . . . . . . . . . . . . . . . . . . . . . . . . . . . . . . . . . 2,303 2,696Long-term pension and postretirement liabilities . . . . . . . . . . . . . . . . . . . . . . . . . . . . . . . . 1,155 1,353Deferred income taxes . . . . . . . . . . . . . . . . . . . . . . . . . . . . . . . . . . . . . . . . . . . . . . . . . 321 448Income taxes . . . . . . . . . . . . . . . . . . . . . . . . . . . . . . . . . . . . . . . . . . . . . . . . . . . . . . . . 1,979 2,311Other liabilities . . . . . . . . . . . . . . . . . . . . . . . . . . . . . . . . . . . . . . . . . . . . . . . . . . . . . . 393 517
Total Liabilities . . . . . . . . . . . . . . . . . . . . . . . . . . . . . . . . . . . . . . . . . . . . . . . . . . . 10,075 11,329
Commitments and contingencies (Note 13)Equity:
TE Connectivity Ltd. shareholders’ equity:Common shares, 428,527,307 shares authorized and issued, CHF 0.57 par value, and
439,092,124 shares authorized and issued, CHF 0.97 par value, respectively . . . . . . . . . 189 193Contributed surplus . . . . . . . . . . . . . . . . . . . . . . . . . . . . . . . . . . . . . . . . . . . . . . . . 6,136 6,837Accumulated earnings . . . . . . . . . . . . . . . . . . . . . . . . . . . . . . . . . . . . . . . . . . . . . . . 2,472 1,196Treasury shares, at cost, 17,020,636 and 16,408,049 shares, respectively . . . . . . . . . . . . . . (720) (484)Accumulated other comprehensive income . . . . . . . . . . . . . . . . . . . . . . . . . . . . . . . . . 303 229
Total TE Connectivity Ltd. shareholders’ equity . . . . . . . . . . . . . . . . . . . . . . . . . . . . 8,380 7,971Noncontrolling interests . . . . . . . . . . . . . . . . . . . . . . . . . . . . . . . . . . . . . . . . . . . . . . . 6 6
Total Equity . . . . . . . . . . . . . . . . . . . . . . . . . . . . . . . . . . . . . . . . . . . . . . . . . . . . . 8,386 7,977
Total Liabilities and Equity . . . . . . . . . . . . . . . . . . . . . . . . . . . . . . . . . . . . . . . . . . . $18,461 $19,306
See Notes to Consolidated Financial Statements.
55
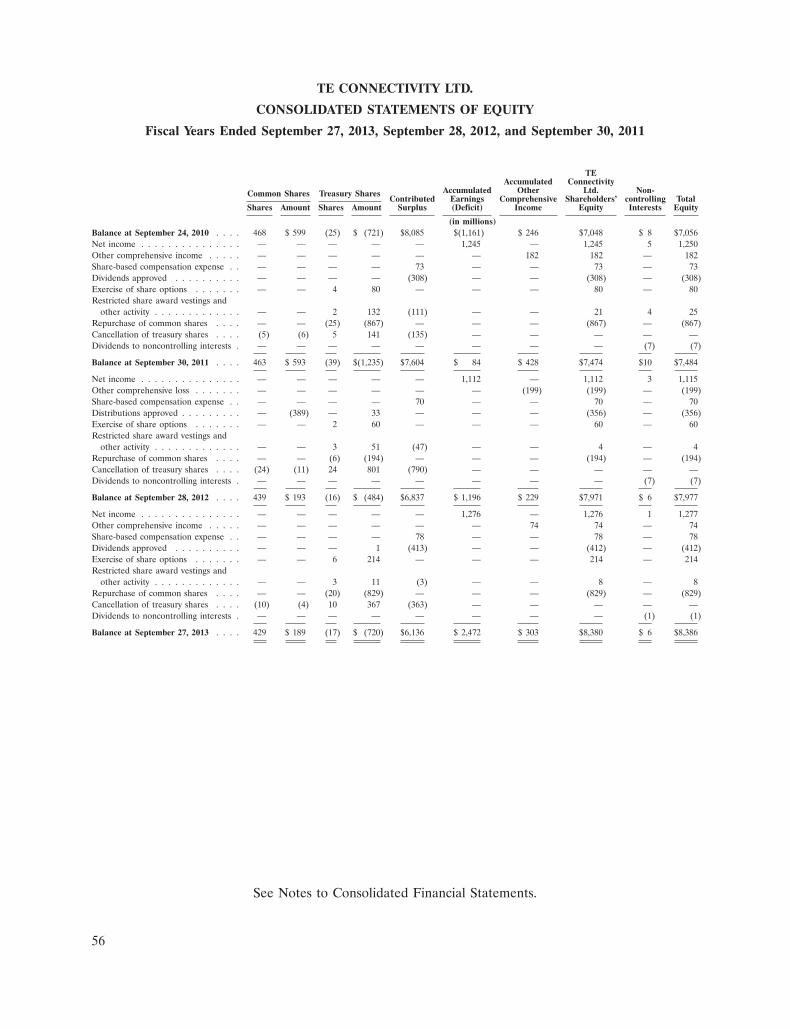
TE CONNECTIVITY LTD.
CONSOLIDATED STATEMENTS OF EQUITY
Fiscal Years Ended September 27, 2013, September 28, 2012, and September 30, 2011
TEAccumulated Connectivity
Accumulated Other Ltd. Non-Common Shares Treasury SharesContributed Earnings Comprehensive Shareholders’ controlling Total
Shares Amount Shares Amount Surplus (Deficit) Income Equity Interests Equity
(in millions)Balance at September 24, 2010 . . . . 468 $ 599 (25) $ (721) $8,085 $(1,161) $ 246 $7,048 $ 8 $7,056Net income . . . . . . . . . . . . . . . — — — — — 1,245 — 1,245 5 1,250Other comprehensive income . . . . . — — — — — — 182 182 — 182Share-based compensation expense . . — — — — 73 — — 73 — 73Dividends approved . . . . . . . . . . — — — — (308) — — (308) — (308)Exercise of share options . . . . . . . — — 4 80 — — — 80 — 80Restricted share award vestings and
other activity . . . . . . . . . . . . . — — 2 132 (111) — — 21 4 25Repurchase of common shares . . . . — — (25) (867) — — — (867) — (867)Cancellation of treasury shares . . . . (5) (6) 5 141 (135) — — — — —Dividends to noncontrolling interests . — — — — — — — — (7) (7)
Balance at September 30, 2011 . . . . 463 $ 593 (39) $(1,235) $7,604 $ 84 $ 428 $7,474 $10 $7,484
Net income . . . . . . . . . . . . . . . — — — — — 1,112 — 1,112 3 1,115Other comprehensive loss . . . . . . . — — — — — — (199) (199) — (199)Share-based compensation expense . . — — — — 70 — — 70 — 70Distributions approved . . . . . . . . . — (389) — 33 — — — (356) — (356)Exercise of share options . . . . . . . — — 2 60 — — — 60 — 60Restricted share award vestings and
other activity . . . . . . . . . . . . . — — 3 51 (47) — — 4 — 4Repurchase of common shares . . . . — — (6) (194) — — — (194) — (194)Cancellation of treasury shares . . . . (24) (11) 24 801 (790) — — — — —Dividends to noncontrolling interests . — — — — — — — — (7) (7)
Balance at September 28, 2012 . . . . 439 $ 193 (16) $ (484) $6,837 $ 1,196 $ 229 $7,971 $ 6 $7,977
Net income . . . . . . . . . . . . . . . — — — — — 1,276 — 1,276 1 1,277Other comprehensive income . . . . . — — — — — — 74 74 — 74Share-based compensation expense . . — — — — 78 — — 78 — 78Dividends approved . . . . . . . . . . — — — 1 (413) — — (412) — (412)Exercise of share options . . . . . . . — — 6 214 — — — 214 — 214Restricted share award vestings and
other activity . . . . . . . . . . . . . — — 3 11 (3) — — 8 — 8Repurchase of common shares . . . . — — (20) (829) — — — (829) — (829)Cancellation of treasury shares . . . . (10) (4) 10 367 (363) — — — — —Dividends to noncontrolling interests . — — — — — — — — (1) (1)
Balance at September 27, 2013 . . . . 429 $ 189 (17) $ (720) $6,136 $ 2,472 $ 303 $8,380 $ 6 $8,386
See Notes to Consolidated Financial Statements.
56

TE CONNECTIVITY LTD.
CONSOLIDATED STATEMENTS OF CASH FLOWS
Fiscal Years Ended September 27, 2013, September 28, 2012, and September 30, 2011
Fiscal
2013 2012 2011
(in millions)Cash Flows From Operating Activities:Net income . . . . . . . . . . . . . . . . . . . . . . . . . . . . . . . . . . . . . . . . . . . . . . . . . . . . . . . . . . . . . $ 1,277 $ 1,115 $ 1,250
(Income) loss from discontinued operations, net of income taxes . . . . . . . . . . . . . . . . . . . . . . . . . . . . — 51 (22)
Income from continuing operations . . . . . . . . . . . . . . . . . . . . . . . . . . . . . . . . . . . . . . . . . . . . . . . 1,277 1,166 1,228Adjustments to reconcile income from continuing operations to net cash provided by operating activities:
Depreciation and amortization . . . . . . . . . . . . . . . . . . . . . . . . . . . . . . . . . . . . . . . . . . . . . . . . 607 609 564Non-cash restructuring charges . . . . . . . . . . . . . . . . . . . . . . . . . . . . . . . . . . . . . . . . . . . . . . . . 84 1 9Deferred income taxes . . . . . . . . . . . . . . . . . . . . . . . . . . . . . . . . . . . . . . . . . . . . . . . . . . . . . 30 (48) 103Provision for losses on accounts receivable and inventories . . . . . . . . . . . . . . . . . . . . . . . . . . . . . . . . 59 58 18Tax sharing (income) expense . . . . . . . . . . . . . . . . . . . . . . . . . . . . . . . . . . . . . . . . . . . . . . . . . 181 (52) (27)Share-based compensation expense . . . . . . . . . . . . . . . . . . . . . . . . . . . . . . . . . . . . . . . . . . . . . . 78 68 71Other . . . . . . . . . . . . . . . . . . . . . . . . . . . . . . . . . . . . . . . . . . . . . . . . . . . . . . . . . . . . . . . 56 63 (12)Changes in assets and liabilities, net of the effects of acquisitions and divestitures:
Accounts receivable, net . . . . . . . . . . . . . . . . . . . . . . . . . . . . . . . . . . . . . . . . . . . . . . . . . . (81) 17 26Inventories . . . . . . . . . . . . . . . . . . . . . . . . . . . . . . . . . . . . . . . . . . . . . . . . . . . . . . . . . . (61) 116 (239)Inventoried costs on long-term contracts . . . . . . . . . . . . . . . . . . . . . . . . . . . . . . . . . . . . . . . . . 18 7 31Prepaid expenses and other current assets . . . . . . . . . . . . . . . . . . . . . . . . . . . . . . . . . . . . . . . . 11 103 190Accounts payable . . . . . . . . . . . . . . . . . . . . . . . . . . . . . . . . . . . . . . . . . . . . . . . . . . . . . . . 167 (189) (38)Accrued and other current liabilities . . . . . . . . . . . . . . . . . . . . . . . . . . . . . . . . . . . . . . . . . . . (13) (92) (225)Income taxes . . . . . . . . . . . . . . . . . . . . . . . . . . . . . . . . . . . . . . . . . . . . . . . . . . . . . . . . . (371) 7 (54)Other . . . . . . . . . . . . . . . . . . . . . . . . . . . . . . . . . . . . . . . . . . . . . . . . . . . . . . . . . . . . . 6 54 77
Net cash provided by continuing operating activities . . . . . . . . . . . . . . . . . . . . . . . . . . . . . . . . . 2,048 1,888 1,722Net cash provided by (used in) discontinued operating activities . . . . . . . . . . . . . . . . . . . . . . . . . . (2) 59 57
Net cash provided by operating activities . . . . . . . . . . . . . . . . . . . . . . . . . . . . . . . . . . . . . . . . 2,046 1,947 1,779
Cash Flows From Investing Activities:Capital expenditures . . . . . . . . . . . . . . . . . . . . . . . . . . . . . . . . . . . . . . . . . . . . . . . . . . . . . . . (615) (533) (574)Proceeds from sale of property, plant, and equipment . . . . . . . . . . . . . . . . . . . . . . . . . . . . . . . . . . . . 39 23 65Proceeds from sale of intangible assets . . . . . . . . . . . . . . . . . . . . . . . . . . . . . . . . . . . . . . . . . . . . . — — 68Proceeds from sale of short-term investments . . . . . . . . . . . . . . . . . . . . . . . . . . . . . . . . . . . . . . . . . — — 155Acquisition of businesses, net of cash acquired . . . . . . . . . . . . . . . . . . . . . . . . . . . . . . . . . . . . . . . . (6) (1,384) (731)Proceeds from divestiture of discontinued operations, net of cash retained by sold operations . . . . . . . . . . . . . 14 394 —Other . . . . . . . . . . . . . . . . . . . . . . . . . . . . . . . . . . . . . . . . . . . . . . . . . . . . . . . . . . . . . . . . 23 (9) (8)
Net cash used in continuing investing activities . . . . . . . . . . . . . . . . . . . . . . . . . . . . . . . . . . . . (545) (1,509) (1,025)Net cash used in discontinued investing activities . . . . . . . . . . . . . . . . . . . . . . . . . . . . . . . . . . . — (1) (18)
Net cash used in investing activities . . . . . . . . . . . . . . . . . . . . . . . . . . . . . . . . . . . . . . . . . . . (545) (1,510) (1,043)
Cash Flows From Financing Activities:Net increase (decrease) in commercial paper . . . . . . . . . . . . . . . . . . . . . . . . . . . . . . . . . . . . . . . . . 50 300 (100)Proceeds from long-term debt . . . . . . . . . . . . . . . . . . . . . . . . . . . . . . . . . . . . . . . . . . . . . . . . . . — 748 249Repayment of long-term debt . . . . . . . . . . . . . . . . . . . . . . . . . . . . . . . . . . . . . . . . . . . . . . . . . . (715) (642) (565)Proceeds from exercise of share options . . . . . . . . . . . . . . . . . . . . . . . . . . . . . . . . . . . . . . . . . . . . 214 60 80Repurchase of common shares . . . . . . . . . . . . . . . . . . . . . . . . . . . . . . . . . . . . . . . . . . . . . . . . . (844) (185) (865)Payment of common share dividends and cash distributions to shareholders . . . . . . . . . . . . . . . . . . . . . . . (384) (332) (296)Other . . . . . . . . . . . . . . . . . . . . . . . . . . . . . . . . . . . . . . . . . . . . . . . . . . . . . . . . . . . . . . . . (1) 44 23
Net cash used in continuing financing activities . . . . . . . . . . . . . . . . . . . . . . . . . . . . . . . . . . . . (1,680) (7) (1,474)Net cash provided by (used in) discontinued financing activities . . . . . . . . . . . . . . . . . . . . . . . . . . 2 (58) (38)
Net cash used in financing activities . . . . . . . . . . . . . . . . . . . . . . . . . . . . . . . . . . . . . . . . . . (1,678) (65) (1,512)
Effect of currency translation on cash . . . . . . . . . . . . . . . . . . . . . . . . . . . . . . . . . . . . . . . . . . . . . (9) (1) 5Net increase (decrease) in cash and cash equivalents . . . . . . . . . . . . . . . . . . . . . . . . . . . . . . . . . . . . (186) 371 (771)Less: net increase in cash and cash equivalents related to discontinued operations . . . . . . . . . . . . . . . . . . . — — (1)Cash and cash equivalents at beginning of fiscal year . . . . . . . . . . . . . . . . . . . . . . . . . . . . . . . . . . . . 1,589 1,218 1,990
Cash and cash equivalents at end of fiscal year . . . . . . . . . . . . . . . . . . . . . . . . . . . . . . . . . . . . . . . . $ 1,403 $ 1,589 $ 1,218
Supplemental Cash Flow Information:Interest paid . . . . . . . . . . . . . . . . . . . . . . . . . . . . . . . . . . . . . . . . . . . . . . . . . . . . . . . . . . . . $ 155 $ 181 $ 162Income taxes paid, net of refunds . . . . . . . . . . . . . . . . . . . . . . . . . . . . . . . . . . . . . . . . . . . . . . . . 312 290 299
See Notes to Consolidated Financial Statements.
57

TE CONNECTIVITY LTD.
NOTES TO CONSOLIDATED FINANCIAL STATEMENTS
1. Basis of Presentation
The Consolidated Financial Statements reflect the consolidated operations of TE Connectivity Ltd.and its subsidiaries and have been prepared in United States (‘‘U.S.’’) Dollars in accordance withaccounting principles generally accepted in the U.S. (‘‘GAAP’’).
Description of the Business
TE Connectivity Ltd. (‘‘TE Connectivity’’ or the ‘‘Company,’’ which may be referred to as ‘‘we,’’‘‘us,’’ or ‘‘our’’) is a world leader in connectivity. We design and manufacture products to connectpower, data, and signal in a broad array of industries including automotive, energy, industrial,broadband communications, consumer devices, healthcare, and aerospace and defense. We help ourcustomers solve the need for more energy efficiency, always-on communications, and ever-increasingproductivity.
We consist of four reportable segments:
• Transportation Solutions. The Transportation Solutions segment is a leader in electroniccomponents, including terminals and connectors, relays, and sensors, as well as applicationtooling, wire and heat shrink tubing, and other custom-engineered solutions for the automotivemarket including the industrial and commercial vehicle and hybrid and electric vehicle markets.
• Network Solutions. The Network Solutions segment is one of the world’s largest suppliers ofinfrastructure components and systems for the telecommunications market and electroniccomponents for the data communications market. Our products include connectors, fiber optics,wire and cable, racks and panels, and wireless products. We also are a leader in developing,manufacturing, installing, and maintaining some of the world’s most advanced subsea fiber opticcommunications systems.
• Industrial Solutions. The Industrial Solutions segment is a leading supplier of products thatconnect and distribute power and data, including connectors, heat shrink tubing, relays, and wireand cable, as well as custom-engineered solutions. Our products are used primarily in theindustrial; aerospace, defense, and marine; and energy markets.
• Consumer Solutions. The Consumer Solutions segment is a top supplier of electroniccomponents, including connectors, circuit protection devices, relays, antennas, and heat shrinktubing, for the consumer devices and appliances markets.
Use of Estimates
The preparation of the Consolidated Financial Statements in conformity with GAAP requiresmanagement to make estimates and assumptions that affect the reported amounts of assets andliabilities, the disclosure of contingent assets and liabilities, and the reported amounts of revenues andexpenses. Significant estimates in these Consolidated Financial Statements include restructuring andother charges, assets acquired and liabilities assumed in acquisitions, allowances for doubtful accountsreceivable, estimates of future cash flows and discount rates associated with asset impairments, usefullives for depreciation and amortization, loss contingencies, net realizable value of inventories, estimatedcontract revenue and related costs, legal contingencies, tax reserves and deferred tax asset valuationallowances, and the determination of discount and other rate assumptions for pension andpostretirement employee benefit expenses. Actual results could differ materially from these estimates.
58

TE CONNECTIVITY LTD.
NOTES TO CONSOLIDATED FINANCIAL STATEMENTS (Continued)
1. Basis of Presentation (Continued)
Fiscal Year
Unless otherwise indicated, references in the Consolidated Financial Statements to fiscal 2013,fiscal 2012, and fiscal 2011 are to our fiscal years ended September 27, 2013, September 28, 2012, andSeptember 30, 2011, respectively. Our fiscal year is a ‘‘52-53 week’’ year ending on the last Friday ofSeptember, such that each quarterly period is 13 weeks in length. For fiscal years in which there are53 weeks, the fourth quarter reporting period will include 14 weeks. Fiscal 2013 and 2012 were each52 weeks in length. Fiscal 2011 was a 53 week year.
Reclassifications
We have reclassified certain items on our Consolidated Financial Statements to conform to thecurrent year presentation.
Company Name Change
In March 2011, our shareholders approved an amendment to our articles of association to changeour name from ‘‘Tyco Electronics Ltd.’’ to ‘‘TE Connectivity Ltd.’’ The name change was effectiveMarch 10, 2011. Our ticker symbol ‘‘TEL’’ on the New York Stock Exchange remained unchanged.
2. Summary of Significant Accounting Policies
Principles of Consolidation
We consolidate entities in which we own or control more than fifty percent of the voting shares orotherwise have the ability to control through similar rights. All intercompany transactions have beeneliminated. The results of companies acquired or disposed of are included on the ConsolidatedFinancial Statements from the effective date of acquisition or up to the date of disposal.
Revenue Recognition
Our revenues are generated principally from the sale of our products. Revenue from the sale ofproducts is recognized at the time title and the risks and rewards of ownership pass to the customer.This generally occurs when the products reach the shipping point, the sales price is fixed anddeterminable, and collection is reasonably assured. For those items where title has not yet transferred,we have deferred the recognition of revenue.
Contract revenues for construction related projects, which are generated in the Network Solutionssegment, are recorded primarily using the percentage-of-completion method. Profits recognized oncontracts in process are based upon estimated contract revenue and related cost to complete.Percentage-of-completion is measured based on the ratio of actual costs incurred to total estimatedcosts. Revisions in cost estimates as contracts progress have the effect of increasing or decreasingprofits in the current period. Provisions for anticipated losses are made in the period in which they firstbecome determinable. In addition, provisions for credit losses related to construction related projectsare recorded as reductions of revenue in the period in which they first become determinable.
We generally warrant that our products will conform to our or mutually agreed to specificationsand that our products will be free from material defects in materials and workmanship for a limitedtime. We limit our warranty to the replacement or repair of defective parts or a refund or credit of the
59

TE CONNECTIVITY LTD.
NOTES TO CONSOLIDATED FINANCIAL STATEMENTS (Continued)
2. Summary of Significant Accounting Policies (Continued)
price of the defective product. We accept returned goods only when the customer makes a verifiedclaim and we have authorized the return. Returns result primarily from defective products or shippingdiscrepancies. A reserve for estimated returns is established at the time of sale based on historicalreturn experience and is recorded as a reduction of sales.
Additionally, certain of our long-term contracts in the Network Solutions segment have warrantyobligations. Estimated warranty costs for each contract are determined based on the contract terms andtechnology-specific considerations. These costs are included in total estimated contract costs and areaccrued over the construction period of the respective contracts under percentage-of-completionaccounting.
We provide certain distributors with an inventory allowance for returns or scrap equal to apercentage of qualified purchases. A reserve for estimated returns and scrap allowances is establishedat the time of the sale, based on a fixed percentage of sales to distributors authorized and agreed to byus, and is recorded as a reduction of sales.
Other allowances include customer quantity and price discrepancies. A reserve for otherallowances is generally established at the time of sale based on historical experience and is recorded asa reduction of sales. We believe we can reasonably and reliably estimate the amounts of futureallowances.
Cash and Cash Equivalents
All highly liquid investments with maturities of three months or less from the time of purchase areconsidered to be cash equivalents.
Allowance for Doubtful Accounts
The allowance for doubtful accounts receivable reflects the best estimate of probable lossesinherent in our outstanding receivables after consideration of aging, known troubled accounts, andother currently available information.
Inventories
Inventories are recorded at the lower of cost or market value using the first-in, first-out costmethod, except for inventoried costs incurred in the performance of long-term contracts primarily bythe Network Solutions segment.
Property, Plant, and Equipment, Net and Long-Lived Assets
Property, plant, and equipment is recorded at cost less accumulated depreciation. Maintenance andrepair expenditures are charged to expense when incurred. Depreciation is calculated using thestraight-line method over the estimated useful lives of the assets, which are 10 to 20 years for landimprovements, 5 to 40 years for buildings and improvements, and 1 to 15 years for machinery andequipment.
We periodically evaluate, when events and circumstances warrant, the net realizable value oflong-lived assets, including property, plant, and equipment and amortizable intangible assets, relying ona number of factors including operating results, business plans, economic projections, and anticipated
60

TE CONNECTIVITY LTD.
NOTES TO CONSOLIDATED FINANCIAL STATEMENTS (Continued)
2. Summary of Significant Accounting Policies (Continued)
future cash flows. When indicators of potential impairment are present, the carrying values of the assetgroup are evaluated in relation to the operating performance and estimated future undiscounted cashflows of the underlying asset group. Impairment of the carrying value of an asset group is recognizedwhenever anticipated future undiscounted cash flows from an asset group are estimated to be less thanits carrying value. The amount of impairment recognized is the difference between the carrying value ofthe asset group and its fair value. Fair value estimates are based on assumptions concerning the amountand timing of estimated future cash flows and discount rates, reflecting varying degrees of perceivedrisk.
Goodwill and Other Intangible Assets
Acquired intangible assets include both indeterminable-lived residual goodwill and determinable-lived identifiable intangible assets. Intangible assets with a determinable life include primarilyintellectual property, consisting of patents, trademarks, and unpatented technology, as well as customerrelationships. Estimates of recoverability range from 1 to 50 years and are generally amortized on astraight-line basis. See Note 9 for additional information regarding intangible assets. An evaluation ofthe remaining useful life of determinable-lived intangible assets is performed on a periodic basis andwhen events and circumstances warrant an evaluation. We assess determinable-lived intangible assetsfor impairment consistent with our policy for assessing other long-lived assets for impairment. Goodwillis assessed for impairment separately from determinable-lived intangible assets by comparing thecarrying value of each reporting unit to its fair value on the first day of the fourth fiscal quarter ofeach year or whenever we believe a triggering event requiring a more frequent assessment hasoccurred. In assessing the existence of a triggering event, management relies on a number ofreporting-unit-specific factors including operating results, business plans, economic projections,anticipated future cash flows, transactions, and market place data. There are inherent uncertaintiesrelated to these factors and management’s judgment in applying these factors to the goodwillimpairment analysis.
At fiscal year end 2013, we had eight reporting units, seven of which contained goodwill. There isone reporting unit in the Transportation Solutions segment, three reporting units in the NetworkSolutions segment, and two reporting units in both the Industrial Solutions and Consumer Solutionssegments. See Note 8 for information regarding goodwill impairment testing. When changes occur inthe composition of one or more reporting units, goodwill is reassigned to the reporting units affectedbased on their relative fair values.
When testing for goodwill impairment, we perform a step I goodwill impairment test to identify apotential impairment. In doing so, we compare the fair value of a reporting unit with its carryingamount. If the carrying amount of a reporting unit exceeds its fair value, goodwill may be impaired anda step II goodwill impairment test is performed to measure the amount of impairment, if any. In thestep II goodwill impairment test, we compare the implied fair value of reporting unit goodwill with thecarrying amount of that goodwill. If the carrying amount of reporting unit goodwill exceeds the impliedfair value of that goodwill, an impairment loss is recognized in an amount equal to the excess. Theimplied fair value of goodwill is determined in a manner consistent with how goodwill is recognized ina business combination. We allocate the fair value of a reporting unit to all of the assets and liabilitiesof that unit, including intangible assets, as if the reporting unit had been acquired in a businesscombination. Any excess of the fair value of a reporting unit over the amounts assigned to its assetsand liabilities is the implied fair value of goodwill.
61
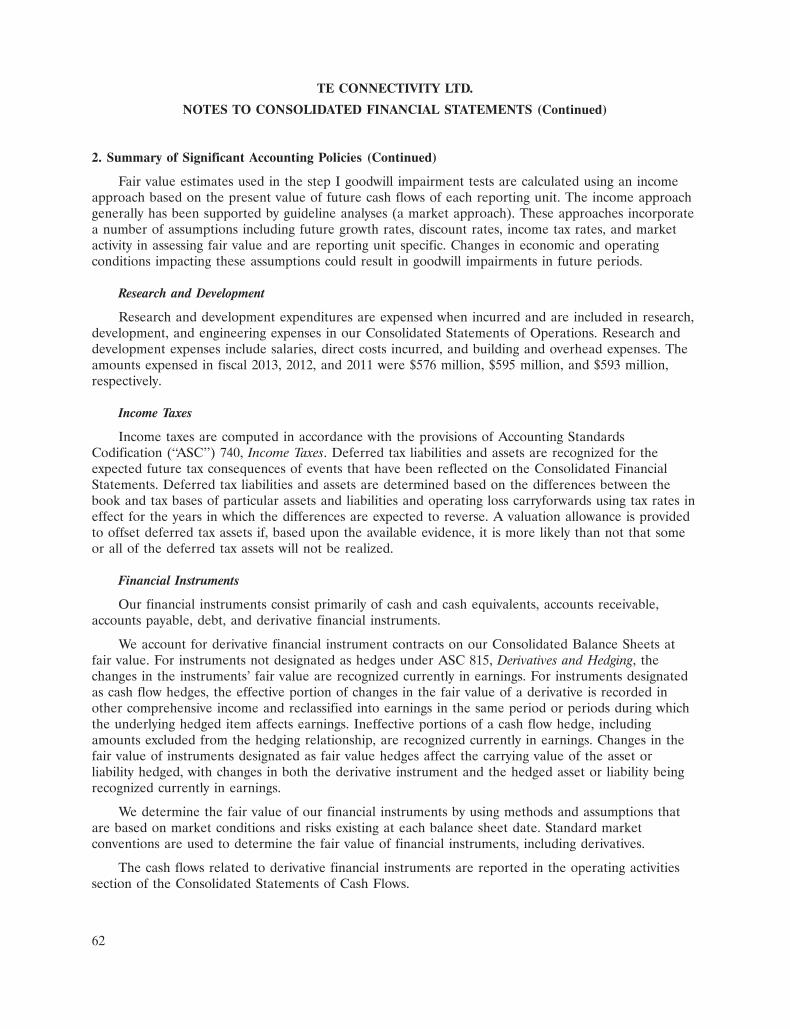
TE CONNECTIVITY LTD.
NOTES TO CONSOLIDATED FINANCIAL STATEMENTS (Continued)
2. Summary of Significant Accounting Policies (Continued)
Fair value estimates used in the step I goodwill impairment tests are calculated using an incomeapproach based on the present value of future cash flows of each reporting unit. The income approachgenerally has been supported by guideline analyses (a market approach). These approaches incorporatea number of assumptions including future growth rates, discount rates, income tax rates, and marketactivity in assessing fair value and are reporting unit specific. Changes in economic and operatingconditions impacting these assumptions could result in goodwill impairments in future periods.
Research and Development
Research and development expenditures are expensed when incurred and are included in research,development, and engineering expenses in our Consolidated Statements of Operations. Research anddevelopment expenses include salaries, direct costs incurred, and building and overhead expenses. Theamounts expensed in fiscal 2013, 2012, and 2011 were $576 million, $595 million, and $593 million,respectively.
Income Taxes
Income taxes are computed in accordance with the provisions of Accounting StandardsCodification (‘‘ASC’’) 740, Income Taxes. Deferred tax liabilities and assets are recognized for theexpected future tax consequences of events that have been reflected on the Consolidated FinancialStatements. Deferred tax liabilities and assets are determined based on the differences between thebook and tax bases of particular assets and liabilities and operating loss carryforwards using tax rates ineffect for the years in which the differences are expected to reverse. A valuation allowance is providedto offset deferred tax assets if, based upon the available evidence, it is more likely than not that someor all of the deferred tax assets will not be realized.
Financial Instruments
Our financial instruments consist primarily of cash and cash equivalents, accounts receivable,accounts payable, debt, and derivative financial instruments.
We account for derivative financial instrument contracts on our Consolidated Balance Sheets atfair value. For instruments not designated as hedges under ASC 815, Derivatives and Hedging, thechanges in the instruments’ fair value are recognized currently in earnings. For instruments designatedas cash flow hedges, the effective portion of changes in the fair value of a derivative is recorded inother comprehensive income and reclassified into earnings in the same period or periods during whichthe underlying hedged item affects earnings. Ineffective portions of a cash flow hedge, includingamounts excluded from the hedging relationship, are recognized currently in earnings. Changes in thefair value of instruments designated as fair value hedges affect the carrying value of the asset orliability hedged, with changes in both the derivative instrument and the hedged asset or liability beingrecognized currently in earnings.
We determine the fair value of our financial instruments by using methods and assumptions thatare based on market conditions and risks existing at each balance sheet date. Standard marketconventions are used to determine the fair value of financial instruments, including derivatives.
The cash flows related to derivative financial instruments are reported in the operating activitiessection of the Consolidated Statements of Cash Flows.
62

TE CONNECTIVITY LTD.
NOTES TO CONSOLIDATED FINANCIAL STATEMENTS (Continued)
2. Summary of Significant Accounting Policies (Continued)
Our derivative financial instruments present certain market and counterparty risks. Concentrationof counterparty risk is mitigated, however, as we deal with financial institutions worldwide, substantiallyall of which have long-term Standard & Poor’s, Moody’s, and/or Fitch credit ratings of A/A2 or higher.In addition, only conventional derivative financial instruments are utilized. We are exposed to potentiallosses if a counterparty fails to perform according to the terms of its agreement. With respect tocounterparty net asset positions recognized at September 27, 2013, we have assessed the likelihood ofcounterparty default as remote. We currently provide guarantees from a wholly-owned subsidiary to thecounterparties to our commodity swap derivatives. The likelihood of performance on those guaranteeshas been assessed as remote. For all other derivative financial instruments, we are not required toprovide, nor do we require counterparties to provide, collateral or other security.
See Note 14 for additional information regarding derivative financial instruments.
Fair Value Measurements
ASC 820, Fair Value Measurements and Disclosures, specifies a fair value hierarchy based upon theobservable inputs utilized in valuation of certain assets and liabilities. Observable inputs (highest level)reflect market data obtained from independent sources, while unobservable inputs (lowest level) reflectinternally developed market assumptions. Fair value measurements are classified under the followinghierarchy:
• Level 1. Quoted prices in active markets for identical assets and liabilities.
• Level 2. Quoted prices in active markets for similar assets and liabilities, or other inputs that areobservable for the asset or liability, either directly or indirectly, for substantially the full term ofthe asset or liability.
• Level 3. Unobservable inputs that are supported by little or no market activity and that aresignificant to the fair value of the assets and liabilities. This includes certain pricing models,discounted cash flows methodologies, and similar techniques that use significant unobservableinputs.
The following is a description of the valuation methodologies used for the respective financialassets and liabilities measured at fair value on a recurring basis:
• Commodity swap contracts. Fair value of these assets and liabilities is determined using quotedprices on futures exchanges (level 1).
• Interest rate swaps and swaptions. Fair value of these assets and liabilities is determined based onobservable inputs other than quoted prices. The positions are primarily valued using marketapproach models that use readily observable interest rates as their basis (level 2).
• Investment swap contracts. Fair value of these assets is determined based on observable inputsother than quoted prices. The positions are primarily valued using market approach models thatuse readily observable equity returns as their basis (level 2).
• Foreign currency contracts. Fair value of these assets and liabilities is determined using themarket approach. Values are based on observable market transactions of spot and forwardcurrency rates (level 2).
63
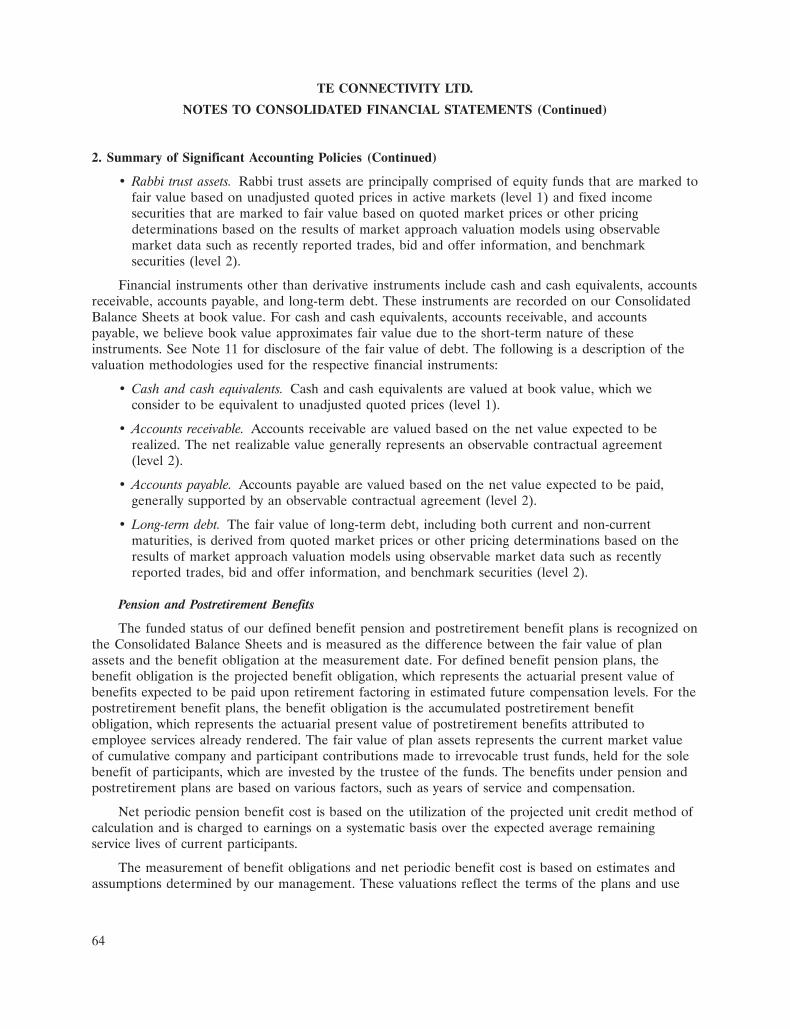
TE CONNECTIVITY LTD.
NOTES TO CONSOLIDATED FINANCIAL STATEMENTS (Continued)
2. Summary of Significant Accounting Policies (Continued)
• Rabbi trust assets. Rabbi trust assets are principally comprised of equity funds that are marked tofair value based on unadjusted quoted prices in active markets (level 1) and fixed incomesecurities that are marked to fair value based on quoted market prices or other pricingdeterminations based on the results of market approach valuation models using observablemarket data such as recently reported trades, bid and offer information, and benchmarksecurities (level 2).
Financial instruments other than derivative instruments include cash and cash equivalents, accountsreceivable, accounts payable, and long-term debt. These instruments are recorded on our ConsolidatedBalance Sheets at book value. For cash and cash equivalents, accounts receivable, and accountspayable, we believe book value approximates fair value due to the short-term nature of theseinstruments. See Note 11 for disclosure of the fair value of debt. The following is a description of thevaluation methodologies used for the respective financial instruments:
• Cash and cash equivalents. Cash and cash equivalents are valued at book value, which weconsider to be equivalent to unadjusted quoted prices (level 1).
• Accounts receivable. Accounts receivable are valued based on the net value expected to berealized. The net realizable value generally represents an observable contractual agreement(level 2).
• Accounts payable. Accounts payable are valued based on the net value expected to be paid,generally supported by an observable contractual agreement (level 2).
• Long-term debt. The fair value of long-term debt, including both current and non-currentmaturities, is derived from quoted market prices or other pricing determinations based on theresults of market approach valuation models using observable market data such as recentlyreported trades, bid and offer information, and benchmark securities (level 2).
Pension and Postretirement Benefits
The funded status of our defined benefit pension and postretirement benefit plans is recognized onthe Consolidated Balance Sheets and is measured as the difference between the fair value of planassets and the benefit obligation at the measurement date. For defined benefit pension plans, thebenefit obligation is the projected benefit obligation, which represents the actuarial present value ofbenefits expected to be paid upon retirement factoring in estimated future compensation levels. For thepostretirement benefit plans, the benefit obligation is the accumulated postretirement benefitobligation, which represents the actuarial present value of postretirement benefits attributed toemployee services already rendered. The fair value of plan assets represents the current market valueof cumulative company and participant contributions made to irrevocable trust funds, held for the solebenefit of participants, which are invested by the trustee of the funds. The benefits under pension andpostretirement plans are based on various factors, such as years of service and compensation.
Net periodic pension benefit cost is based on the utilization of the projected unit credit method ofcalculation and is charged to earnings on a systematic basis over the expected average remainingservice lives of current participants.
The measurement of benefit obligations and net periodic benefit cost is based on estimates andassumptions determined by our management. These valuations reflect the terms of the plans and use
64

TE CONNECTIVITY LTD.
NOTES TO CONSOLIDATED FINANCIAL STATEMENTS (Continued)
2. Summary of Significant Accounting Policies (Continued)
participant-specific information such as compensation, age, and years of service, as well as certainassumptions, including estimates of discount rates, expected return on plan assets, rate of compensationincreases, interest crediting rates, and mortality rates.
Share-Based Compensation
We determine the fair value of share awards on the date of grant. Share options are valued usingthe Black-Scholes-Merton valuation model; restricted share awards and performance awards are valuedusing our end-of-day share price on the date of grant. That fair value is expensed ratably over theexpected service period, with an allowance made for estimated forfeitures based on historical employeeactivity. Estimates regarding the attainment of performance criteria are periodically reviewed; thecumulative impact of a change in estimate regarding the attainment of performance criteria is recordedin the period in which that change is made. See Note 22 for additional information related to share-based compensation.
Earnings Per Share
Basic earnings per share attributable to TE Connectivity Ltd. is computed by dividing net incomeattributable to TE Connectivity Ltd. by the basic weighted-average number of common sharesoutstanding. Diluted earnings per share attributable to TE Connectivity Ltd. is computed by dividingnet income attributable to TE Connectivity Ltd. by the weighted-average number of common sharesoutstanding adjusted for the potentially dilutive impact of share-based compensation arrangements.
Currency Translation
For our non-U.S. Dollar functional currency subsidiaries, assets and liabilities are translated intoU.S. Dollars using fiscal year end exchange rates. Sales and expenses are translated at average monthlyexchange rates. Foreign currency translation gains and losses are included as a component ofaccumulated other comprehensive income within equity.
Gains and losses resulting from foreign currency transactions, which are included in earnings, wereimmaterial amounts in fiscal 2013 and 2011. Such gains were $18 million during fiscal 2012.
Restructuring Charges
Restructuring activities involve employee-related termination costs, facility exit costs, and assetimpairments resulting from reductions-in-force, migration of facilities or product lines from higher-costto lower-cost countries, or consolidation of facilities within countries. We recognize termination costsbased on requirements established per severance policy, government law, or previous actions. Facilityexit costs generally reflect the cost to terminate a facility lease before the end of its term (measured atfair value at the time we cease using the facility) or costs that will continue to be incurred under thefacility lease without future economic benefit to us. Restructuring activities often result in the disposalor abandonment of assets that require an acceleration of depreciation or impairment reflecting theexcess of the assets’ carrying values over fair value.
The recognition of restructuring costs require that we make certain judgments and estimatesregarding the nature, timing, and amount of costs associated with the planned exit activity. To theextent our actual results differ from our estimates and assumptions, we may be required to revise the
65

TE CONNECTIVITY LTD.
NOTES TO CONSOLIDATED FINANCIAL STATEMENTS (Continued)
2. Summary of Significant Accounting Policies (Continued)
estimated liabilities, requiring the recognition of additional restructuring costs or the reduction ofliabilities already recognized. At the end of each reporting period, we evaluate the remaining accruedbalances to ensure these balances are properly stated and the utilization of the reserves are for theirintended purpose in accordance with developed exit plans. See Note 3 for additional information onrestructuring activities.
Acquisitions
We account for acquired businesses using the acquisition method of accounting. This methodrequires, among other things, that most assets acquired and liabilities assumed be recognized at fairvalue as of the acquisition date. We allocate the purchase price of acquired businesses to the tangibleand intangible assets acquired and liabilities assumed based on the estimated fair values, or as requiredby ASC 805, Business Combinations. The excess of the purchase price over the identifiable assetsacquired and liabilities assumed is recorded as goodwill. We may engage independent third-partyappraisal firms to assist us in determining the fair values of assets acquired and liabilities assumed.Such valuations require management to make significant estimates and assumptions, especially withrespect to intangible assets.
Contingent Liabilities
We record a loss contingency when the available information indicates it is probable that we haveincurred a liability and the amount of the loss is reasonably estimable. When a range of possible losseswith equal likelihood exists, we record the low end of the range. The likelihood of a loss with respectto a particular contingency is often difficult to predict, and determining a meaningful estimate of theloss or a range of loss may not be practicable based on information available. In addition, it is notuncommon for such matters to be resolved over many years, during which time relevant developmentsand new information must continuously be evaluated to determine whether a loss is probable and areasonable estimate of that loss can be made. When a loss is probable but a reasonable estimate cannotbe made, or when a loss is at least reasonably possible, disclosure is provided.
3. Restructuring and Other Charges, Net
Restructuring and other charges consisted of the following:
Fiscal
2013 2012 2011
(in millions)
Restructuring charges, net . . . . . . . . . . . . . . . . . . . . . . . . . . . $314 $128 $136Gain on divestitures, net . . . . . . . . . . . . . . . . . . . . . . . . . . . . . (3) — —
$311 $128 $136
66

TE CONNECTIVITY LTD.
NOTES TO CONSOLIDATED FINANCIAL STATEMENTS (Continued)
3. Restructuring and Other Charges, Net (Continued)
Restructuring Charges, Net
Net restructuring charges by segment were as follows:
Fiscal
2013 2012 2011
(in millions)
Transportation Solutions . . . . . . . . . . . . . . . . . . . . . . . . . . . . . $ 38 $ 18 $(13)Network Solutions . . . . . . . . . . . . . . . . . . . . . . . . . . . . . . . . . 129 59 90Industrial Solutions . . . . . . . . . . . . . . . . . . . . . . . . . . . . . . . . 61 28 24Consumer Solutions . . . . . . . . . . . . . . . . . . . . . . . . . . . . . . . . 86 23 35
Restructuring charges, net . . . . . . . . . . . . . . . . . . . . . . . . . . . $314 $128 $136
67

TE CONNECTIVITY LTD.
NOTES TO CONSOLIDATED FINANCIAL STATEMENTS (Continued)
3. Restructuring and Other Charges, Net (Continued)
Activity in our restructuring reserves is summarized as follows:
Balance at Balance atBeginning Currency Endof Fiscal Changes in Cash Non-Cash Translation of Fiscal
Year Charges Estimate Payments Items and Other Year
(in millions)
Fiscal 2013 Activity:Fiscal 2013 Actions:
Employee severance . . . . . . . . . $ — $253 $ (8) $ (79) $ — $ 2 $168Facility and other exit costs . . . . — 5 — (4) — — 1Property, plant, and equipment . — 58 — — (58) — —
Total . . . . . . . . . . . . . . . . . . . — 316 (8) (83) (58) 2 169
Fiscal 2012 Actions:Employee severance . . . . . . . . . 79 7 (10) (43) — 2 35Facility and other exit costs . . . . 2 1 — (3) — — —Property, plant, and equipment . — 26 — — (26) — —
Total . . . . . . . . . . . . . . . . . . . 81 34 (10) (46) (26) 2 35
Fiscal 2011 Actions:Employee severance . . . . . . . . . 32 — (16) (9) — 1 8Facility and other exit costs . . . . 2 2 — (2) — — 2
Total . . . . . . . . . . . . . . . . . . . 34 2 (16) (11) — 1 10
Pre-Fiscal 2011 Actions:Employee severance . . . . . . . . . 19 — (5) (6) — — 8Facility and other exit costs . . . . 27 1 — (5) — 1 24
Total . . . . . . . . . . . . . . . . . . . 46 1 (5) (11) — 1 32
Total fiscal 2013 activity . . . . . . . . $161 $353 $(39) $(151) $(84) $ 6 $246
Fiscal 2012 Activity:Fiscal 2012 Actions:
Employee severance . . . . . . . . . $ — $128 $ (3) $ (46) $ — $— $ 79Facility and other exit costs . . . . — 3 — (1) — — 2Property, plant, and equipment . — 1 — — (1) — —
Total . . . . . . . . . . . . . . . . . . . — 132 (3) (47) (1) — 81
Fiscal 2011 Actions:Employee severance . . . . . . . . . 104 6 (14) (61) — (3) 32Facility and other exit costs . . . . 5 3 (1) (5) — — 2
Total . . . . . . . . . . . . . . . . . . . 109 9 (15) (66) — (3) 34
Pre-Fiscal 2011 Actions:Employee severance . . . . . . . . . 33 3 (1) (15) — (1) 19Facility and other exit costs . . . . 33 4 (1) (9) — — 27
Total . . . . . . . . . . . . . . . . . . . 66 7 (2) (24) — (1) 46
Total fiscal 2012 activity . . . . . . . . $175 $148 $(20) $(137) $ (1) $(4) $161
68
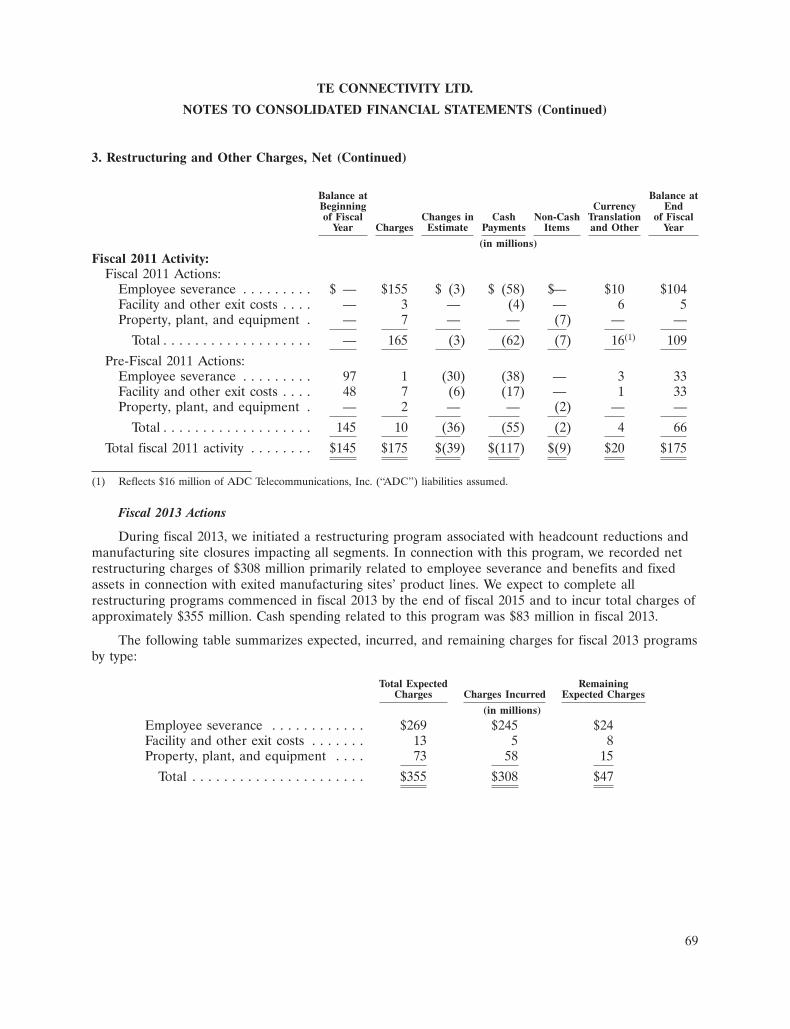
TE CONNECTIVITY LTD.
NOTES TO CONSOLIDATED FINANCIAL STATEMENTS (Continued)
3. Restructuring and Other Charges, Net (Continued)
Balance at Balance atBeginning Currency Endof Fiscal Changes in Cash Non-Cash Translation of Fiscal
Year Charges Estimate Payments Items and Other Year
(in millions)
Fiscal 2011 Activity:Fiscal 2011 Actions:
Employee severance . . . . . . . . . $ — $155 $ (3) $ (58) $— $10 $104Facility and other exit costs . . . . — 3 — (4) — 6 5Property, plant, and equipment . — 7 — — (7) — —
Total . . . . . . . . . . . . . . . . . . . — 165 (3) (62) (7) 16(1) 109
Pre-Fiscal 2011 Actions:Employee severance . . . . . . . . . 97 1 (30) (38) — 3 33Facility and other exit costs . . . . 48 7 (6) (17) — 1 33Property, plant, and equipment . — 2 — — (2) — —
Total . . . . . . . . . . . . . . . . . . . 145 10 (36) (55) (2) 4 66
Total fiscal 2011 activity . . . . . . . . $145 $175 $(39) $(117) $(9) $20 $175
(1) Reflects $16 million of ADC Telecommunications, Inc. (‘‘ADC’’) liabilities assumed.
Fiscal 2013 Actions
During fiscal 2013, we initiated a restructuring program associated with headcount reductions andmanufacturing site closures impacting all segments. In connection with this program, we recorded netrestructuring charges of $308 million primarily related to employee severance and benefits and fixedassets in connection with exited manufacturing sites’ product lines. We expect to complete allrestructuring programs commenced in fiscal 2013 by the end of fiscal 2015 and to incur total charges ofapproximately $355 million. Cash spending related to this program was $83 million in fiscal 2013.
The following table summarizes expected, incurred, and remaining charges for fiscal 2013 programsby type:
Total Expected RemainingCharges Charges Incurred Expected Charges
(in millions)
Employee severance . . . . . . . . . . . . $269 $245 $24Facility and other exit costs . . . . . . . 13 5 8Property, plant, and equipment . . . . 73 58 15
Total . . . . . . . . . . . . . . . . . . . . . . $355 $308 $47
69
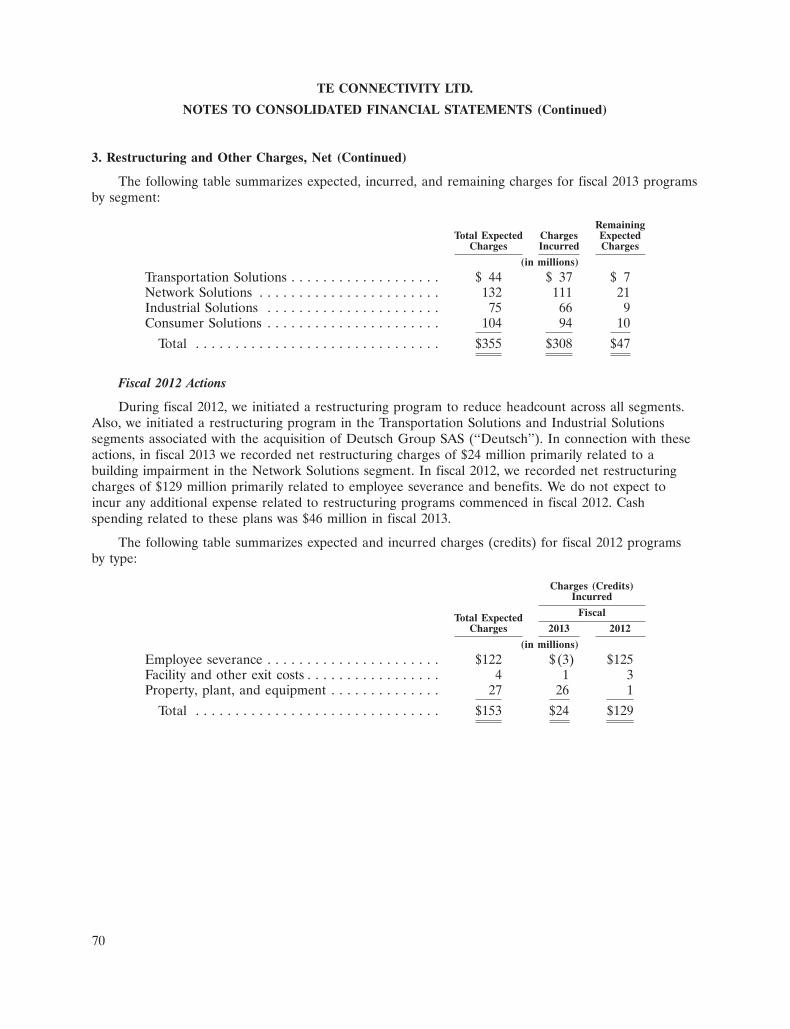
TE CONNECTIVITY LTD.
NOTES TO CONSOLIDATED FINANCIAL STATEMENTS (Continued)
3. Restructuring and Other Charges, Net (Continued)
The following table summarizes expected, incurred, and remaining charges for fiscal 2013 programsby segment:
RemainingTotal Expected Charges Expected
Charges Incurred Charges
(in millions)
Transportation Solutions . . . . . . . . . . . . . . . . . . . $ 44 $ 37 $ 7Network Solutions . . . . . . . . . . . . . . . . . . . . . . . 132 111 21Industrial Solutions . . . . . . . . . . . . . . . . . . . . . . 75 66 9Consumer Solutions . . . . . . . . . . . . . . . . . . . . . . 104 94 10
Total . . . . . . . . . . . . . . . . . . . . . . . . . . . . . . . $355 $308 $47
Fiscal 2012 Actions
During fiscal 2012, we initiated a restructuring program to reduce headcount across all segments.Also, we initiated a restructuring program in the Transportation Solutions and Industrial Solutionssegments associated with the acquisition of Deutsch Group SAS (‘‘Deutsch’’). In connection with theseactions, in fiscal 2013 we recorded net restructuring charges of $24 million primarily related to abuilding impairment in the Network Solutions segment. In fiscal 2012, we recorded net restructuringcharges of $129 million primarily related to employee severance and benefits. We do not expect toincur any additional expense related to restructuring programs commenced in fiscal 2012. Cashspending related to these plans was $46 million in fiscal 2013.
The following table summarizes expected and incurred charges (credits) for fiscal 2012 programsby type:
Charges (Credits)Incurred
FiscalTotal ExpectedCharges 2013 2012
(in millions)
Employee severance . . . . . . . . . . . . . . . . . . . . . . $122 $(3) $125Facility and other exit costs . . . . . . . . . . . . . . . . . 4 1 3Property, plant, and equipment . . . . . . . . . . . . . . 27 26 1
Total . . . . . . . . . . . . . . . . . . . . . . . . . . . . . . . $153 $24 $129
70
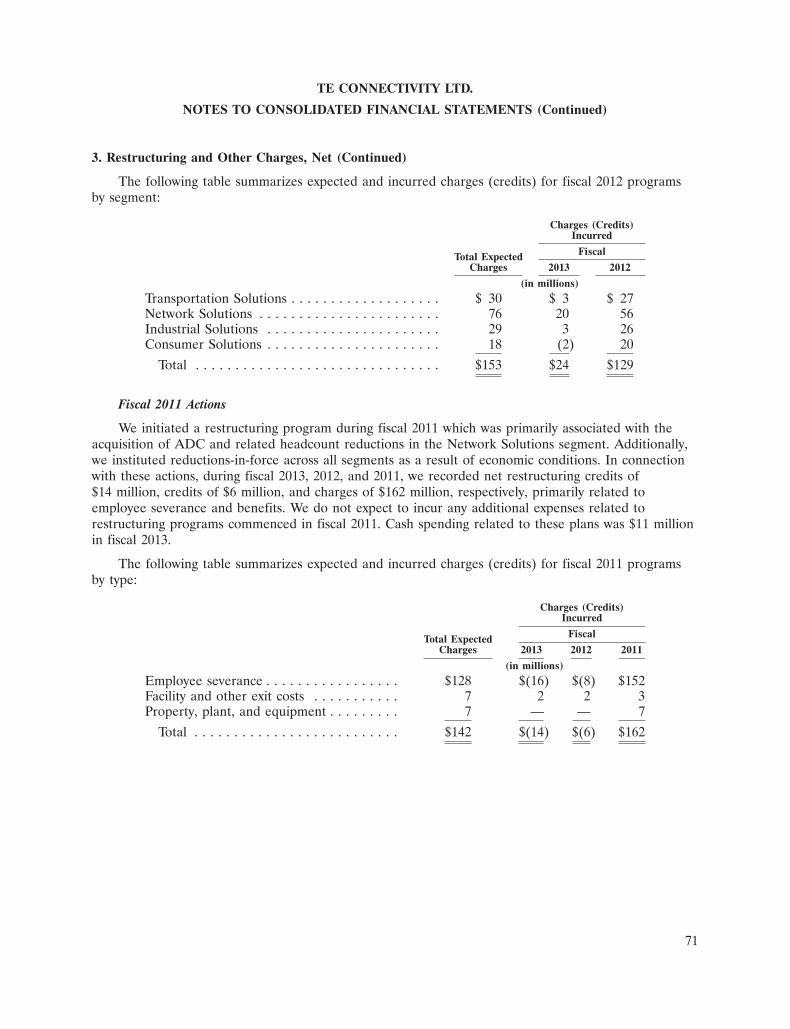
TE CONNECTIVITY LTD.
NOTES TO CONSOLIDATED FINANCIAL STATEMENTS (Continued)
3. Restructuring and Other Charges, Net (Continued)
The following table summarizes expected and incurred charges (credits) for fiscal 2012 programsby segment:
Charges (Credits)Incurred
FiscalTotal ExpectedCharges 2013 2012
(in millions)
Transportation Solutions . . . . . . . . . . . . . . . . . . . $ 30 $ 3 $ 27Network Solutions . . . . . . . . . . . . . . . . . . . . . . . 76 20 56Industrial Solutions . . . . . . . . . . . . . . . . . . . . . . 29 3 26Consumer Solutions . . . . . . . . . . . . . . . . . . . . . . 18 (2) 20
Total . . . . . . . . . . . . . . . . . . . . . . . . . . . . . . . $153 $24 $129
Fiscal 2011 Actions
We initiated a restructuring program during fiscal 2011 which was primarily associated with theacquisition of ADC and related headcount reductions in the Network Solutions segment. Additionally,we instituted reductions-in-force across all segments as a result of economic conditions. In connectionwith these actions, during fiscal 2013, 2012, and 2011, we recorded net restructuring credits of$14 million, credits of $6 million, and charges of $162 million, respectively, primarily related toemployee severance and benefits. We do not expect to incur any additional expenses related torestructuring programs commenced in fiscal 2011. Cash spending related to these plans was $11 millionin fiscal 2013.
The following table summarizes expected and incurred charges (credits) for fiscal 2011 programsby type:
Charges (Credits)Incurred
FiscalTotal ExpectedCharges 2013 2012 2011
(in millions)
Employee severance . . . . . . . . . . . . . . . . . $128 $(16) $(8) $152Facility and other exit costs . . . . . . . . . . . 7 2 2 3Property, plant, and equipment . . . . . . . . . 7 — — 7
Total . . . . . . . . . . . . . . . . . . . . . . . . . . $142 $(14) $(6) $162
71

TE CONNECTIVITY LTD.
NOTES TO CONSOLIDATED FINANCIAL STATEMENTS (Continued)
3. Restructuring and Other Charges, Net (Continued)
The following table summarizes expected and incurred charges (credits) for fiscal 2011 programsby segment:
Charges (Credits)Incurred
FiscalTotal ExpectedCharges 2013 2012 2011
(in millions)
Transportation Solutions . . . . . . . . . . . . . . $ 2 $ — $(6) $ 8Network Solutions . . . . . . . . . . . . . . . . . . 89 (2) 1 90Industrial Solutions . . . . . . . . . . . . . . . . . 23 (7) (2) 32Consumer Solutions . . . . . . . . . . . . . . . . . 28 (5) 1 32
Total . . . . . . . . . . . . . . . . . . . . . . . . . . $142 $(14) $(6) $162
Pre-Fiscal 2011 Actions
We initiated a restructuring program during fiscal 2010 primarily related to headcount reductionsin the Transportation Solutions segment. During fiscal 2009, we initiated a restructuring programprimarily related to headcount reductions and manufacturing site closures across all segments inresponse to economic conditions and implementation of our manufacturing simplification plan. Also,we initiated a restructuring program during fiscal 2008 primarily relating to the migration of productlines to lower-cost countries and the exit of certain manufacturing operations in the TransportationSolutions and Network Solutions segments. We have completed all restructuring programs commencedin fiscal 2010, 2009, and 2008.
In connection with these actions, during fiscal 2013, 2012, and 2011, we recorded net restructuringcredits of $4 million, charges of $5 million, and credits of $26 million, respectively. The credits in fiscal2011 related primarily to decreases in planned employee headcount reductions associated with theIndustrial Solutions and Transportation Solutions segments. Cash spending related to pre-fiscal 2011actions was $11 million in fiscal 2013.
Total Restructuring Reserves
Restructuring reserves included on our Consolidated Balance Sheets were as follows:
FiscalYear End
2013 2012
(in millions)
Accrued and other current liabilities . . . . . . . . . . . . . . . . . . . . . . . . . $168 $118Other liabilities . . . . . . . . . . . . . . . . . . . . . . . . . . . . . . . . . . . . . . . . 78 43
Restructuring reserves . . . . . . . . . . . . . . . . . . . . . . . . . . . . . . . . . . . . $246 $161
72
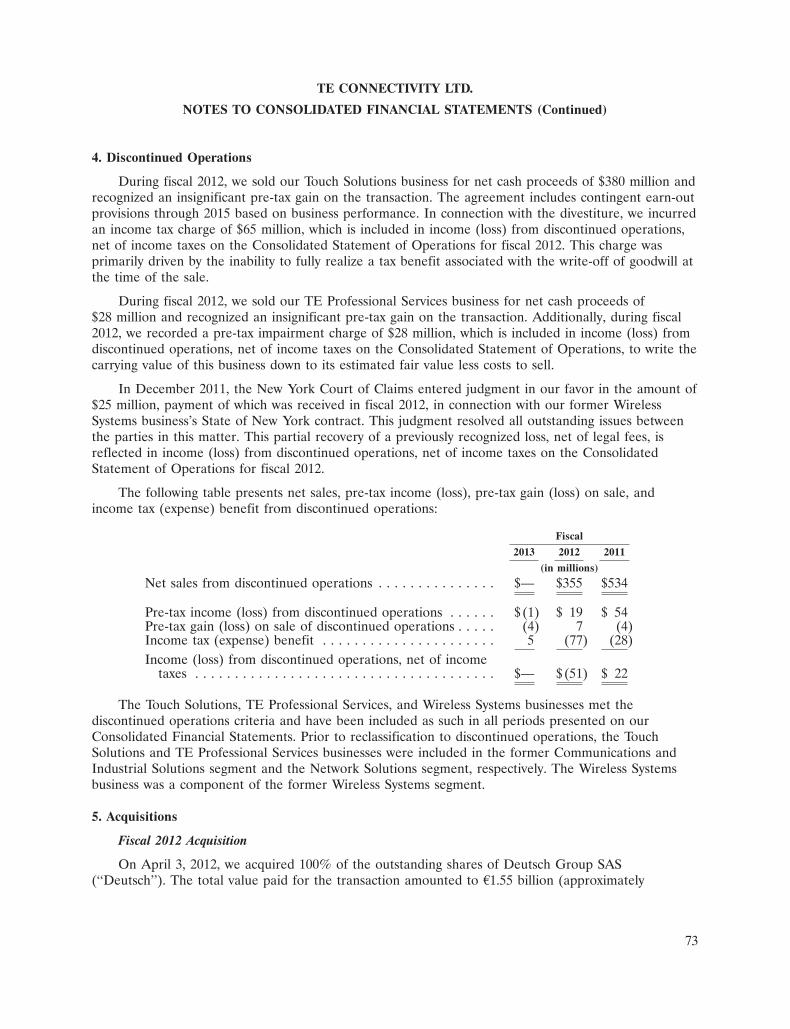
TE CONNECTIVITY LTD.
NOTES TO CONSOLIDATED FINANCIAL STATEMENTS (Continued)
4. Discontinued Operations
During fiscal 2012, we sold our Touch Solutions business for net cash proceeds of $380 million andrecognized an insignificant pre-tax gain on the transaction. The agreement includes contingent earn-outprovisions through 2015 based on business performance. In connection with the divestiture, we incurredan income tax charge of $65 million, which is included in income (loss) from discontinued operations,net of income taxes on the Consolidated Statement of Operations for fiscal 2012. This charge wasprimarily driven by the inability to fully realize a tax benefit associated with the write-off of goodwill atthe time of the sale.
During fiscal 2012, we sold our TE Professional Services business for net cash proceeds of$28 million and recognized an insignificant pre-tax gain on the transaction. Additionally, during fiscal2012, we recorded a pre-tax impairment charge of $28 million, which is included in income (loss) fromdiscontinued operations, net of income taxes on the Consolidated Statement of Operations, to write thecarrying value of this business down to its estimated fair value less costs to sell.
In December 2011, the New York Court of Claims entered judgment in our favor in the amount of$25 million, payment of which was received in fiscal 2012, in connection with our former WirelessSystems business’s State of New York contract. This judgment resolved all outstanding issues betweenthe parties in this matter. This partial recovery of a previously recognized loss, net of legal fees, isreflected in income (loss) from discontinued operations, net of income taxes on the ConsolidatedStatement of Operations for fiscal 2012.
The following table presents net sales, pre-tax income (loss), pre-tax gain (loss) on sale, andincome tax (expense) benefit from discontinued operations:
Fiscal
2013 2012 2011
(in millions)
Net sales from discontinued operations . . . . . . . . . . . . . . . $— $355 $534
Pre-tax income (loss) from discontinued operations . . . . . . $ (1) $ 19 $ 54Pre-tax gain (loss) on sale of discontinued operations . . . . . (4) 7 (4)Income tax (expense) benefit . . . . . . . . . . . . . . . . . . . . . . 5 (77) (28)Income (loss) from discontinued operations, net of income
taxes . . . . . . . . . . . . . . . . . . . . . . . . . . . . . . . . . . . . . . $— $(51) $ 22
The Touch Solutions, TE Professional Services, and Wireless Systems businesses met thediscontinued operations criteria and have been included as such in all periods presented on ourConsolidated Financial Statements. Prior to reclassification to discontinued operations, the TouchSolutions and TE Professional Services businesses were included in the former Communications andIndustrial Solutions segment and the Network Solutions segment, respectively. The Wireless Systemsbusiness was a component of the former Wireless Systems segment.
5. Acquisitions
Fiscal 2012 Acquisition
On April 3, 2012, we acquired 100% of the outstanding shares of Deutsch Group SAS(‘‘Deutsch’’). The total value paid for the transaction amounted to A1.55 billion (approximately
73

TE CONNECTIVITY LTD.
NOTES TO CONSOLIDATED FINANCIAL STATEMENTS (Continued)
5. Acquisitions (Continued)
$2.05 billion using an exchange rate of $1.33 per A1.00), net of cash acquired. The total value paidincluded $659 million related to the repayment of Deutsch’s financial debt and accrued interest.Deutsch is a global leader in high-performance connectors for harsh environments, and significantlyexpands our product portfolio and enables us to better serve customers in the industrial andcommercial transportation; aerospace, defense, and marine; and rail markets. We realized cost savingsand other synergies through operational efficiencies. The acquired Deutsch businesses have beenreported in the Transportation Solutions and Industrial Solutions segments from the date of acquisition.
During fiscal 2012, we finalized the valuation of the identifiable assets acquired and liabilitiesassumed. The following table summarizes the allocation of the purchase price to the fair value ofidentifiable assets acquired and liabilities assumed at the date of acquisition, in accordance with theacquisition method of accounting:
(in millions)
Cash and cash equivalents . . . . . . . . . . . . . . . . . . . . . . . . . . . . . . . . . . $ 152Other current assets . . . . . . . . . . . . . . . . . . . . . . . . . . . . . . . . . . . . . . 330Property, plant, and equipment . . . . . . . . . . . . . . . . . . . . . . . . . . . . . . 131Goodwill . . . . . . . . . . . . . . . . . . . . . . . . . . . . . . . . . . . . . . . . . . . . . . . 1,042Intangible assets . . . . . . . . . . . . . . . . . . . . . . . . . . . . . . . . . . . . . . . . . 827Other long-term assets . . . . . . . . . . . . . . . . . . . . . . . . . . . . . . . . . . . . . 11
Total assets acquired . . . . . . . . . . . . . . . . . . . . . . . . . . . . . . . . . . . . 2,493Current maturities of long-term debt . . . . . . . . . . . . . . . . . . . . . . . . . . 642Other current liabilities . . . . . . . . . . . . . . . . . . . . . . . . . . . . . . . . . . . . 143Deferred income taxes . . . . . . . . . . . . . . . . . . . . . . . . . . . . . . . . . . . . . 148Other long-term liabilities . . . . . . . . . . . . . . . . . . . . . . . . . . . . . . . . . . 24
Total liabilities assumed . . . . . . . . . . . . . . . . . . . . . . . . . . . . . . . . . . 957Net assets acquired . . . . . . . . . . . . . . . . . . . . . . . . . . . . . . . . . . . . . 1,536
Cash and cash equivalents acquired . . . . . . . . . . . . . . . . . . . . . . . . . . . (152)Net cash paid . . . . . . . . . . . . . . . . . . . . . . . . . . . . . . . . . . . . . . . . . $1,384
Other current assets primarily consisted of inventories of $189 million and trade accountsreceivable of $121 million. Other current liabilities primarily consisted of accrued and other currentliabilities of $76 million and trade accounts payable of $56 million.
The fair values assigned to intangible assets were determined through the use of the incomeapproach, specifically the relief from royalty and the multi-period excess earnings methods. Bothvaluation methods rely on management judgment, including expected future cash flows resulting fromexisting customer relationships, customer attrition rates, contributory effects of other assets utilized inthe business, peer group cost of capital and royalty rates, and other factors. The valuation of tangibleassets was derived using a combination of the income, market, and cost approaches. Significantjudgments used in valuing tangible assets include estimated reproduction or replacement cost, usefullives of assets, estimated selling prices, costs to complete, and reasonable profit. Useful lives forintangible assets were determined based upon the remaining useful economic lives of the intangibleassets that are expected to contribute directly or indirectly to future cash flows.
74

TE CONNECTIVITY LTD.
NOTES TO CONSOLIDATED FINANCIAL STATEMENTS (Continued)
5. Acquisitions (Continued)
Intangible assets acquired consisted of the following:
Weighted-AverageAmortization
Amount Period
(in millions) (in years)
Customer relationships . . . . . . . . . . . . . . . . . . . . . . . . $490 15Developed technology . . . . . . . . . . . . . . . . . . . . . . . . . 165 12Trade names and trademarks . . . . . . . . . . . . . . . . . . . . 150 20Customer order backlog . . . . . . . . . . . . . . . . . . . . . . . 22 < 1
Total . . . . . . . . . . . . . . . . . . . . . . . . . . . . . . . . . . . . . $827 15
The acquired intangible assets are being amortized on a straight-line basis over their expectedlives.
Goodwill of $1,042 million was recognized in the transaction, representing the excess of thepurchase price over the fair value of the tangible and intangible assets acquired and liabilities assumed.This goodwill is attributable primarily to cost savings and other synergies related to operationalefficiencies including the consolidation of manufacturing, marketing, and general and administrativefunctions. The goodwill has been allocated to the Transportation Solutions and Industrial Solutionssegments and is not deductible for tax purposes. However, prior to its merger with us, Deutschcompleted certain acquisitions that resulted in approximately $215 million of goodwill that is deductibleprimarily for U.S. tax purposes, which we will deduct through 2025.
During fiscal 2012, Deutsch contributed net sales of $327 million and an operating loss of$54 million to our Consolidated Statement of Operations. The operating loss included charges of$75 million associated with the amortization of acquisition-related fair value adjustments primarilyrelated to acquired inventories and customer order backlog, acquisition costs of $21 million,restructuring charges of $14 million, and integration costs of $6 million.
Fiscal 2011 Acquisition
In July 2010, we entered into an Agreement and Plan of Merger (the ‘‘Merger Agreement’’) toacquire 100% of the outstanding stock of ADC Telecommunications, Inc. (‘‘ADC’’), a provider ofbroadband communications network connectivity products and related solutions. Pursuant to theMerger Agreement, we commenced a tender offer through a subsidiary to purchase all of the issuedand outstanding shares of ADC common stock at a purchase price of $12.75 per share in cash followedby a merger of the subsidiary with and into ADC, with ADC surviving as an indirect wholly-ownedsubsidiary. On December 8, 2010, we acquired 86.8% of the outstanding common shares of ADC. OnDecember 9, 2010, we exercised our option under the Merger Agreement to purchase additional sharesfrom ADC that, when combined with the shares purchased in the tender offer, were sufficient to giveus ownership of more than 90% of the outstanding ADC common shares. On December 9, 2010, uponeffecting a short-form merger under Minnesota law, we owned 100% of the outstanding shares of ADCfor a total purchase price of approximately $1,263 million in cash (excluding cash acquired of$546 million) and $22 million representing the fair value of ADC share-based awards exchanged forTE Connectivity share options and stock appreciation rights.
75

TE CONNECTIVITY LTD.
NOTES TO CONSOLIDATED FINANCIAL STATEMENTS (Continued)
5. Acquisitions (Continued)
Based on the terms and conditions of ADC’s share option and stock appreciation right (‘‘SAR’’)awards (the ‘‘ADC Awards’’), all ADC Awards became exercisable upon completion of the acquisition.Each outstanding ADC Award was exchanged for approximately 0.4 TE Connectivity share options orSARs and resulted in approximately 3 million TE Connectivity share options being issued with aweighted-average exercise price of $38.88. Issued SARs and the associated liability were insignificant.The fair value associated with the exchange of ADC Awards for TE Connectivity awards wasapproximately $24 million based on Black-Scholes-Merton pricing valuation model, of which $22 millionwas recorded as consideration given in the acquisition, and the remaining $2 million was recorded asacquisition and integration costs on the Consolidated Statement of Operations during fiscal 2011.
The acquisition was made to accelerate our growth potential in the global broadband connectivitymarket. We realized cost savings and other synergies through operational efficiencies. The acquiredADC businesses have been included in the Network Solutions segment from the date of acquisition.
We completed the valuation of the identifiable assets acquired and liabilities assumed during fiscal2011. The following table summarizes the allocation of the purchase price to the fair value ofidentifiable assets acquired and liabilities assumed at the date of acquisition, in accordance with theacquisition method of accounting:
(in millions)
Cash and cash equivalents . . . . . . . . . . . . . . . . . . . . . . . . . . . . . . . . . . $ 546Short-term investments . . . . . . . . . . . . . . . . . . . . . . . . . . . . . . . . . . . . 155Other current assets . . . . . . . . . . . . . . . . . . . . . . . . . . . . . . . . . . . . . . 540Property, plant, and equipment . . . . . . . . . . . . . . . . . . . . . . . . . . . . . . 198Goodwill . . . . . . . . . . . . . . . . . . . . . . . . . . . . . . . . . . . . . . . . . . . . . . . 366Intangible assets . . . . . . . . . . . . . . . . . . . . . . . . . . . . . . . . . . . . . . . . . 308Deferred income taxes . . . . . . . . . . . . . . . . . . . . . . . . . . . . . . . . . . . . . 164Other long-term assets . . . . . . . . . . . . . . . . . . . . . . . . . . . . . . . . . . . . . 18
Total assets acquired . . . . . . . . . . . . . . . . . . . . . . . . . . . . . . . . . . . . 2,295
Current maturities of long-term debt . . . . . . . . . . . . . . . . . . . . . . . . . . 653Other current liabilities . . . . . . . . . . . . . . . . . . . . . . . . . . . . . . . . . . . . 260Long-term pension liabilities . . . . . . . . . . . . . . . . . . . . . . . . . . . . . . . . 74Other long-term liabilities . . . . . . . . . . . . . . . . . . . . . . . . . . . . . . . . . . 19
Total liabilities assumed . . . . . . . . . . . . . . . . . . . . . . . . . . . . . . . . . . 1,006
Net assets acquired . . . . . . . . . . . . . . . . . . . . . . . . . . . . . . . . . . . . . 1,289Amounts attributable to noncontrolling interests . . . . . . . . . . . . . . . . . . (4)Conversion of ADC Awards to TE Connectivity share awards . . . . . . . . (22)Cash and cash equivalents acquired . . . . . . . . . . . . . . . . . . . . . . . . . . . (546)
Net cash paid . . . . . . . . . . . . . . . . . . . . . . . . . . . . . . . . . . . . . . . . . $ 717
Other current assets included trade accounts receivable of $171 million, inventories of$166 million, and deferred income taxes of $16 million. Other current assets also included assets heldfor sale of $109 million. Those assets were sold for net proceeds of $111 million, of which
76
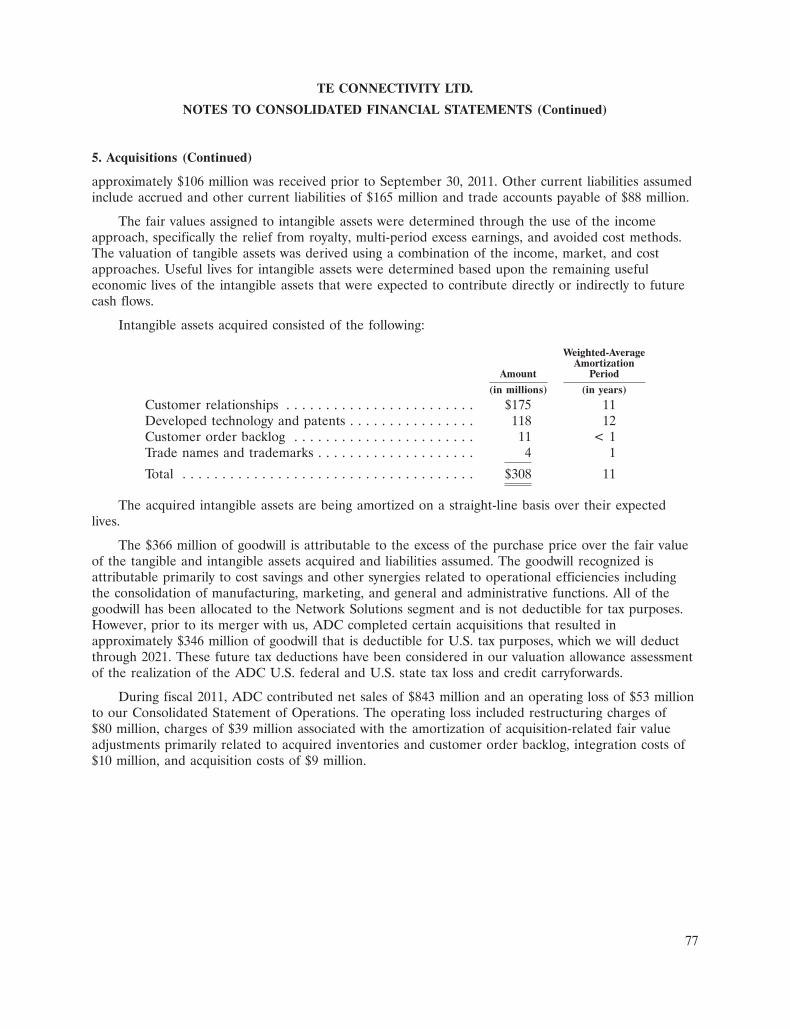
TE CONNECTIVITY LTD.
NOTES TO CONSOLIDATED FINANCIAL STATEMENTS (Continued)
5. Acquisitions (Continued)
approximately $106 million was received prior to September 30, 2011. Other current liabilities assumedinclude accrued and other current liabilities of $165 million and trade accounts payable of $88 million.
The fair values assigned to intangible assets were determined through the use of the incomeapproach, specifically the relief from royalty, multi-period excess earnings, and avoided cost methods.The valuation of tangible assets was derived using a combination of the income, market, and costapproaches. Useful lives for intangible assets were determined based upon the remaining usefuleconomic lives of the intangible assets that were expected to contribute directly or indirectly to futurecash flows.
Intangible assets acquired consisted of the following:
Weighted-AverageAmortization
Amount Period
(in millions) (in years)
Customer relationships . . . . . . . . . . . . . . . . . . . . . . . . $175 11Developed technology and patents . . . . . . . . . . . . . . . . 118 12Customer order backlog . . . . . . . . . . . . . . . . . . . . . . . 11 < 1Trade names and trademarks . . . . . . . . . . . . . . . . . . . . 4 1
Total . . . . . . . . . . . . . . . . . . . . . . . . . . . . . . . . . . . . . $308 11
The acquired intangible assets are being amortized on a straight-line basis over their expectedlives.
The $366 million of goodwill is attributable to the excess of the purchase price over the fair valueof the tangible and intangible assets acquired and liabilities assumed. The goodwill recognized isattributable primarily to cost savings and other synergies related to operational efficiencies includingthe consolidation of manufacturing, marketing, and general and administrative functions. All of thegoodwill has been allocated to the Network Solutions segment and is not deductible for tax purposes.However, prior to its merger with us, ADC completed certain acquisitions that resulted inapproximately $346 million of goodwill that is deductible for U.S. tax purposes, which we will deductthrough 2021. These future tax deductions have been considered in our valuation allowance assessmentof the realization of the ADC U.S. federal and U.S. state tax loss and credit carryforwards.
During fiscal 2011, ADC contributed net sales of $843 million and an operating loss of $53 millionto our Consolidated Statement of Operations. The operating loss included restructuring charges of$80 million, charges of $39 million associated with the amortization of acquisition-related fair valueadjustments primarily related to acquired inventories and customer order backlog, integration costs of$10 million, and acquisition costs of $9 million.
77

TE CONNECTIVITY LTD.
NOTES TO CONSOLIDATED FINANCIAL STATEMENTS (Continued)
5. Acquisitions (Continued)
Pro Forma Financial Information
The following unaudited pro forma financial information reflects our consolidated results ofoperations had the Deutsch and ADC acquisitions occurred at the beginning of the preceding fiscalyears:
Fiscal
2012 2011
(in millions, exceptper share data)
Net sales . . . . . . . . . . . . . . . . . . . . . . . . . . . . . . . . . . . . . . . . . $13,625 $14,612Net income attributable to TE Connectivity Ltd. . . . . . . . . . . . . 1,194 1,228Diluted earnings per share attributable to TE Connectivity Ltd. . $ 2.78 $ 2.77
The pro forma financial information is based on our final allocation of the purchase price of theacquisitions. The significant pro forma adjustments, which are described below, are net of income taxexpense (benefit) at the statutory rate.
Pro forma results for fiscal 2012 were adjusted to exclude $30 million of charges related to the fairvalue adjustment to acquisition-date inventories, $29 million of interest expense based on pro formachanges in our capital structure, $20 million of income tax expense based on the estimated impact ofcombining Deutsch into our global tax position, $14 million of charges related to acquired customerorder backlog, $13 million of acquisition costs, $4 million of charges related to other acquisition-relatedadjustments, $2 million of share-based compensation expense incurred by Deutsch as a result of thechange in control of Deutsch, and $2 million of charges related to depreciation expense. In addition,pro forma results for fiscal 2012 were adjusted to include $10 million of charges related to theamortization of the fair value of acquired intangible assets.
Pro forma results for fiscal 2011 were adjusted to exclude $39 million of interest expense based onpro forma changes in our capital structure, $20 million of income tax expense based on the estimatedimpact of combining Deutsch into our global tax position, $15 million of share-based compensationexpense incurred by ADC as a result of the change in control of ADC, $13 million of acquisition costs,and $5 million of charges related to depreciation expense. In addition, pro forma results for fiscal 2011were adjusted to include $20 million of charges related to the amortization of the fair value of acquiredintangible assets, $15 million of charges related to the fair value adjustment to acquisition-dateinventories, $7 million of charges related to acquired customer order backlog, and $4 million of chargesrelated to other acquisition-related adjustments.
Pro forma results do not include any synergies. Accordingly, the unaudited pro forma financialinformation is not necessarily indicative of either future results of operations or results that might havebeen achieved had the Deutsch and ADC acquisitions occurred at the beginning of the preceding fiscalyears.
78

TE CONNECTIVITY LTD.
NOTES TO CONSOLIDATED FINANCIAL STATEMENTS (Continued)
6. Inventories
Inventories consisted of the following:
Fiscal Year End
2013 2012
(in millions)
Raw materials . . . . . . . . . . . . . . . . . . . . . . . . . . . . . . . . . . . . . . . $ 258 $ 282Work in progress . . . . . . . . . . . . . . . . . . . . . . . . . . . . . . . . . . . . . 597 573Finished goods . . . . . . . . . . . . . . . . . . . . . . . . . . . . . . . . . . . . . . 870 896Inventoried costs on long-term contracts . . . . . . . . . . . . . . . . . . . . 37 57
Inventories . . . . . . . . . . . . . . . . . . . . . . . . . . . . . . . . . . . . . . . . . $1,762 $1,808
7. Property, Plant, and Equipment, Net
Net property, plant, and equipment consisted of the following:
Fiscal Year End
2013 2012
(in millions)
Land and improvements . . . . . . . . . . . . . . . . . . . . . . . . . . . . . . $ 251 $ 266Buildings and improvements . . . . . . . . . . . . . . . . . . . . . . . . . . . 1,503 1,470Machinery and equipment . . . . . . . . . . . . . . . . . . . . . . . . . . . . . 7,280 7,103Construction in process . . . . . . . . . . . . . . . . . . . . . . . . . . . . . . . 485 462
Gross property, plant, and equipment . . . . . . . . . . . . . . . . . . . . . 9,519 9,301Accumulated depreciation . . . . . . . . . . . . . . . . . . . . . . . . . . . . . (6,353) (6,088)
Property, plant, and equipment, net . . . . . . . . . . . . . . . . . . . . . . $ 3,166 $ 3,213
Depreciation expense was $496 million, $502 million, and $499 million in fiscal 2013, 2012, and2011, respectively.
8. Goodwill
The changes in the carrying amount of goodwill by segment were as follows(1):
Transportation Network Industrial ConsumerSolutions Solutions Solutions Solutions Total
(in millions)
September 30, 2011(2) . . . . . . . . . . . . . . . . . . . . $ 62 $989 $1,574 $663 $3,288Acquisition . . . . . . . . . . . . . . . . . . . . . . . . . . 730 — 312 — 1,042Currency translation . . . . . . . . . . . . . . . . . . . 1 (8) (10) (5) (22)
September 28, 2012(2) . . . . . . . . . . . . . . . . . . . . 793 981 1,876 658 4,308Currency translation and other . . . . . . . . . . . 4 (4) 13 5 18
September 27, 2013(2) . . . . . . . . . . . . . . . . . . . . $797 $977 $1,889 $663 $4,326
(1) In connection with our change in segment structure during fiscal 2013, goodwill was re-allocated to reporting units using arelative fair value approach. See Note 23 for additional information regarding the change in our segment structure.
79

TE CONNECTIVITY LTD.
NOTES TO CONSOLIDATED FINANCIAL STATEMENTS (Continued)
8. Goodwill (Continued)
(2) At fiscal year end 2013, 2012, and 2011, accumulated impairment losses for the Transportation Solutions, NetworkSolutions, Industrial Solutions, and Consumer Solutions segments were $2,191 million, $1,236 million, $641 million, and$607 million, respectively.
During fiscal 2012, we completed the acquisition of Deutsch and recognized $1,042 million ofgoodwill, which benefits the Transportation Solutions and Industrial Solutions segments. See Note 5 foradditional information on the Deutsch acquisition.
We completed our annual goodwill impairment test in the fourth quarter of fiscal 2013 anddetermined that no impairment existed.
9. Intangible Assets, Net
Intangible assets consisted of the following:
Fiscal Year End
2013 2012
Gross Net Gross NetCarrying Accumulated Carrying Carrying Accumulated CarryingAmount Amortization Amount Amount Amortization Amount
(in millions)
Intellectual property . . . . . . . . . . . . . $1,144 $(499) $ 645 $1,146 $(439) $ 707Customer relationships . . . . . . . . . . . 658 (92) 566 655 (44) 611Other . . . . . . . . . . . . . . . . . . . . . . . . 46 (13) 33 76 (42) 34Total . . . . . . . . . . . . . . . . . . . . . . . . $1,848 $(604) $1,244 $1,877 $(525) $1,352
Intangible asset amortization expense was $111 million, $107 million, and $65 million forfiscal 2013, 2012, and 2011, respectively.
The estimated aggregate amortization expense on intangible assets is expected to be as follows:
(in millions)
Fiscal 2014 . . . . . . . . . . . . . . . . . . . . . . . . . . . . . . . . . . . . . . . . . . . . . $ 111Fiscal 2015 . . . . . . . . . . . . . . . . . . . . . . . . . . . . . . . . . . . . . . . . . . . . . 111Fiscal 2016 . . . . . . . . . . . . . . . . . . . . . . . . . . . . . . . . . . . . . . . . . . . . . 111Fiscal 2017 . . . . . . . . . . . . . . . . . . . . . . . . . . . . . . . . . . . . . . . . . . . . . 111Fiscal 2018 . . . . . . . . . . . . . . . . . . . . . . . . . . . . . . . . . . . . . . . . . . . . . 110Thereafter . . . . . . . . . . . . . . . . . . . . . . . . . . . . . . . . . . . . . . . . . . . . . 690Total . . . . . . . . . . . . . . . . . . . . . . . . . . . . . . . . . . . . . . . . . . . . . . . . . . $1,244
80

TE CONNECTIVITY LTD.
NOTES TO CONSOLIDATED FINANCIAL STATEMENTS (Continued)
10. Accrued and Other Current Liabilities
Accrued and other current liabilities consisted of the following:
Fiscal Year End
2013 2012
(in millions)
Accrued payroll and employee benefits . . . . . . . . . . . . . . . . . . . . . $ 498 $ 440Dividends and cash distributions to shareholders payable . . . . . . . . 206 178Tax Sharing Agreement guarantee liabilities pursuant to ASC 460 . . 185 14Restructuring reserves . . . . . . . . . . . . . . . . . . . . . . . . . . . . . . . . . 168 118Income taxes payable . . . . . . . . . . . . . . . . . . . . . . . . . . . . . . . . . . 112 139Deferred income taxes . . . . . . . . . . . . . . . . . . . . . . . . . . . . . . . . . 54 85Interest payable . . . . . . . . . . . . . . . . . . . . . . . . . . . . . . . . . . . . . . 51 72Warranty liability . . . . . . . . . . . . . . . . . . . . . . . . . . . . . . . . . . . . . 21 31Other . . . . . . . . . . . . . . . . . . . . . . . . . . . . . . . . . . . . . . . . . . . . . 467 499Accrued and other current liabilities . . . . . . . . . . . . . . . . . . . . . . . $1,762 $1,576
11. Debt
Debt was as follows:
Fiscal Year End
2013 2012
(in millions)
Current maturities of long-term debt:6.00% senior notes due 2012 . . . . . . . . . . . . . . . . . . . . . . . . . . . $ — $ 7145.95% senior notes due 2014 . . . . . . . . . . . . . . . . . . . . . . . . . . . 300 —Commercial paper, at a weighted-average interest rate of 0.28%
and 0.40%, respectively . . . . . . . . . . . . . . . . . . . . . . . . . . . . . 350 300Other . . . . . . . . . . . . . . . . . . . . . . . . . . . . . . . . . . . . . . . . . . . 61 1
Total . . . . . . . . . . . . . . . . . . . . . . . . . . . . . . . . . . . . . . . . . . 711 1,015
Long-term debt:5.95% senior notes due 2014 . . . . . . . . . . . . . . . . . . . . . . . . . . . — 3001.60% senior notes due 2015 . . . . . . . . . . . . . . . . . . . . . . . . . . . 250 2506.55% senior notes due 2017 . . . . . . . . . . . . . . . . . . . . . . . . . . . 727 7324.875% senior notes due 2021 . . . . . . . . . . . . . . . . . . . . . . . . . . 263 2743.50% senior notes due 2022 . . . . . . . . . . . . . . . . . . . . . . . . . . . 498 4987.125% senior notes due 2037 . . . . . . . . . . . . . . . . . . . . . . . . . . 475 4753.50% convertible subordinated notes due 2015 . . . . . . . . . . . . . 89 90Other . . . . . . . . . . . . . . . . . . . . . . . . . . . . . . . . . . . . . . . . . . . 1 77
Total . . . . . . . . . . . . . . . . . . . . . . . . . . . . . . . . . . . . . . . . . . 2,303 2,696
Total debt(1) . . . . . . . . . . . . . . . . . . . . . . . . . . . . . . . . . . . . . . . . . $3,014 $3,711
(1) Senior notes are presented at face amount and, if applicable, are net of unamortized discount and the effects ofinterest rate swaps designated as fair value hedges.
81

TE CONNECTIVITY LTD.
NOTES TO CONSOLIDATED FINANCIAL STATEMENTS (Continued)
11. Debt (Continued)
Tyco Electronics Group S.A. (‘‘TEGSA’’), our 100%-owned subsidiary, has a five-year unsecuredsenior revolving credit facility (‘‘Credit Facility’’) with total commitments of $1,500 million. The CreditFacility was amended in August 2013 primarily to extend the maturity date from June 2016 toAugust 2018 and reduce borrowing costs. TEGSA had no borrowings under the Credit Facility atSeptember 27, 2013 and September 28, 2012.
Borrowings under the Credit Facility bear interest at a rate per annum equal to, at the option ofTEGSA, (1) the London interbank offered rate (‘‘LIBOR’’) plus an applicable margin based upon thesenior, unsecured, long-term debt rating of TEGSA, or (2) an alternate base rate equal to the highestof (i) Deutsche Bank AG New York branch’s base rate, (ii) the federal funds effective rate plus 1⁄2 of1%, and (iii) one-month LIBOR plus 1%, plus, in each case, an applicable margin based upon thesenior, unsecured, long-term debt rating of TEGSA. TEGSA is required to pay an annual facility feeranging from 7.5 to 25.0 basis points based upon the amount of the lenders’ commitments under theCredit Facility and the applicable credit ratings of TEGSA.
The Credit Facility contains a financial ratio covenant providing that if, as of the last day of eachfiscal quarter, our ratio of Consolidated Total Debt (as defined in the Credit Facility) to ConsolidatedEBITDA (as defined in the Credit Facility) for the then most recently concluded period of fourconsecutive fiscal quarters exceeds 3.75 to 1.0, an Event of Default (as defined in the Credit Facility) istriggered. The Credit Facility and our other debt agreements contain other customary covenants.
Periodically, TEGSA issues commercial paper to U.S. institutional accredited investors andqualified institutional buyers in accordance with available exemptions from the registrationrequirements of the Securities Act of 1933 as part of our ongoing effort to maintain financial flexibilityand to potentially decrease the cost of borrowings. Borrowings under the commercial paper programare backed by the Credit Facility.
TEGSA’s payment obligations under its senior notes, commercial paper, and Credit Facility arefully and unconditionally guaranteed by its parent, TE Connectivity Ltd. Neither TE Connectivity Ltd.nor any of its subsidiaries provides a guarantee as to payment obligations under the 3.50% convertiblesubordinated notes due 2015 issued by ADC prior to its acquisition in December 2010.
The aggregate amounts of total debt maturing are as follows:
(in millions)
Fiscal 2014 . . . . . . . . . . . . . . . . . . . . . . . . . . . . . . . . . . . . . . . . . . . . . $ 711Fiscal 2015 . . . . . . . . . . . . . . . . . . . . . . . . . . . . . . . . . . . . . . . . . . . . . 339Fiscal 2016 . . . . . . . . . . . . . . . . . . . . . . . . . . . . . . . . . . . . . . . . . . . . . —Fiscal 2017 . . . . . . . . . . . . . . . . . . . . . . . . . . . . . . . . . . . . . . . . . . . . . —Fiscal 2018 . . . . . . . . . . . . . . . . . . . . . . . . . . . . . . . . . . . . . . . . . . . . . 727Thereafter . . . . . . . . . . . . . . . . . . . . . . . . . . . . . . . . . . . . . . . . . . . . . 1,237
Total . . . . . . . . . . . . . . . . . . . . . . . . . . . . . . . . . . . . . . . . . . . . . . . . . . $3,014
The fair value of our debt, based on indicative valuations, was approximately $3,180 million and$4,034 million at fiscal year end 2013 and 2012, respectively.
See Note 25 for information regarding TEGSA’s redemption of its 5.95% senior notes due 2014.
82

TE CONNECTIVITY LTD.
NOTES TO CONSOLIDATED FINANCIAL STATEMENTS (Continued)
12. Guarantees
Tax Sharing Agreement
Effective June 29, 2007, we became the parent company of the former electronics businesses ofTyco International Ltd. (‘‘Tyco International’’). On June 29, 2007, Tyco International distributed all ofour shares, as well as its shares of its former healthcare businesses (‘‘Covidien’’), to its commonshareholders (the ‘‘separation’’).
Upon separation, we entered into a Tax Sharing Agreement, under which we share responsibilityfor certain of our, Tyco International’s, and Covidien’s income tax liabilities based on a sharing formulafor periods prior to and including June 29, 2007. We, Tyco International, and Covidien share 31%,27%, and 42%, respectively, of U.S. income tax liabilities that arise from adjustments made by taxauthorities to our, Tyco International’s, and Covidien’s U.S. income tax returns. The effect of the TaxSharing Agreement is to indemnify us for 69% of certain liabilities settled in cash by us with respect tounresolved pre-separation tax matters. Pursuant to that indemnification, we have made similarindemnifications to Tyco International and Covidien with respect to 31% of certain liabilities settled incash by the companies relating to unresolved pre-separation tax matters. All costs and expensesassociated with the management of these shared tax liabilities are shared equally among the parties. Weare responsible for all of our own taxes that are not shared pursuant to the Tax Sharing Agreement’ssharing formula. In addition, Tyco International and Covidien are responsible for their tax liabilitiesthat are not subject to the Tax Sharing Agreement’s sharing formula.
All of the tax liabilities that are associated with our businesses, including liabilities that arose priorto our separation from Tyco International, became our tax liabilities. Although we have agreed to sharecertain of these tax liabilities with Tyco International and Covidien pursuant to the Tax SharingAgreement, we remain primarily liable for all of these liabilities. If Tyco International and Covidiendefault on their obligations to us under the Tax Sharing Agreement, we would be liable for the entireamount of these liabilities.
If any party to the Tax Sharing Agreement were to default in its obligation to another party to payits share of the distribution taxes that arise as a result of no party’s fault, each non-defaulting partywould be required to pay, equally with any other non-defaulting party, the amounts in default. Inaddition, if another party to the Tax Sharing Agreement that is responsible for all or a portion of anincome tax liability were to default in its payment of such liability to a taxing authority, we could belegally liable under applicable tax law for such liabilities and required to make additional tax payments.Accordingly, under certain circumstances, we may be obligated to pay amounts in excess of ouragreed-upon share of our, Tyco International’s, and Covidien’s tax liabilities.
Indemnification
Our indemnification created under the Tax Sharing Agreement qualifies as a guarantee of a thirdparty entity’s debt under ASC 460, Guarantees. ASC 460 addresses the measurement and disclosure ofa guarantor’s obligation to pay a debt incurred by a third party. To value the initial guaranteeobligation, we considered a range of probability-weighted future cash flows that represented thelikelihood of payment of each class of liability by each of the three post-separation companies. Theexpected cash flows incorporated interest and penalties that the companies believed would be incurredon each class of liabilities and were discounted to the present value to reflect the value associated witheach at separation. The calculation of the guarantee liability also included a premium that reflected thecost for an insurance carrier to stand in and assume the payment obligation at the separation date.
83

TE CONNECTIVITY LTD.
NOTES TO CONSOLIDATED FINANCIAL STATEMENTS (Continued)
12. Guarantees (Continued)
At inception of the guarantee, based on the probability-weighted future cash flows related tounresolved tax matters, we, under the Tax Sharing Agreement, faced a maximum potential liability of$3 billion, based on undiscounted estimates and interest and penalties used to determine the fair valueof the guarantee and an assumption of 100% default on the parts of Tyco International and Covidien, alikelihood that management believes to be remote. In the event that we are required, due tobankruptcy or other business interruption on the part of Tyco International or Covidien, to pay morethan the contractually determined 31%, we retain the right to seek payment from the effected entity.
At September 27, 2013, we had a liability representing the indemnifications made to TycoInternational and Covidien pursuant to the Tax Sharing Agreement of $223 million of which$185 million was reflected in accrued and other current liabilities and $38 million was reflected in otherliabilities on the Consolidated Balance Sheet. At September 28, 2012, the liability was $241 million andconsisted of $14 million in accrued and other current liabilities and $227 million in other liabilities. Theamount reflected in accrued and other current liabilities is our estimated cash obligation under the TaxSharing Agreement to Tyco International and Covidien in connection with pre-separation tax mattersthat could be resolved within the next twelve months.
We have assessed the probable future cash payments to Tyco International and Covidien forpre-separation income tax matters pursuant to the terms of the Tax Sharing Agreement and determinedthat $223 million is sufficient to satisfy these expected obligations.
Other Matters
In disposing of assets or businesses, we often provide representations, warranties, and/orindemnities to cover various risks including unknown damage to assets, environmental risks involved inthe sale of real estate, liability for investigation and remediation of environmental contamination atwaste disposal sites and manufacturing facilities, and unidentified tax liabilities and legal fees related toperiods prior to disposition. We do not expect that these uncertainties will have a material adverseeffect on our results of operations, financial position, or cash flows.
At September 27, 2013, we had outstanding letters of credit and letters of guarantee in the amountof $376 million.
In the normal course of business, we are liable for contract completion and product performance.In the opinion of management, such obligations will not significantly affect our results of operations,financial position, or cash flows.
We generally record estimated product warranty costs when contract revenues are recognizedunder the percentage-of-completion method for construction related contracts and at the time of salefor products. The estimation is primarily based on historical experience and actual warranty claims.Amounts accrued for warranty claims at fiscal year end 2013 and 2012 were $38 million and$48 million, respectively.
13. Commitments and Contingencies
General Matters
We have facility, land, vehicle, and equipment leases that expire at various dates. Rental expenseunder these leases was $154 million, $160 million, and $158 million for fiscal 2013, 2012, and 2011,
84
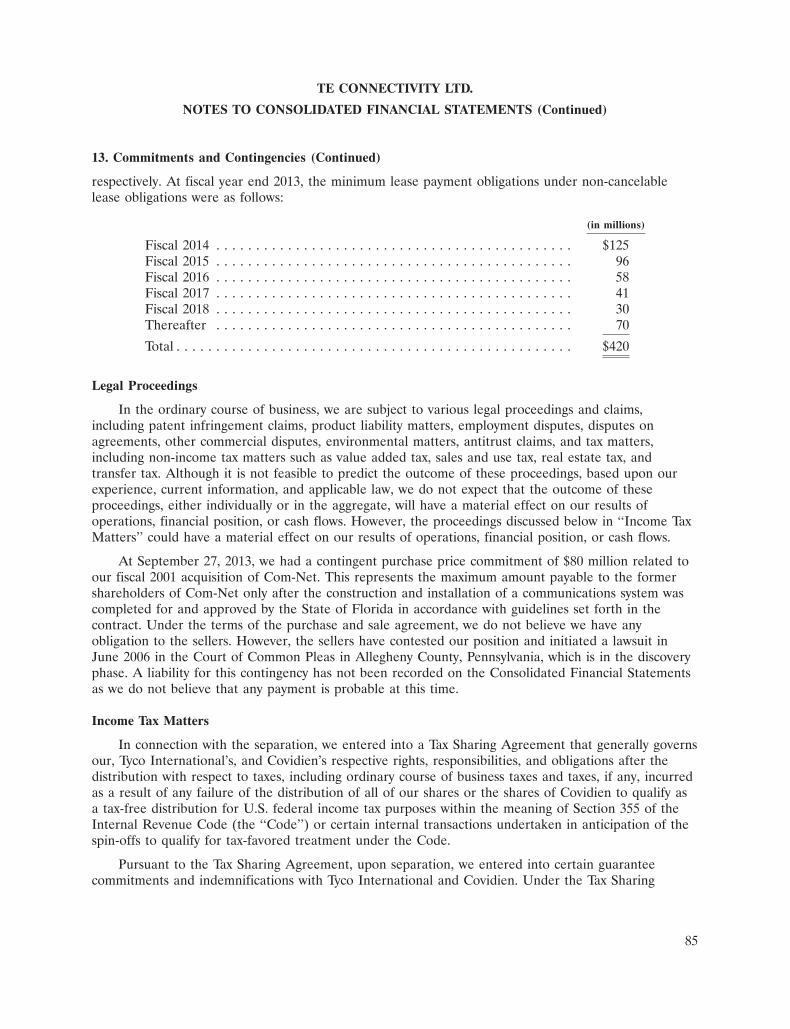
TE CONNECTIVITY LTD.
NOTES TO CONSOLIDATED FINANCIAL STATEMENTS (Continued)
13. Commitments and Contingencies (Continued)
respectively. At fiscal year end 2013, the minimum lease payment obligations under non-cancelablelease obligations were as follows:
(in millions)
Fiscal 2014 . . . . . . . . . . . . . . . . . . . . . . . . . . . . . . . . . . . . . . . . . . . . . $125Fiscal 2015 . . . . . . . . . . . . . . . . . . . . . . . . . . . . . . . . . . . . . . . . . . . . . 96Fiscal 2016 . . . . . . . . . . . . . . . . . . . . . . . . . . . . . . . . . . . . . . . . . . . . . 58Fiscal 2017 . . . . . . . . . . . . . . . . . . . . . . . . . . . . . . . . . . . . . . . . . . . . . 41Fiscal 2018 . . . . . . . . . . . . . . . . . . . . . . . . . . . . . . . . . . . . . . . . . . . . . 30Thereafter . . . . . . . . . . . . . . . . . . . . . . . . . . . . . . . . . . . . . . . . . . . . . 70
Total . . . . . . . . . . . . . . . . . . . . . . . . . . . . . . . . . . . . . . . . . . . . . . . . . . $420
Legal Proceedings
In the ordinary course of business, we are subject to various legal proceedings and claims,including patent infringement claims, product liability matters, employment disputes, disputes onagreements, other commercial disputes, environmental matters, antitrust claims, and tax matters,including non-income tax matters such as value added tax, sales and use tax, real estate tax, andtransfer tax. Although it is not feasible to predict the outcome of these proceedings, based upon ourexperience, current information, and applicable law, we do not expect that the outcome of theseproceedings, either individually or in the aggregate, will have a material effect on our results ofoperations, financial position, or cash flows. However, the proceedings discussed below in ‘‘Income TaxMatters’’ could have a material effect on our results of operations, financial position, or cash flows.
At September 27, 2013, we had a contingent purchase price commitment of $80 million related toour fiscal 2001 acquisition of Com-Net. This represents the maximum amount payable to the formershareholders of Com-Net only after the construction and installation of a communications system wascompleted for and approved by the State of Florida in accordance with guidelines set forth in thecontract. Under the terms of the purchase and sale agreement, we do not believe we have anyobligation to the sellers. However, the sellers have contested our position and initiated a lawsuit inJune 2006 in the Court of Common Pleas in Allegheny County, Pennsylvania, which is in the discoveryphase. A liability for this contingency has not been recorded on the Consolidated Financial Statementsas we do not believe that any payment is probable at this time.
Income Tax Matters
In connection with the separation, we entered into a Tax Sharing Agreement that generally governsour, Tyco International’s, and Covidien’s respective rights, responsibilities, and obligations after thedistribution with respect to taxes, including ordinary course of business taxes and taxes, if any, incurredas a result of any failure of the distribution of all of our shares or the shares of Covidien to qualify asa tax-free distribution for U.S. federal income tax purposes within the meaning of Section 355 of theInternal Revenue Code (the ‘‘Code’’) or certain internal transactions undertaken in anticipation of thespin-offs to qualify for tax-favored treatment under the Code.
Pursuant to the Tax Sharing Agreement, upon separation, we entered into certain guaranteecommitments and indemnifications with Tyco International and Covidien. Under the Tax Sharing
85
TE CONNECTIVITY LTD.
NOTES TO CONSOLIDATED FINANCIAL STATEMENTS (Continued)
13. Commitments and Contingencies (Continued)
Agreement, we, Tyco International, and Covidien share 31%, 27%, and 42%, respectively, of certaincontingent liabilities relating to unresolved pre-separation tax matters of Tyco International. SeeNote 12 for additional information regarding the Tax Sharing Agreement.
Prior to separation, certain of our subsidiaries filed combined income tax returns with TycoInternational. Those and other of our subsidiaries’ income tax returns are periodically examined byvarious tax authorities. In connection with these examinations, tax authorities, including the InternalRevenue Service (‘‘IRS’’), have raised issues and proposed tax adjustments. Tyco International, as theU.S. income tax audit controlling party under the Tax Sharing Agreement, is reviewing and contestingcertain of the proposed tax adjustments. Amounts related to these tax adjustments and other taxcontingencies and related interest that management has assessed under the uncertain tax positionprovisions of ASC 740, Income Taxes, which relate specifically to our entities have been recorded on theConsolidated Financial Statements. In addition, we may be required to fund portions of TycoInternational’s and Covidien’s tax obligations. Estimates about these guarantees have also beenrecognized on the Consolidated Financial Statements. See Note 12 for additional information.
During fiscal 2007, the IRS concluded its field examination of certain of Tyco International’s U.S.federal income tax returns for the years 1997 through 2000 and issued Revenue Agent Reports thatreflected the IRS’ determination of proposed tax adjustments for the 1997 through 2000 period.Additionally, the IRS proposed civil fraud penalties against Tyco International arising from allegedactions of former executives in connection with certain intercompany transfers of stock in 1998 and1999. The penalties were asserted against a prior subsidiary of Tyco International that was distributedto us in connection with the separation. Tyco International appealed certain of the proposedadjustments for the years 1997 through 2000, and Tyco International resolved all but one of the mattersassociated with the proposed tax adjustments, including reaching an agreement with the IRS on thepenalty adjustment in the amount of $21 million. In October 2012, the IRS issued special agreementForms 870-AD, effectively settling its audit of all tax matters for the period 1997 through 2000,excluding one issue that remains in dispute as described below. As a result of these developments, infiscal 2013, we recognized an income tax benefit of $331 million and other expense of $231 millionpursuant to the Tax Sharing Agreement with Tyco International and Covidien.
The disputed issue involves the tax treatment of certain intercompany debt transactions. The IRSfield examination asserted that certain intercompany loans originating during the period 1997 through2000 did not constitute debt for U.S. federal income tax purposes and disallowed approximately$2.7 billion of related interest deductions recognized during the period on Tyco International’s U.S.income tax returns. In addition, if the IRS is ultimately successful in asserting its claim, it is likely todisallow an additional $6.6 billion of interest deductions reflected on U.S. income tax returns in yearssubsequent to fiscal 2000. Tyco International contends that the intercompany financing qualified as debtfor U.S. tax purposes and that the interest deductions reflected on the income tax returns areappropriate. The IRS and Tyco International were unable to resolve this matter through the IRSappeals process. On June 20, 2013, Tyco International advised us that it had received Notices ofDeficiency from the IRS for certain former U.S. subsidiaries of Tyco International increasing taxableincome by approximately $2.9 billion in connection with the audit of Tyco International’s fiscalyears 1997 through 2000. The Notices of Deficiency assert that Tyco International owes additional taxestotaling $778 million, associated penalties of $154 million, and withholding taxes of $105 million. Inaddition, Tyco International received Final Partnership Administrative Adjustments for certain U.S.partnerships owned by former U.S. subsidiaries with respect to which Tyco International estimates an
86
TE CONNECTIVITY LTD.
NOTES TO CONSOLIDATED FINANCIAL STATEMENTS (Continued)
13. Commitments and Contingencies (Continued)
additional tax deficiency of approximately $30 million will be asserted. The amounts asserted by theIRS exclude any applicable deficiency interest, and do not reflect any impact to subsequent period taxliabilities in the event that the IRS were to prevail on some or all of its assertions. We understand thatTyco International strongly disagrees with the IRS position and has filed petitions in the U.S. Tax Courtcontesting the IRS’ proposed adjustments. Tyco International has advised us that it believes there aremeritorious defenses for the tax filings in question and that the IRS positions with regard to thesematters are inconsistent with the applicable tax laws and existing Treasury regulations.
Resolution of this matter in the U.S. Tax Court could take several years and no payments to theIRS with respect to these matters would be required until the matter is fully and finally resolved. Inaccordance with the terms of a tax sharing agreement, we, Tyco International, and Covidien wouldshare 31%, 27%, and 42%, respectively, of any payments made in connection with these matters.
However, as the ultimate outcome is uncertain and if the IRS were to prevail on its assertions, ourshare of the assessed tax, deficiency interest, and applicable withholding taxes and penalties could havea material adverse impact on our results of operations, financial position, and cash flows. We havereviewed the Notices of Deficiency, the relevant facts surrounding the intercompany debt transactions,relevant tax regulations, and applicable case law, and we continue to believe that we are appropriatelyreserved for this matter.
During fiscal 2013 and 2012, we made payments of $67 million and $70 million, respectively, fortax deficiencies related to undisputed tax adjustments for the years 1997 through 2000. Concurrent withremitting these payments, during fiscal 2013 and 2012, we were reimbursed $39 million and $51 million,respectively, from Tyco International and Covidien pursuant to their indemnifications for pre-separationtax matters.
During fiscal 2011, the IRS completed its field examination of certain Tyco International incometax returns for the years 2001 through 2004, issued Revenue Agent Reports which reflect the IRS’determination of proposed tax adjustments for the 2001 through 2004 period, and issued certain noticesof deficiency. As a result of the completion of fieldwork and the settlement of certain tax matters infiscal 2011, we recognized income tax benefits of $35 million and other expense of $14 million pursuantto the Tax Sharing Agreement. Also, in fiscal 2011, we made net cash payments of $154 million relatedto pre-separation deficiencies.
Tyco International’s income tax returns for the years 2001 through 2004 remain subject toadjustment by the IRS upon ultimate resolution of the disputed issue involving certain intercompanyloans originated during the period 1997 through 2000. The IRS commenced its audit of certain TycoInternational income tax returns for the years 2005 through 2007 in fiscal 2011, and it is ourunderstanding that fieldwork for this audit period is expected to be completed in fiscal 2014. Also,during fiscal 2012, the IRS commenced its audit of our income tax returns for the years 2008 through2010. We expect fieldwork for the 2008 through 2010 audit to conclude in fiscal 2014. Over the nexttwelve months, we expect to pay approximately $182 million, inclusive of related indemnificationpayments, in connection with pre-separation tax matters.
87

TE CONNECTIVITY LTD.
NOTES TO CONSOLIDATED FINANCIAL STATEMENTS (Continued)
13. Commitments and Contingencies (Continued)
At September 27, 2013 and September 28, 2012, we have reflected $15 million and $71 million,respectively, of income tax liabilities related to the audits of Tyco International’s and our income taxreturns in accrued and other current liabilities as certain of these matters could be resolved within thenext twelve months.
We believe that the amounts recorded on our Consolidated Financial Statements relating to thematters discussed above are appropriate. However, the ultimate resolution is uncertain and could resultin a material impact to our results of operations, financial position, or cash flows.
Environmental Matters
We are involved in various stages of investigation and cleanup related to environmentalremediation matters at a number of sites. The ultimate cost of site cleanup is difficult to predict giventhe uncertainties regarding the extent of the required cleanup, the interpretation of applicable laws andregulations, and alternative cleanup methods. As of fiscal year end 2013, we concluded that it wasprobable that we would incur remedial costs in the range of $12 million to $24 million. As of fiscal yearend 2013, we concluded that the best estimate within this range is $13 million, of which $3 million isincluded in accrued and other current liabilities and $10 million is included in other liabilities on theConsolidated Balance Sheet. We believe that any potential payment of such estimated amounts will nothave a material adverse effect on our results of operations, financial position, or cash flows.
14. Financial Instruments
We use derivative and non-derivative financial instruments to manage certain exposures to foreigncurrency, interest rate, investment, and commodity risks.
Foreign Exchange Risks
As part of managing the exposure to changes in foreign currency exchange rates, we utilize foreigncurrency forward and swap contracts, a portion of which are designated as cash flow hedges. Theobjective of these contracts is to minimize impacts to cash flows and profitability due to changes inforeign currency exchange rates on intercompany and other cash transactions.
We expect that significantly all of the balance in accumulated other comprehensive incomeassociated with the cash flow hedge-designated instruments addressing foreign exchange risks will bereclassified into the Consolidated Statements of Operations within the next twelve months.
Interest Rate and Investment Risk Management
We issue debt, as needed, to fund our operations and capital requirements. Such borrowings canresult in interest rate exposure. To manage the interest rate exposure, we use interest rate swaps toconvert a portion of fixed-rate debt into variable-rate debt. We use forward starting interest rate swapsand options to enter into interest rate swaps (‘‘swaptions’’) to manage interest rate exposure in periodsprior to the anticipated issuance of fixed-rate debt. We also utilize investment swaps to manageearnings exposure on certain non-qualified deferred compensation liabilities.
During fiscal 2012, in conjunction with the issuance of the 1.60% senior notes due 2015 and 3.50%senior notes due 2022, we terminated forward starting interest rate swaps and swaptions designated ascash flow hedges on notional amounts of $400 million originated in fiscal 2010, for a cash payment of
88

TE CONNECTIVITY LTD.
NOTES TO CONSOLIDATED FINANCIAL STATEMENTS (Continued)
14. Financial Instruments (Continued)
$24 million. The effective portion of the forward starting interest rate swaps, a loss of approximately$24 million, was recorded in accumulated other comprehensive income and is being reclassified tointerest expense through January 2016. The ineffective portion of the forward starting interest rateswaps and the remaining unamortized premium of the swaptions were insignificant and were recordedin interest expense during fiscal 2012. Also during fiscal 2012 and in conjunction with the issuance ofthe 3.50% senior notes due 2022, we entered into, and subsequently terminated, an interest rate swapdesignated as a cash flow hedge on a notional amount of $300 million for a cash payment of $2 million.That cash payment was recorded in accumulated other comprehensive income and is being reclassifiedto interest expense through January 2022.
During fiscal 2011, we entered into interest rate swaps designated as fair value hedges on$150 million principal amount of the 4.875% senior notes due 2021. The maturity dates of the interestrate swaps coincide with the maturity date of the notes. Under these contracts, we receive fixedamounts of interest applicable to the underlying notes and pay a floating amount based upon the three-month U.S. Dollar LIBOR.
We utilize swaps to manage exposure related to certain of our non-qualified deferredcompensation liabilities. The notional amount of the swaps was $38 million and $30 million atSeptember 27, 2013 and September 28, 2012, respectively. The swaps act as economic hedges ofchanges in a portion of the liabilities. The change in value of both the swap contracts and thenon-qualified deferred compensation liabilities are recorded in selling, general, and administrativeexpenses on the Consolidated Statements of Operations.
Hedges of Net Investment
We hedge our net investment in certain foreign operations using intercompany non-derivativefinancial instruments denominated in the same currencies. The aggregate notional value of thesehedges was $2,374 million and $2,981 million at September 27, 2013 and September 28, 2012,respectively. We reclassified foreign exchange losses of $18 million, gains of $21 million, and losses of$70 million in fiscal 2013, 2012, and 2011, respectively. These amounts were recorded as currencytranslation, a component of accumulated other comprehensive income, offsetting foreign exchangegains or losses attributable to the translation of the net investment. See Note 21 for additionalinformation.
Commodity Hedges
As part of managing the exposure to certain commodity price fluctuations, we utilize commodityswap contracts designated as cash flow hedges. The objective of these contracts is to minimize impactsto cash flows and profitability due to changes in prices of commodities used in production.
At September 27, 2013 and September 28, 2012, our commodity hedges had notional values of$278 million and $246 million, respectively. We expect that significantly all of the balance inaccumulated other comprehensive income associated with the commodity hedges will be reclassifiedinto the Consolidated Statements of Operations within the next twelve months.
89

TE CONNECTIVITY LTD.
NOTES TO CONSOLIDATED FINANCIAL STATEMENTS (Continued)
14. Financial Instruments (Continued)
Derivative Instrument Summary
The fair value of our derivative instruments is summarized below:
Fiscal Year End
2013 2012
Fair Value Fair Value Fair Value Fair Valueof Asset of Liability of Asset of Liability
Positions(1) Positions(2) Positions(1) Positions(2)
(in millions)
Derivatives designated as hedging instruments:Foreign currency contracts(3) . . . . . . . . . . . . . . . . . . . . $ 1 $ 1 $ 2 $ 1Interest rate swaps . . . . . . . . . . . . . . . . . . . . . . . . . . . 14 — 26 —Commodity swap contracts(3) . . . . . . . . . . . . . . . . . . . . 2 29 18 1
Total derivatives designated as hedging instruments . . . . . 17 30 46 2
Derivatives not designated as hedging instruments:Foreign currency contracts(3) . . . . . . . . . . . . . . . . . . . . — 1 2 2Investment swaps . . . . . . . . . . . . . . . . . . . . . . . . . . . . 3 — 1 —
Total derivatives not designated as hedging instruments . . 3 1 3 2
Total derivatives . . . . . . . . . . . . . . . . . . . . . . . . . . . . . . $20 $31 $49 $ 4
(1) All derivative instruments in asset positions that mature within one year of the balance sheet date are recorded in prepaidexpenses and other current assets on the Consolidated Balance Sheets and totaled $5 million and $19 million atSeptember 27, 2013 and September 28, 2012, respectively. All derivative instruments in asset positions that mature morethan one year from the balance sheet date are recorded in other assets on the Consolidated Balance Sheets and totaled$15 million and $30 million at September 27, 2013 and September 28, 2012, respectively.
(2) All derivative instruments in liability positions that mature within one year of the balance sheet date are recorded inaccrued and other current liabilities on the Consolidated Balance Sheets and totaled $29 million and $4 million atSeptember 27, 2013 and September 28, 2012, respectively. All derivative instruments in liability positions that mature morethan one year from the balance sheet date are recorded in other liabilities on the Consolidated Balance Sheets and totaled$2 million at September 27, 2013; there were no derivatives in other liabilities at September 28, 2012.
(3) Contracts are presented gross without regard to any right of offset that exists.
The effects of derivative instruments designated as fair value hedges on the ConsolidatedStatements of Operations were as follows:
Gain Recognized
Fiscal
Derivatives Designated as Fair Value Hedges Location 2013 2012 2011
(in millions)
Interest rate swaps(1) . . . . . . . . . . . . . . . . . . . . . . . . . . . Interest expense $ 5 $ 7 $ 6
(1) Certain interest rate swaps designated as fair value hedges were terminated in December 2008. Terminated interest rateswaps resulted in all gains presented in this table. Interest rate swaps in place at September 27, 2013 had no ineffective gainor loss recognized on the Consolidated Statements of Operations during fiscal 2013, 2012, or 2011.
90

TE CONNECTIVITY LTD.
NOTES TO CONSOLIDATED FINANCIAL STATEMENTS (Continued)
14. Financial Instruments (Continued)
The effects of derivative instruments designated as cash flow hedges on the ConsolidatedStatements of Operations were as follows:
Gain (Loss) Gain (Loss) RecognizedRecognized Gain (Loss) Reclassified in Income (Ineffective
in OCI from Accumulated Portion and Amount(Effective OCI into Income ExcludedPortion) (Effective Portion) From Effectiveness Testing)
Derivatives Designated as Cash Flow Hedges Amount Location Amount Location Amount
(in millions)
Fiscal 2013:Foreign currency contracts . . . . . . . . . . $ (1) Cost of sales $ — Cost of sales $—Commodity swap contracts . . . . . . . . . . (64) Cost of sales (20) Cost of sales —Interest rate swaps(1) . . . . . . . . . . . . . . — Interest expense (9) Interest expense —
Total . . . . . . . . . . . . . . . . . . . . . . . . . . $(65) $(29) $—
Fiscal 2012:Foreign currency contracts . . . . . . . . . . $ — Cost of sales $ (1) Cost of sales $—Commodity swap contracts . . . . . . . . . . 28 Cost of sales 10 Cost of sales —Interest rate swaps and swaptions(1) . . . . (5) Interest expense (10) Interest expense —
Total . . . . . . . . . . . . . . . . . . . . . . . . . . $ 23 $ (1) $—
Fiscal 2011:Foreign currency contracts . . . . . . . . . . $ 1 Cost of sales $ 5 Cost of sales $—Commodity swap contracts . . . . . . . . . . 29 Cost of sales 42 Cost of sales —Interest rate swaps and swaptions(1) . . . . (9) Interest expense (5) Interest expense (1)
Total . . . . . . . . . . . . . . . . . . . . . . . . . . $ 21 $ 42 $(1)
(1) As of fiscal year end 2013 and 2012, there were no outstanding interest rate swaps designated as cash flow hedges. Duringfiscal 2012, we terminated forward starting interest rate swaps and swaptions designated as cash flow hedges. Prior to thetermination, the forward starting interest rate swaps generated losses of $3 million and $9 million in other comprehensiveincome related to the effective portions of the hedges during fiscal 2012 and 2011, respectively. Also during fiscal 2012, weentered into and terminated an interest rate swap designated as a cash flow hedge, recording a loss of $2 million in othercomprehensive income. The forward starting interest rate swaps, subsequent to termination, and certain forward startinginterest rate swaps designated as cash flow hedges that were terminated in September 2007 resulted in losses of $9 million,$10 million, and $5 million reflected in interest expense in fiscal 2013, 2012, and 2011, respectively. Swaptions terminated infiscal 2012 resulted in losses of $1 million in interest expense in fiscal 2011 as a result of amounts excluded from thehedging relationship; losses in fiscal 2012 were insignificant.
91

TE CONNECTIVITY LTD.
NOTES TO CONSOLIDATED FINANCIAL STATEMENTS (Continued)
14. Financial Instruments (Continued)
The effects of derivative instruments not designated as hedging instruments on the ConsolidatedStatements of Operations were as follows:
Gain (Loss) Recognized
Fiscal
Derivatives not Designated as Hedging Instruments Location 2013 2012 2011
(in millions)
Foreign currency contracts . . . . . . . . . . . . . . . . . . . . . . . Selling, general, andadministrative expenses $(11) $(33) $ 7
Investment swaps . . . . . . . . . . . . . . . . . . . . . . . . . . . . . Selling, general, andadministrative expenses 7 7 (1)
Total . . . . . . . . . . . . . . . . . . . . . . . . . . . . . . . . . . . . . . $ (4) $(26) $ 6
During fiscal 2013, 2012, and 2011, we incurred losses of $11 million, losses of $33 million, andgains of $7 million, respectively, as a result of marking foreign currency derivatives not designated ashedging instruments to fair value. The impacts of these derivatives not designated as hedginginstruments, which included losses of $20 million incurred in anticipation of the acquisition of Deutschduring fiscal 2012, were offset by gains or losses realized as a result of re-measuring underlying assetsand liabilities denominated in foreign currencies to primarily the Euro or U.S. Dollar. The lossesincurred in connection with the acquisition of Deutsch were offset by gains realized as a result ofre-measuring certain non-U.S. Dollar-denominated intercompany non-derivative financial instruments tothe U.S. Dollar.
92

TE CONNECTIVITY LTD.
NOTES TO CONSOLIDATED FINANCIAL STATEMENTS (Continued)
15. Fair Value Measurements
Financial assets and liabilities recorded at fair value on a recurring basis were as follows:
Fair ValueMeasurementsUsing Inputs
Considered as
Description Level 1 Level 2 Fair Value
(in millions)
September 27, 2013:Assets:
Commodity swap contracts . . . . . . . . . . . . . . . . . . . . . . . . . . . . . . . . . $ 2 $ — $ 2Interest rate swaps . . . . . . . . . . . . . . . . . . . . . . . . . . . . . . . . . . . . . . — 14 14Investment swaps . . . . . . . . . . . . . . . . . . . . . . . . . . . . . . . . . . . . . . . — 3 3Foreign currency contracts(1) . . . . . . . . . . . . . . . . . . . . . . . . . . . . . . . — 1 1Rabbi trust assets . . . . . . . . . . . . . . . . . . . . . . . . . . . . . . . . . . . . . . . 3 80 83
Total assets at fair value . . . . . . . . . . . . . . . . . . . . . . . . . . . . . . . . . . . $ 5 $ 98 $103
Liabilities:Commodity swap contracts . . . . . . . . . . . . . . . . . . . . . . . . . . . . . . . . . $29 $ — $ 29Foreign currency contracts(1) . . . . . . . . . . . . . . . . . . . . . . . . . . . . . . . — 2 2
Total liabilities at fair value . . . . . . . . . . . . . . . . . . . . . . . . . . . . . . . . $29 $ 2 $ 31
September 28, 2012:Assets:
Commodity swap contracts . . . . . . . . . . . . . . . . . . . . . . . . . . . . . . . . . $18 $ — $ 18Interest rate swaps . . . . . . . . . . . . . . . . . . . . . . . . . . . . . . . . . . . . . . — 26 26Investment swaps . . . . . . . . . . . . . . . . . . . . . . . . . . . . . . . . . . . . . . . — 1 1Foreign currency contracts(1) . . . . . . . . . . . . . . . . . . . . . . . . . . . . . . . — 4 4Rabbi trust assets . . . . . . . . . . . . . . . . . . . . . . . . . . . . . . . . . . . . . . . 4 79 83
Total assets at fair value . . . . . . . . . . . . . . . . . . . . . . . . . . . . . . . . . . . $22 $110 $132
Liabilities:Commodity swap contracts . . . . . . . . . . . . . . . . . . . . . . . . . . . . . . . . . $ 1 $ — $ 1Foreign currency contracts(1) . . . . . . . . . . . . . . . . . . . . . . . . . . . . . . . — 3 3
Total liabilities at fair value . . . . . . . . . . . . . . . . . . . . . . . . . . . . . . . . $ 1 $ 3 $ 4
(1) Contracts are presented gross without regard to any right of offset that exists. See Note 14 for a reconciliation of amountsto the Consolidated Balance Sheets.
The majority of the derivatives that we enter into are valued using over-the-counter quoted marketprices for similar instruments. We do not believe that the fair values of these derivative instrumentsdiffer materially from the amounts that would be realized upon settlement or maturity.
As of September 27, 2013 and September 28, 2012, we did not have significant financial assets orliabilities that were measured at fair value on a non-recurring basis. We also did not have anysignificant non-financial assets or liabilities that were measured at fair value as of September 27, 2013and September 28, 2012.
93

TE CONNECTIVITY LTD.
NOTES TO CONSOLIDATED FINANCIAL STATEMENTS (Continued)
16. Retirement Plans
Defined Benefit Pension Plans
We have a number of contributory and noncontributory defined benefit retirement plans coveringcertain of our U.S. and non-U.S. employees, designed in accordance with local customs and practice.
The net periodic pension benefit cost for all U.S. and non-U.S. defined benefit pension plans wasas follows:
U.S. Plans Non-U.S. Plans
Fiscal Fiscal
2013 2012 2011 2013 2012 2011
($ in millions)
Service cost . . . . . . . . . . . . . . . . . . . . . . . . . . . . . $ 6 $ 7 $ 7 $ 55 $ 51 $ 65Interest cost . . . . . . . . . . . . . . . . . . . . . . . . . . . . 46 51 52 70 76 88Expected return on plan assets . . . . . . . . . . . . . . . (60) (58) (63) (69) (54) (59)Amortization of net actuarial loss . . . . . . . . . . . . . 36 42 35 33 29 41Other . . . . . . . . . . . . . . . . . . . . . . . . . . . . . . . . . — (1) — (18) (5) (4)
Net periodic pension benefit cost . . . . . . . . . . . . . $ 28 $ 41 $ 31 $ 71 $ 97 $ 131
Weighted-average assumptions used to determine netpension benefit cost during the fiscal year:
Discount rate . . . . . . . . . . . . . . . . . . . . . . . . . . . 3.98% 4.71% 5.10% 3.27% 4.12% 3.97%Expected return on plan assets . . . . . . . . . . . . . . . 6.65% 7.10% 7.45% 6.31% 5.43% 5.37%Rate of compensation increase . . . . . . . . . . . . . . . —% 4.00% 4.00% 2.88% 3.01% 3.50%
94

TE CONNECTIVITY LTD.
NOTES TO CONSOLIDATED FINANCIAL STATEMENTS (Continued)
16. Retirement Plans (Continued)
The following table represents the changes in benefit obligation and plan assets and the netamount recognized on the Consolidated Balance Sheets for all U.S. and non-U.S. defined benefitpension plans:
U.S. Plans Non-U.S. Plans
Fiscal Fiscal
2013 2012 2013 2012
($ in millions)
Change in benefit obligation:Benefit obligation at beginning of fiscal year . . . . . . . . . . . . . . $1,177 $1,114 $2,206 $ 1,896Service cost . . . . . . . . . . . . . . . . . . . . . . . . . . . . . . . . . . . . . . 6 7 55 51Interest cost . . . . . . . . . . . . . . . . . . . . . . . . . . . . . . . . . . . . . 46 51 70 76Actuarial (gain) loss . . . . . . . . . . . . . . . . . . . . . . . . . . . . . . . (84) 69 48 248Benefits and administrative expenses paid . . . . . . . . . . . . . . . . (69) (63) (98) (86)New plans . . . . . . . . . . . . . . . . . . . . . . . . . . . . . . . . . . . . . . . — — — 47Currency translation . . . . . . . . . . . . . . . . . . . . . . . . . . . . . . . — — (74) (24)Other . . . . . . . . . . . . . . . . . . . . . . . . . . . . . . . . . . . . . . . . . . (2) (1) (26) (2)
Benefit obligation at end of fiscal year . . . . . . . . . . . . . . . . . . 1,074 1,177 2,181 2,206
Change in plan assets:Fair value of plan assets at beginning of fiscal year . . . . . . . . . 941 851 1,118 980Actual return on plan assets . . . . . . . . . . . . . . . . . . . . . . . . . . 58 152 131 101Employer contributions . . . . . . . . . . . . . . . . . . . . . . . . . . . . . 2 1 94 95Benefits and administrative expenses paid . . . . . . . . . . . . . . . . (69) (63) (98) (86)Currency translation . . . . . . . . . . . . . . . . . . . . . . . . . . . . . . . — — (62) 4Other . . . . . . . . . . . . . . . . . . . . . . . . . . . . . . . . . . . . . . . . . . (1) — 2 24
Fair value of plan assets at end of fiscal year . . . . . . . . . . . . . . 931 941 1,185 1,118
Funded status . . . . . . . . . . . . . . . . . . . . . . . . . . . . . . . . . . . . $ (143) $ (236) $ (996) $(1,088)
Amounts recognized on the Consolidated Balance Sheets:Other assets . . . . . . . . . . . . . . . . . . . . . . . . . . . . . . . . . . . . . $ — $ — $ 3 $ —Accrued and other current liabilities . . . . . . . . . . . . . . . . . . . . (3) (4) (20) (18)Long-term pension and postretirement liabilities . . . . . . . . . . . (140) (232) (979) (1,070)
Net amount recognized . . . . . . . . . . . . . . . . . . . . . . . . . . . . . $ (143) $ (236) $ (996) $(1,088)
Weighted-average assumptions used to determine pension benefitobligation at fiscal year end:
Discount rate . . . . . . . . . . . . . . . . . . . . . . . . . . . . . . . . . . . . 4.84% 3.98% 3.38% 3.31%Rate of compensation increase(1) . . . . . . . . . . . . . . . . . . . . . . —% —% 2.86% 2.88%
(1) During fiscal 2012, the sole remaining active U.S. defined benefit pension plan was frozen to new benefit accruals.
95
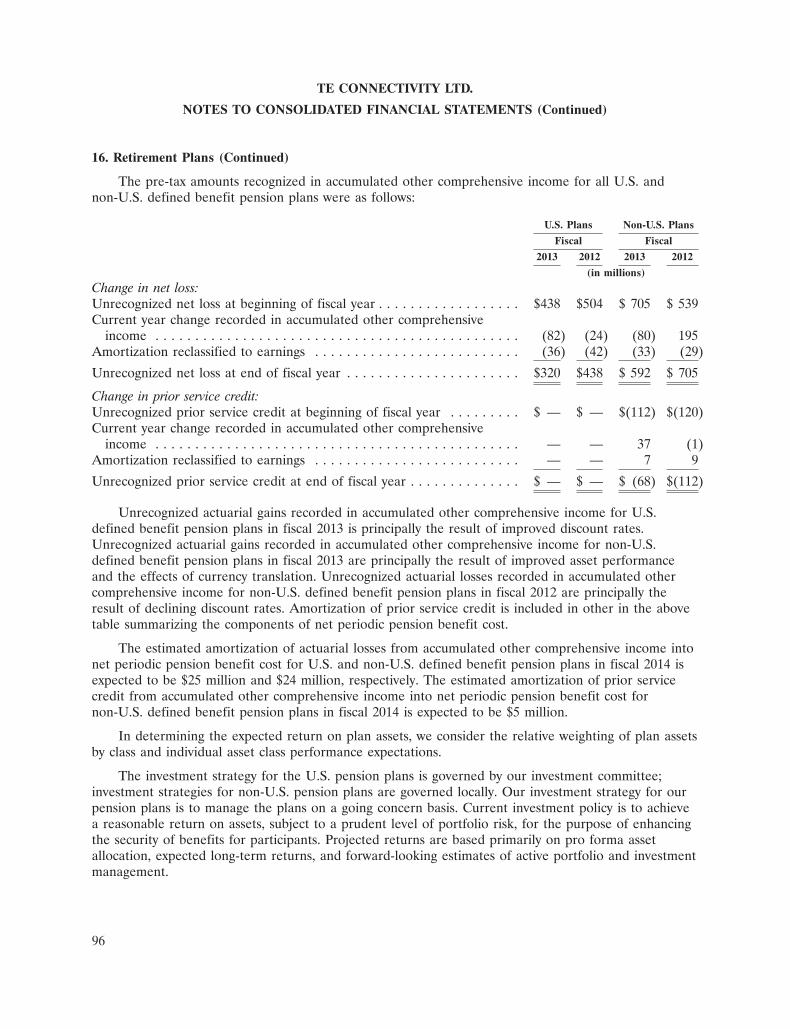
TE CONNECTIVITY LTD.
NOTES TO CONSOLIDATED FINANCIAL STATEMENTS (Continued)
16. Retirement Plans (Continued)
The pre-tax amounts recognized in accumulated other comprehensive income for all U.S. andnon-U.S. defined benefit pension plans were as follows:
U.S. Plans Non-U.S. Plans
Fiscal Fiscal
2013 2012 2013 2012
(in millions)
Change in net loss:Unrecognized net loss at beginning of fiscal year . . . . . . . . . . . . . . . . . . $438 $504 $ 705 $ 539Current year change recorded in accumulated other comprehensive
income . . . . . . . . . . . . . . . . . . . . . . . . . . . . . . . . . . . . . . . . . . . . . . (82) (24) (80) 195Amortization reclassified to earnings . . . . . . . . . . . . . . . . . . . . . . . . . . (36) (42) (33) (29)
Unrecognized net loss at end of fiscal year . . . . . . . . . . . . . . . . . . . . . . $320 $438 $ 592 $ 705
Change in prior service credit:Unrecognized prior service credit at beginning of fiscal year . . . . . . . . . $ — $ — $(112) $(120)Current year change recorded in accumulated other comprehensive
income . . . . . . . . . . . . . . . . . . . . . . . . . . . . . . . . . . . . . . . . . . . . . . — — 37 (1)Amortization reclassified to earnings . . . . . . . . . . . . . . . . . . . . . . . . . . — — 7 9
Unrecognized prior service credit at end of fiscal year . . . . . . . . . . . . . . $ — $ — $ (68) $(112)
Unrecognized actuarial gains recorded in accumulated other comprehensive income for U.S.defined benefit pension plans in fiscal 2013 is principally the result of improved discount rates.Unrecognized actuarial gains recorded in accumulated other comprehensive income for non-U.S.defined benefit pension plans in fiscal 2013 are principally the result of improved asset performanceand the effects of currency translation. Unrecognized actuarial losses recorded in accumulated othercomprehensive income for non-U.S. defined benefit pension plans in fiscal 2012 are principally theresult of declining discount rates. Amortization of prior service credit is included in other in the abovetable summarizing the components of net periodic pension benefit cost.
The estimated amortization of actuarial losses from accumulated other comprehensive income intonet periodic pension benefit cost for U.S. and non-U.S. defined benefit pension plans in fiscal 2014 isexpected to be $25 million and $24 million, respectively. The estimated amortization of prior servicecredit from accumulated other comprehensive income into net periodic pension benefit cost fornon-U.S. defined benefit pension plans in fiscal 2014 is expected to be $5 million.
In determining the expected return on plan assets, we consider the relative weighting of plan assetsby class and individual asset class performance expectations.
The investment strategy for the U.S. pension plans is governed by our investment committee;investment strategies for non-U.S. pension plans are governed locally. Our investment strategy for ourpension plans is to manage the plans on a going concern basis. Current investment policy is to achievea reasonable return on assets, subject to a prudent level of portfolio risk, for the purpose of enhancingthe security of benefits for participants. Projected returns are based primarily on pro forma assetallocation, expected long-term returns, and forward-looking estimates of active portfolio and investmentmanagement.
96

TE CONNECTIVITY LTD.
NOTES TO CONSOLIDATED FINANCIAL STATEMENTS (Continued)
16. Retirement Plans (Continued)
During fiscal 2012, our investment committee made the decision to change the target assetallocation of the U.S. plans’ master trust from a previous target of 30% equity and 70% fixed incometo 10% equity and 90% fixed income in an effort to better protect the funded status of the U.S. plans’master trust. Asset reallocation will continue over a multi-year period based on the funded status, asdefined by the Pension Protection Act of 2006 (the ‘‘Pension Act Funded Status’’), of the U.S. plans’master trust and market conditions. We expect to reach our target allocation when the Pension ActFunded Status exceeds 100%. Based on the Pension Act Funded Status as of September 27, 2013, ourtarget asset allocation is 45% equity and 55% fixed income.
Target weighted-average asset allocation and weighted-average asset allocation for U.S. andnon-U.S. pension plans were as follows:
U.S. Plans Non-U.S. Plans
Fiscal Fiscal Fiscal FiscalYear End Year End Year End Year End
Target(1) 2013 2012 Target 2013 2012
Asset Category:Equity securities . . . . . . . . . . . . . . . . . . . . . . 45% 45% 38% 43% 43% 41%Debt securities . . . . . . . . . . . . . . . . . . . . . . . 55 55 62 33 35 37Insurance contracts and other investments . . . — — — 22 20 20Real estate investments . . . . . . . . . . . . . . . . . — — — 2 2 2
Total . . . . . . . . . . . . . . . . . . . . . . . . . . . . . . 100% 100% 100% 100% 100% 100%
(1) Based on our Pension Act Funded Status as of September 27, 2013, equity securities of the U.S. plans’ master trust cannotexceed 45%.
Our common shares are not a direct investment of our pension funds; however, the pension fundsmay indirectly include our shares. The aggregate amount of our common shares would not beconsidered material relative to the total pension fund assets.
Our funding policy is to make contributions in accordance with the laws and customs of thevarious countries in which we operate as well as to make discretionary voluntary contributions fromtime to time. We anticipate that, at a minimum, we will make the minimum required contributions toour pension plans in fiscal 2014 of $3 million to U.S. plans and $84 million to non-U.S. plans.
Benefit payments, which reflect future expected service, as appropriate, are expected to be paid asfollows:
U.S. Plans Non-U.S. Plans
(in millions)
Fiscal 2014 . . . . . . . . . . . . . . . . . . . . . . . . . . . . . . . . . . . $ 68 $ 86Fiscal 2015 . . . . . . . . . . . . . . . . . . . . . . . . . . . . . . . . . . . 66 77Fiscal 2016 . . . . . . . . . . . . . . . . . . . . . . . . . . . . . . . . . . . 66 80Fiscal 2017 . . . . . . . . . . . . . . . . . . . . . . . . . . . . . . . . . . . 67 82Fiscal 2018 . . . . . . . . . . . . . . . . . . . . . . . . . . . . . . . . . . . 68 87Fiscal 2019-2023 . . . . . . . . . . . . . . . . . . . . . . . . . . . . . . . . 360 508
97
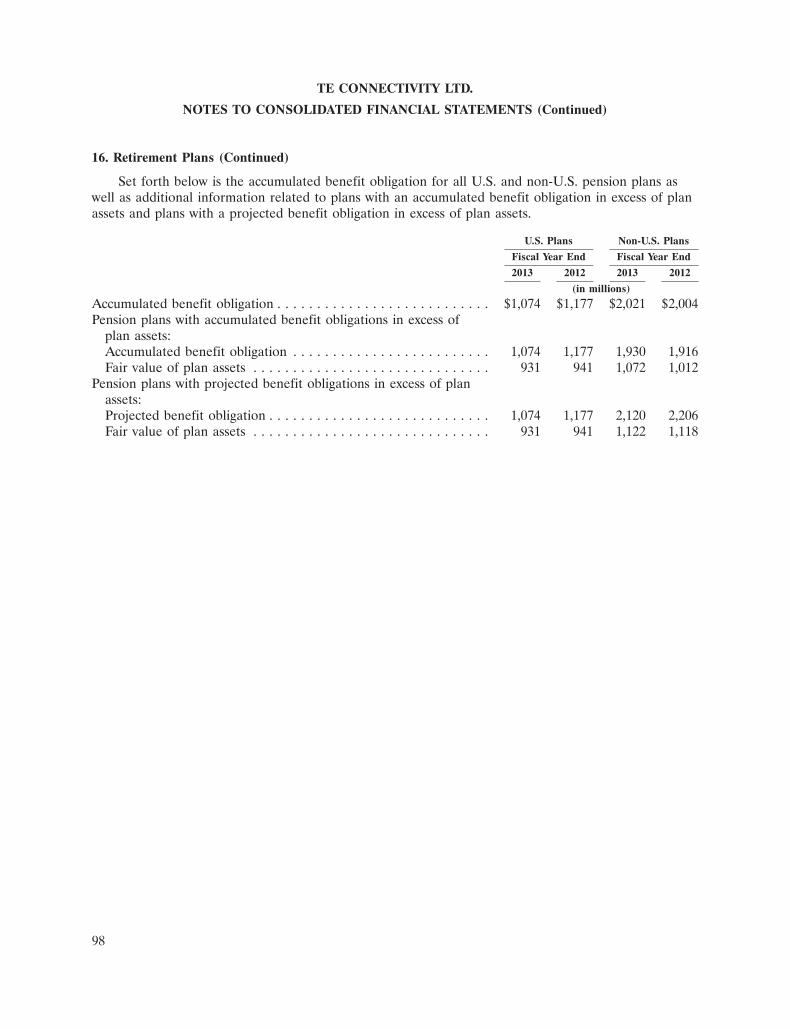
TE CONNECTIVITY LTD.
NOTES TO CONSOLIDATED FINANCIAL STATEMENTS (Continued)
16. Retirement Plans (Continued)
Set forth below is the accumulated benefit obligation for all U.S. and non-U.S. pension plans aswell as additional information related to plans with an accumulated benefit obligation in excess of planassets and plans with a projected benefit obligation in excess of plan assets.
U.S. Plans Non-U.S. Plans
Fiscal Year End Fiscal Year End
2013 2012 2013 2012
(in millions)
Accumulated benefit obligation . . . . . . . . . . . . . . . . . . . . . . . . . . . $1,074 $1,177 $2,021 $2,004Pension plans with accumulated benefit obligations in excess of
plan assets:Accumulated benefit obligation . . . . . . . . . . . . . . . . . . . . . . . . . 1,074 1,177 1,930 1,916Fair value of plan assets . . . . . . . . . . . . . . . . . . . . . . . . . . . . . . 931 941 1,072 1,012
Pension plans with projected benefit obligations in excess of planassets:Projected benefit obligation . . . . . . . . . . . . . . . . . . . . . . . . . . . . 1,074 1,177 2,120 2,206Fair value of plan assets . . . . . . . . . . . . . . . . . . . . . . . . . . . . . . 931 941 1,122 1,118
98
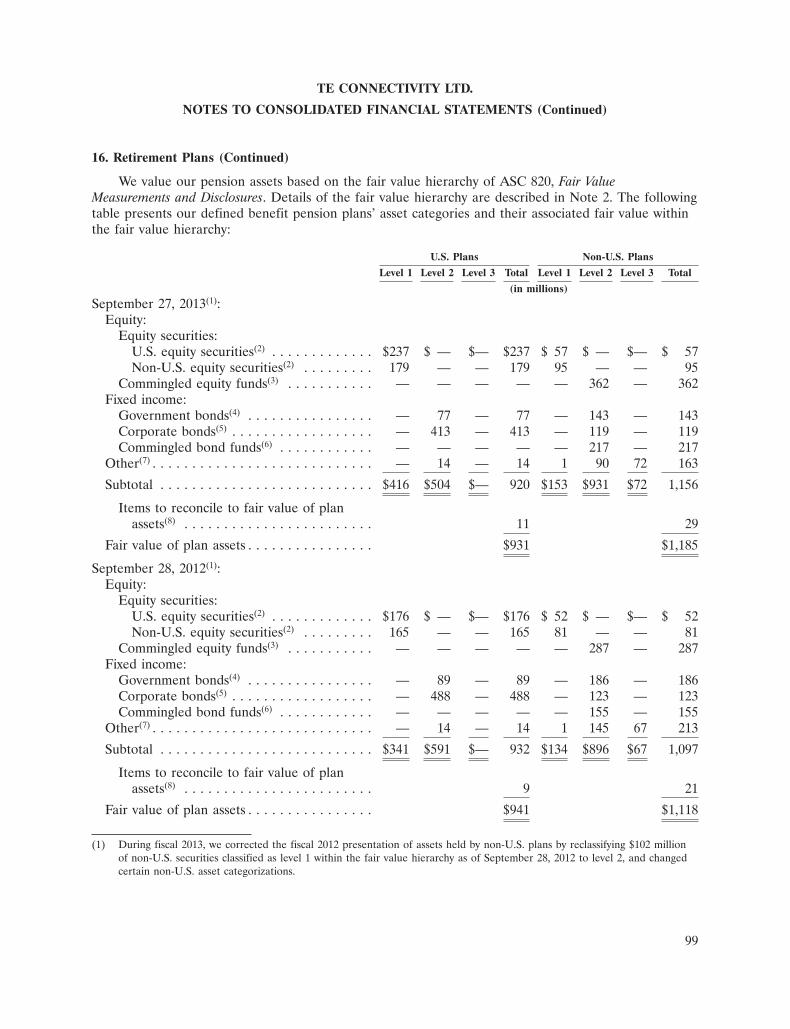
TE CONNECTIVITY LTD.
NOTES TO CONSOLIDATED FINANCIAL STATEMENTS (Continued)
16. Retirement Plans (Continued)
We value our pension assets based on the fair value hierarchy of ASC 820, Fair ValueMeasurements and Disclosures. Details of the fair value hierarchy are described in Note 2. The followingtable presents our defined benefit pension plans’ asset categories and their associated fair value withinthe fair value hierarchy:
U.S. Plans Non-U.S. Plans
Level 1 Level 2 Level 3 Total Level 1 Level 2 Level 3 Total
(in millions)
September 27, 2013(1):Equity:
Equity securities:U.S. equity securities(2) . . . . . . . . . . . . . $237 $ — $— $237 $ 57 $ — $— $ 57Non-U.S. equity securities(2) . . . . . . . . . 179 — — 179 95 — — 95
Commingled equity funds(3) . . . . . . . . . . . — — — — — 362 — 362Fixed income:
Government bonds(4) . . . . . . . . . . . . . . . . — 77 — 77 — 143 — 143Corporate bonds(5) . . . . . . . . . . . . . . . . . . — 413 — 413 — 119 — 119Commingled bond funds(6) . . . . . . . . . . . . — — — — — 217 — 217
Other(7) . . . . . . . . . . . . . . . . . . . . . . . . . . . . — 14 — 14 1 90 72 163
Subtotal . . . . . . . . . . . . . . . . . . . . . . . . . . . $416 $504 $— 920 $153 $931 $72 1,156
Items to reconcile to fair value of planassets(8) . . . . . . . . . . . . . . . . . . . . . . . . 11 29
Fair value of plan assets . . . . . . . . . . . . . . . . $931 $1,185
September 28, 2012(1):Equity:
Equity securities:U.S. equity securities(2) . . . . . . . . . . . . . $176 $ — $— $176 $ 52 $ — $— $ 52Non-U.S. equity securities(2) . . . . . . . . . 165 — — 165 81 — — 81
Commingled equity funds(3) . . . . . . . . . . . — — — — — 287 — 287Fixed income:
Government bonds(4) . . . . . . . . . . . . . . . . — 89 — 89 — 186 — 186Corporate bonds(5) . . . . . . . . . . . . . . . . . . — 488 — 488 — 123 — 123Commingled bond funds(6) . . . . . . . . . . . . — — — — — 155 — 155
Other(7) . . . . . . . . . . . . . . . . . . . . . . . . . . . . — 14 — 14 1 145 67 213
Subtotal . . . . . . . . . . . . . . . . . . . . . . . . . . . $341 $591 $— 932 $134 $896 $67 1,097
Items to reconcile to fair value of planassets(8) . . . . . . . . . . . . . . . . . . . . . . . . 9 21
Fair value of plan assets . . . . . . . . . . . . . . . . $941 $1,118
(1) During fiscal 2013, we corrected the fiscal 2012 presentation of assets held by non-U.S. plans by reclassifying $102 millionof non-U.S. securities classified as level 1 within the fair value hierarchy as of September 28, 2012 to level 2, and changedcertain non-U.S. asset categorizations.
99
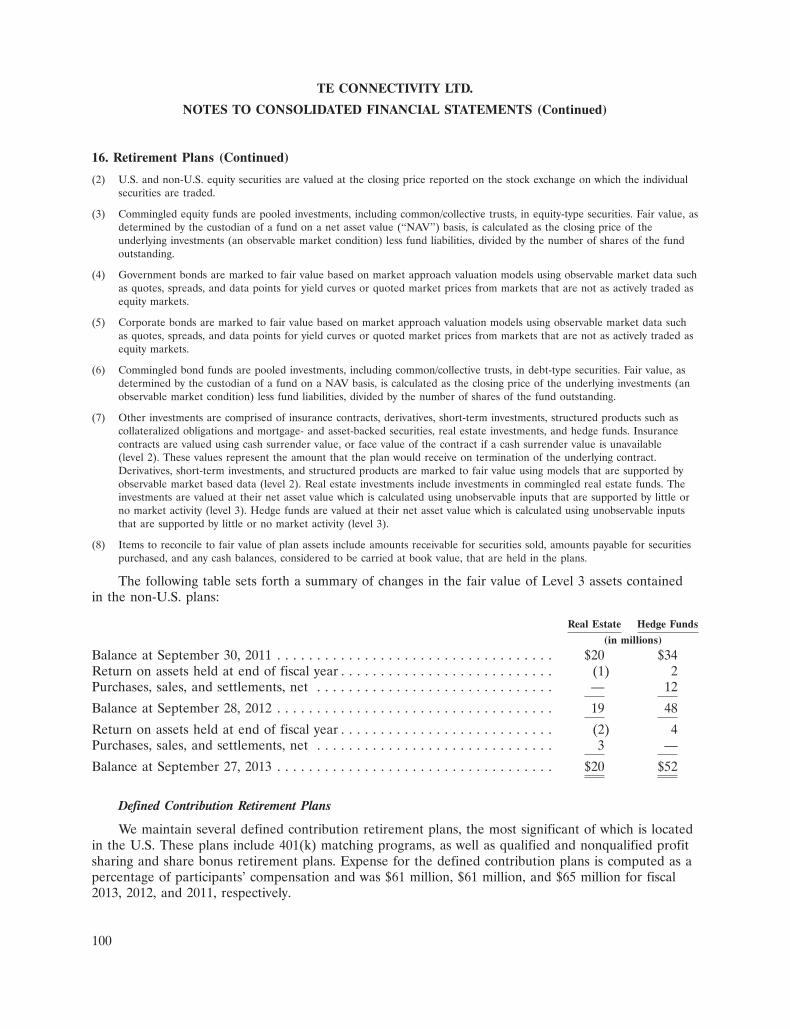
TE CONNECTIVITY LTD.
NOTES TO CONSOLIDATED FINANCIAL STATEMENTS (Continued)
16. Retirement Plans (Continued)
(2) U.S. and non-U.S. equity securities are valued at the closing price reported on the stock exchange on which the individualsecurities are traded.
(3) Commingled equity funds are pooled investments, including common/collective trusts, in equity-type securities. Fair value, asdetermined by the custodian of a fund on a net asset value (‘‘NAV’’) basis, is calculated as the closing price of theunderlying investments (an observable market condition) less fund liabilities, divided by the number of shares of the fundoutstanding.
(4) Government bonds are marked to fair value based on market approach valuation models using observable market data suchas quotes, spreads, and data points for yield curves or quoted market prices from markets that are not as actively traded asequity markets.
(5) Corporate bonds are marked to fair value based on market approach valuation models using observable market data suchas quotes, spreads, and data points for yield curves or quoted market prices from markets that are not as actively traded asequity markets.
(6) Commingled bond funds are pooled investments, including common/collective trusts, in debt-type securities. Fair value, asdetermined by the custodian of a fund on a NAV basis, is calculated as the closing price of the underlying investments (anobservable market condition) less fund liabilities, divided by the number of shares of the fund outstanding.
(7) Other investments are comprised of insurance contracts, derivatives, short-term investments, structured products such ascollateralized obligations and mortgage- and asset-backed securities, real estate investments, and hedge funds. Insurancecontracts are valued using cash surrender value, or face value of the contract if a cash surrender value is unavailable(level 2). These values represent the amount that the plan would receive on termination of the underlying contract.Derivatives, short-term investments, and structured products are marked to fair value using models that are supported byobservable market based data (level 2). Real estate investments include investments in commingled real estate funds. Theinvestments are valued at their net asset value which is calculated using unobservable inputs that are supported by little orno market activity (level 3). Hedge funds are valued at their net asset value which is calculated using unobservable inputsthat are supported by little or no market activity (level 3).
(8) Items to reconcile to fair value of plan assets include amounts receivable for securities sold, amounts payable for securitiespurchased, and any cash balances, considered to be carried at book value, that are held in the plans.
The following table sets forth a summary of changes in the fair value of Level 3 assets containedin the non-U.S. plans:
Real Estate Hedge Funds
(in millions)
Balance at September 30, 2011 . . . . . . . . . . . . . . . . . . . . . . . . . . . . . . . . . . . $20 $34Return on assets held at end of fiscal year . . . . . . . . . . . . . . . . . . . . . . . . . . . (1) 2Purchases, sales, and settlements, net . . . . . . . . . . . . . . . . . . . . . . . . . . . . . . — 12
Balance at September 28, 2012 . . . . . . . . . . . . . . . . . . . . . . . . . . . . . . . . . . . 19 48
Return on assets held at end of fiscal year . . . . . . . . . . . . . . . . . . . . . . . . . . . (2) 4Purchases, sales, and settlements, net . . . . . . . . . . . . . . . . . . . . . . . . . . . . . . 3 —
Balance at September 27, 2013 . . . . . . . . . . . . . . . . . . . . . . . . . . . . . . . . . . . $20 $52
Defined Contribution Retirement Plans
We maintain several defined contribution retirement plans, the most significant of which is locatedin the U.S. These plans include 401(k) matching programs, as well as qualified and nonqualified profitsharing and share bonus retirement plans. Expense for the defined contribution plans is computed as apercentage of participants’ compensation and was $61 million, $61 million, and $65 million for fiscal2013, 2012, and 2011, respectively.
100
TE CONNECTIVITY LTD.
NOTES TO CONSOLIDATED FINANCIAL STATEMENTS (Continued)
16. Retirement Plans (Continued)
Deferred Compensation Plans and Rabbi Trusts
We maintain nonqualified deferred compensation plans, which permit eligible employees to defer aportion of their compensation. A record keeping account is set up for each participant and theparticipant chooses from a variety of measurement funds for the deemed investment of their accounts.The measurement funds correspond to a number of funds in our 401(k) plans and the account balancefluctuates with the investment returns on those funds. Total deferred compensation liabilities were$99 million and $83 million at fiscal year end 2013 and 2012, respectively. See Note 14 for additionalinformation regarding our risk management strategy related to deferred compensation liabilities.
Additionally, we have established rabbi trusts, related to certain acquired companies, throughwhich the assets may be used to pay non-qualified plan benefits. The trusts primarily hold bonds andequities. The rabbi trust assets are subject to the claims of our creditors in the event of our insolvency;plan participants are general creditors of ours with respect to these benefits. The value of the assetsheld by these trusts, included in other assets on the Consolidated Balance Sheets, was $83 million ateach of fiscal year end 2013 and 2012. Total liabilities related to the assets held by the rabbi trust andreflected on the Consolidated Balance Sheets were $13 million and $17 million at fiscal year end 2013and 2012, respectively, and include certain deferred compensation liabilities (referred to above), splitdollar life insurance policy liabilities, and an unfunded pension plan in the U.S. Plan participants aregeneral creditors of ours with respect to these benefits.
Postretirement Benefit Plans
In addition to providing pension and 401(k) benefits, we also provide certain health care coveragecontinuation for qualifying retirees from the date of retirement to age 65.
Net periodic postretirement benefit cost was $4 million in fiscal 2013 and $3 million in each offiscal 2012 and 2011 and consisted primarily of service and interest costs. The weighted-averageassumptions used to determine net postretirement benefit cost were as follows:
Fiscal
2013 2012 2011
Discount rate . . . . . . . . . . . . . . . . . . . . . . . . . . . . . . . . . . . 3.85% 5.00% 4.95%Rate of compensation increase . . . . . . . . . . . . . . . . . . . . . . 3.35% 4.00% 4.00%
The accrued postretirement benefit obligation was $39 million and $55 million at fiscal year end2013 and 2012, respectively. The fair value of plan assets was $3 million at each of fiscal year end 2013and 2012. The underfunded status of the postretirement benefit plans was primarily included inlong-term pension and postretirement liabilities on the Consolidated Balance Sheets. The weighted-average assumptions used to determine the postretirement benefit obligation were as follows:
Fiscal YearEnd
2013 2012
Discount rate . . . . . . . . . . . . . . . . . . . . . . . . . . . . . . . . . . . . . . . . . 4.85% 3.85%Rate of compensation increase . . . . . . . . . . . . . . . . . . . . . . . . . . . . 4.00% 3.35%
101

TE CONNECTIVITY LTD.
NOTES TO CONSOLIDATED FINANCIAL STATEMENTS (Continued)
16. Retirement Plans (Continued)
Unrecognized prior service costs and actuarial gains of $6 million and losses of $11 million at fiscalyear end 2013 and 2012, respectively, were recorded in accumulated other comprehensive income.Amortization of these balances into net periodic postretirement benefit cost is expected to beinsignificant in fiscal 2014.
Our investment strategy for our postretirement benefit plans is to achieve a reasonable return onassets, subject to a prudent level of portfolio risk. The plan is invested in debt securities, which areconsidered level 2 in the fair value hierarchy, and equity securities, which are considered level 1 in thefair value hierarchy, and targets an allocation of 50% in each category.
We anticipate that we will make insignificant contributions to our postretirement benefit plans infiscal 2014.
Benefit payments, which reflect future expected service, as appropriate, are expected to be$3 million annually from fiscal 2014 through fiscal 2018 and $13 million in total from fiscal 2019through fiscal 2023. Health care cost trend assumptions used to determine the postretirement benefitobligation were as follows:
Fiscal Year End
2013 2012
Health care cost trend rate assumed for next fiscal year . . . . . . . . . . 7.33% 7.51%Rate to which the cost trend rate is assumed to decline . . . . . . . . . . 4.50% 4.50%Fiscal year the ultimate trend rate is achieved . . . . . . . . . . . . . . . . . 2029 2029
A one-percentage point change in assumed healthcare cost trend rates would have the followingeffects:
One Percentage One PercentagePoint Increase Point Decrease
(in millions)
Effect on total of service and interest cost . . . . . . . . . . $— $—Effect on postretirement benefit obligation . . . . . . . . . 3 (3)
102
TE CONNECTIVITY LTD.
NOTES TO CONSOLIDATED FINANCIAL STATEMENTS (Continued)
17. Income Taxes
Our operations are conducted through our various subsidiaries in a number of countriesthroughout the world. We have provided for income taxes based upon the tax laws and rates in thecountries in which our operations are conducted and income and loss from operations is subject totaxation.
Significant components of the income tax provision (benefit) were as follows:
Fiscal
2013 2012 2011
(in millions)
Current:U.S.:
Federal . . . . . . . . . . . . . . . . . . . . . . . . . . . . . . . . . . $ (295) $ 92 $ 50State . . . . . . . . . . . . . . . . . . . . . . . . . . . . . . . . . . . . (85) 11 20
Non-U.S. . . . . . . . . . . . . . . . . . . . . . . . . . . . . . . . . . . 321 194 174
Current income tax provision (benefit) . . . . . . . . . . . . . (59) 297 244
Deferred:U.S.:
Federal . . . . . . . . . . . . . . . . . . . . . . . . . . . . . . . . . . 71 (50) 55State . . . . . . . . . . . . . . . . . . . . . . . . . . . . . . . . . . . . (1) 4 —
Non-U.S. . . . . . . . . . . . . . . . . . . . . . . . . . . . . . . . . . . (40) (2) 48
Deferred income tax provision (benefit) . . . . . . . . . . . . 30 (48) 103
Provision (benefit) for income taxes . . . . . . . . . . . . . . . $ (29) $ 249 $ 347
The U.S. and non-U.S. components of income from continuing operations before income taxeswere as follows:
Fiscal
2013 2012 2011
(in millions)
U.S. . . . . . . . . . . . . . . . . . . . . . . . . . . . . . . . . . . . . . . . $ (238) $ (96) $ 134Non-U.S. . . . . . . . . . . . . . . . . . . . . . . . . . . . . . . . . . . . . 1,486 1,511 1,441
Income from continuing operations before income taxes . . $1,248 $1,415 $1,575
103
TE CONNECTIVITY LTD.
NOTES TO CONSOLIDATED FINANCIAL STATEMENTS (Continued)
17. Income Taxes (Continued)
The reconciliation between U.S. federal income taxes at the statutory rate and provision (benefit)for income taxes on continuing operations was as follows:
Fiscal
2013 2012 2011
(in millions)
Notional U.S. federal income tax provision at the statutory rate . . . . . . . . . . . . $ 437 $ 495 $ 551Adjustments to reconcile to the income tax provision (benefit):
U.S. state income tax provision (benefit), net . . . . . . . . . . . . . . . . . . . . . . . (56) 10 13Other (income) expense—Tax Sharing Agreement . . . . . . . . . . . . . . . . . . . . 64 (18) (9)Tax law changes . . . . . . . . . . . . . . . . . . . . . . . . . . . . . . . . . . . . . . . . . . . . . — 21 (4)Tax credits . . . . . . . . . . . . . . . . . . . . . . . . . . . . . . . . . . . . . . . . . . . . . . . . (11) (9) (9)Non-U.S. net earnings(1) . . . . . . . . . . . . . . . . . . . . . . . . . . . . . . . . . . . . . . . (277) (225) (253)Nondeductible charges . . . . . . . . . . . . . . . . . . . . . . . . . . . . . . . . . . . . . . . . 3 3 14Change in accrued income tax liabilities . . . . . . . . . . . . . . . . . . . . . . . . . . . (162) 95 30Valuation allowance . . . . . . . . . . . . . . . . . . . . . . . . . . . . . . . . . . . . . . . . . . (31) (107) 1Other . . . . . . . . . . . . . . . . . . . . . . . . . . . . . . . . . . . . . . . . . . . . . . . . . . . . 4 (16) 13
Provision (benefit) for income taxes . . . . . . . . . . . . . . . . . . . . . . . . . . . . . . $ (29) $ 249 $ 347
(1) Excludes nondeductible charges and other items which are broken out separately in the table.
The tax benefit for fiscal 2013 reflects an income tax benefit of $331 million related to theeffective settlement of all undisputed tax matters for the period 1997 through 2000. In addition, the taxbenefit for fiscal 2013 reflects $23 million of net tax benefits primarily consisting of income tax benefitsrecognized in connection with a reduction in the valuation allowance associated with certain ADC taxloss carryforwards and income tax benefits recognized in connection with the lapse of statutes oflimitations for examinations of prior year income tax returns, partially offset by income tax expenserelated to adjustments to prior year income tax returns.
We assessed the realization of ADC’s tax loss and credit carryforwards that we acquired inconnection with our purchase of ADC, and we believe it is more likely than not that a tax benefit willbe realized on additional U.S. federal and state net operating losses. Based upon the fiscal years 2011through 2013 U.S. operating results of the ADC business under our management, we reduced thevaluation allowance provided at the date of acquisition and recorded a tax benefit of $63 million. As offiscal year end 2013, we continue to maintain a valuation allowance of $177 million related to U.S.federal and state ADC tax attributes due to the uncertainty of their realization in the future.
The tax provision for fiscal 2012 reflects an income tax benefit of $107 million recognized inconnection with a reduction in the valuation allowance associated with tax loss carryforwards in certainnon-U.S. locations. In addition, the tax provision for fiscal 2012 reflects $17 million of income taxexpense associated with certain non-U.S. tax rate changes enacted in the quarter ended December 30,2011.
The tax provision for fiscal 2011 reflects income tax benefits of $35 million associated with thecompletion of fieldwork and the settlement of certain U.S. tax matters.
104
TE CONNECTIVITY LTD.
NOTES TO CONSOLIDATED FINANCIAL STATEMENTS (Continued)
17. Income Taxes (Continued)
Deferred income taxes result from temporary differences between the amount of assets andliabilities recognized for financial reporting and tax purposes. The components of the net deferredincome tax asset were as follows:
Fiscal Year End
2013 2012
(in millions)
Deferred tax assets:Accrued liabilities and reserves . . . . . . . . . . . . . . . . . . . . . . . . $ 320 $ 270Tax loss and credit carryforwards . . . . . . . . . . . . . . . . . . . . . . 3,431 3,382Inventories . . . . . . . . . . . . . . . . . . . . . . . . . . . . . . . . . . . . . . 55 54Pension and postretirement benefits . . . . . . . . . . . . . . . . . . . . 235 331Deferred revenue . . . . . . . . . . . . . . . . . . . . . . . . . . . . . . . . . . 5 15Interest . . . . . . . . . . . . . . . . . . . . . . . . . . . . . . . . . . . . . . . . . 372 342Unrecognized income tax benefits . . . . . . . . . . . . . . . . . . . . . . 364 469Other . . . . . . . . . . . . . . . . . . . . . . . . . . . . . . . . . . . . . . . . . . 19 22
4,801 4,885
Deferred tax liabilities:Intangible assets . . . . . . . . . . . . . . . . . . . . . . . . . . . . . . . . . . (778) (764)Property, plant, and equipment . . . . . . . . . . . . . . . . . . . . . . . . (64) (101)Other . . . . . . . . . . . . . . . . . . . . . . . . . . . . . . . . . . . . . . . . . . (38) (85)
(880) (950)
Net deferred tax asset before valuation allowance . . . . . . . . . . . . 3,921 3,935Valuation allowance . . . . . . . . . . . . . . . . . . . . . . . . . . . . . . . . . (1,816) (1,719)
Net deferred tax asset . . . . . . . . . . . . . . . . . . . . . . . . . . . . . . $ 2,105 $ 2,216
Unrecognized income tax benefits decreased primarily due to the effective settlement of the IRS’saudit of all tax matters for the period 1997 through 2000, excluding the disputed issue involving the taxtreatment of certain intercompany debt transactions. See Note 13 for additional information regardingthe effective settlement. Pension and postretirement benefits decreased primarily due to a reduction inthe pension obligation. See Note 16 for additional information regarding the retirement plans.
At fiscal year end 2013, we had approximately $1,597 million of U.S. federal and $124 million ofU.S. state net operating loss carryforwards (tax effected) which will expire in future years through 2033.In addition, at fiscal year end 2013, we had approximately $171 million of U.S. federal tax creditcarryforwards, of which $46 million have no expiration and $125 million will expire in future yearsthrough 2033, and $37 million of U.S. state tax credits carryforwards which will expire in future yearsthrough 2028.
At fiscal year end 2013, we had approximately $1,461 million of net operating loss carryforwards(tax effected) in certain non-U.S. jurisdictions, of which $1,300 million have no expiration and$161 million will expire in future years through 2033. Also, at fiscal year end 2013, there were$1 million of non-U.S. tax credit carryforwards which have no expiration. In addition, $40 million ofnon-U.S. capital loss carryforwards (tax effected) have no expiration.
105

TE CONNECTIVITY LTD.
NOTES TO CONSOLIDATED FINANCIAL STATEMENTS (Continued)
17. Income Taxes (Continued)
The valuation allowance for deferred tax assets of $1,816 million and $1,719 million at fiscal yearend 2013 and 2012, respectively, relates principally to the uncertainty of the utilization of certaindeferred tax assets, primarily tax loss, capital loss, and credit carryforwards in various jurisdictions. Webelieve that we will generate sufficient future taxable income to realize the income tax benefits relatedto the remaining net deferred tax assets on our Consolidated Balance Sheet. The valuation allowancewas calculated in accordance with the provisions of ASC 740, Income Taxes, which require that avaluation allowance be established or maintained when it is more likely than not that all or a portion ofdeferred tax assets will not be realized. At fiscal year end 2013, approximately $79 million of thevaluation allowance relates to share-based compensation and will be recorded to equity if certain netoperating losses and tax credit carryforwards are utilized.
The calculation of our tax liabilities includes estimates for uncertainties in the application ofcomplex tax regulations across multiple global jurisdictions where we conduct our operations. Underthe uncertain tax position provisions of ASC 740, we recognize liabilities for tax and related interest forissues in the U.S. and other tax jurisdictions based on our estimate of whether, and the extent to which,additional taxes and related interest will be due. These tax liabilities and related interest are reflectednet of the impact of related tax loss carryforwards, as such tax loss carryforwards will be applied againstthese tax liabilities and will reduce the amount of cash tax payments due upon the eventual settlementwith the tax authorities. These estimates may change due to changing facts and circumstances. Due tothe complexity of these uncertainties, the ultimate resolution may result in a settlement that differsfrom our current estimate of the tax liabilities and related interest. Furthermore, management hasreviewed with tax counsel the issues raised by certain taxing authorities and the adequacy of theserecorded amounts. If our current estimate of tax and interest liabilities is less than the ultimatesettlement, an additional charge to income tax expense may result. If our current estimate of tax andinterest liabilities is more than the ultimate settlement, income tax benefits may be recognized.
We have provided income taxes for earnings that are currently distributed as well as the taxesassociated with several subsidiaries’ earnings that are expected to be distributed in the future. Noadditional provision has been made for Swiss or non-Swiss income taxes on the undistributed earningsof subsidiaries or for unrecognized deferred tax liabilities for temporary differences related to basisdifferences in investments in subsidiaries, as such earnings are expected to be permanently reinvested,the investments are essentially permanent in duration, or we have concluded that no additional taxliability will arise as a result of the distribution of such earnings. As of September 27, 2013, certainsubsidiaries had approximately $18 billion of cumulative undistributed earnings that have been retainedindefinitely and reinvested in our global manufacturing operations, including working capital, property,plant, and equipment, intangible assets, and research and development activities. A liability could ariseif our intention to permanently reinvest such earnings were to change and amounts are distributed bysuch subsidiaries or if such subsidiaries are ultimately disposed. It is not practicable to estimate theadditional income taxes related to permanently reinvested earnings or the basis differences related toinvestments in subsidiaries. As of September 27, 2013, we had approximately $4.5 billion of cash, cashequivalents, and intercompany deposits, principally in our subsidiaries, that we have the ability todistribute to TEGSA, our Luxembourg subsidiary, which is the obligor of substantially all of our debt,and to TE Connectivity Ltd., our Swiss parent company, but we consider to be permanently reinvested.We estimate that up to approximately $1.5 billion of tax expense would be recognized on ourConsolidated Financial Statements if our intention to permanently reinvest these amounts were tochange. Our current plans do not demonstrate a need to repatriate cash, cash equivalents, and
106

TE CONNECTIVITY LTD.
NOTES TO CONSOLIDATED FINANCIAL STATEMENTS (Continued)
17. Income Taxes (Continued)
intercompany deposits that are designated as permanently reinvested in order to fund our operations,including investing and financing activities.
Uncertain Tax Position Provisions of ASC 740
As of September 27, 2013, we had total unrecognized income tax benefits of $1,620 million. Ifrecognized in future periods, $1,471 million of these currently unrecognized income tax benefits wouldimpact the income tax provision and effective tax rate. As of September 28, 2012, we had totalunrecognized income tax benefits of $1,795 million. If recognized in future periods, $1,714 million ofthese unrecognized income tax benefits would impact the income tax provision and effective tax rate.The following table summarizes the activity related to unrecognized income tax benefits:
Fiscal
2013 2012 2011
(in millions)
Balance at beginning of fiscal year . . . . . . . . . . . . . . . . . . $1,795 $1,783 $1,689Additions related to prior periods tax positions . . . . . . . . 90 41 123Reductions related to prior periods tax positions . . . . . . . (271) (36) (98)Additions related to current period tax positions . . . . . . . 88 31 43Acquisitions . . . . . . . . . . . . . . . . . . . . . . . . . . . . . . . . . . — 7 45Settlements . . . . . . . . . . . . . . . . . . . . . . . . . . . . . . . . . . (8) (12) (3)Reductions due to lapse of applicable statute of
limitations . . . . . . . . . . . . . . . . . . . . . . . . . . . . . . . . . (74) (19) (16)
Balance at end of fiscal year . . . . . . . . . . . . . . . . . . . . . . $1,620 $1,795 $1,783
We record accrued interest as well as penalties related to uncertain tax positions as part of theprovision for income taxes. As of September 27, 2013, we had recorded $1,018 million of accruedinterest and penalties related to uncertain tax positions on the Consolidated Balance Sheet of which$1,015 million was recorded in income taxes and $3 million was recorded in accrued and other currentliabilities. As of September 28, 2012, the balance of accrued interest and penalties was $1,335 million ofwhich $1,299 million was recorded in income taxes and $36 million was recorded in accrued and othercurrent liabilities. The decrease in the accrued interest and penalties from fiscal year end 2012 is duemainly to the effective settlement of all undisputed tax matters for the period 1997 through 2000.During fiscal 2013, 2012, and 2011, we recognized a benefit of $247 million, expense of $95 million, andexpense of $86 million, respectively, related to interest and penalties on the Consolidated Statements ofOperations.
For tax years 1997 through 2004, Tyco International has resolved all matters, excluding onedisputed issue related to the tax treatment of certain intercompany debt transactions. The IRScommenced its audit of certain Tyco International income tax returns for the years 2005 through 2007in fiscal 2011, and it is our understanding that fieldwork for this audit period is expected to becompleted in fiscal 2014. Also, during fiscal 2012, the IRS commenced its audit of our income taxreturns for the years 2008 through 2010. We expect fieldwork for the 2008 through 2010 audit toconclude in fiscal 2014. See Note 13 for additional information regarding the status of IRSexaminations.
107

TE CONNECTIVITY LTD.
NOTES TO CONSOLIDATED FINANCIAL STATEMENTS (Continued)
17. Income Taxes (Continued)
We file income tax returns on a unitary, consolidated, or stand-alone basis in multiple state andlocal jurisdictions, which generally have statutes of limitations ranging from 3 to 4 years. Various stateand local income tax returns are currently in the process of examination or administrative appeal.
Our non-U.S. subsidiaries file income tax returns in the countries in which they have operations.Generally, these countries have statutes of limitations ranging from 3 to 10 years. Various non-U.S.subsidiary income tax returns are currently in the process of examination by taxing authorities.
As of September 27, 2013, under applicable statutes, the following tax years remained subject toexamination in the major tax jurisdictions indicated:
Jurisdiction Open Years
Belgium . . . . . . . . . . . . . . . . . . . . . . . . . . . . . . . . . . 2011 through 2013Brazil . . . . . . . . . . . . . . . . . . . . . . . . . . . . . . . . . . . . 2008 through 2013Canada . . . . . . . . . . . . . . . . . . . . . . . . . . . . . . . . . . 2002 and 2005 through 2013China . . . . . . . . . . . . . . . . . . . . . . . . . . . . . . . . . . . . 2003 through 2013Czech Republic . . . . . . . . . . . . . . . . . . . . . . . . . . . . 2010 through 2013France . . . . . . . . . . . . . . . . . . . . . . . . . . . . . . . . . . . 2010 through 2013Germany . . . . . . . . . . . . . . . . . . . . . . . . . . . . . . . . . 2008 through 2013Hong Kong . . . . . . . . . . . . . . . . . . . . . . . . . . . . . . . 2007 through 2013India . . . . . . . . . . . . . . . . . . . . . . . . . . . . . . . . . . . . 2006 through 2013Italy . . . . . . . . . . . . . . . . . . . . . . . . . . . . . . . . . . . . . 2008 through 2013Japan . . . . . . . . . . . . . . . . . . . . . . . . . . . . . . . . . . . . 2007 through 2013Korea . . . . . . . . . . . . . . . . . . . . . . . . . . . . . . . . . . . 2007 through 2013Luxembourg . . . . . . . . . . . . . . . . . . . . . . . . . . . . . . . 2008 through 2013Netherlands . . . . . . . . . . . . . . . . . . . . . . . . . . . . . . . 2008 through 2013Portugal . . . . . . . . . . . . . . . . . . . . . . . . . . . . . . . . . . 2009 through 2013Singapore . . . . . . . . . . . . . . . . . . . . . . . . . . . . . . . . . 2006 through 2013Spain . . . . . . . . . . . . . . . . . . . . . . . . . . . . . . . . . . . . 2009 through 2013Switzerland . . . . . . . . . . . . . . . . . . . . . . . . . . . . . . . . 2011 through 2013United Kingdom . . . . . . . . . . . . . . . . . . . . . . . . . . . . 2011 through 2013U.S.—federal and state and local . . . . . . . . . . . . . . . . 1997 through 2013
In most jurisdictions, taxing authorities retain the ability to review prior tax years and to adjust anynet operating loss and tax credit carryforwards from these years that are utilized in a subsequentperiod.
Although it is difficult to predict the timing or results of our worldwide examinations, we estimatethat up to approximately $190 million of unrecognized income tax benefits, excluding the impactrelating to accrued interest and penalties, could be resolved within the next twelve months.
We are not aware of any other matters that would result in significant changes to the amount ofunrecognized income tax benefits reflected on the Consolidated Balance Sheet as of September 27,2013.
108
TE CONNECTIVITY LTD.
NOTES TO CONSOLIDATED FINANCIAL STATEMENTS (Continued)
18. Other Income (Expense), Net
In fiscal 2013, 2012, and 2011, we recorded net other expense of $183 million, net other income of$50 million, and net other income of $27 million, respectively, primarily pursuant to the Tax SharingAgreement with Tyco International and Covidien. See Note 12 for further information regarding theTax Sharing Agreement. The net other expense in fiscal 2013 included $231 million related to theeffective settlement of all undisputed tax matters for the period 1997 through 2000. See Note 13 foradditional information.
19. Earnings Per Share
The weighted-average number of shares outstanding used in the computation of basic and dilutedearnings per share was as follows:
Fiscal
2013 2012 2011
(in millions)
Basic . . . . . . . . . . . . . . . . . . . . . . . . . . . . . . . . . . . . . . . . . . . . . 418 426 438Dilutive impact of share-based compensation arrangements . . . . . 5 4 5
Diluted . . . . . . . . . . . . . . . . . . . . . . . . . . . . . . . . . . . . . . . . . . . 423 430 443
Certain share options were not included in the computation of diluted earnings per share becausethe instruments’ underlying exercise prices were greater than the average market prices of our commonshares and inclusion would be antidilutive. Share options not included in the computation totaled3 million, 12 million, and 13 million for fiscal 2013, 2012, and 2011, respectively.
20. Equity
Common Shares
We are organized under the laws of Switzerland. The rights of holders of our shares are governedby Swiss law, our Swiss articles of association, and our Swiss organizational regulations. Accordingly,the par value of our common shares is stated in Swiss Francs (‘‘CHF’’). We continue to use the U.S.Dollar, however, as our reporting currency on our Consolidated Financial Statements.
Subject to certain conditions specified in our articles of association, we are authorized to increaseour share capital by issuing new shares in aggregate not exceeding 50% of our authorized shares. InMarch 2013, our shareholders reapproved and extended through March 6, 2015 our board of directors’authorization to issue additional new shares, subject to certain conditions specified in the articles, inaggregate not exceeding 50% of the amount of our authorized shares.
Common Shares Held in Treasury
At September 27, 2013, approximately 17 million common shares were held in treasury, of which8 million were owned by one of our subsidiaries. At September 28, 2012, approximately 16 millioncommon shares were held in treasury, of which 11 million were owned by one of our subsidiaries.Shares held both directly by us and by our subsidiary are presented as treasury shares on theConsolidated Balance Sheets.
109
TE CONNECTIVITY LTD.
NOTES TO CONSOLIDATED FINANCIAL STATEMENTS (Continued)
20. Equity (Continued)
In March 2013, our shareholders approved the cancellation of 10 million shares repurchased underour share repurchase program during the period from December 31, 2011 to December 28, 2012. Thecapital reduction by cancellation of shares was subject to a notice period and filing with the commercialregister and became effective in May 2013.
In March 2012, our shareholders approved the cancellation of 24 million shares repurchased underour share repurchase program during the period from December 25, 2010 to December 30, 2011. Thecapital reduction by cancellation of shares was subject to a notice period and filing with the commercialregister and became effective in May 2012.
In March 2011, our shareholders approved the cancellation of 5 million shares repurchased underour share repurchase program during the period from July 27, 2010 to December 24, 2010. The capitalreduction by cancellation of shares was subject to a notice period and filing with the commercialregister and became effective in May 2011.
Contributed Surplus
Contributed surplus established for Swiss tax and statutory purposes (‘‘Swiss Contributed Surplus’’),subject to certain conditions, is a freely distributable reserve. Distributions to shareholders from SwissContributed Surplus are free from withholding tax. As of September 27, 2013 and September 28, 2012,Swiss Contributed Surplus was CHF 9,342 million and CHF 9,745 million, respectively (equivalent to$8,520 million and $8,940 million, respectively).
Dividends and Distributions to Shareholders
Under Swiss law, subject to certain conditions, distributions to shareholders made in the form of areduction of registered share capital or from reserves from capital contributions (equivalent to SwissContributed Surplus) are exempt from Swiss withholding tax. See ‘‘Contributed Surplus’’ for additionalinformation regarding our ability to make distributions free from withholding tax from contributedsurplus. Distributions or dividends on our shares must be approved by our shareholders.
In March 2010, our shareholders approved a cash distribution to shareholders in the form of acapital reduction to the par value of our common shares of CHF 0.72 (equivalent to $0.64) per share,payable in four equal quarterly installments of $0.16 per share beginning in the third quarter of fiscal2010 through the second quarter of fiscal 2011. We paid the third and fourth installments of thedistribution during the quarters ended December 24, 2010 and March 25, 2011, respectively. Thesecapital reductions reduced the par value of our common shares from CHF 1.73 (equivalent to $1.60) toCHF 1.37 (equivalent to $1.28).
In March 2011, our shareholders approved a dividend payment to shareholders of CHF 0.68(equivalent to $0.72) per share out of contributed surplus, payable in four equal quarterly installmentsbeginning in the third quarter of fiscal 2011 through the second quarter of fiscal 2012. We paid theinstallments of the dividend at a rate of $0.18 per share during each of the quarters ended June 24,2011, September 30, 2011, December 30, 2011, and March 30, 2012.
In March 2012, our shareholders approved a cash distribution to shareholders in the form of acapital reduction to the par value of our common shares of CHF 0.80 (equivalent to $0.84) per share,payable in four equal quarterly installments beginning in the third quarter of fiscal 2012 through thesecond quarter of fiscal 2013. We paid the installments of the distribution at a rate of $0.21 per share
110

TE CONNECTIVITY LTD.
NOTES TO CONSOLIDATED FINANCIAL STATEMENTS (Continued)
20. Equity (Continued)
during each of the quarters ended June 29, 2012, September 28, 2012, December 28, 2012 andMarch 29, 2013. These capital reductions reduced the par value of our common shares from CHF 1.37(equivalent to $1.28) to CHF 0.57 (equivalent to $0.44).
In March 2013, our shareholders approved a dividend payment to shareholders of CHF 0.96(equivalent to $1.00) per share out of contributed surplus, payable in four equal quarterly installmentsbeginning in the third quarter of fiscal 2013 through the second quarter of fiscal 2014. We paid the firstand second installments of the dividend at a rate of $0.25 per share during each of the quarters endedJune 28, 2013 and September 27, 2013.
Upon approval by the shareholders of a dividend payment or cash distribution in the form of acapital reduction, we record a liability with a corresponding charge to contributed surplus or commonshares. At September 27, 2013 and September 28, 2012, the unpaid portion of the dividends anddistributions recorded in accrued and other current liabilities on the Consolidated Balance Sheetstotaled $206 million and $178 million, respectively.
Share Repurchase Program
During fiscal 2013, 2012, and 2011, we repurchased approximately 20 million of our commonshares for $829 million, approximately 6 million of our common shares for $194 million, andapproximately 25 million of our common shares for $867 million, respectively. At September 27, 2013,we had $478 million of availability remaining under our share repurchase authorization. See additionalinformation regarding the share repurchase program in Note 25.
21. Accumulated Other Comprehensive Income
The components of accumulated other comprehensive income were as follows:
Unrecognized Gain (Loss) AccumulatedPension and on Cash Other
Currency Postretirement Flow ComprehensiveTranslation(1) Benefit Costs Hedges Income
(in millions)
Balance at September 24, 2010 . . . . . . . . . . . . . $1,040 $(764) $(30) $ 246Pre-tax current period change . . . . . . . . . . . . 50 238 (21) 267Income tax (expense) benefit . . . . . . . . . . . . . — (86) 1 (85)
Balance at September 30, 2011 . . . . . . . . . . . . . 1,090 (612) (50) 428Pre-tax current period change . . . . . . . . . . . . (131) (114) 24 (221)Income tax (expense) benefit . . . . . . . . . . . . . — 26 (4) 22
Balance at September 28, 2012 . . . . . . . . . . . . . 959 (700) (30) 229Pre-tax current period change . . . . . . . . . . . . (28) 204 (36) 140Income tax (expense) benefit . . . . . . . . . . . . . — (73) 7 (66)
Balance at September 27, 2013 . . . . . . . . . . . . . $ 931 $(569) $(59) $ 303
(1) Includes hedges of net investment foreign exchange gains or losses which offset foreign exchange gains or losses attributableto the translation of the net investments.
111
TE CONNECTIVITY LTD.
NOTES TO CONSOLIDATED FINANCIAL STATEMENTS (Continued)
22. Share Plans
Equity awards (primarily restricted share awards, performance share awards, and share options)granted by us are administered by the management development and compensation committee of ourboard of directors, which consists exclusively of independent directors. Our plans, of which the TEConnectivity Ltd. 2007 Stock and Incentive Plan, as amended and restated, is the primary plan, providefor the award of annual performance bonuses and long-term performance awards, including shareoptions, restricted and performance units, deferred stock units, and other share-based awards(collectively, ‘‘Awards’’) and allow for the use of unissued shares or treasury shares to be used to satisfysuch Awards. As of September 27, 2013, our plans provided for a maximum of 67 million shares to beissued as Awards, subject to adjustment as provided under the terms of the plans. A total of 26 millionshares remained available for issuance under our plans as of September 27, 2013.
Share-Based Compensation Expense
Total share-based compensation expense, which was primarily included in selling, general, andadministrative expenses on the Consolidated Statements of Operations, was $78 million, $68 million,and $71 million during fiscal 2013, 2012, and 2011, respectively. We have recognized a related taxbenefit associated with our share-based compensation arrangements of $24 million, $21 million, and$22 million in fiscal 2013, 2012, and 2011, respectively.
Restricted Share Awards
Restricted share awards, which are generally in the form of restricted share units, are grantedsubject to certain restrictions. Conditions of vesting are determined at the time of grant. All restrictionson an award will lapse upon death or disability of the employee. If the employee satisfies retirement ornormal retirement requirements, all or a portion of the award may vest, depending on the terms andconditions of the particular grant. Recipients of restricted units have no voting rights, but do receivedividend equivalents. For grants that vest based on certain specified performance criteria, the fair valueof the shares or units is expensed over the period of performance, once achievement of criteria isdeemed probable. For grants that vest through passage of time, the fair value of the award at the timeof the grant is amortized to expense over the period of vesting. The fair value of restricted shareawards is determined based on the closing value of our shares on the grant date. Restricted shareawards generally vest in increments over a period of four years as determined by the managementdevelopment and compensation committee.
A summary of restricted share award activity is presented below:
Weighted-AverageGrant-Date
Shares Fair Value
Non-vested at September 28, 2012 . . . . . . . . . . . . . . . . 4,585,994 $30.09Granted . . . . . . . . . . . . . . . . . . . . . . . . . . . . . . . . . . . 1,764,936 34.69Vested . . . . . . . . . . . . . . . . . . . . . . . . . . . . . . . . . . . . (1,906,890) 26.65Forfeited . . . . . . . . . . . . . . . . . . . . . . . . . . . . . . . . . . (460,115) 32.50
Non-vested at September 27, 2013 . . . . . . . . . . . . . . . . 3,983,925 $33.50
The weighted-average grant-date fair value of restricted share awards granted during fiscal 2013,2012, and 2011 was $34.69, $34.63, and $34.14, respectively.
112
TE CONNECTIVITY LTD.
NOTES TO CONSOLIDATED FINANCIAL STATEMENTS (Continued)
22. Share Plans (Continued)
As of September 27, 2013, there was $81 million of unrecognized compensation cost related tonon-vested restricted share awards. The cost is expected to be recognized over a weighted-averageperiod of 1.7 years.
Performance Share Awards
Performance share awards, which are generally in the form of performance share units, are grantedwith pay-out subject to vesting requirements and certain performance conditions that are determined atthe time of grant. Based on our performance, the pay-out of performance share units can range from0% to 200% of the number of units originally granted. Certain employees who receive performanceshare awards also are granted an opportunity to earn additional performance shares subject to theattainment of additional performance criteria which are set at the time of grant. Attainment of theperformance criteria will result in an additional pay-out of performance share units equal to 100% ofthe performance share units paid out under the original performance share award. The grant date fairvalue of performance share awards is expensed over the period of performance once achievement ofthe performance criteria is deemed probable. Recipients of performance share units have no votingrights but do receive dividend equivalents. Performance share awards generally vest after a period ofthree years as determined by the management development and compensation committee of the boardof directors.
A summary of performance share award activity is presented below:
Weighted-AverageGrant-Date
Shares Fair Value
Outstanding at September 28, 2012 . . . . . . . . . . . . . . . . . — $ —Granted . . . . . . . . . . . . . . . . . . . . . . . . . . . . . . . . . . . . . 327,226 34.16Forfeited . . . . . . . . . . . . . . . . . . . . . . . . . . . . . . . . . . . . (15,807) 34.05
Outstanding at September 27, 2013 . . . . . . . . . . . . . . . . . 311,419 $34.17
As of September 27, 2013, there was $7 million of unrecognized compensation cost related tonon-vested performance share awards. The cost is expected to be recognized over a weighted-averageperiod of 2.1 years.
Share Options
Share options are granted to purchase our common shares at prices which are equal to or greaterthan the market price of the common shares on the date the option is granted. Conditions of vestingare determined at the time of grant. All restrictions on the award will lapse upon death or disability ofthe employee. If the employee satisfies retirement or normal retirement requirements, all or a portionof the award may vest, depending on the terms and conditions of the particular grant. Optionsgenerally vest and become exercisable in equal annual installments over a period of four years andexpire ten years after the date of grant.
113
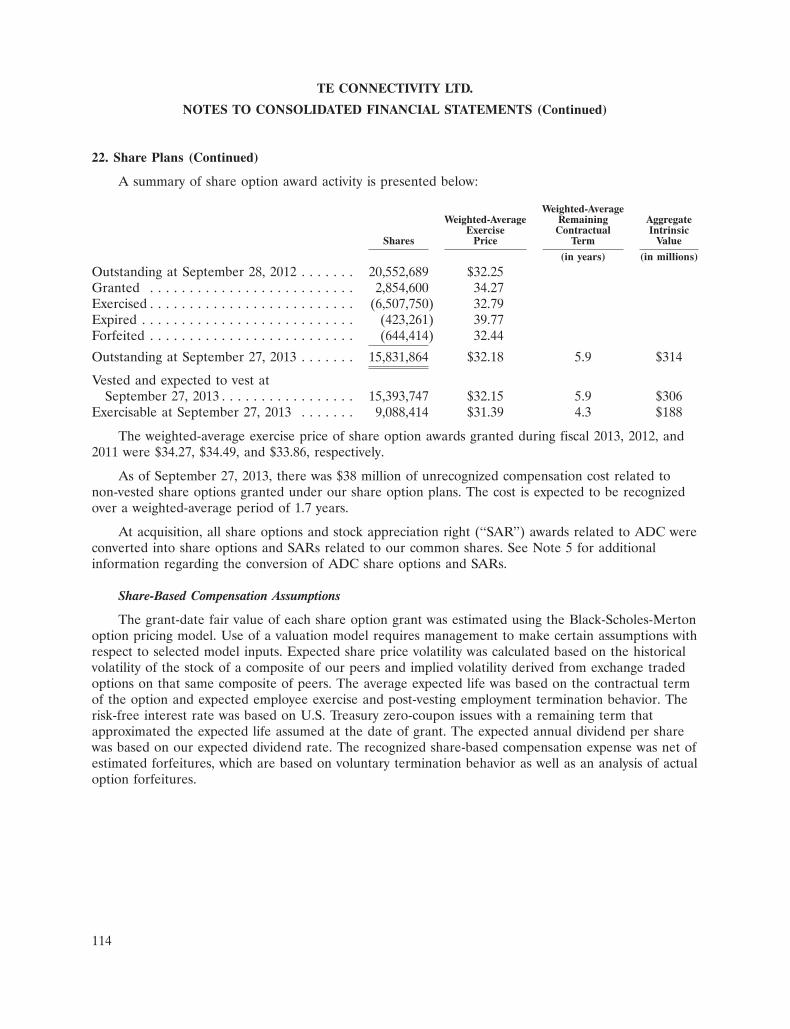
TE CONNECTIVITY LTD.
NOTES TO CONSOLIDATED FINANCIAL STATEMENTS (Continued)
22. Share Plans (Continued)
A summary of share option award activity is presented below:
Weighted-AverageWeighted-Average Remaining Aggregate
Exercise Contractual IntrinsicShares Price Term Value
(in years) (in millions)
Outstanding at September 28, 2012 . . . . . . . 20,552,689 $32.25Granted . . . . . . . . . . . . . . . . . . . . . . . . . . 2,854,600 34.27Exercised . . . . . . . . . . . . . . . . . . . . . . . . . . (6,507,750) 32.79Expired . . . . . . . . . . . . . . . . . . . . . . . . . . . (423,261) 39.77Forfeited . . . . . . . . . . . . . . . . . . . . . . . . . . (644,414) 32.44
Outstanding at September 27, 2013 . . . . . . . 15,831,864 $32.18 5.9 $314
Vested and expected to vest atSeptember 27, 2013 . . . . . . . . . . . . . . . . . 15,393,747 $32.15 5.9 $306
Exercisable at September 27, 2013 . . . . . . . 9,088,414 $31.39 4.3 $188
The weighted-average exercise price of share option awards granted during fiscal 2013, 2012, and2011 were $34.27, $34.49, and $33.86, respectively.
As of September 27, 2013, there was $38 million of unrecognized compensation cost related tonon-vested share options granted under our share option plans. The cost is expected to be recognizedover a weighted-average period of 1.7 years.
At acquisition, all share options and stock appreciation right (‘‘SAR’’) awards related to ADC wereconverted into share options and SARs related to our common shares. See Note 5 for additionalinformation regarding the conversion of ADC share options and SARs.
Share-Based Compensation Assumptions
The grant-date fair value of each share option grant was estimated using the Black-Scholes-Mertonoption pricing model. Use of a valuation model requires management to make certain assumptions withrespect to selected model inputs. Expected share price volatility was calculated based on the historicalvolatility of the stock of a composite of our peers and implied volatility derived from exchange tradedoptions on that same composite of peers. The average expected life was based on the contractual termof the option and expected employee exercise and post-vesting employment termination behavior. Therisk-free interest rate was based on U.S. Treasury zero-coupon issues with a remaining term thatapproximated the expected life assumed at the date of grant. The expected annual dividend per sharewas based on our expected dividend rate. The recognized share-based compensation expense was net ofestimated forfeitures, which are based on voluntary termination behavior as well as an analysis of actualoption forfeitures.
114

TE CONNECTIVITY LTD.
NOTES TO CONSOLIDATED FINANCIAL STATEMENTS (Continued)
22. Share Plans (Continued)
The weighted-average grant-date fair value of options granted and the weighted-averageassumptions we used in the Black-Scholes-Merton option pricing model were as follows:
Fiscal
2013 2012 2011
Weighted-average grant-date fair value . . . . . . . . . . . . . . . $8.62 $9.49 $9.13
Assumptions:Expected share price volatility . . . . . . . . . . . . . . . . . . . . . 34% 36% 36%Risk free interest rate . . . . . . . . . . . . . . . . . . . . . . . . . . . 0.9% 1.3% 1.2%Expected annual dividend per share . . . . . . . . . . . . . . . . . $0.84 $0.84 $0.72Expected life of options (in years) . . . . . . . . . . . . . . . . . . 6.0 6.0 5.1
The total intrinsic value of options exercised during fiscal 2013, 2012, and 2011 was $69 million,$31 million, and $50 million, respectively. The total fair value of restricted share awards that vestedduring fiscal 2013, 2012, and 2011 was $51 million, $42 million, and $54 million, respectively. Wereceived cash related to the exercise of options of $214 million, $60 million, and $80 million in fiscal2013, 2012, and 2011, respectively. The related excess cash tax benefit classified as a financing cashinflow on the Consolidated Statements of Cash Flows for fiscal 2013, 2012, and 2011 was not material.
23. Segment and Geographic Data
Effective for the first quarter of fiscal 2013, we reorganized our management and segments tobetter align the organization around our strategy. We now operate through four reporting segments:Transportation Solutions, Network Solutions, Industrial Solutions, and Consumer Solutions. See Note 1for a description of the segments in which we operate. We aggregate our operating segments intoreportable segments based upon similar economic characteristics and business groupings of products,services, and customers.
Segment performance is evaluated based on net sales and operating income. Generally, weconsider all expenses to be of an operating nature, and, accordingly, allocate them to each reportablesegment. Costs specific to a segment are charged to the segment. Corporate expenses, such asheadquarters administrative costs, are allocated to the segments based on segment operating income.Intersegment sales were not material and were recorded at selling prices that approximate marketprices. Corporate assets are allocated to the segments based on segment assets.
The following segment information reflects our current segment reporting structure. Prior periodsegment results have been restated to conform to the current segment reporting structure.
115

TE CONNECTIVITY LTD.
NOTES TO CONSOLIDATED FINANCIAL STATEMENTS (Continued)
23. Segment and Geographic Data (Continued)
Net sales and operating income by segment were as follows:
Net Sales Operating Income
Fiscal Fiscal
2013 2012 2011 2013 2012 2011
(in millions)
Transportation Solutions . . . . . . . . . . . . . . . . $ 5,485 $ 5,128 $ 4,912 $ 972 $ 754 $ 729Network Solutions . . . . . . . . . . . . . . . . . . . . 3,066 3,310 3,671 136 247 300Industrial Solutions . . . . . . . . . . . . . . . . . . . . 3,007 2,987 3,144 359 378 477Consumer Solutions . . . . . . . . . . . . . . . . . . . 1,722 1,857 2,051 89 139 181
Total . . . . . . . . . . . . . . . . . . . . . . . . . . . . . . $13,280 $13,282 $13,778 $1,556 $1,518 $1,687
No single customer accounted for a significant amount of our net sales in fiscal 2013, 2012, and2011.
As we are not organized by product or service, it is not practicable to disclose net sales by productor service.
Depreciation and amortization and capital expenditures were as follows:
Depreciation andAmortization Capital Expenditures
Fiscal Fiscal
2013 2012 2011 2013 2012 2011
(in millions)
Transportation Solutions . . . . . . . . . . . . . . . . $ 296 $ 271 $ 234 $ 325 $ 288 $ 264Network Solutions . . . . . . . . . . . . . . . . . . . . 139 164 158 86 104 119Industrial Solutions . . . . . . . . . . . . . . . . . . . . 92 86 86 109 67 90Consumer Solutions . . . . . . . . . . . . . . . . . . . 80 88 86 95 74 101
Total . . . . . . . . . . . . . . . . . . . . . . . . . . . . . . $ 607 $ 609 $ 564 $ 615 $ 533 $ 574
116

TE CONNECTIVITY LTD.
NOTES TO CONSOLIDATED FINANCIAL STATEMENTS (Continued)
23. Segment and Geographic Data (Continued)
Segment assets and a reconciliation of segment assets to total assets were as follows:
Segment Assets
Fiscal Year End
2013 2012 2011
(in millions)
Transportation Solutions . . . . . . . . . . . . . . . . . . . . . . . . . . . . . . . . . . . . $ 2,977 $ 2,877 $ 2,732Network Solutions . . . . . . . . . . . . . . . . . . . . . . . . . . . . . . . . . . . . . . . . 1,684 1,857 1,955Industrial Solutions . . . . . . . . . . . . . . . . . . . . . . . . . . . . . . . . . . . . . . . 1,603 1,549 1,499Consumer Solutions . . . . . . . . . . . . . . . . . . . . . . . . . . . . . . . . . . . . . . . 987 1,081 1,173
Total segment assets(1) . . . . . . . . . . . . . . . . . . . . . . . . . . . . . . . . . . . . . 7,251 7,364 7,359Other current assets . . . . . . . . . . . . . . . . . . . . . . . . . . . . . . . . . . . . . . . 2,224 2,352 2,762Other non-current assets . . . . . . . . . . . . . . . . . . . . . . . . . . . . . . . . . . . . 8,986 9,590 7,602
Total assets . . . . . . . . . . . . . . . . . . . . . . . . . . . . . . . . . . . . . . . . . . . . . $18,461 $19,306 $17,723
(1) Segment assets are comprised of accounts receivable, inventories, and property, plant, and equipment.
Net sales and net property, plant, and equipment by geographic region were as follows:
Property, Plant,Net Sales(1) and Equipment, Net
Fiscal Fiscal Year End
2013 2012 2011 2013 2012 2011
(in millions)
Americas:U.S. . . . . . . . . . . . . . . . . . . . . . . . . . . $ 3,811 $ 3,664 $ 3,657 $ 958 $ 1,042 $ 968Other Americas . . . . . . . . . . . . . . . . . . 566 624 652 80 84 65
Total Americas . . . . . . . . . . . . . . . . . . . 4,377 4,288 4,309 1,038 1,126 1,033
Europe/Middle East/Africa:Switzerland . . . . . . . . . . . . . . . . . . . . . 3,689 3,719 3,870 54 52 59Germany . . . . . . . . . . . . . . . . . . . . . . . 123 120 426 356 339 381Other Europe/Middle East/Africa . . . . . 750 663 662 702 692 677
Total Europe/Middle East/Africa . . . . . . 4,562 4,502 4,958 1,112 1,083 1,117
Asia–Pacific:China . . . . . . . . . . . . . . . . . . . . . . . . . 2,197 2,159 2,172 516 432 395Other Asia–Pacific . . . . . . . . . . . . . . . . 2,144 2,333 2,339 500 572 595
Total Asia–Pacific . . . . . . . . . . . . . . . . . 4,341 4,492 4,511 1,016 1,004 990
Total . . . . . . . . . . . . . . . . . . . . . . . . . . . . $13,280 $13,282 $13,778 $ 3,166 $ 3,213 $ 3,140
(1) Net sales to external customers is attributed to individual countries based on the legal entity that records the sale.
117

TE CONNECTIVITY LTD.
NOTES TO CONSOLIDATED FINANCIAL STATEMENTS (Continued)
24. Quarterly Financial Data (unaudited)
Summarized quarterly financial data was as follows:
Fiscal
2013 2012
First Second Third Fourth First Second Third FourthQuarter(1) Quarter Quarter Quarter(2) Quarter Quarter Quarter(3) Quarter(4)
(in millions, except per share data)
Net sales . . . . . . . . . . . . . . . . . . . . $3,134 $3,265 $3,449 $3,432 $3,170 $3,249 $3,499 $3,364Gross margin . . . . . . . . . . . . . . . . 989 1,052 1,132 1,156 943 1,021 1,018 1,064Acquisition and integration costs . . 5 3 3 3 4 4 15 4Restructuring and other charges,
net . . . . . . . . . . . . . . . . . . . . . . 92 81 67 71 18 32 36 42Amounts attributable to TE
Connectivity Ltd.:Income from continuing
operations . . . . . . . . . . . . . . . 279 278 332 387 238 267 260 398Income (loss) from discontinued
operations, net of income taxes (2) (1) 3 — 22 (10) (61) (2)Net income . . . . . . . . . . . . . . . . 277 277 335 387 260 257 199 396
Basic earnings per shareattributable to TEConnectivity Ltd.:Income from continuing
operations . . . . . . . . . . . . . . . $ 0.66 $ 0.66 $ 0.80 $ 0.94 $ 0.56 $ 0.63 $ 0.61 $ 0.93Income (loss) from discontinued
operations, net of income taxes — — 0.01 — 0.05 (0.03) (0.15) —Net income . . . . . . . . . . . . . . . . 0.66 0.66 0.81 0.94 0.61 0.60 0.46 0.93
Diluted earnings per shareattributable to TEConnectivity Ltd.:Income from continuing
operations . . . . . . . . . . . . . . . $ 0.65 $ 0.66 $ 0.79 $ 0.92 $ 0.55 $ 0.62 $ 0.60 $ 0.93Income (loss) from discontinued
operations, net of income taxes — — 0.01 — 0.06 (0.02) (0.14) (0.01)Net income . . . . . . . . . . . . . . . . 0.65 0.65 0.80 0.92 0.61 0.60 0.46 0.92
Weighted-average number of sharesoutstanding:Basic . . . . . . . . . . . . . . . . . . . . . 422 420 415 413 425 427 428 426Diluted . . . . . . . . . . . . . . . . . . . 426 424 421 420 429 431 431 429
(1) Results for the first quarter of fiscal 2013 include $331 million of income tax benefits associated with the effectivesettlement of an audit of prior year tax returns as well as the related impact of $231 million to other expense pursuant tothe tax sharing agreement with Tyco International and Covidien. Results for the first quarter of fiscal 2013 also include$30 million of income tax expense related to adjustments to prior year income tax returns and the estimated impacts ofcertain intercompany dividends.
118

TE CONNECTIVITY LTD.
NOTES TO CONSOLIDATED FINANCIAL STATEMENTS (Continued)
24. Quarterly Financial Data (unaudited) (Continued)
(2) Results for the fourth quarter of fiscal 2013 include $63 million of income tax benefits recognized in connection with areduction in the valuation allowance associated with certain ADC tax loss carryforwards.
(3) Results for the third quarter of fiscal 2012 include $68 million of charges associated with the amortization of acquisition-related fair value adjustments primarily related to acquired inventories and customer order backlog associated withDeutsch.
(4) Results for the fourth quarter of fiscal 2012 include $107 million of income tax benefits recognized in connection with areduction in the valuation allowance associated with tax loss carryforwards in certain non-U.S. locations.
25. Subsequent Events
On October 18, 2013, TEGSA called for redemption all of its outstanding 5.95% senior notes due2014, representing $300 million aggregate principal amount. The redemption date will be November 18,2013. We expect to pay an immaterial premium in connection with this early redemption.
On October 29, 2013, our board of directors authorized an increase of $1 billion in the sharerepurchase program.
26. Tyco Electronics Group S.A.
Tyco Electronics Group S.A. (‘‘TEGSA’’), a Luxembourg company and our 100%-owned subsidiary,is a holding company that owns, directly or indirectly, all of our operating subsidiaries. TEGSA is theobligor under our senior notes, commercial paper, and Credit Facility, which are fully andunconditionally guaranteed by its parent, TE Connectivity Ltd. The following tables present condensedconsolidating financial information for TE Connectivity Ltd., TEGSA, and all other subsidiaries thatare not providing a guarantee of debt but which represent assets of TEGSA, using the equity methodof accounting.
119
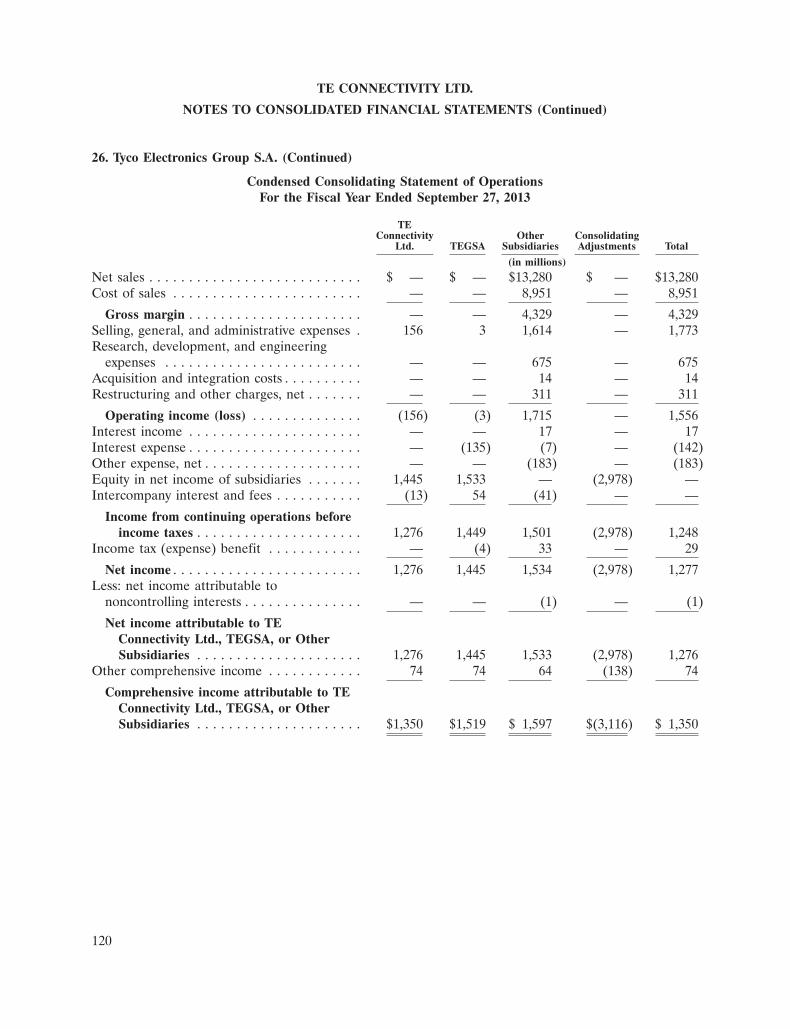
TE CONNECTIVITY LTD.
NOTES TO CONSOLIDATED FINANCIAL STATEMENTS (Continued)
26. Tyco Electronics Group S.A. (Continued)
Condensed Consolidating Statement of OperationsFor the Fiscal Year Ended September 27, 2013
TEConnectivity Other Consolidating
Ltd. TEGSA Subsidiaries Adjustments Total
(in millions)
Net sales . . . . . . . . . . . . . . . . . . . . . . . . . . . $ — $ — $13,280 $ — $13,280Cost of sales . . . . . . . . . . . . . . . . . . . . . . . . — — 8,951 — 8,951
Gross margin . . . . . . . . . . . . . . . . . . . . . . — — 4,329 — 4,329Selling, general, and administrative expenses . 156 3 1,614 — 1,773Research, development, and engineering
expenses . . . . . . . . . . . . . . . . . . . . . . . . . — — 675 — 675Acquisition and integration costs . . . . . . . . . . — — 14 — 14Restructuring and other charges, net . . . . . . . — — 311 — 311
Operating income (loss) . . . . . . . . . . . . . . (156) (3) 1,715 — 1,556Interest income . . . . . . . . . . . . . . . . . . . . . . — — 17 — 17Interest expense . . . . . . . . . . . . . . . . . . . . . . — (135) (7) — (142)Other expense, net . . . . . . . . . . . . . . . . . . . . — — (183) — (183)Equity in net income of subsidiaries . . . . . . . 1,445 1,533 — (2,978) —Intercompany interest and fees . . . . . . . . . . . (13) 54 (41) — —
Income from continuing operations beforeincome taxes . . . . . . . . . . . . . . . . . . . . . 1,276 1,449 1,501 (2,978) 1,248
Income tax (expense) benefit . . . . . . . . . . . . — (4) 33 — 29
Net income . . . . . . . . . . . . . . . . . . . . . . . . 1,276 1,445 1,534 (2,978) 1,277Less: net income attributable to
noncontrolling interests . . . . . . . . . . . . . . . — — (1) — (1)
Net income attributable to TEConnectivity Ltd., TEGSA, or OtherSubsidiaries . . . . . . . . . . . . . . . . . . . . . 1,276 1,445 1,533 (2,978) 1,276
Other comprehensive income . . . . . . . . . . . . 74 74 64 (138) 74
Comprehensive income attributable to TEConnectivity Ltd., TEGSA, or OtherSubsidiaries . . . . . . . . . . . . . . . . . . . . . $1,350 $1,519 $ 1,597 $(3,116) $ 1,350
120

TE CONNECTIVITY LTD.
NOTES TO CONSOLIDATED FINANCIAL STATEMENTS (Continued)
26. Tyco Electronics Group S.A. (Continued)
Condensed Consolidating Statement of OperationsFor the Fiscal Year Ended September 28, 2012
TEConnectivity Other Consolidating
Ltd. TEGSA Subsidiaries Adjustments Total
(in millions)
Net sales . . . . . . . . . . . . . . . . . . . . . . . . . . . $ — $ — $13,282 $ — $13,282Cost of sales . . . . . . . . . . . . . . . . . . . . . . . . — — 9,236 — 9,236
Gross margin . . . . . . . . . . . . . . . . . . . . . . — — 4,046 — 4,046Selling, general, and administrative expenses,
net(1) . . . . . . . . . . . . . . . . . . . . . . . . . . . . 102 (122) 1,705 — 1,685Research, development, and engineering
expenses . . . . . . . . . . . . . . . . . . . . . . . . . — — 688 — 688Acquisition and integration costs . . . . . . . . . . 1 2 24 — 27Restructuring and other charges, net . . . . . . . — — 128 — 128
Operating income (loss) . . . . . . . . . . . . . . (103) 120 1,501 — 1,518Interest income . . . . . . . . . . . . . . . . . . . . . . — — 23 — 23Interest expense . . . . . . . . . . . . . . . . . . . . . . — (168) (8) — (176)Other income, net . . . . . . . . . . . . . . . . . . . . — — 50 — 50Equity in net income of subsidiaries . . . . . . . 1,277 1,256 — (2,533) —Equity in net loss of subsidiaries of
discontinued operations . . . . . . . . . . . . . . (51) (51) — 102 —Intercompany interest and fees . . . . . . . . . . . (11) 69 (58) — —
Income from continuing operations beforeincome taxes . . . . . . . . . . . . . . . . . . . . . 1,112 1,226 1,508 (2,431) 1,415
Income tax expense . . . . . . . . . . . . . . . . . . . — — (249) — (249)
Income from continuing operations . . . . . . 1,112 1,226 1,259 (2,431) 1,166Loss from discontinued operations, net of
income taxes . . . . . . . . . . . . . . . . . . . . . . — — (51) — (51)
Net income . . . . . . . . . . . . . . . . . . . . . . . . 1,112 1,226 1,208 (2,431) 1,115Less: net income attributable to
noncontrolling interests . . . . . . . . . . . . . . . — — (3) — (3)
Net income attributable to TEConnectivity Ltd., TEGSA, or OtherSubsidiaries . . . . . . . . . . . . . . . . . . . . . 1,112 1,226 1,205 (2,431) 1,112
Other comprehensive loss . . . . . . . . . . . . . . . (199) (199) (203) 402 (199)
Comprehensive income attributable to TEConnectivity Ltd., TEGSA, or OtherSubsidiaries . . . . . . . . . . . . . . . . . . . . . $ 913 $1,027 $ 1,002 $(2,029) $ 913
(1) TEGSA selling, general, and administrative expenses include gains of $125 million related to intercompany transactions.These gains are offset by corresponding losses recorded by Other Subsidiaries.
121

TE CONNECTIVITY LTD.
NOTES TO CONSOLIDATED FINANCIAL STATEMENTS (Continued)
26. Tyco Electronics Group S.A. (Continued)
Condensed Consolidating Statement of OperationsFor the Fiscal Year Ended September 30, 2011
TEConnectivity Other Consolidating
Ltd. TEGSA Subsidiaries Adjustments Total
(in millions)
Net sales . . . . . . . . . . . . . . . . . . . . . . . . . . . $ — $ — $13,778 $ — $13,778Cost of sales . . . . . . . . . . . . . . . . . . . . . . . . — — 9,507 — 9,507
Gross margin . . . . . . . . . . . . . . . . . . . . . . — — 4,271 — 4,271Selling, general, and administrative expenses . 177 91 1,460 — 1,728Research, development, and engineering
expenses . . . . . . . . . . . . . . . . . . . . . . . . . — — 701 — 701Acquisition and integration costs . . . . . . . . . . 3 — 16 — 19Restructuring and other charges, net . . . . . . . — — 136 — 136
Operating income (loss) . . . . . . . . . . . . . . (180) (91) 1,958 — 1,687Interest income . . . . . . . . . . . . . . . . . . . . . . — — 22 — 22Interest expense . . . . . . . . . . . . . . . . . . . . . . — (150) (11) — (161)Other income, net . . . . . . . . . . . . . . . . . . . . — — 27 — 27Equity in net income of subsidiaries . . . . . . . 1,422 1,572 — (2,994) —Equity in net income of subsidiaries of
discontinued operations . . . . . . . . . . . . . . 22 22 — (44) —Intercompany interest and fees . . . . . . . . . . . (19) 91 (72) — —
Income from continuing operations beforeincome taxes . . . . . . . . . . . . . . . . . . . . . 1,245 1,444 1,924 (3,038) 1,575
Income tax expense . . . . . . . . . . . . . . . . . . . — — (347) — (347)
Income from continuing operations . . . . . . 1,245 1,444 1,577 (3,038) 1,228Income from discontinued operations, net of
income taxes . . . . . . . . . . . . . . . . . . . . . . — — 22 — 22
Net income . . . . . . . . . . . . . . . . . . . . . . . . 1,245 1,444 1,599 (3,038) 1,250Less: net income attributable to
noncontrolling interests . . . . . . . . . . . . . . . — — (5) — (5)
Net income attributable to TEConnectivity Ltd., TEGSA, or OtherSubsidiaries . . . . . . . . . . . . . . . . . . . . . 1,245 1,444 1,594 (3,038) 1,245
Other comprehensive income . . . . . . . . . . . . 182 182 187 (369) 182
Comprehensive income attributable to TEConnectivity Ltd., TEGSA, or OtherSubsidiaries . . . . . . . . . . . . . . . . . . . . . $1,427 $1,626 $ 1,781 $(3,407) $ 1,427
122
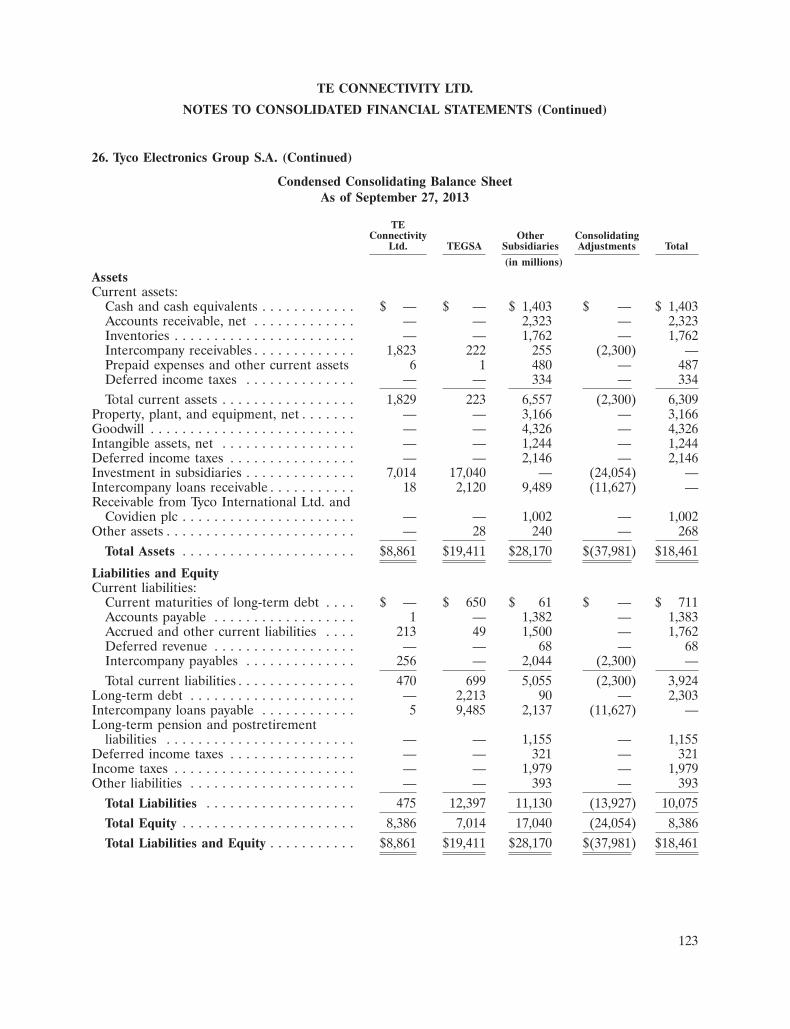
TE CONNECTIVITY LTD.
NOTES TO CONSOLIDATED FINANCIAL STATEMENTS (Continued)
26. Tyco Electronics Group S.A. (Continued)
Condensed Consolidating Balance SheetAs of September 27, 2013
TEConnectivity Other Consolidating
Ltd. TEGSA Subsidiaries Adjustments Total
(in millions)
AssetsCurrent assets:
Cash and cash equivalents . . . . . . . . . . . . $ — $ — $ 1,403 $ — $ 1,403Accounts receivable, net . . . . . . . . . . . . . — — 2,323 — 2,323Inventories . . . . . . . . . . . . . . . . . . . . . . . — — 1,762 — 1,762Intercompany receivables . . . . . . . . . . . . . 1,823 222 255 (2,300) —Prepaid expenses and other current assets 6 1 480 — 487Deferred income taxes . . . . . . . . . . . . . . — — 334 — 334Total current assets . . . . . . . . . . . . . . . . . 1,829 223 6,557 (2,300) 6,309
Property, plant, and equipment, net . . . . . . . — — 3,166 — 3,166Goodwill . . . . . . . . . . . . . . . . . . . . . . . . . . — — 4,326 — 4,326Intangible assets, net . . . . . . . . . . . . . . . . . — — 1,244 — 1,244Deferred income taxes . . . . . . . . . . . . . . . . — — 2,146 — 2,146Investment in subsidiaries . . . . . . . . . . . . . . 7,014 17,040 — (24,054) —Intercompany loans receivable . . . . . . . . . . . 18 2,120 9,489 (11,627) —Receivable from Tyco International Ltd. and
Covidien plc . . . . . . . . . . . . . . . . . . . . . . — — 1,002 — 1,002Other assets . . . . . . . . . . . . . . . . . . . . . . . . — 28 240 — 268
Total Assets . . . . . . . . . . . . . . . . . . . . . . $8,861 $19,411 $28,170 $(37,981) $18,461
Liabilities and EquityCurrent liabilities:
Current maturities of long-term debt . . . . $ — $ 650 $ 61 $ — $ 711Accounts payable . . . . . . . . . . . . . . . . . . 1 — 1,382 — 1,383Accrued and other current liabilities . . . . 213 49 1,500 — 1,762Deferred revenue . . . . . . . . . . . . . . . . . . — — 68 — 68Intercompany payables . . . . . . . . . . . . . . 256 — 2,044 (2,300) —Total current liabilities . . . . . . . . . . . . . . . 470 699 5,055 (2,300) 3,924
Long-term debt . . . . . . . . . . . . . . . . . . . . . — 2,213 90 — 2,303Intercompany loans payable . . . . . . . . . . . . 5 9,485 2,137 (11,627) —Long-term pension and postretirement
liabilities . . . . . . . . . . . . . . . . . . . . . . . . — — 1,155 — 1,155Deferred income taxes . . . . . . . . . . . . . . . . — — 321 — 321Income taxes . . . . . . . . . . . . . . . . . . . . . . . — — 1,979 — 1,979Other liabilities . . . . . . . . . . . . . . . . . . . . . — — 393 — 393
Total Liabilities . . . . . . . . . . . . . . . . . . . 475 12,397 11,130 (13,927) 10,075Total Equity . . . . . . . . . . . . . . . . . . . . . . 8,386 7,014 17,040 (24,054) 8,386Total Liabilities and Equity . . . . . . . . . . . $8,861 $19,411 $28,170 $(37,981) $18,461
123

TE CONNECTIVITY LTD.
NOTES TO CONSOLIDATED FINANCIAL STATEMENTS (Continued)
26. Tyco Electronics Group S.A. (Continued)
Condensed Consolidating Balance SheetAs of September 28, 2012
TEConnectivity Other Consolidating
Ltd. TEGSA Subsidiaries Adjustments Total
(in millions)AssetsCurrent assets:
Cash and cash equivalents . . . . . . . . . . . . . . . $ — $ — $ 1,589 $ — $ 1,589Accounts receivable, net . . . . . . . . . . . . . . . . 1 — 2,342 — 2,343Inventories . . . . . . . . . . . . . . . . . . . . . . . . . — — 1,808 — 1,808Intercompany receivables . . . . . . . . . . . . . . . . 16 — 29 (45) —Prepaid expenses and other current assets . . . . 2 1 471 — 474Deferred income taxes . . . . . . . . . . . . . . . . . — — 289 — 289
Total current assets . . . . . . . . . . . . . . . . . . . . 19 1 6,528 (45) 6,503Property, plant, and equipment, net . . . . . . . . . . — — 3,213 — 3,213Goodwill . . . . . . . . . . . . . . . . . . . . . . . . . . . . — — 4,308 — 4,308Intangible assets, net . . . . . . . . . . . . . . . . . . . . — — 1,352 — 1,352Deferred income taxes . . . . . . . . . . . . . . . . . . . — — 2,460 — 2,460Investment in subsidiaries . . . . . . . . . . . . . . . . . 8,192 17,341 — (25,533) —Intercompany loans receivable . . . . . . . . . . . . . . 11 2,779 8,361 (11,151) —Receivable from Tyco International Ltd. and
Covidien plc . . . . . . . . . . . . . . . . . . . . . . . . — — 1,180 — 1,180Other assets . . . . . . . . . . . . . . . . . . . . . . . . . . — 40 250 — 290
Total Assets . . . . . . . . . . . . . . . . . . . . . . . . . $8,222 $20,161 $27,652 $(36,729) $19,306
Liabilities and EquityCurrent liabilities:
Current maturities of long-term debt . . . . . . . . $ — $ 1,014 $ 1 $ — $ 1,015Accounts payable . . . . . . . . . . . . . . . . . . . . . 2 — 1,290 — 1,292Accrued and other current liabilities . . . . . . . . 210 70 1,296 — 1,576Deferred revenue . . . . . . . . . . . . . . . . . . . . . — — 121 — 121Intercompany payables . . . . . . . . . . . . . . . . . 29 — 16 (45) —
Total current liabilities . . . . . . . . . . . . . . . . . 241 1,084 2,724 (45) 4,004Long-term debt . . . . . . . . . . . . . . . . . . . . . . . . — 2,529 167 — 2,696Intercompany loans payable . . . . . . . . . . . . . . . 4 8,356 2,791 (11,151) —Long-term pension and postretirement liabilities . — — 1,353 — 1,353Deferred income taxes . . . . . . . . . . . . . . . . . . . — — 448 — 448Income taxes . . . . . . . . . . . . . . . . . . . . . . . . . . — — 2,311 — 2,311Other liabilities . . . . . . . . . . . . . . . . . . . . . . . . — — 517 — 517
Total Liabilities . . . . . . . . . . . . . . . . . . . . . . 245 11,969 10,311 (11,196) 11,329
Total Equity . . . . . . . . . . . . . . . . . . . . . . . . . 7,977 8,192 17,341 (25,533) 7,977
Total Liabilities and Equity . . . . . . . . . . . . . . $8,222 $20,161 $27,652 $(36,729) $19,306
124
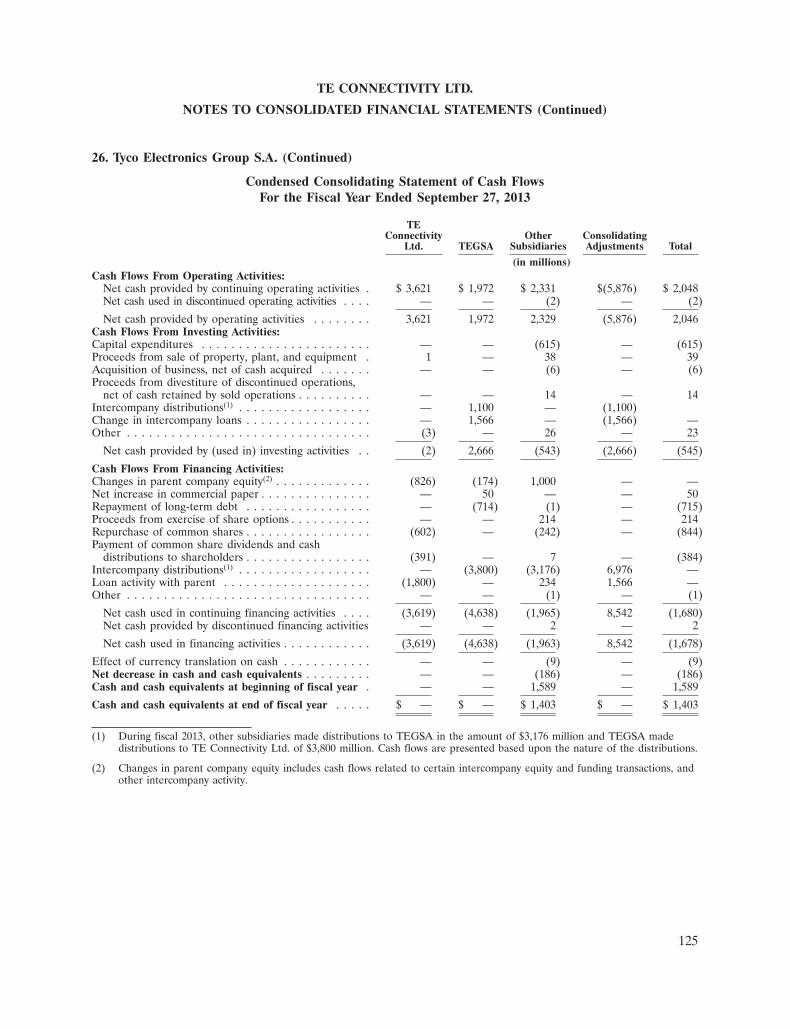
TE CONNECTIVITY LTD.
NOTES TO CONSOLIDATED FINANCIAL STATEMENTS (Continued)
26. Tyco Electronics Group S.A. (Continued)
Condensed Consolidating Statement of Cash FlowsFor the Fiscal Year Ended September 27, 2013
TEConnectivity Other Consolidating
Ltd. TEGSA Subsidiaries Adjustments Total
(in millions)Cash Flows From Operating Activities:
Net cash provided by continuing operating activities . $ 3,621 $ 1,972 $ 2,331 $(5,876) $ 2,048Net cash used in discontinued operating activities . . . . — — (2) — (2)
Net cash provided by operating activities . . . . . . . . 3,621 1,972 2,329 (5,876) 2,046Cash Flows From Investing Activities:Capital expenditures . . . . . . . . . . . . . . . . . . . . . . . — — (615) — (615)Proceeds from sale of property, plant, and equipment . 1 — 38 — 39Acquisition of business, net of cash acquired . . . . . . . — — (6) — (6)Proceeds from divestiture of discontinued operations,
net of cash retained by sold operations . . . . . . . . . . — — 14 — 14Intercompany distributions(1) . . . . . . . . . . . . . . . . . . — 1,100 — (1,100)Change in intercompany loans . . . . . . . . . . . . . . . . . — 1,566 — (1,566) —Other . . . . . . . . . . . . . . . . . . . . . . . . . . . . . . . . . (3) — 26 — 23
Net cash provided by (used in) investing activities . . (2) 2,666 (543) (2,666) (545)
Cash Flows From Financing Activities:Changes in parent company equity(2) . . . . . . . . . . . . . (826) (174) 1,000 — —Net increase in commercial paper . . . . . . . . . . . . . . . — 50 — — 50Repayment of long-term debt . . . . . . . . . . . . . . . . . — (714) (1) — (715)Proceeds from exercise of share options . . . . . . . . . . . — — 214 — 214Repurchase of common shares . . . . . . . . . . . . . . . . . (602) — (242) — (844)Payment of common share dividends and cash
distributions to shareholders . . . . . . . . . . . . . . . . . (391) — 7 — (384)Intercompany distributions(1) . . . . . . . . . . . . . . . . . . — (3,800) (3,176) 6,976 —Loan activity with parent . . . . . . . . . . . . . . . . . . . . (1,800) — 234 1,566 —Other . . . . . . . . . . . . . . . . . . . . . . . . . . . . . . . . . — — (1) — (1)
Net cash used in continuing financing activities . . . . (3,619) (4,638) (1,965) 8,542 (1,680)Net cash provided by discontinued financing activities — — 2 — 2
Net cash used in financing activities . . . . . . . . . . . . (3,619) (4,638) (1,963) 8,542 (1,678)
Effect of currency translation on cash . . . . . . . . . . . . — — (9) — (9)Net decrease in cash and cash equivalents . . . . . . . . . — — (186) — (186)Cash and cash equivalents at beginning of fiscal year . — — 1,589 — 1,589
Cash and cash equivalents at end of fiscal year . . . . . $ — $ — $ 1,403 $ — $ 1,403
(1) During fiscal 2013, other subsidiaries made distributions to TEGSA in the amount of $3,176 million and TEGSA madedistributions to TE Connectivity Ltd. of $3,800 million. Cash flows are presented based upon the nature of the distributions.
(2) Changes in parent company equity includes cash flows related to certain intercompany equity and funding transactions, andother intercompany activity.
125
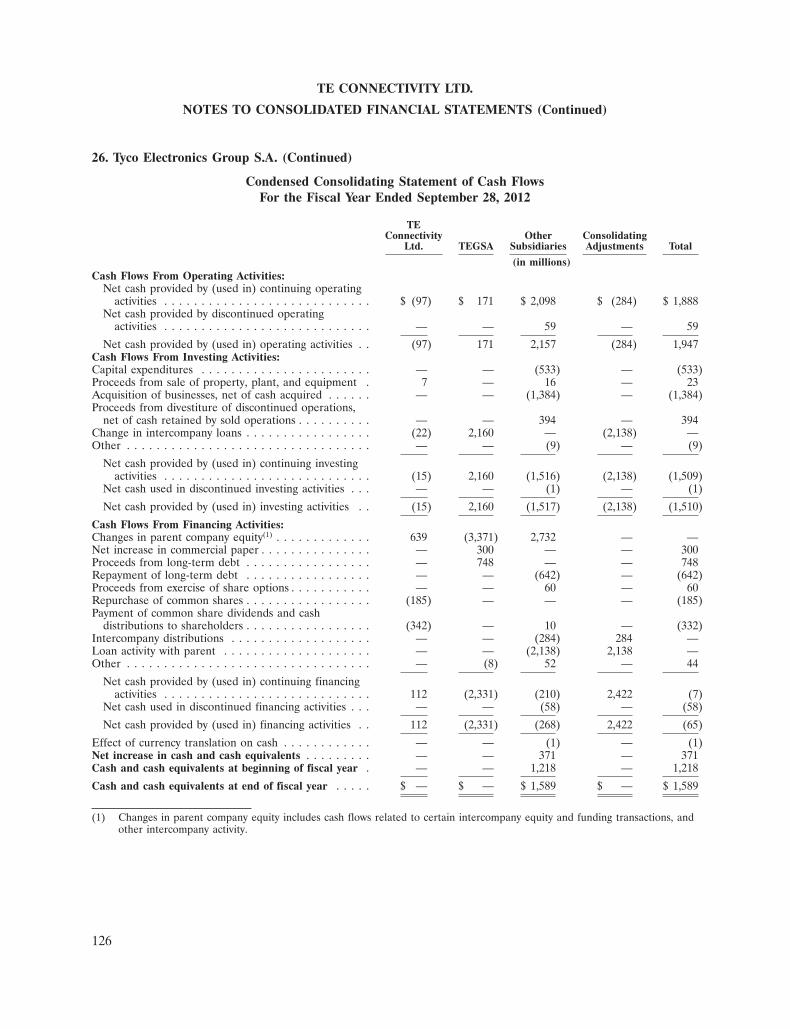
TE CONNECTIVITY LTD.
NOTES TO CONSOLIDATED FINANCIAL STATEMENTS (Continued)
26. Tyco Electronics Group S.A. (Continued)
Condensed Consolidating Statement of Cash FlowsFor the Fiscal Year Ended September 28, 2012
TEConnectivity Other Consolidating
Ltd. TEGSA Subsidiaries Adjustments Total
(in millions)Cash Flows From Operating Activities:
Net cash provided by (used in) continuing operatingactivities . . . . . . . . . . . . . . . . . . . . . . . . . . . . $ (97) $ 171 $ 2,098 $ (284) $ 1,888
Net cash provided by discontinued operatingactivities . . . . . . . . . . . . . . . . . . . . . . . . . . . . — — 59 — 59
Net cash provided by (used in) operating activities . . (97) 171 2,157 (284) 1,947Cash Flows From Investing Activities:Capital expenditures . . . . . . . . . . . . . . . . . . . . . . . — — (533) — (533)Proceeds from sale of property, plant, and equipment . 7 — 16 — 23Acquisition of businesses, net of cash acquired . . . . . . — — (1,384) — (1,384)Proceeds from divestiture of discontinued operations,
net of cash retained by sold operations . . . . . . . . . . — — 394 — 394Change in intercompany loans . . . . . . . . . . . . . . . . . (22) 2,160 — (2,138) —Other . . . . . . . . . . . . . . . . . . . . . . . . . . . . . . . . . — — (9) — (9)
Net cash provided by (used in) continuing investingactivities . . . . . . . . . . . . . . . . . . . . . . . . . . . . (15) 2,160 (1,516) (2,138) (1,509)
Net cash used in discontinued investing activities . . . — — (1) — (1)
Net cash provided by (used in) investing activities . . (15) 2,160 (1,517) (2,138) (1,510)
Cash Flows From Financing Activities:Changes in parent company equity(1) . . . . . . . . . . . . . 639 (3,371) 2,732 — —Net increase in commercial paper . . . . . . . . . . . . . . . — 300 — — 300Proceeds from long-term debt . . . . . . . . . . . . . . . . . — 748 — — 748Repayment of long-term debt . . . . . . . . . . . . . . . . . — — (642) — (642)Proceeds from exercise of share options . . . . . . . . . . . — — 60 — 60Repurchase of common shares . . . . . . . . . . . . . . . . . (185) — — — (185)Payment of common share dividends and cash
distributions to shareholders . . . . . . . . . . . . . . . . . (342) — 10 — (332)Intercompany distributions . . . . . . . . . . . . . . . . . . . — — (284) 284 —Loan activity with parent . . . . . . . . . . . . . . . . . . . . — — (2,138) 2,138 —Other . . . . . . . . . . . . . . . . . . . . . . . . . . . . . . . . . — (8) 52 — 44
Net cash provided by (used in) continuing financingactivities . . . . . . . . . . . . . . . . . . . . . . . . . . . . 112 (2,331) (210) 2,422 (7)
Net cash used in discontinued financing activities . . . — — (58) — (58)
Net cash provided by (used in) financing activities . . 112 (2,331) (268) 2,422 (65)
Effect of currency translation on cash . . . . . . . . . . . . — — (1) — (1)Net increase in cash and cash equivalents . . . . . . . . . — — 371 — 371Cash and cash equivalents at beginning of fiscal year . — — 1,218 — 1,218
Cash and cash equivalents at end of fiscal year . . . . . $ — $ — $ 1,589 $ — $ 1,589
(1) Changes in parent company equity includes cash flows related to certain intercompany equity and funding transactions, andother intercompany activity.
126
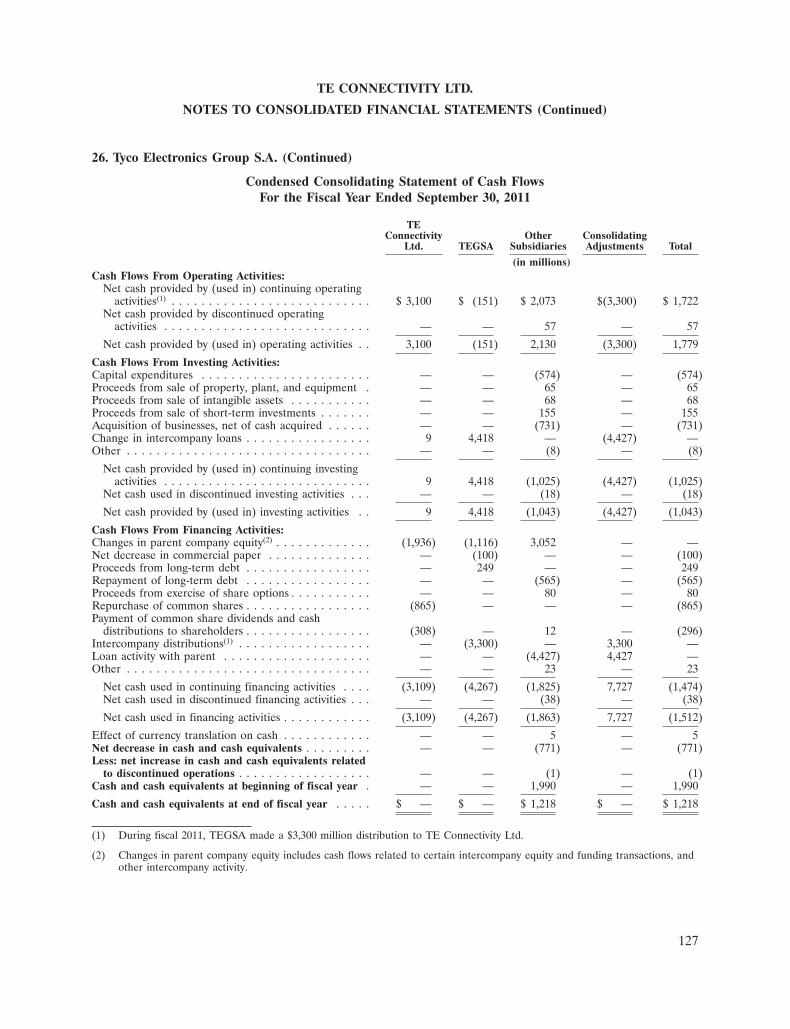
TE CONNECTIVITY LTD.
NOTES TO CONSOLIDATED FINANCIAL STATEMENTS (Continued)
26. Tyco Electronics Group S.A. (Continued)
Condensed Consolidating Statement of Cash FlowsFor the Fiscal Year Ended September 30, 2011
TEConnectivity Other Consolidating
Ltd. TEGSA Subsidiaries Adjustments Total
(in millions)Cash Flows From Operating Activities:
Net cash provided by (used in) continuing operatingactivities(1) . . . . . . . . . . . . . . . . . . . . . . . . . . . $ 3,100 $ (151) $ 2,073 $(3,300) $ 1,722
Net cash provided by discontinued operatingactivities . . . . . . . . . . . . . . . . . . . . . . . . . . . . — — 57 — 57
Net cash provided by (used in) operating activities . . 3,100 (151) 2,130 (3,300) 1,779
Cash Flows From Investing Activities:Capital expenditures . . . . . . . . . . . . . . . . . . . . . . . — — (574) — (574)Proceeds from sale of property, plant, and equipment . — — 65 — 65Proceeds from sale of intangible assets . . . . . . . . . . . — — 68 — 68Proceeds from sale of short-term investments . . . . . . . — — 155 — 155Acquisition of businesses, net of cash acquired . . . . . . — — (731) — (731)Change in intercompany loans . . . . . . . . . . . . . . . . . 9 4,418 — (4,427) —Other . . . . . . . . . . . . . . . . . . . . . . . . . . . . . . . . . — — (8) — (8)
Net cash provided by (used in) continuing investingactivities . . . . . . . . . . . . . . . . . . . . . . . . . . . . 9 4,418 (1,025) (4,427) (1,025)
Net cash used in discontinued investing activities . . . — — (18) — (18)
Net cash provided by (used in) investing activities . . 9 4,418 (1,043) (4,427) (1,043)
Cash Flows From Financing Activities:Changes in parent company equity(2) . . . . . . . . . . . . . (1,936) (1,116) 3,052 — —Net decrease in commercial paper . . . . . . . . . . . . . . — (100) — — (100)Proceeds from long-term debt . . . . . . . . . . . . . . . . . — 249 — — 249Repayment of long-term debt . . . . . . . . . . . . . . . . . — — (565) — (565)Proceeds from exercise of share options . . . . . . . . . . . — — 80 — 80Repurchase of common shares . . . . . . . . . . . . . . . . . (865) — — — (865)Payment of common share dividends and cash
distributions to shareholders . . . . . . . . . . . . . . . . . (308) — 12 — (296)Intercompany distributions(1) . . . . . . . . . . . . . . . . . . — (3,300) — 3,300 —Loan activity with parent . . . . . . . . . . . . . . . . . . . . — — (4,427) 4,427 —Other . . . . . . . . . . . . . . . . . . . . . . . . . . . . . . . . . — — 23 — 23
Net cash used in continuing financing activities . . . . (3,109) (4,267) (1,825) 7,727 (1,474)Net cash used in discontinued financing activities . . . — — (38) — (38)
Net cash used in financing activities . . . . . . . . . . . . (3,109) (4,267) (1,863) 7,727 (1,512)
Effect of currency translation on cash . . . . . . . . . . . . — — 5 — 5Net decrease in cash and cash equivalents . . . . . . . . . — — (771) — (771)Less: net increase in cash and cash equivalents related
to discontinued operations . . . . . . . . . . . . . . . . . . — — (1) — (1)Cash and cash equivalents at beginning of fiscal year . — — 1,990 — 1,990
Cash and cash equivalents at end of fiscal year . . . . . $ — $ — $ 1,218 $ — $ 1,218
(1) During fiscal 2011, TEGSA made a $3,300 million distribution to TE Connectivity Ltd.
(2) Changes in parent company equity includes cash flows related to certain intercompany equity and funding transactions, andother intercompany activity.
127
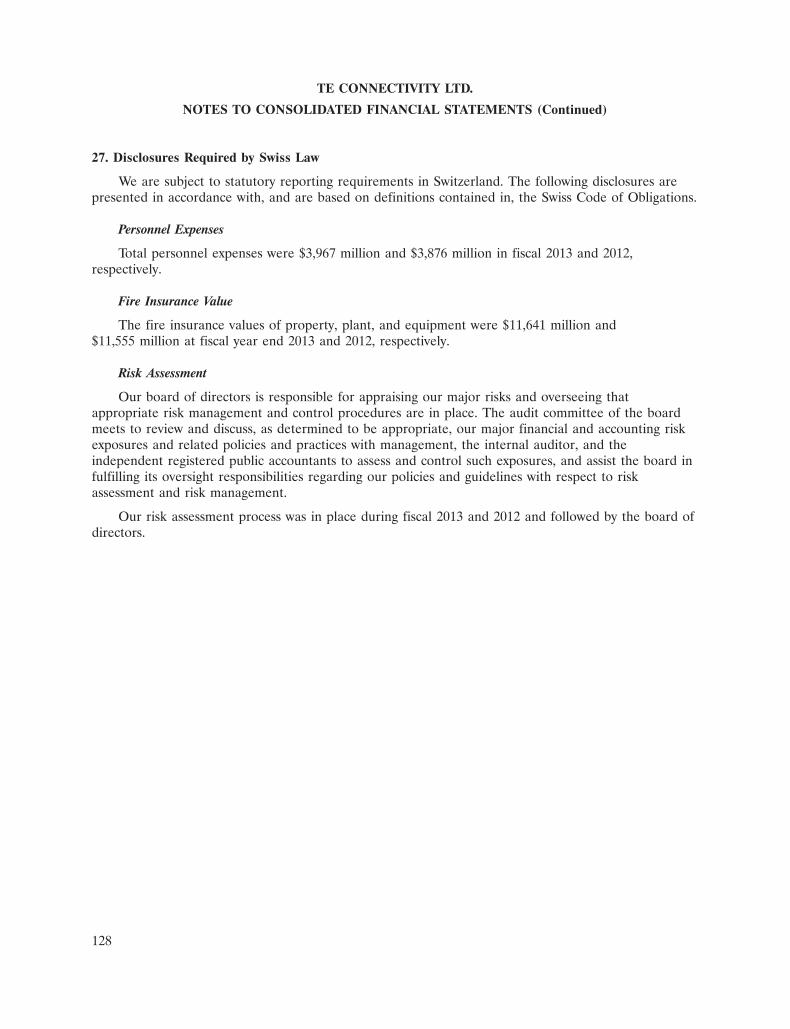
TE CONNECTIVITY LTD.
NOTES TO CONSOLIDATED FINANCIAL STATEMENTS (Continued)
27. Disclosures Required by Swiss Law
We are subject to statutory reporting requirements in Switzerland. The following disclosures arepresented in accordance with, and are based on definitions contained in, the Swiss Code of Obligations.
Personnel Expenses
Total personnel expenses were $3,967 million and $3,876 million in fiscal 2013 and 2012,respectively.
Fire Insurance Value
The fire insurance values of property, plant, and equipment were $11,641 million and$11,555 million at fiscal year end 2013 and 2012, respectively.
Risk Assessment
Our board of directors is responsible for appraising our major risks and overseeing thatappropriate risk management and control procedures are in place. The audit committee of the boardmeets to review and discuss, as determined to be appropriate, our major financial and accounting riskexposures and related policies and practices with management, the internal auditor, and theindependent registered public accountants to assess and control such exposures, and assist the board infulfilling its oversight responsibilities regarding our policies and guidelines with respect to riskassessment and risk management.
Our risk assessment process was in place during fiscal 2013 and 2012 and followed by the board ofdirectors.
128

TE CONNECTIVITY LTD.
SCHEDULE II—VALUATION AND QUALIFYING ACCOUNTS
Fiscal Years Ended September 27, 2013, September 28, 2012, and September 30, 2011
AdditionsCharged to Acquisitions,
Balance at Costs and Divestitures, Balance atDescription Beginning of Year Expenses and Other Deductions End of Year
(in millions)
Fiscal 2013Allowance for doubtful accounts
receivable . . . . . . . . . . . . . . . . . $ 41 $ 11 $ — $ (4) $ 48Valuation allowance on deferred tax
assets . . . . . . . . . . . . . . . . . . . . 1,719 323 — (226) 1,816Fiscal 2012
Allowance for doubtful accountsreceivable . . . . . . . . . . . . . . . . . $ 38 $ 7 $ 2 $ (6) $ 41
Valuation allowance on deferred taxassets . . . . . . . . . . . . . . . . . . . . 1,921 54 31 (287) 1,719
Fiscal 2011Allowance for doubtful accounts
receivable . . . . . . . . . . . . . . . . . $ 43 $ (2) $ 1 $ (4) $ 38Valuation allowance on deferred tax
assets . . . . . . . . . . . . . . . . . . . . 2,231 50 260 (620) 1,921
129
REPORT OF THE STATUTORY AUDITOR ON THE CONSOLIDATEDFINANCIAL STATEMENTS OF TE CONNECTIVITY LTD.
To the General meeting ofTE CONNECTIVITY LTD., SCHAFFHAUSEN
Report of the Statutory Auditor on the consolidated financial statements
As Statutory Auditor, we have audited the accompanying consolidated financial statements of TEConnectivity Ltd. (the ‘‘Company’’), which comprise the consolidated statement of operations,statement of comprehensive income, balance sheet, statement of shareholders’ equity, statement of cashflows and notes (pages 53 – 128) for the year ended September 27, 2013.
Board of Directors’ Responsibility
The Board of Directors is responsible for the preparation and fair presentation of the consolidatedfinancial statements in accordance with accounting principles generally accepted in the United States ofAmerica and the requirements of Swiss law. This responsibility includes designing, implementing andmaintaining an internal control system relevant to the preparation and fair presentation of consolidatedfinancial statements that are free from material misstatement, whether due to fraud or error. TheBoard of Directors is further responsible for selecting and applying appropriate accounting policies andmaking accounting estimates that are reasonable in the circumstances.
Auditor’s Responsibility
Our responsibility is to express an opinion on these consolidated financial statements based on ouraudit. We conducted our audit in accordance with Swiss law, Swiss Auditing Standards and auditingstandards generally accepted in the United States of America. Those standards require that we planand perform the audit to obtain reasonable assurance whether the consolidated financial statements arefree from material misstatement.
An audit involves performing procedures to obtain audit evidence about the amounts anddisclosures in the consolidated financial statements. The procedures selected depend on the auditor’sjudgment, including the assessment of the risks of material misstatement of the consolidated financialstatements, whether due to fraud or error. In making those risk assessments, the auditor considers theinternal control system relevant to the entity’s preparation and fair presentation of the consolidatedfinancial statements in order to design audit procedures that are appropriate in the circumstances, butnot for the purpose of expressing an opinion on the effectiveness of the entity’s internal control system.An audit also includes evaluating the appropriateness of the accounting policies used and thereasonableness of accounting estimates made, as well as evaluating the overall presentation of theconsolidated financial statements. We believe that the audit evidence we have obtained is sufficient andappropriate to provide a basis for our audit opinion.
Opinion
In our opinion, the consolidated financial statements for the year ended September 27, 2013present fairly, in all material respects, the financial position of the Company and the result of itsoperations and its cash flows in accordance with accounting principles generally accepted in the UnitedStates of America, and comply with Swiss law.
130

Report on Other Legal Requirements
We confirm that we meet the legal requirements on licensing according to the Auditor OversightAct (‘‘AOA’’) and independence (Article 728 CO and Article 11, AOA) and that there are nocircumstances incompatible with our independence.
In accordance with Article 728a, paragraph 1, item 3, CO, and Swiss Auditing Standard 890, weconfirm that an internal control system exists, which has been designed for the preparation of theconsolidated financial statements according to the instructions of the Board of Directors.
We recommend that the consolidated financial statements submitted to you be approved.
Deloitte AG
/s/ Martin Welser /s/ Matthias GschwendLicensed Audit Expert Licensed Audit ExpertAuditor in charge
Zurich, November 15, 2013
131

(This page intentionally left blank.)
132
TE CONNECTIVITY LTD.
INDEX TO SWISS STATUTORY FINANCIAL STATEMENTS
Page
Statements of Operations for the fiscal years ended September 27, 2013 and September 28, 2012 134
Balance Sheets as of September 27, 2013 and September 28, 2012 . . . . . . . . . . . . . . . . . . . . . . . 135
Notes to Swiss Statutory Financial Statements . . . . . . . . . . . . . . . . . . . . . . . . . . . . . . . . . . . . . . 136
Proposed Appropriation of Available Earnings . . . . . . . . . . . . . . . . . . . . . . . . . . . . . . . . . . . . . 151
Report of Statutory Auditor . . . . . . . . . . . . . . . . . . . . . . . . . . . . . . . . . . . . . . . . . . . . . . . . . . . 152
133
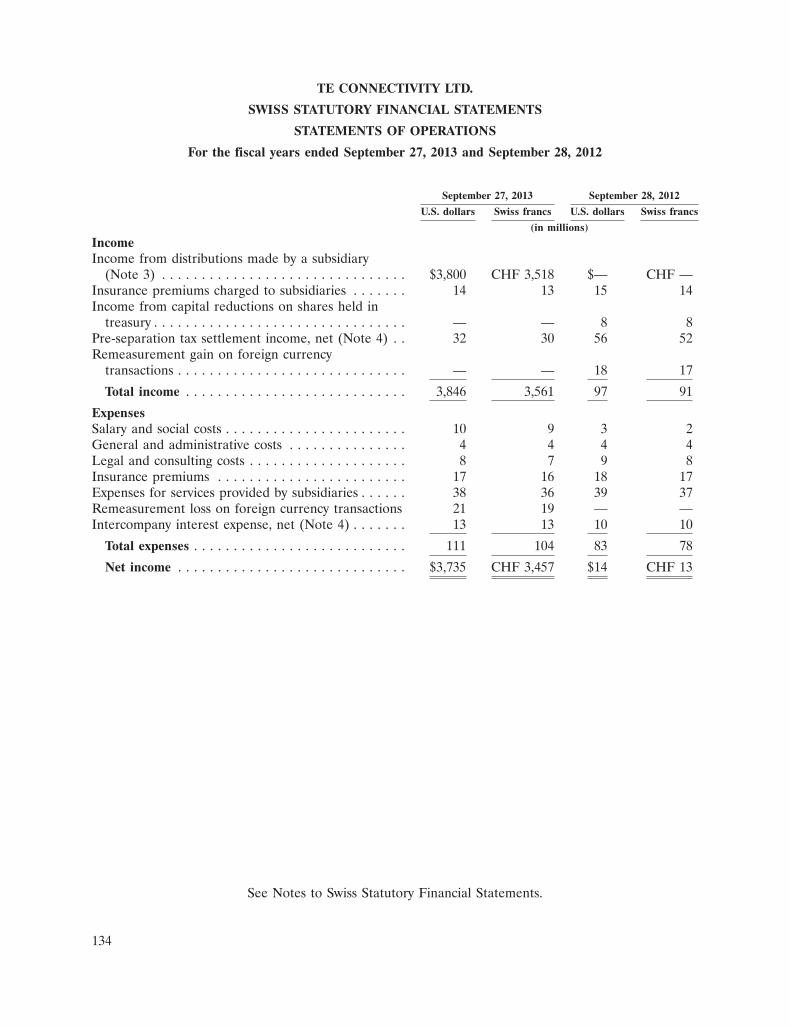
TE CONNECTIVITY LTD.
SWISS STATUTORY FINANCIAL STATEMENTS
STATEMENTS OF OPERATIONS
For the fiscal years ended September 27, 2013 and September 28, 2012
September 27, 2013 September 28, 2012
U.S. dollars Swiss francs U.S. dollars Swiss francs
(in millions)
IncomeIncome from distributions made by a subsidiary
(Note 3) . . . . . . . . . . . . . . . . . . . . . . . . . . . . . . . $3,800 CHF 3,518 $— CHF —Insurance premiums charged to subsidiaries . . . . . . . 14 13 15 14Income from capital reductions on shares held in
treasury . . . . . . . . . . . . . . . . . . . . . . . . . . . . . . . . — — 8 8Pre-separation tax settlement income, net (Note 4) . . 32 30 56 52Remeasurement gain on foreign currency
transactions . . . . . . . . . . . . . . . . . . . . . . . . . . . . . — — 18 17
Total income . . . . . . . . . . . . . . . . . . . . . . . . . . . . 3,846 3,561 97 91
ExpensesSalary and social costs . . . . . . . . . . . . . . . . . . . . . . . 10 9 3 2General and administrative costs . . . . . . . . . . . . . . . 4 4 4 4Legal and consulting costs . . . . . . . . . . . . . . . . . . . . 8 7 9 8Insurance premiums . . . . . . . . . . . . . . . . . . . . . . . . 17 16 18 17Expenses for services provided by subsidiaries . . . . . . 38 36 39 37Remeasurement loss on foreign currency transactions 21 19 — —Intercompany interest expense, net (Note 4) . . . . . . . 13 13 10 10
Total expenses . . . . . . . . . . . . . . . . . . . . . . . . . . . 111 104 83 78
Net income . . . . . . . . . . . . . . . . . . . . . . . . . . . . . $3,735 CHF 3,457 $14 CHF 13
See Notes to Swiss Statutory Financial Statements.
134
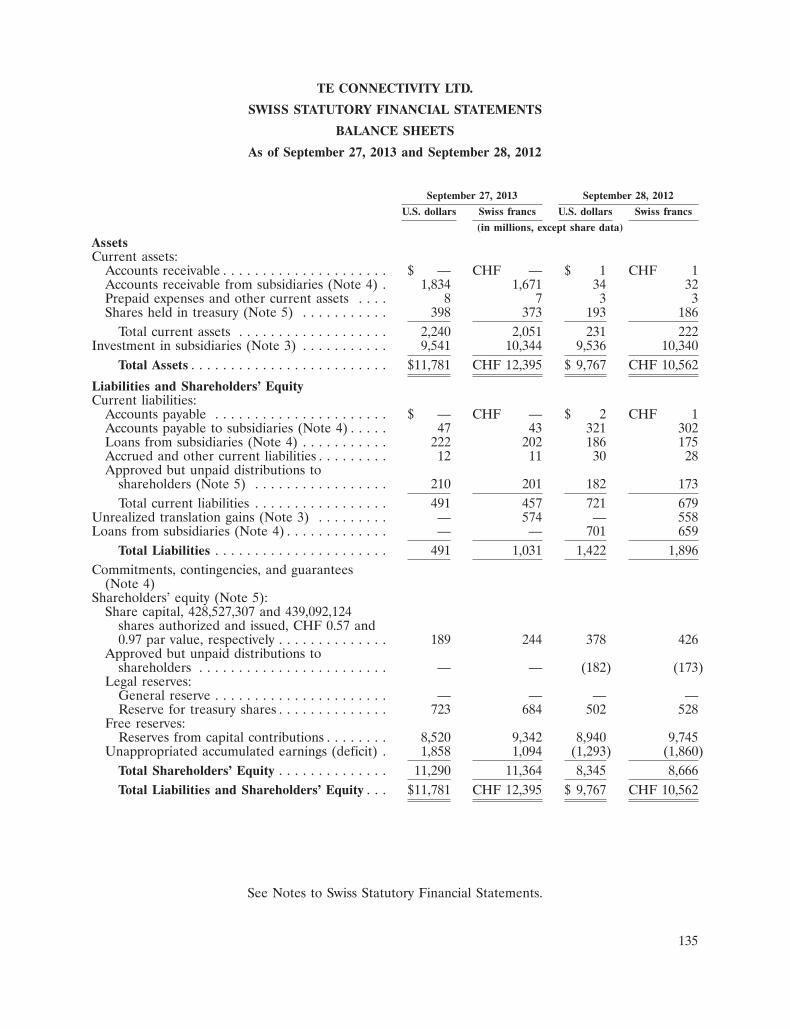
TE CONNECTIVITY LTD.
SWISS STATUTORY FINANCIAL STATEMENTS
BALANCE SHEETS
As of September 27, 2013 and September 28, 2012
September 27, 2013 September 28, 2012
U.S. dollars Swiss francs U.S. dollars Swiss francs
(in millions, except share data)
AssetsCurrent assets:
Accounts receivable . . . . . . . . . . . . . . . . . . . . . $ — CHF — $ 1 CHF 1Accounts receivable from subsidiaries (Note 4) . 1,834 1,671 34 32Prepaid expenses and other current assets . . . . 8 7 3 3Shares held in treasury (Note 5) . . . . . . . . . . . 398 373 193 186
Total current assets . . . . . . . . . . . . . . . . . . . 2,240 2,051 231 222Investment in subsidiaries (Note 3) . . . . . . . . . . . 9,541 10,344 9,536 10,340
Total Assets . . . . . . . . . . . . . . . . . . . . . . . . . $11,781 CHF 12,395 $ 9,767 CHF 10,562
Liabilities and Shareholders’ EquityCurrent liabilities:
Accounts payable . . . . . . . . . . . . . . . . . . . . . . $ — CHF — $ 2 CHF 1Accounts payable to subsidiaries (Note 4) . . . . . 47 43 321 302Loans from subsidiaries (Note 4) . . . . . . . . . . . 222 202 186 175Accrued and other current liabilities . . . . . . . . . 12 11 30 28Approved but unpaid distributions to
shareholders (Note 5) . . . . . . . . . . . . . . . . . 210 201 182 173Total current liabilities . . . . . . . . . . . . . . . . . 491 457 721 679
Unrealized translation gains (Note 3) . . . . . . . . . — 574 — 558Loans from subsidiaries (Note 4) . . . . . . . . . . . . . — — 701 659
Total Liabilities . . . . . . . . . . . . . . . . . . . . . . 491 1,031 1,422 1,896Commitments, contingencies, and guarantees
(Note 4)Shareholders’ equity (Note 5):
Share capital, 428,527,307 and 439,092,124shares authorized and issued, CHF 0.57 and0.97 par value, respectively . . . . . . . . . . . . . . 189 244 378 426
Approved but unpaid distributions toshareholders . . . . . . . . . . . . . . . . . . . . . . . . — — (182) (173)
Legal reserves:General reserve . . . . . . . . . . . . . . . . . . . . . . — — — —Reserve for treasury shares . . . . . . . . . . . . . . 723 684 502 528
Free reserves:Reserves from capital contributions . . . . . . . . 8,520 9,342 8,940 9,745
Unappropriated accumulated earnings (deficit) . 1,858 1,094 (1,293) (1,860)Total Shareholders’ Equity . . . . . . . . . . . . . . 11,290 11,364 8,345 8,666Total Liabilities and Shareholders’ Equity . . . $11,781 CHF 12,395 $ 9,767 CHF 10,562
See Notes to Swiss Statutory Financial Statements.
135
TE CONNECTIVITY LTD.
NOTES TO SWISS STATUTORY FINANCIAL STATEMENTS
1. Basis of Presentation
TE Connectivity Ltd. (‘‘TE Connectivity’’ or the ‘‘Company,’’ which may be referred to as ‘‘we,’’‘‘us,’’ or ‘‘our’’) is the ultimate holding company of TE Connectivity Ltd. and its subsidiaries (the ‘‘TEGroup’’) with a listing on the New York Stock Exchange.
The accompanying statements of operations reflect the results of operations for the fiscal yearsended September 27, 2013 and September 28, 2012, and have been prepared in accordance with therequirements of Swiss law for companies, the Swiss Code of Obligations. The financial statementspresent the results of the holding company on a stand-alone basis and do not represent theconsolidated operations of the TE Group.
On January 1, 2013, changes in Swiss company law became effective and the requirements of thelaw must be adopted by January 1, 2015. As of September 27, 2013, we have not adopted theprovisions of this law and are continuing to assess the impact of the changes to our financialstatements, including the impact on treasury shares held by our subsidiary.
Notes 6 through 9 are consistent with, and prepared on the substantially same basis as, similarinformation publicly available via regulatory filings with the U.S. Securities and Exchange Commission(the ‘‘SEC’’) and, consequently, are presented in U.S. dollars only.
Fiscal Year
Unless otherwise indicated, references in the financial statements to fiscal 2013 and fiscal 2012 areto our fiscal years ended September 27, 2013 and September 28, 2012. Our fiscal year is a‘‘52-53 week’’ year ending on the last Friday of September. Fiscal 2013 and 2012 were 52 week years.
2. Risk Assessment
Our board of directors is responsible for appraising the TE Group’s major risks and overseeingthat appropriate risk management and control procedures are in place. The audit committee of theboard meets to review and discuss, as determined to be appropriate, the TE Group’s major financialand accounting risk exposures and related policies and practices with management, the internal auditor,and the independent registered public accountants to assess and control such exposures, and assist theboard in fulfilling its oversight responsibilities regarding the TE Group’s policies and guidelines withrespect to risk assessment and risk management.
The TE Group’s risk assessment process was in place for the reporting periods presented andfollowed by the board of directors. TE Connectivity Ltd., as the ultimate holding company of the TEGroup, is fully integrated into the TE Group-wide risk assessment process.
3. Summary of Significant Accounting Policies
Shares Held in Treasury and Reserve for Treasury Shares
Shares held in treasury that are held directly by us for the purpose of retirement are presented athistorical cost. Treasury shares held for purposes other than retirement are presented at the lower ofcost or market (‘‘LCM’’). LCM adjustments on shares held in treasury are reflected in remeasurementloss in our statements of operations.
136
TE CONNECTIVITY LTD.
NOTES TO SWISS STATUTORY FINANCIAL STATEMENTS (Continued)
3. Summary of Significant Accounting Policies (Continued)
As of September 27, 2013 and September 28, 2012, all shares held in treasury that are held directlyby us are held for the purpose of retirement and are presented as current assets because we expect toretire the shares within the next year.
Our reserve for treasury shares represents all shares held in treasury, whether held by us or asubsidiary, and is recorded at historical cost. We established the reserve for treasury shares during fiscal2013 and 2012 by charging accumulated earnings (deficit).
Investment in Subsidiaries
Investments in subsidiaries are equity interests held on a long-term basis for the purpose of ourbusiness activities. Investments in subsidiaries, on an aggregate basis, are carried at a value no higherthan cost less adjustments for impairment. No impairments were recorded during fiscal 2013 or fiscal2012.
During fiscal 2013, a subsidiary distributed $3,800 million (equivalent to CHF 3,518 million) to us.The distributions are included in income from distributions made by a subsidiary in our statements ofoperations.
Currency Translation
Our functional currency is the U.S. dollar. We present our financial statements in both U.S. dollarsand Swiss francs (‘‘CHF’’). Assets and liabilities in U.S. dollars are converted to Swiss francs forpresentation purposes using historical foreign exchange rates (investment in subsidiaries, shares held intreasury, approved but unpaid distributions to shareholders payable, and equity accounts) and currentforeign exchange rates (all other assets and liabilities). Revenue and expenses, excluding income fromdistributions made by a subsidiary, are translated using the average exchange rates in effect for theperiod presented. Income from distributions made by a subsidiary is translated using the exchange ratein effect on the date that each distribution was made to us. Net unrealized foreign currency translationgains are deferred in the balance sheets, while unrealized translation losses and realized transactionalgains and losses are reflected in the statements of operations. We consider all foreign currencytransactional gains and losses associated with current assets and liabilities, excluding shares held intreasury, to be realized.
Salaries and Social Charges
Salaries and social charges include cash and equity compensation paid to our directors. Duringfiscal 2013, we determined that an accrual to reflect deferred stock units granted but not yet distributedto our directors was necessary and accrued CHF 6 million via a charge to salaries and social charges.Historically, we recorded such charges when a director left our board.
4. Commitments, Contingencies, and Guarantees
Affiliated Debt and Loans Receivable
During fiscal 2012, we entered into a credit line with a wholly-owned subsidiary (the ‘‘2012TEGSA Line’’) that bears interest at the 1-month London interbank offered rate (‘‘LIBOR’’) plus0.40% (0.58% and 0.61% at September 27, 2013 and September 28, 2012, respectively). The 2012TEGSA Line has a $500 million limit (CHF 455 million) on the principal drawable and matures in
137

TE CONNECTIVITY LTD.
NOTES TO SWISS STATUTORY FINANCIAL STATEMENTS (Continued)
4. Commitments, Contingencies, and Guarantees (Continued)
September 2017. At September 28, 2012, CHF 470 million, which included accumulated interestpayable on maturity, was outstanding under the 2012 TEGSA Line. During fiscal 2013, we used aportion of the proceeds from the distributions referred to in ‘‘Investment in Subsidiaries’’ above to paydown the 2012 TEGSA Line.
We have another credit line with a wholly-owned subsidiary (the ‘‘2011 TEGSA Line’’) that bearsinterest at 1-month LIBOR plus 0.40%. The 2011 TEGSA Line has a $200 million limit(CHF 182 million) on the principal drawable and matures in September 2016. At September 28, 2012,CHF 189 million, which included accumulated interest payable on maturity, was outstanding under the2011 TEGSA Line. During fiscal 2013, we used a portion of the proceeds from the distributionsreferred to in ‘‘Investment in Subsidiaries’’ above to pay down the 2011 TEGSA Line.
Both the 2012 TEGSA Line and the 2011 TEGSA Line remained open with no borrowingsoutstanding as of September 27, 2013.
We utilize a cash pooling relationship with a wholly-owned subsidiary (the ‘‘Cash Pool’’) to helpfund our operations. The Cash Pool does not have an expiration date and accrues interest based onLIBOR. At September 27, 2013, our Cash Pool positions were an asset of CHF 1,645 million includedin accounts receivable from subsidiaries and a liability of CHF 9 million included in accounts payableto subsidiaries. At September 28, 2012, our Cash Pool positions were an asset of CHF 15 millionincluded in accounts receivable from subsidiaries and a liability of CHF 272 million included inaccounts payable to subsidiaries. During fiscal 2013, we used a portion of the proceeds from thedistribution referred to in ‘‘Investment in Subsidiaries’’ above to pay down our cash pool liabilities andincrease the cash pool asset.
We maintain a revolving credit line with a wholly-owned subsidiary (the ‘‘Schaffhausen Line’’) thatbears interest at 1-month LIBOR plus 0.40%. The Schaffhausen Line does not have a limit on theamount drawable and matures in April 2017. At September 27, 2013 and September 28, 2012, therewere no borrowings under the Schaffhausen Line.
In order to minimize currency exposure related to distributions to shareholders approved in Swissfrancs and paid in U.S. dollars, we entered into an arrangement with a wholly-owned subsidiary inMarch 2013 in which we borrowed CHF 305 million from, and simultaneously loaned $322 million(equivalent to CHF 305 million) to, the subsidiary. As distributions to shareholders that were approvedin March 2013 are paid, both the borrowing and the loan are partially settled. As of September 27,2013, the borrowing totaled CHF 202 million; the loan receivable was included in the Cash Pool assetreferred to above. Similar transactions were entered into in fiscal 2012 related to the distributions toshareholders approved by shareholders in March 2012. As of September 28, 2012, the borrowingtotaled CHF 175 million; the loan receivable was netted against the Cash Pool liability referred toabove.
We have fully and unconditionally guaranteed the debt of a subsidiary, Tyco ElectronicsGroup S.A., totaling approximately CHF 2,608 million and CHF 3,328 million at September 27, 2013and September 28, 2012, respectively. As of September 27, 2013, we have not been required to performon our guarantee.
138
TE CONNECTIVITY LTD.
NOTES TO SWISS STATUTORY FINANCIAL STATEMENTS (Continued)
4. Commitments, Contingencies, and Guarantees (Continued)
Tax Sharing Agreement
We are a party to the Tax Sharing Agreement (‘‘TSA’’) with Tyco International Ltd. (‘‘TycoInternational’’) and Covidien plc (‘‘Covidien’’), under which we share responsibility for certain of our,Tyco International’s, and Covidien’s income tax liabilities based on a sharing formula for periods priorto and including June 29, 2007. We, Tyco International, and Covidien share 31%, 27%, and 42%,respectively, of U.S. income tax liabilities that arise from adjustments made by tax authorities to our,Tyco International’s, and Covidien’s U.S. income tax returns. The effect of the TSA is to indemnify usfor 69% of certain liabilities settled in cash by us with respect to unresolved pre-separation tax matters.Pursuant to that indemnification, we have made similar indemnifications to Tyco International andCovidien with respect to 31% of certain liabilities settled in cash by the companies relating tounresolved pre-separation tax matters. All costs and expenses associated with the management of theseshared tax liabilities are shared equally among the parties. We are responsible for all of our own taxesthat are not shared pursuant to the TSA’s sharing formula. In addition, Tyco International and Covidienare responsible for their tax liabilities that are not subject to the TSA’s sharing formula.
During fiscal 2013 and 2012, we recorded net income of CHF 30 million and CHF 52 million,respectively, related to the TSA and tax settlements involving Tyco International, Covidien, and us.These amounts are presented in pre-separation tax settlement income, net in our statements ofoperations.
Performance Guarantees
From time to time, we provide performance guarantees and surety bonds in favor of oursubsidiaries. At September 27, 2013 and September 28, 2012, these performance guarantees totaledCHF 469 million and CHF 535 million, respectively. In addition to these amounts, all of which arequantifiable, we have issued a parent company guarantee in favor of a U.S.-based aerospace customerthat does not have a limit. We do not anticipate having to perform under these guarantees.
We are the leader of a Swiss value-added tax (‘‘VAT’’) group (‘‘VAT Group’’). All companies inthe VAT Group maintain primary responsibility for their own VAT liabilities. However, in the event ofnon-compliance by any company in the VAT Group, all companies within the VAT Group assume jointand several responsibility for any VAT liabilities.
139
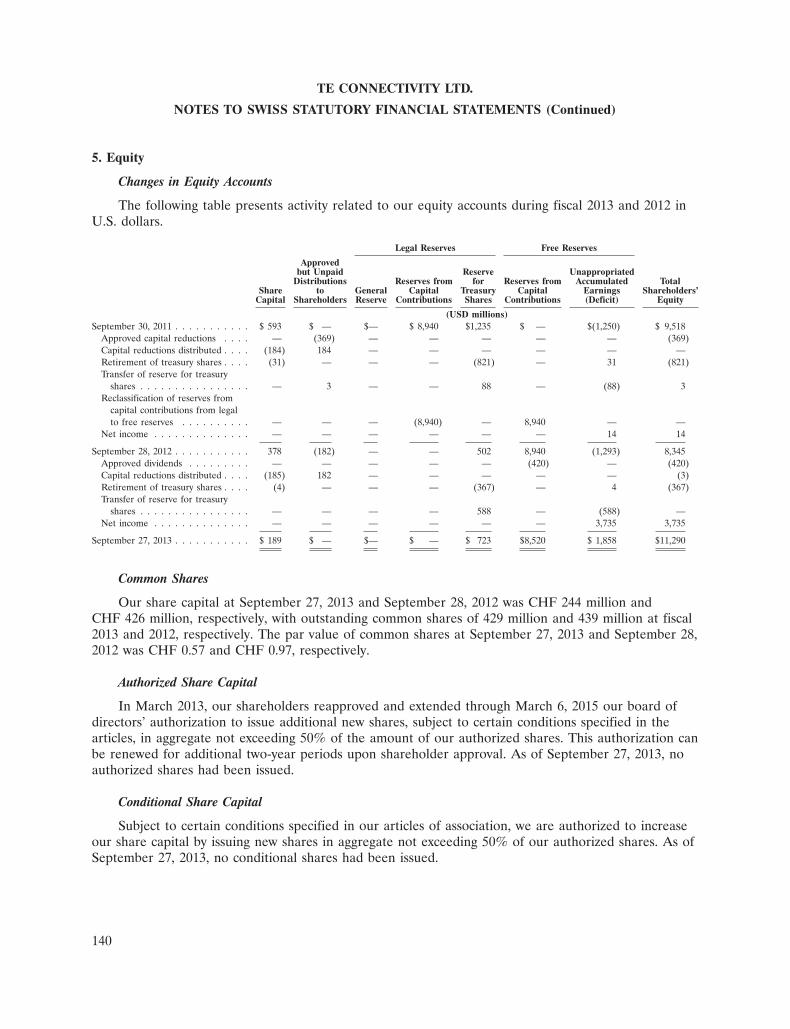
TE CONNECTIVITY LTD.
NOTES TO SWISS STATUTORY FINANCIAL STATEMENTS (Continued)
5. Equity
Changes in Equity Accounts
The following table presents activity related to our equity accounts during fiscal 2013 and 2012 inU.S. dollars.
Legal Reserves Free Reserves
Approvedbut Unpaid Reserve Unappropriated
Distributions Reserves from for Reserves from Accumulated TotalShare to General Capital Treasury Capital Earnings Shareholders’
Capital Shareholders Reserve Contributions Shares Contributions (Deficit) Equity
(USD millions)September 30, 2011 . . . . . . . . . . . $ 593 $ — $— $ 8,940 $1,235 $ — $(1,250) $ 9,518
Approved capital reductions . . . . — (369) — — — — — (369)Capital reductions distributed . . . . (184) 184 — — — — — —Retirement of treasury shares . . . . (31) — — — (821) — 31 (821)Transfer of reserve for treasury
shares . . . . . . . . . . . . . . . . — 3 — — 88 — (88) 3Reclassification of reserves from
capital contributions from legalto free reserves . . . . . . . . . . — — — (8,940) — 8,940 — —
Net income . . . . . . . . . . . . . . — — — — — — 14 14
September 28, 2012 . . . . . . . . . . . 378 (182) — — 502 8,940 (1,293) 8,345Approved dividends . . . . . . . . . — — — — — (420) — (420)Capital reductions distributed . . . . (185) 182 — — — — — (3)Retirement of treasury shares . . . . (4) — — — (367) — 4 (367)Transfer of reserve for treasury
shares . . . . . . . . . . . . . . . . — — — — 588 — (588) —Net income . . . . . . . . . . . . . . — — — — — — 3,735 3,735
September 27, 2013 . . . . . . . . . . . $ 189 $ — $— $ — $ 723 $8,520 $ 1,858 $11,290
Common Shares
Our share capital at September 27, 2013 and September 28, 2012 was CHF 244 million andCHF 426 million, respectively, with outstanding common shares of 429 million and 439 million at fiscal2013 and 2012, respectively. The par value of common shares at September 27, 2013 and September 28,2012 was CHF 0.57 and CHF 0.97, respectively.
Authorized Share Capital
In March 2013, our shareholders reapproved and extended through March 6, 2015 our board ofdirectors’ authorization to issue additional new shares, subject to certain conditions specified in thearticles, in aggregate not exceeding 50% of the amount of our authorized shares. This authorization canbe renewed for additional two-year periods upon shareholder approval. As of September 27, 2013, noauthorized shares had been issued.
Conditional Share Capital
Subject to certain conditions specified in our articles of association, we are authorized to increaseour share capital by issuing new shares in aggregate not exceeding 50% of our authorized shares. As ofSeptember 27, 2013, no conditional shares had been issued.
140

TE CONNECTIVITY LTD.
NOTES TO SWISS STATUTORY FINANCIAL STATEMENTS (Continued)
5. Equity (Continued)
Common Shares Held in Treasury
During the fiscal years ended September 27, 2013 and September 28, 2012, activity related tocommon shares held in treasury by us was as follows:
Number ofShares Total Cost
(in millions) (in millions CHF)
Common shares held as of September 30, 2011 . . . . . . 24 CHF 708Additions . . . . . . . . . . . . . . . . . . . . . . . . . . . . . . . . 6 186Shareholder-approved retirements . . . . . . . . . . . . . . (24) (708)
Common shares held as of September 28, 2012 . . . . . . 6 186Additions . . . . . . . . . . . . . . . . . . . . . . . . . . . . . . . . 13 539Shareholder-approved retirements . . . . . . . . . . . . . . (10) (352)
Common shares held as of September 27, 2013 . . . . . . 9 CHF 373
In March 2012, our shareholders approved the cancellation of 24 million shares purchased underour share repurchase program during the period from December 25, 2010 to December 30, 2011. Thecapital reduction by cancellation of shares was subject to a notice period and filing with the commercialregister and became effective in May 2012.
In March 2013, our shareholders approved the cancellation of 10 million shares purchased underour share repurchase program during the period from December 31, 2011 to December 28, 2012. Thecapital reduction by cancellation of shares was subject to a notice period and filing with the commercialregister and became effective in May 2013.
We acquire treasury shares with the intent to retire using a virtual secondary trading line(‘‘Secondary Line’’). Pursuant to this Secondary Line, we acquired 13 million shares at a historical costof CHF 539 million in fiscal 2013, and 6 million shares at a historical cost of CHF 186 million duringthe fourth quarter of fiscal 2012 (subsequent to the shareholder-approved reclassification of reservesfrom capital contributions from legal reserves to free reserves).
Treasury shares held by us and a subsidiary at September 27, 2013 totaled 9 million and 8 million,respectively, with a combined historical cost of CHF 684 million. Treasury shares held by us and asubsidiary at September 28, 2012 totaled 6 million and 10 million, respectively, with a combinedhistorical cost of CHF 528 million. Because we had freely distributable equity reserves when werepurchased treasury shares during fiscal 2013 and 2012, the reserve for treasury shares was created outof accumulated earnings (deficit).
We and our subsidiary repurchased approximately 20 million of our common shares for$829 million (equivalent to CHF 775 million) and approximately 6 million of our common shares for$194 million (equivalent to CHF 187 million) during fiscal 2013 and 2012, respectively. AtSeptember 27, 2013, we had $478 million of availability remaining under our share repurchaseauthorization. Purchases made both pursuant to the Secondary Line and by a subsidiary are subject tothis authorization. On October 29, 2013, our board of directors authorized an increase of $1 billion inthe share repurchase program.
141

TE CONNECTIVITY LTD.
NOTES TO SWISS STATUTORY FINANCIAL STATEMENTS (Continued)
5. Equity (Continued)
Reserves from Capital Contributions
Reserves from capital contributions, subject to certain conditions, are freely distributable reserves.As of September 27, 2013 and September 28, 2012, reserves from capital contributions were CHF 9,342(equivalent to $8,520 million) and CHF 9,745 million (equivalent to $8,940 million), respectively.
At September 30, 2011, due to on-going discussions with the Swiss Federal Tax Administration(‘‘FTA’’) regarding classification of reserves that were distributable free from Swiss withholding tax, weprovisionally reclassified CHF 9,745 million from contributed surplus (a free reserve) to reserves fromcapital contributions (a legal reserve). Our shareholders ratified that reclassification during the secondquarter of fiscal 2012. Also during the second quarter of fiscal 2012, we received a favorable outcomefrom the FTA related to our classification of reserves from capital contributions that confirms ourpresentation of reserves from capital contributions as a free reserve on our balance sheets. In July2012, our shareholders approved a resolution to reclassify reserves from capital contributions as ofMarch 30, 2012 in the amount of CHF 9,745 million from legal reserves (reserves from capitalcontributions) to free reserves (reserves from capital contributions), with effect as of March 30, 2012.
During fiscal 2011, we received a ruling from the FTA that all quarterly distributions fromcontributed surplus approved by shareholders in March 2011 (see ‘‘Distributions to Shareholders’’below), including the two installments paid in December 2011 and March 2012, were not subject towithholding tax.
General Reserve
To comply with the Swiss Code of Obligations, 5% of annual net income must be appropriated toour general reserve until the general reserve equals 20% of share capital. Because of our accumulateddeficit position through September 28, 2012, we had not proposed any appropriations to the generalreserve. We intend to seek shareholder approval to appropriate approximately CHF 49 million ofretained earnings, an amount equal to 20% of our share capital, for the general reserve at the fiscal2014 annual meeting of shareholders. The general reserve is not a distributable reserve.
Distributions to Shareholders
Under current Swiss law, subject to certain conditions, distributions to shareholders made in theform of a reduction of registered share capital or from reserves from capital contributions are exemptfrom Swiss withholding tax. See ‘‘Reserves from Capital Contributions’’ for additional informationregarding our ability to make distributions free from withholding tax. Distributions or dividends on ourshares must be approved by our shareholders.
As of September 30, 2011, capital reductions previously approved by our shareholders and filedwith the commercial register had reduced the par value of our common shares from CHF 2.60(equivalent to $2.40), our par value at our change of domicile in June 2009, to CHF 1.37 (equivalent to$1.28).
During the quarters ended December 30, 2011 and March 30, 2012, we paid the third and fourthinstallments of the dividend distribution from contributed surplus originally approved in March 2011 ata rate of $0.18 per installment.
142
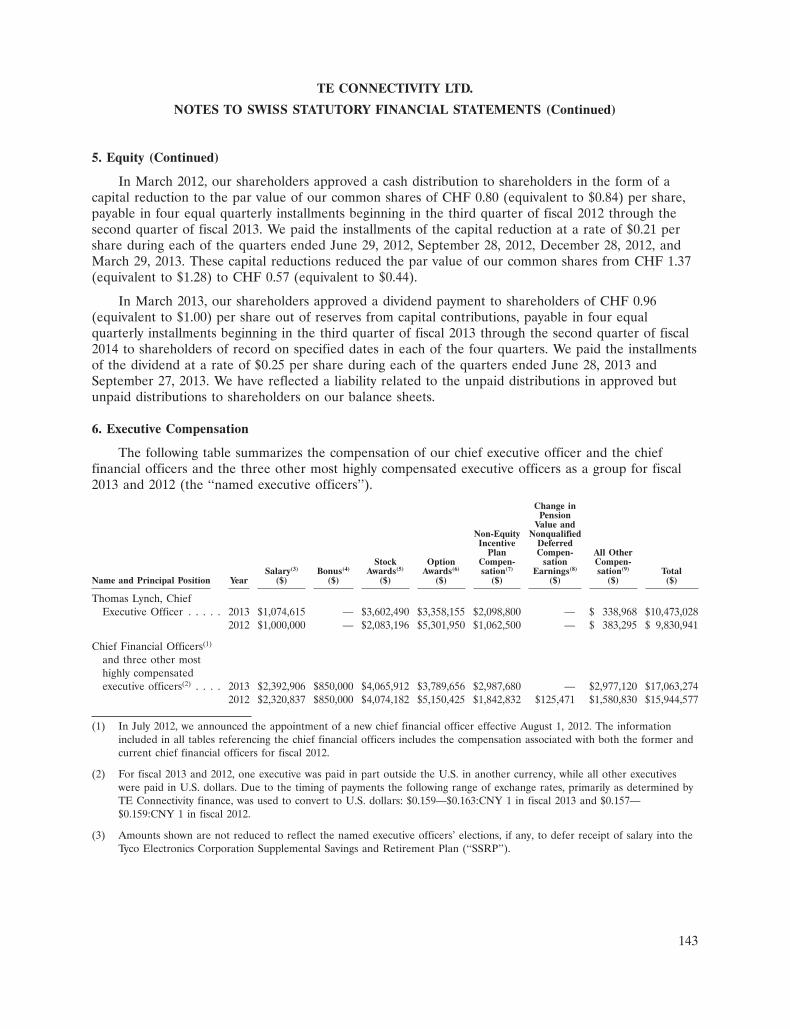
TE CONNECTIVITY LTD.
NOTES TO SWISS STATUTORY FINANCIAL STATEMENTS (Continued)
5. Equity (Continued)
In March 2012, our shareholders approved a cash distribution to shareholders in the form of acapital reduction to the par value of our common shares of CHF 0.80 (equivalent to $0.84) per share,payable in four equal quarterly installments beginning in the third quarter of fiscal 2012 through thesecond quarter of fiscal 2013. We paid the installments of the capital reduction at a rate of $0.21 pershare during each of the quarters ended June 29, 2012, September 28, 2012, December 28, 2012, andMarch 29, 2013. These capital reductions reduced the par value of our common shares from CHF 1.37(equivalent to $1.28) to CHF 0.57 (equivalent to $0.44).
In March 2013, our shareholders approved a dividend payment to shareholders of CHF 0.96(equivalent to $1.00) per share out of reserves from capital contributions, payable in four equalquarterly installments beginning in the third quarter of fiscal 2013 through the second quarter of fiscal2014 to shareholders of record on specified dates in each of the four quarters. We paid the installmentsof the dividend at a rate of $0.25 per share during each of the quarters ended June 28, 2013 andSeptember 27, 2013. We have reflected a liability related to the unpaid distributions in approved butunpaid distributions to shareholders on our balance sheets.
6. Executive Compensation
The following table summarizes the compensation of our chief executive officer and the chieffinancial officers and the three other most highly compensated executive officers as a group for fiscal2013 and 2012 (the ‘‘named executive officers’’).
Change inPension
Value andNon-Equity Nonqualified
Incentive DeferredPlan Compen- All Other
Stock Option Compen- sation Compen-Salary(3) Bonus(4) Awards(5) Awards(6) sation(7) Earnings(8) sation(9) Total
Name and Principal Position Year ($) ($) ($) ($) ($) ($) ($) ($)
Thomas Lynch, ChiefExecutive Officer . . . . . 2013 $1,074,615 — $3,602,490 $3,358,155 $2,098,800 — $ 338,968 $10,473,028
2012 $1,000,000 — $2,083,196 $5,301,950 $1,062,500 — $ 383,295 $ 9,830,941
Chief Financial Officers(1)
and three other mosthighly compensatedexecutive officers(2) . . . . 2013 $2,392,906 $850,000 $4,065,912 $3,789,656 $2,987,680 — $2,977,120 $17,063,274
2012 $2,320,837 $850,000 $4,074,182 $5,150,425 $1,842,832 $125,471 $1,580,830 $15,944,577
(1) In July 2012, we announced the appointment of a new chief financial officer effective August 1, 2012. The informationincluded in all tables referencing the chief financial officers includes the compensation associated with both the former andcurrent chief financial officers for fiscal 2012.
(2) For fiscal 2013 and 2012, one executive was paid in part outside the U.S. in another currency, while all other executiveswere paid in U.S. dollars. Due to the timing of payments the following range of exchange rates, primarily as determined byTE Connectivity finance, was used to convert to U.S. dollars: $0.159—$0.163:CNY 1 in fiscal 2013 and $0.157—$0.159:CNY 1 in fiscal 2012.
(3) Amounts shown are not reduced to reflect the named executive officers’ elections, if any, to defer receipt of salary into theTyco Electronics Corporation Supplemental Savings and Retirement Plan (‘‘SSRP’’).
143
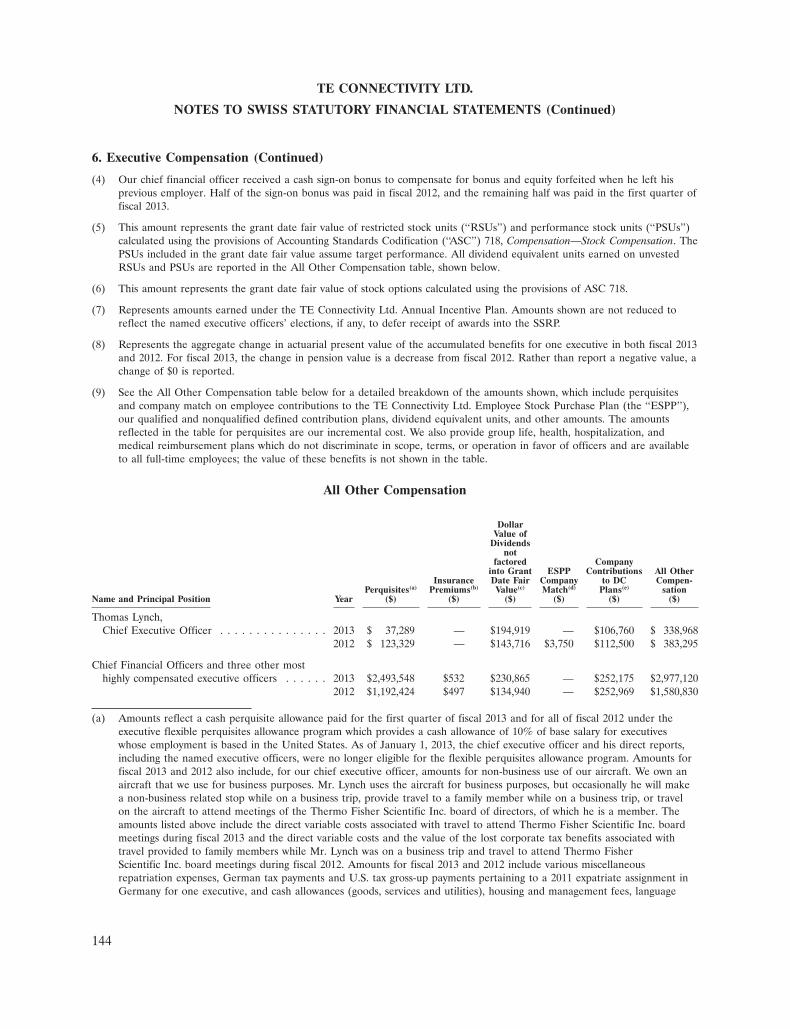
TE CONNECTIVITY LTD.
NOTES TO SWISS STATUTORY FINANCIAL STATEMENTS (Continued)
6. Executive Compensation (Continued)
(4) Our chief financial officer received a cash sign-on bonus to compensate for bonus and equity forfeited when he left hisprevious employer. Half of the sign-on bonus was paid in fiscal 2012, and the remaining half was paid in the first quarter offiscal 2013.
(5) This amount represents the grant date fair value of restricted stock units (‘‘RSUs’’) and performance stock units (‘‘PSUs’’)calculated using the provisions of Accounting Standards Codification (‘‘ASC’’) 718, Compensation—Stock Compensation. ThePSUs included in the grant date fair value assume target performance. All dividend equivalent units earned on unvestedRSUs and PSUs are reported in the All Other Compensation table, shown below.
(6) This amount represents the grant date fair value of stock options calculated using the provisions of ASC 718.
(7) Represents amounts earned under the TE Connectivity Ltd. Annual Incentive Plan. Amounts shown are not reduced toreflect the named executive officers’ elections, if any, to defer receipt of awards into the SSRP.
(8) Represents the aggregate change in actuarial present value of the accumulated benefits for one executive in both fiscal 2013and 2012. For fiscal 2013, the change in pension value is a decrease from fiscal 2012. Rather than report a negative value, achange of $0 is reported.
(9) See the All Other Compensation table below for a detailed breakdown of the amounts shown, which include perquisitesand company match on employee contributions to the TE Connectivity Ltd. Employee Stock Purchase Plan (the ‘‘ESPP’’),our qualified and nonqualified defined contribution plans, dividend equivalent units, and other amounts. The amountsreflected in the table for perquisites are our incremental cost. We also provide group life, health, hospitalization, andmedical reimbursement plans which do not discriminate in scope, terms, or operation in favor of officers and are availableto all full-time employees; the value of these benefits is not shown in the table.
All Other Compensation
DollarValue of
Dividendsnot
factored Companyinto Grant ESPP Contributions All Other
Insurance Date Fair Company to DC Compen-Perquisites(a) Premiums(b) Value(c) Match(d) Plans(e) sation
Name and Principal Position Year ($) ($) ($) ($) ($) ($)
Thomas Lynch,Chief Executive Officer . . . . . . . . . . . . . . . 2013 $ 37,289 — $194,919 — $106,760 $ 338,968
2012 $ 123,329 — $143,716 $3,750 $112,500 $ 383,295
Chief Financial Officers and three other mosthighly compensated executive officers . . . . . . 2013 $2,493,548 $532 $230,865 — $252,175 $2,977,120
2012 $1,192,424 $497 $134,940 — $252,969 $1,580,830
(a) Amounts reflect a cash perquisite allowance paid for the first quarter of fiscal 2013 and for all of fiscal 2012 under theexecutive flexible perquisites allowance program which provides a cash allowance of 10% of base salary for executiveswhose employment is based in the United States. As of January 1, 2013, the chief executive officer and his direct reports,including the named executive officers, were no longer eligible for the flexible perquisites allowance program. Amounts forfiscal 2013 and 2012 also include, for our chief executive officer, amounts for non-business use of our aircraft. We own anaircraft that we use for business purposes. Mr. Lynch uses the aircraft for business purposes, but occasionally he will makea non-business related stop while on a business trip, provide travel to a family member while on a business trip, or travelon the aircraft to attend meetings of the Thermo Fisher Scientific Inc. board of directors, of which he is a member. Theamounts listed above include the direct variable costs associated with travel to attend Thermo Fisher Scientific Inc. boardmeetings during fiscal 2013 and the direct variable costs and the value of the lost corporate tax benefits associated withtravel provided to family members while Mr. Lynch was on a business trip and travel to attend Thermo FisherScientific Inc. board meetings during fiscal 2012. Amounts for fiscal 2013 and 2012 include various miscellaneousrepatriation expenses, German tax payments and U.S. tax gross-up payments pertaining to a 2011 expatriate assignment inGermany for one executive, and cash allowances (goods, services and utilities), housing and management fees, language
144

TE CONNECTIVITY LTD.
NOTES TO SWISS STATUTORY FINANCIAL STATEMENTS (Continued)
6. Executive Compensation (Continued)
training, home leave travel costs, miscellaneous fees and expenses, China tax payments, U.S. tax gross-up payments,personal tax preparation assistance, and car and driver expenses for another executive on expatriate assignment in China.Housing, utilities, car and driver expenses, and local tax payments were reported in local currency. Due to the timing ofpayments the following range of exchange rates, primarily as determined by TE Connectivity finance, were used to convertto U.S. dollars: $1.28—$1.34:EUR 1 and $0.159—$0.163:CNY 1 in fiscal 2013 and $0.157—$0.159:CNY 1 in fiscal 2012. Forour chief financial officer, amounts include a relocation benefit value in fiscal 2013, and a relocation benefit value anddirect variable costs associated with travel on our aircraft that was provided to him while he was transitioning to thecompany as a new hire in fiscal 2012.
(b) Represents the additional income reported for one executive for participation in a company paid life insurance program.
(c) Represents the value of dividend equivalent units credited in the fiscal year using the close price on the date of thecrediting.
(d) Represents the company matching contribution made under the ESPP for fiscal 2012. None of the named executive officersparticipated in the ESPP for fiscal 2013.
(e) Reflects contributions made on behalf of the named executive officers under our qualified defined contribution plan, andaccruals on behalf of the named executive officers under the SSRP (also a defined contribution plan), as follows:
Company MatchingContribution Company Contribution
Name Year (Qualified Plan) (Non-Qualified Plan)
Thomas Lynch,Chief Executive Officer . . . . . . . . . . . . . . . . . . . . . 2013 $12,750 $ 94,010
2012 $12,500 $100,000
Chief Financial Officers and three other most highlycompensated executive officers(*) . . . . . . . . . . . . . . . . 2013 $64,215 $187,960
2012 $62,996 $189,973
(*) Included in the amount above is an additional matching contribution of $5,500 for fiscal 2013 and $5,390 for fiscal2012 for one of the referenced executives as a result of a frozen defined benefit plan.
No loans or guarantees were granted to named executive officers in fiscal 2013.
7. Compensation of Non-Employee Directors
Fiscal 2013 compensation of each director who is not our salaried employee or an employee of oursubsidiaries was set at $215,000 per annum, payable $80,000 in cash and $135,000 in equity value. Thechair of the audit committee received an additional $25,000 cash retainer and the chairs of themanagement development and compensation committee and nominating, governance and compliancecommittee each received an additional $15,000 cash retainer. The chairman of the board, who effectiveJanuary 7, 2013 was appointed lead independent director, received an additional retainer fee of$160,000 ($100,000 in cash and $60,000 in equity value). Audit committee members, including the chair,each received an additional $10,000 in cash compensation. Directors who are employees of us or oursubsidiaries, including our current chairman of the board who was appointed effective January 7, 2013,do not receive any compensation for their services as directors.
Each non-employee director received the equity component of their compensation in the form of agrant of common shares of TE Connectivity Ltd., with the exception of Dr. Gromer, who received theequity component of his compensation in the form of deferred stock units (‘‘DSUs’’). Under currentU.S. tax law, our U.S.-based non-employee directors cannot defer any portion of their compensation,including DSUs, and therefore, they were issued common shares (which are immediately taxable) inlieu of DSUs. Because Dr. Gromer is a German citizen, he receives his equity compensation in theform of DSUs.
145
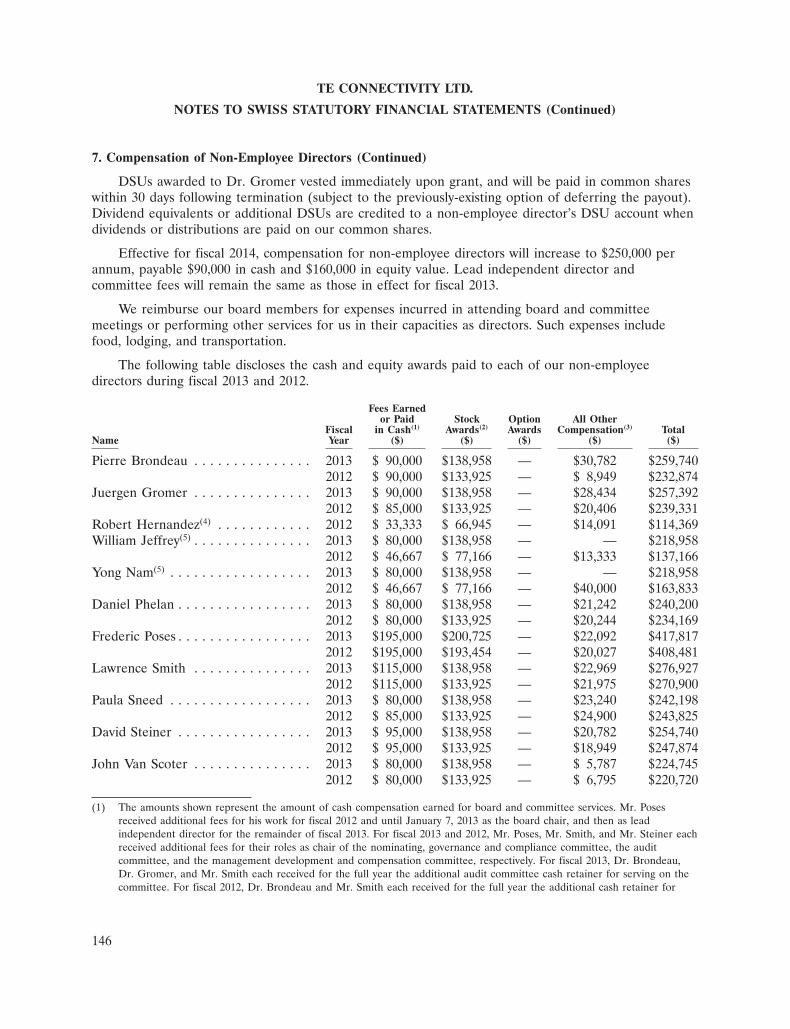
TE CONNECTIVITY LTD.
NOTES TO SWISS STATUTORY FINANCIAL STATEMENTS (Continued)
7. Compensation of Non-Employee Directors (Continued)
DSUs awarded to Dr. Gromer vested immediately upon grant, and will be paid in common shareswithin 30 days following termination (subject to the previously-existing option of deferring the payout).Dividend equivalents or additional DSUs are credited to a non-employee director’s DSU account whendividends or distributions are paid on our common shares.
Effective for fiscal 2014, compensation for non-employee directors will increase to $250,000 perannum, payable $90,000 in cash and $160,000 in equity value. Lead independent director andcommittee fees will remain the same as those in effect for fiscal 2013.
We reimburse our board members for expenses incurred in attending board and committeemeetings or performing other services for us in their capacities as directors. Such expenses includefood, lodging, and transportation.
The following table discloses the cash and equity awards paid to each of our non-employeedirectors during fiscal 2013 and 2012.
Fees Earnedor Paid Stock Option All Other
Fiscal in Cash(1) Awards(2) Awards Compensation(3) TotalName Year ($) ($) ($) ($) ($)
Pierre Brondeau . . . . . . . . . . . . . . . 2013 $ 90,000 $138,958 — $30,782 $259,7402012 $ 90,000 $133,925 — $ 8,949 $232,874
Juergen Gromer . . . . . . . . . . . . . . . 2013 $ 90,000 $138,958 — $28,434 $257,3922012 $ 85,000 $133,925 — $20,406 $239,331
Robert Hernandez(4) . . . . . . . . . . . . 2012 $ 33,333 $ 66,945 — $14,091 $114,369William Jeffrey(5) . . . . . . . . . . . . . . . 2013 $ 80,000 $138,958 — — $218,958
2012 $ 46,667 $ 77,166 — $13,333 $137,166Yong Nam(5) . . . . . . . . . . . . . . . . . . 2013 $ 80,000 $138,958 — — $218,958
2012 $ 46,667 $ 77,166 — $40,000 $163,833Daniel Phelan . . . . . . . . . . . . . . . . . 2013 $ 80,000 $138,958 — $21,242 $240,200
2012 $ 80,000 $133,925 — $20,244 $234,169Frederic Poses . . . . . . . . . . . . . . . . . 2013 $195,000 $200,725 — $22,092 $417,817
2012 $195,000 $193,454 — $20,027 $408,481Lawrence Smith . . . . . . . . . . . . . . . 2013 $115,000 $138,958 — $22,969 $276,927
2012 $115,000 $133,925 — $21,975 $270,900Paula Sneed . . . . . . . . . . . . . . . . . . 2013 $ 80,000 $138,958 — $23,240 $242,198
2012 $ 85,000 $133,925 — $24,900 $243,825David Steiner . . . . . . . . . . . . . . . . . 2013 $ 95,000 $138,958 — $20,782 $254,740
2012 $ 95,000 $133,925 — $18,949 $247,874John Van Scoter . . . . . . . . . . . . . . . 2013 $ 80,000 $138,958 — $ 5,787 $224,745
2012 $ 80,000 $133,925 — $ 6,795 $220,720
(1) The amounts shown represent the amount of cash compensation earned for board and committee services. Mr. Posesreceived additional fees for his work for fiscal 2012 and until January 7, 2013 as the board chair, and then as leadindependent director for the remainder of fiscal 2013. For fiscal 2013 and 2012, Mr. Poses, Mr. Smith, and Mr. Steiner eachreceived additional fees for their roles as chair of the nominating, governance and compliance committee, the auditcommittee, and the management development and compensation committee, respectively. For fiscal 2013, Dr. Brondeau,Dr. Gromer, and Mr. Smith each received for the full year the additional audit committee cash retainer for serving on thecommittee. For fiscal 2012, Dr. Brondeau and Mr. Smith each received for the full year the additional cash retainer for
146
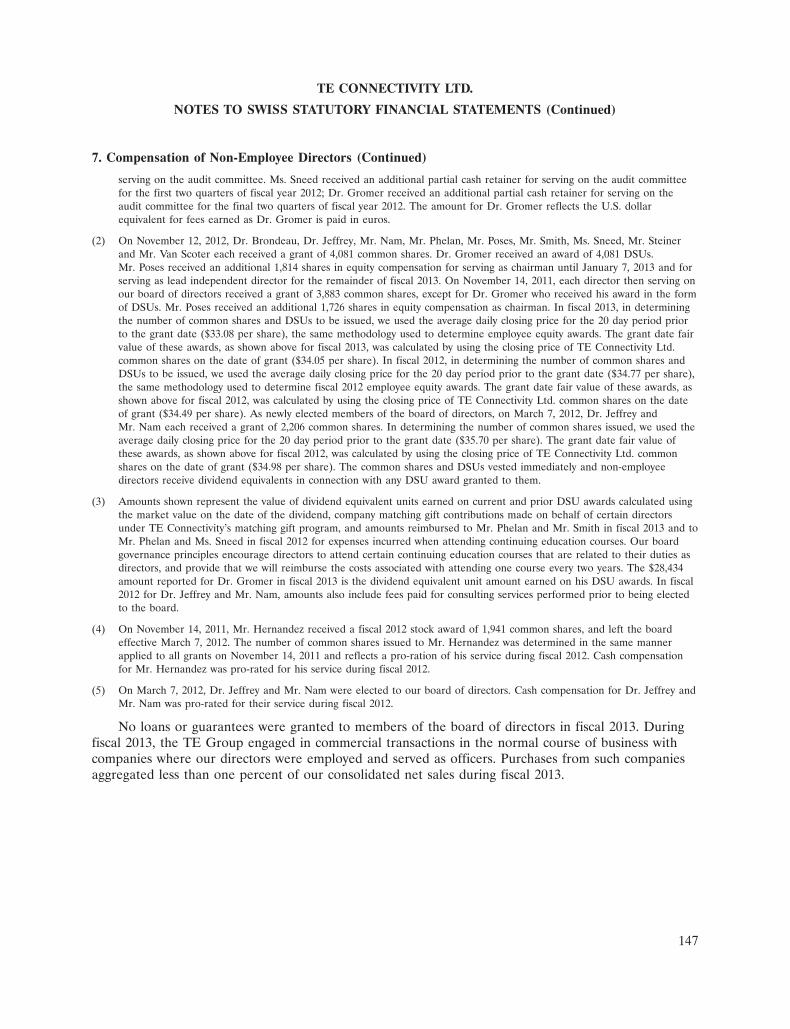
TE CONNECTIVITY LTD.
NOTES TO SWISS STATUTORY FINANCIAL STATEMENTS (Continued)
7. Compensation of Non-Employee Directors (Continued)
serving on the audit committee. Ms. Sneed received an additional partial cash retainer for serving on the audit committeefor the first two quarters of fiscal year 2012; Dr. Gromer received an additional partial cash retainer for serving on theaudit committee for the final two quarters of fiscal year 2012. The amount for Dr. Gromer reflects the U.S. dollarequivalent for fees earned as Dr. Gromer is paid in euros.
(2) On November 12, 2012, Dr. Brondeau, Dr. Jeffrey, Mr. Nam, Mr. Phelan, Mr. Poses, Mr. Smith, Ms. Sneed, Mr. Steinerand Mr. Van Scoter each received a grant of 4,081 common shares. Dr. Gromer received an award of 4,081 DSUs.Mr. Poses received an additional 1,814 shares in equity compensation for serving as chairman until January 7, 2013 and forserving as lead independent director for the remainder of fiscal 2013. On November 14, 2011, each director then serving onour board of directors received a grant of 3,883 common shares, except for Dr. Gromer who received his award in the formof DSUs. Mr. Poses received an additional 1,726 shares in equity compensation as chairman. In fiscal 2013, in determiningthe number of common shares and DSUs to be issued, we used the average daily closing price for the 20 day period priorto the grant date ($33.08 per share), the same methodology used to determine employee equity awards. The grant date fairvalue of these awards, as shown above for fiscal 2013, was calculated by using the closing price of TE Connectivity Ltd.common shares on the date of grant ($34.05 per share). In fiscal 2012, in determining the number of common shares andDSUs to be issued, we used the average daily closing price for the 20 day period prior to the grant date ($34.77 per share),the same methodology used to determine fiscal 2012 employee equity awards. The grant date fair value of these awards, asshown above for fiscal 2012, was calculated by using the closing price of TE Connectivity Ltd. common shares on the dateof grant ($34.49 per share). As newly elected members of the board of directors, on March 7, 2012, Dr. Jeffrey andMr. Nam each received a grant of 2,206 common shares. In determining the number of common shares issued, we used theaverage daily closing price for the 20 day period prior to the grant date ($35.70 per share). The grant date fair value ofthese awards, as shown above for fiscal 2012, was calculated by using the closing price of TE Connectivity Ltd. commonshares on the date of grant ($34.98 per share). The common shares and DSUs vested immediately and non-employeedirectors receive dividend equivalents in connection with any DSU award granted to them.
(3) Amounts shown represent the value of dividend equivalent units earned on current and prior DSU awards calculated usingthe market value on the date of the dividend, company matching gift contributions made on behalf of certain directorsunder TE Connectivity’s matching gift program, and amounts reimbursed to Mr. Phelan and Mr. Smith in fiscal 2013 and toMr. Phelan and Ms. Sneed in fiscal 2012 for expenses incurred when attending continuing education courses. Our boardgovernance principles encourage directors to attend certain continuing education courses that are related to their duties asdirectors, and provide that we will reimburse the costs associated with attending one course every two years. The $28,434amount reported for Dr. Gromer in fiscal 2013 is the dividend equivalent unit amount earned on his DSU awards. In fiscal2012 for Dr. Jeffrey and Mr. Nam, amounts also include fees paid for consulting services performed prior to being electedto the board.
(4) On November 14, 2011, Mr. Hernandez received a fiscal 2012 stock award of 1,941 common shares, and left the boardeffective March 7, 2012. The number of common shares issued to Mr. Hernandez was determined in the same mannerapplied to all grants on November 14, 2011 and reflects a pro-ration of his service during fiscal 2012. Cash compensationfor Mr. Hernandez was pro-rated for his service during fiscal 2012.
(5) On March 7, 2012, Dr. Jeffrey and Mr. Nam were elected to our board of directors. Cash compensation for Dr. Jeffrey andMr. Nam was pro-rated for their service during fiscal 2012.
No loans or guarantees were granted to members of the board of directors in fiscal 2013. Duringfiscal 2013, the TE Group engaged in commercial transactions in the normal course of business withcompanies where our directors were employed and served as officers. Purchases from such companiesaggregated less than one percent of our consolidated net sales during fiscal 2013.
147
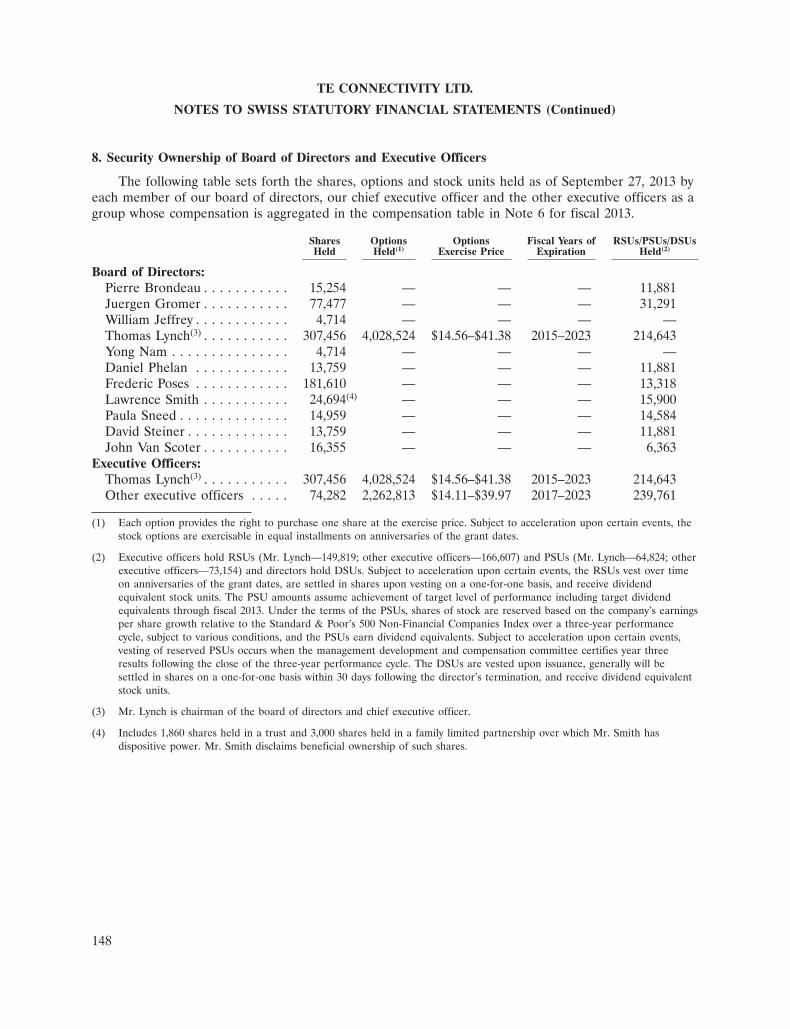
TE CONNECTIVITY LTD.
NOTES TO SWISS STATUTORY FINANCIAL STATEMENTS (Continued)
8. Security Ownership of Board of Directors and Executive Officers
The following table sets forth the shares, options and stock units held as of September 27, 2013 byeach member of our board of directors, our chief executive officer and the other executive officers as agroup whose compensation is aggregated in the compensation table in Note 6 for fiscal 2013.
Shares Options Options Fiscal Years of RSUs/PSUs/DSUsHeld Held(1) Exercise Price Expiration Held(2)
Board of Directors:Pierre Brondeau . . . . . . . . . . . 15,254 — — — 11,881Juergen Gromer . . . . . . . . . . . 77,477 — — — 31,291William Jeffrey . . . . . . . . . . . . 4,714 — — — —Thomas Lynch(3) . . . . . . . . . . . 307,456 4,028,524 $14.56–$41.38 2015–2023 214,643Yong Nam . . . . . . . . . . . . . . . 4,714 — — — —Daniel Phelan . . . . . . . . . . . . 13,759 — — — 11,881Frederic Poses . . . . . . . . . . . . 181,610 — — — 13,318Lawrence Smith . . . . . . . . . . . 24,694(4) — — — 15,900Paula Sneed . . . . . . . . . . . . . . 14,959 — — — 14,584David Steiner . . . . . . . . . . . . . 13,759 — — — 11,881John Van Scoter . . . . . . . . . . . 16,355 — — — 6,363
Executive Officers:Thomas Lynch(3) . . . . . . . . . . . 307,456 4,028,524 $14.56–$41.38 2015–2023 214,643Other executive officers . . . . . 74,282 2,262,813 $14.11–$39.97 2017–2023 239,761
(1) Each option provides the right to purchase one share at the exercise price. Subject to acceleration upon certain events, thestock options are exercisable in equal installments on anniversaries of the grant dates.
(2) Executive officers hold RSUs (Mr. Lynch—149,819; other executive officers—166,607) and PSUs (Mr. Lynch—64,824; otherexecutive officers—73,154) and directors hold DSUs. Subject to acceleration upon certain events, the RSUs vest over timeon anniversaries of the grant dates, are settled in shares upon vesting on a one-for-one basis, and receive dividendequivalent stock units. The PSU amounts assume achievement of target level of performance including target dividendequivalents through fiscal 2013. Under the terms of the PSUs, shares of stock are reserved based on the company’s earningsper share growth relative to the Standard & Poor’s 500 Non-Financial Companies Index over a three-year performancecycle, subject to various conditions, and the PSUs earn dividend equivalents. Subject to acceleration upon certain events,vesting of reserved PSUs occurs when the management development and compensation committee certifies year threeresults following the close of the three-year performance cycle. The DSUs are vested upon issuance, generally will besettled in shares on a one-for-one basis within 30 days following the director’s termination, and receive dividend equivalentstock units.
(3) Mr. Lynch is chairman of the board of directors and chief executive officer.
(4) Includes 1,860 shares held in a trust and 3,000 shares held in a family limited partnership over which Mr. Smith hasdispositive power. Mr. Smith disclaims beneficial ownership of such shares.
148
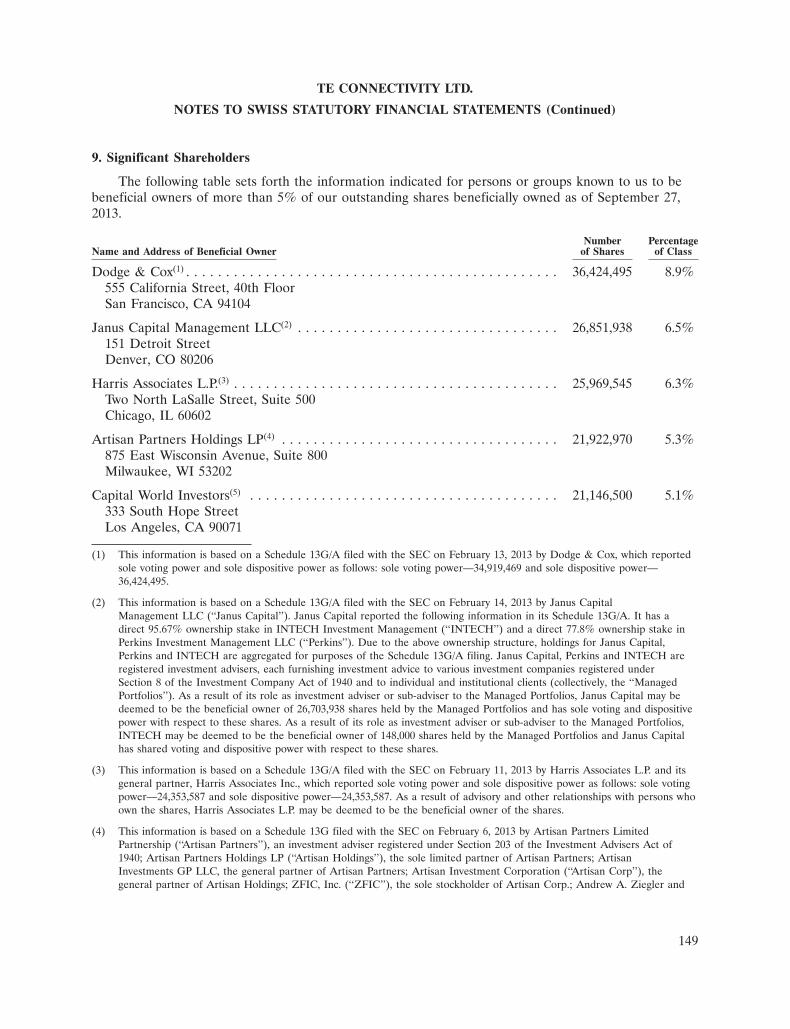
TE CONNECTIVITY LTD.
NOTES TO SWISS STATUTORY FINANCIAL STATEMENTS (Continued)
9. Significant Shareholders
The following table sets forth the information indicated for persons or groups known to us to bebeneficial owners of more than 5% of our outstanding shares beneficially owned as of September 27,2013.
Number PercentageName and Address of Beneficial Owner of Shares of Class
Dodge & Cox(1) . . . . . . . . . . . . . . . . . . . . . . . . . . . . . . . . . . . . . . . . . . . . . . . 36,424,495 8.9%555 California Street, 40th FloorSan Francisco, CA 94104
Janus Capital Management LLC(2) . . . . . . . . . . . . . . . . . . . . . . . . . . . . . . . . . 26,851,938 6.5%151 Detroit StreetDenver, CO 80206
Harris Associates L.P.(3) . . . . . . . . . . . . . . . . . . . . . . . . . . . . . . . . . . . . . . . . . 25,969,545 6.3%Two North LaSalle Street, Suite 500Chicago, IL 60602
Artisan Partners Holdings LP(4) . . . . . . . . . . . . . . . . . . . . . . . . . . . . . . . . . . . 21,922,970 5.3%875 East Wisconsin Avenue, Suite 800Milwaukee, WI 53202
Capital World Investors(5) . . . . . . . . . . . . . . . . . . . . . . . . . . . . . . . . . . . . . . . 21,146,500 5.1%333 South Hope StreetLos Angeles, CA 90071
(1) This information is based on a Schedule 13G/A filed with the SEC on February 13, 2013 by Dodge & Cox, which reportedsole voting power and sole dispositive power as follows: sole voting power—34,919,469 and sole dispositive power—36,424,495.
(2) This information is based on a Schedule 13G/A filed with the SEC on February 14, 2013 by Janus CapitalManagement LLC (‘‘Janus Capital’’). Janus Capital reported the following information in its Schedule 13G/A. It has adirect 95.67% ownership stake in INTECH Investment Management (‘‘INTECH’’) and a direct 77.8% ownership stake inPerkins Investment Management LLC (‘‘Perkins’’). Due to the above ownership structure, holdings for Janus Capital,Perkins and INTECH are aggregated for purposes of the Schedule 13G/A filing. Janus Capital, Perkins and INTECH areregistered investment advisers, each furnishing investment advice to various investment companies registered underSection 8 of the Investment Company Act of 1940 and to individual and institutional clients (collectively, the ‘‘ManagedPortfolios’’). As a result of its role as investment adviser or sub-adviser to the Managed Portfolios, Janus Capital may bedeemed to be the beneficial owner of 26,703,938 shares held by the Managed Portfolios and has sole voting and dispositivepower with respect to these shares. As a result of its role as investment adviser or sub-adviser to the Managed Portfolios,INTECH may be deemed to be the beneficial owner of 148,000 shares held by the Managed Portfolios and Janus Capitalhas shared voting and dispositive power with respect to these shares.
(3) This information is based on a Schedule 13G/A filed with the SEC on February 11, 2013 by Harris Associates L.P. and itsgeneral partner, Harris Associates Inc., which reported sole voting power and sole dispositive power as follows: sole votingpower—24,353,587 and sole dispositive power—24,353,587. As a result of advisory and other relationships with persons whoown the shares, Harris Associates L.P. may be deemed to be the beneficial owner of the shares.
(4) This information is based on a Schedule 13G filed with the SEC on February 6, 2013 by Artisan Partners LimitedPartnership (‘‘Artisan Partners’’), an investment adviser registered under Section 203 of the Investment Advisers Act of1940; Artisan Partners Holdings LP (‘‘Artisan Holdings’’), the sole limited partner of Artisan Partners; ArtisanInvestments GP LLC, the general partner of Artisan Partners; Artisan Investment Corporation (‘‘Artisan Corp’’), thegeneral partner of Artisan Holdings; ZFIC, Inc. (‘‘ZFIC’’), the sole stockholder of Artisan Corp.; Andrew A. Ziegler and
149
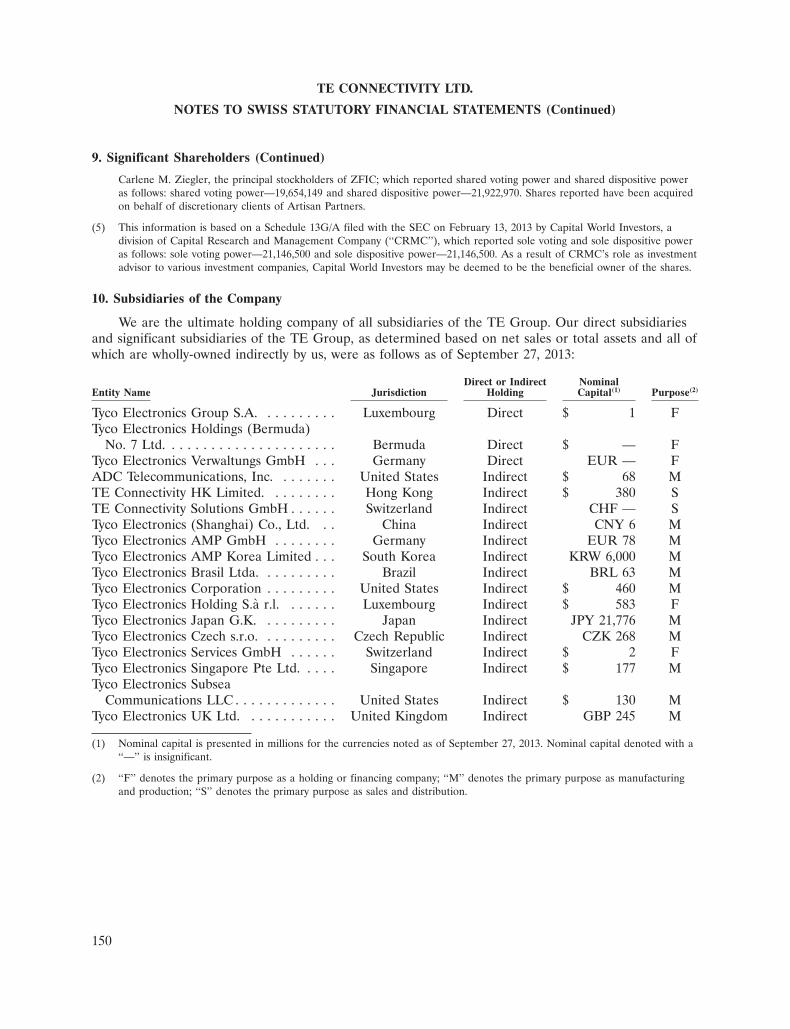
TE CONNECTIVITY LTD.
NOTES TO SWISS STATUTORY FINANCIAL STATEMENTS (Continued)
9. Significant Shareholders (Continued)
Carlene M. Ziegler, the principal stockholders of ZFIC; which reported shared voting power and shared dispositive poweras follows: shared voting power—19,654,149 and shared dispositive power—21,922,970. Shares reported have been acquiredon behalf of discretionary clients of Artisan Partners.
(5) This information is based on a Schedule 13G/A filed with the SEC on February 13, 2013 by Capital World Investors, adivision of Capital Research and Management Company (‘‘CRMC’’), which reported sole voting and sole dispositive poweras follows: sole voting power—21,146,500 and sole dispositive power—21,146,500. As a result of CRMC’s role as investmentadvisor to various investment companies, Capital World Investors may be deemed to be the beneficial owner of the shares.
10. Subsidiaries of the Company
We are the ultimate holding company of all subsidiaries of the TE Group. Our direct subsidiariesand significant subsidiaries of the TE Group, as determined based on net sales or total assets and all ofwhich are wholly-owned indirectly by us, were as follows as of September 27, 2013:
Direct or Indirect NominalEntity Name Jurisdiction Holding Capital(1) Purpose(2)
Tyco Electronics Group S.A. . . . . . . . . . Luxembourg Direct $ 1 FTyco Electronics Holdings (Bermuda)
No. 7 Ltd. . . . . . . . . . . . . . . . . . . . . . Bermuda Direct $ — FTyco Electronics Verwaltungs GmbH . . . Germany Direct EUR — FADC Telecommunications, Inc. . . . . . . . United States Indirect $ 68 MTE Connectivity HK Limited. . . . . . . . . Hong Kong Indirect $ 380 STE Connectivity Solutions GmbH . . . . . . Switzerland Indirect CHF — STyco Electronics (Shanghai) Co., Ltd. . . China Indirect CNY 6 MTyco Electronics AMP GmbH . . . . . . . . Germany Indirect EUR 78 MTyco Electronics AMP Korea Limited . . . South Korea Indirect KRW 6,000 MTyco Electronics Brasil Ltda. . . . . . . . . . Brazil Indirect BRL 63 MTyco Electronics Corporation . . . . . . . . . United States Indirect $ 460 MTyco Electronics Holding S.a r.l. . . . . . . Luxembourg Indirect $ 583 FTyco Electronics Japan G.K. . . . . . . . . . Japan Indirect JPY 21,776 MTyco Electronics Czech s.r.o. . . . . . . . . . Czech Republic Indirect CZK 268 MTyco Electronics Services GmbH . . . . . . Switzerland Indirect $ 2 FTyco Electronics Singapore Pte Ltd. . . . . Singapore Indirect $ 177 MTyco Electronics Subsea
Communications LLC . . . . . . . . . . . . . United States Indirect $ 130 MTyco Electronics UK Ltd. . . . . . . . . . . . United Kingdom Indirect GBP 245 M
(1) Nominal capital is presented in millions for the currencies noted as of September 27, 2013. Nominal capital denoted with a‘‘—’’ is insignificant.
(2) ‘‘F’’ denotes the primary purpose as a holding or financing company; ‘‘M’’ denotes the primary purpose as manufacturingand production; ‘‘S’’ denotes the primary purpose as sales and distribution.
150

Proposed Appropriation of Available Earnings
Our board of directors will propose, in conjunction with our annual general meeting, anappropriation of CHF 49 million from unappropriated accumulated earnings to establish a generalreserve in accordance with Art. 671 of the Swiss Code of Obligations. The remaining balance ofunappropriated accumulated earnings, CHF 1,045 million, will be carried forward.
151

REPORT OF THE STATUTORY AUDITOR ON THE SWISS STATUTORY FINANCIALSTATEMENTS OF TE CONNECTIVITY LTD.
To the General meeting ofTE CONNECTIVITY LTD., SCHAFFHAUSEN
Report of the Statutory Auditor on the financial statements
As Statutory Auditor, we have audited the accompanying financial statements of TEConnectivity Ltd. (the ‘‘Company’’), which comprise the statement of operations, balance sheet andnotes (pages 133 – 151) for the year ended September 27, 2013.
Board of Directors’ Responsibility
The Board of Directors is responsible for the preparation of the financial statements in accordancewith the requirements of Swiss law and the Company’s articles of association. This responsibilityincludes designing, implementing and maintaining an internal control system relevant to thepreparation of financial statements that are free from material misstatement, whether due to fraud orerror. The Board of Directors is further responsible for selecting and applying appropriate accountingpolicies and making accounting estimates that are reasonable in the circumstances.
Auditor’s Responsibility
Our responsibility is to express an opinion on these financial statements based on our audit. Weconducted our audit in accordance with Swiss law and Swiss Auditing Standards. Those standardsrequire that we plan and perform the audit to obtain reasonable assurance whether the financialstatements are free from material misstatement.
An audit involves performing procedures to obtain audit evidence about the amounts anddisclosures in the financial statements. The procedures selected depend on the auditor’s judgment,including the assessment of the risks of material misstatement of the financial statements, whether dueto fraud or error. In making those risk assessments, the auditor considers the internal control systemrelevant to the entity’s preparation of the financial statements in order to design audit procedures thatare appropriate in the circumstances, but not for the purpose of expressing an opinion on theeffectiveness of the entity’s internal control system. An audit also includes evaluating theappropriateness of the accounting policies used and the reasonableness of accounting estimates made,as well as evaluating the overall presentation of the financial statements. We believe that the auditevidence we have obtained is sufficient and appropriate to provide a basis for our audit opinion.
Opinion
In our opinion, the financial statements for the year ended September 27, 2013 comply with Swisslaw and the Company’s articles of association.
Report on Other Legal Requirements
We confirm that we meet the legal requirements on licensing according to the Auditor OversightAct (‘‘AOA’’) and independence (Article 728, CO, and Article 11, AOA) and that there are nocircumstances incompatible with our independence.
In accordance with Article 728a, paragraph 1, item 3, CO, and Swiss Auditing Standard 890, weconfirm that an internal control system exists, which has been designed for the preparation of financialstatements according to the instructions of the Board of Directors.
152

We further confirm that the proposed appropriation of accumulated earnings complies with Swisslaw and the Company’s articles of association. We recommend that the financial statements submittedto you be approved.
Deloitte AG
/s/ Martin Welser /s/ Matthias GschwendLicensed Audit Expert Licensed Audit ExpertAuditor in charge
Zurich, November 15, 2013
153


TE Connectivity is a technology leader that designs and manufactures the electronic connectors, components and systems inside the products that are changing the world—making them smarter, safer, greener and more connected.
*See Non-GAAP MeasuresAll figures FY13 unless otherwise noted
EVERY CONNECTION COUNTS
ABOUT OUR COVER DESIGNThis year’s annual report cover features TE Connectivity engineers who reflect the engineering spirit of our company. These individuals were featured in our new advertising campaign. To learn more about the campaign, please visit www.everyconnectioncounts.com.
$13.3BIN SALES
14.2%ADJUSTED
OPERATINGMARGIN*
$1.5BFREE CASH FLOW*
2013 ANNUAL REPORT
BOARD OF DIRECTORS
LEADERSHIP TEAM AND OFFICERS
Thomas J. Lynch Chairman & Chief Executive Officer, TE Connectivity Ltd.
Dr. Pierre R. Brondeau President, Chair & Chief Executive Officer, FMC Corporation
Dr. Juergen W. Gromer Retired President, Tyco Electronics
Dr. William A. JeffreyChief Executive Officer & President,HRL Laboratories, LLC
Yong NamAdvisor to the CEO,Daelim Industrial Co. Ltd.
Daniel J. Phelan Retired Chief of Staff, GlaxoSmithKline plc
Frederic M. Poses* Chief Executive Officer & Partner, Ascend Performance Materials Lawrence S. Smith Retired Executive Vice President & Co-CFO, Comcast Corporation
Paula A. Sneed Chair & Chief Executive Officer, Phelps Prescott Group, LLC
David P. Steiner President, Chief Executive Officer & Director, Waste Management, Inc.
John C. Van Scoter President, Chief Executive Officer & Director, eSolar, Inc.
* Lead Independant Director of the TE Connectivity Ltd. Board of Directors
Thomas J. Lynch Chairman & Chief Executive Officer
Mario CalastriSenior Vice President,Treasurer
Terrence R. CurtinPresident, Industrial Solutions
Joseph B. DonahueExecutive Vice President,Chief Operating OfficerPresident, Network Solutions
Joseph F. Eckroth, Jr.Senior Vice President,Chief Information Officer
Bradley A. GambillSenior Vice President, Strategy & Business Development
Robert W. HauExecutive Vice President,Chief Financial Officer
John S. Jenkins, Jr.Executive Vice President,General Counsel
Jane A. LeipoldSenior Vice President,Global Human Resources
Steven T. Merkt President, Transportation Solutions
Minoru OkamotoSenior Advisor to the CEO
James O’ToolePresident, Consumer Solutions
Robert J. OttSenior Vice President,Corporate Controller
Eric J. ReschSenior Vice President,Chief Tax Officer
Robert N. ShaddockExecutive Vice President,Chief Technology Officer
Amy B. ShahSenior Vice President,Chief Marketing Officer
Joan E. WainwrightPresident, Channel & Customer Experience
2013 ANNUAL REPORT
This document was printed using soy–based inks and paper containing 30% postconsumer recycled fiber. The paper was produced by a Forest Stewardship Council™ (FSC®) Chain of Custody supplier. Printing was done according to ISO workflow procedures. © 2014 TE Connectivity Ltd. All Rights Reserved.001-AR-2013 TE Connectivity and TE Connectivity (logo) are trademarks. Other logos, product and/or company names might be trademarks of their respective owners.
CORPORATE DATAREGISTERED & PRINCIPALEXECUTIVE OFFICETE Connectivity Ltd.Rheinstrasse 20CH-8200 SchaffhausenSwitzerland+41.0.52.633.66.61 INDEPENDENT AUDITORSDeloitte & Touche LLP1700 Market StreetPhiladelphia, PA 19103 Deloitte AGGeneral Guisan-Quai 38CH-8022 ZurichSwitzerland STOCK EXCHANGEThe company’s common shares are traded on the New York Stock Exchange (NYSE) under the ticker symbol TEL. FORM 10-KCopies of the company’s Annual Report on Form 10-K for the fiscal year ended September 27, 2013 may be obtained by shareholders without charge upon written request toTE Connectivity Ltd., Rheinstrasse 20,CH-8200 Schaffhausen, Switzerland.The Annual Report on Form 10-K is also available on the company’s website at www.te.com
SHAREHOLDER SERVICESRegistered shareholders (shares held in your own name with our transfer agent) with requests such as change of address or dividend checks should contact TE Connectivity’s transfer agent at: Wells Fargo Shareowner Services1110 Centre Pointe Curve, Suite 101Mendota Heights, MN 55120-4100866.258.4745www.shareowneronline.com
Beneficial shareholders (shares held with a bank or broker) should contact the bank or brokerage holding their shares with their requests. Other shareholder inquiries may be directed to TE Connectivity Shareholder Services at the company’s registered and principal executive office above.
www.te.com
20
13 A
NN
UA
L R
EP
OR
T