Embed Size (px)
Citation preview

CORIOLIS FLOW METERS - CALIBRATION APPROACH FOR CRYOGENIC APPLICATIONS


CORIOLIS FLOW METERS- CALIBRATION APPROACH
FOR CRYOGENIC APPLICATIONS
A Report for
EMRP ENG-03 LNG Project
Prepared by:
Organisation
Asaad Kenbar
Peter Lucas
Tore Mortensen
NEL
VSL
JV

The work described in this report was carried out by NEL, VSL and Justervesenet.
Any updates to the content of the report should be mutually agreed.
The research leading to these results has received funding from the European Union
on the basis of Decision No 912/2009/EC. The EMRP is jointly funded by the EMRP
participating countries within Euramet and the European Union.
For all use, the prior written consent of NEL Ltd, VSL and Justervesenet shall be obtained
before reproducing all or any part of this report. Applications for permission to publish should
be made through VSL:
Project manager “Metrology for LNG”
VSL, Thijsseweg 11
2629 JA Delft
E-mail: [email protected]
Tel: +31 (0) 15 2691500
© VSL bv 2013

Coriolis flow meters – calibration approach for cryogenic applications
October 1, 2013
i
Contents 1 Introduction .................................................................................................................. 1
2 Calibration approach for cryogenic applications ......................................................... 3
3 Test flow meters ............................................................................................................ 5
4 Test programme ............................................................................................................ 7
5 Test facilities and calibration procedures ..................................................................... 9
5.1 Water Calibration Facilities (VSL, NEL, JV) ............................................................ 9
5.2 LNG/Liquid Nitrogen Test Facility at VSL ..............................................................10
5.3 Liquid Nitrogen Test Facility at NIST ....................................................................11
5.4 LNG Road Tanker Setup at JV ...............................................................................13
6 Results and discussion ..................................................................................................15
6.1 Results for flow meter A .......................................................................................15
6.1.1 Calibration with water at VSL .......................................................................15
6.1.2 Calibration with liquid nitrogen at NIST .......................................................15
6.1.3 Calibration with liquid nitrogen at VSL ........................................................16
6.1.4 Calibration with liquid natural gas at VSL ....................................................17
6.2 Results for flow meter B .......................................................................................18
6.2.1 Calibration with water (third party) .............................................................18
6.2.2 Calibration with liquid natural gas at VSL ....................................................18
6.3 Results for flow meter C .......................................................................................19
6.3.1 Calibration with water at JV .........................................................................19
6.3.2 Calibration with liquid natural gas at JV ......................................................20
6.3.3 Calibration with liquid natural gas at VSL ....................................................20
6.4 Results for flow meter D .......................................................................................21
6.4.1 Calibration with water at NEL .......................................................................21
6.4.2 Calibration with liquid nitrogen at NIST .......................................................22
6.4.3 Calibration with liquid natural gas at VSL ....................................................26
6.5 Discussion ..............................................................................................................26
7 Summary and conclusions ............................................................................................29
Acknowledgment ................................................................................................................30
References ...........................................................................................................................30

Coriolis flow meters – calibration approach for cryogenic applications
October 1, 2013
ii

Coriolis flow meters – calibration approach for cryogenic applications
October 1, 2013
1
1 Introduction
This report is made for the research project ‘Metrology for LNG’. This project is part of
the European Metrology Research Programme (EMRP) which is jointly funded by the
European commission and participating countries within Euramet and the European
Union. The objective of this project is to improve the uncertainty associated with the
calculation of LNG energy transfer by developing new techniques and methods.
This will be achieved by looking at the complete LNG custody transfer process including
volume and composition measurements along with density and gross calorific value
calculations. Detailed description of all work packages and tasks within each work
package (WP) is found in the Joint Research Project (JRP) Protocol [1]. In addition to
Measurements of LNG volume by tank gauging methods, measurement of volumetric
and mass flow rates using ultrasonic and Coriolis flow meters are investigated in this
project. These flow metering technologies have been found to be suitable for
measurement of LNG [11].
This report presents results from a test programme designed to gather data from
Coriolis flow meters in order to explore their application to LNG flow measurement.
This will be carried out by assessing the cryogenic correction models that are used in the
transfer of a standard factory calibration with water at ambient conditions to cryogenic
conditions. The work was carried out in collaboration with three flow meter
manufacturers.
Coriolis mass flow meters are currently used across all industries for liquid, gas and
cryogenic flow and density measurement applications. The international Organization
of Legal Metrology (OIML) sets the standards of performance for fiscal measurement
equipment [2].
Coriolis mass flow measurement has been widely applied in the distribution and
delivery of natural gas. Large sized units are used to monitor and control flows in the
re-gasification processes at LNG terminals, and monitor LNG transfers around the
terminals. Smaller sized units are used to monitor local deliveries to CNG-powered
vehicles, from the fuel dispensers at their depots. Due to the absence of cryogenic
calibration facilities, Coriolis flow meters are normally calibrated at ambient condition
with a process fluid such as water and corrections are then applied to account for
cryogenic conditions. There is therefore a requirement to independently check the
applicability of this calibration approach.
Testing experience with cryogenic fluids showed that the Young’s modulus of elasticity
of stainless steel used in the Coriolis meter tubes has a (non-linear) dependence on
temperature, causing a calibration shift. It is claimed that, when the temperature-
dependent calibration shift is allowed for, standard factory calibrations at ambient
conditions can be transferred to operation at cryogenic temperatures [2]. Similar
conclusion has also been reported in [9]. The aforementioned work has set the
foundation for development of a procedure for transferring standard factory

Coriolis flow meters – calibration approach for cryogenic applications
October 1, 2013
2
calibrations at ambient conditions to operation at cryogenic temperature. However, a
reliable and generalised procedure requires gathering test data from flow meters of
different make and size in order to investigate its applicability to LNG.
Until very recently, the NIST cryogenic flowmeter calibration facility was the only
independent facility of its kind in the world, and it has been used by many
manufacturers to address the above issue. However, this facility allows testing with
liquid nitrogen only. A new facility of similar size has been developed by VSL, the Dutch
Metrology Institute, during the last three years under this EMRP-LNG project in order to
overcome the limitation of NIST facility by allowing testing with LNG as well as liquid
nitrogen. The other objective of this facility is to reduce the uncertainty associated with
flow meter calibration. Despite size limitation, the VSL facility will set the ground for
building a mid-scale facility in the near future. The knowledge and experience gained
from these two facilities will aid the construction of large scale industrial facility in the
future.
The work presented here adds to the previous work by providing more cryogenic test
data for Coriolis flow meters from different manufacturers. This helps to meet the
growing demand for building more confidence in the claimed accuracy and
performance of this technology for cryogenic flow measurement.
In this EMRP project, it was intended to develop a similar calibration approach for
ultrasonic flow meters; however, due to difficulty in obtaining test flow meters
combined with lack of cryogenic test facilities for the size of meters used in LNG
industry, it was not possible to undertake this activity under the current EMRP project
for LNG. It was therefore decided to focus effort on Coriolis meters and plan work for
ultrasonic meters in a future project.

Coriolis flow meters – calibration approach for cryogenic applications
October 1, 2013
3
2 Calibration approach for cryogenic
applications
Coriolis flow meters have been used commercially since the late 1970s, although designs
based on the Coriolis principle have been reported since the early 1950s [3]. They are
capable of accurately measuring mass flow rate for most single phase fluids. Modern
flow meters are normally claimed to have an accuracy of 0.1% or better when
calibrated at reference conditions.
In a Coriolis flowmeter, the primary part is a (flow) sensor consisting of one or more
measuring tubes and a supporting structure. The measuring tube is normally driven at
one of its resonant frequencies with minimum energy consumption. The amplitude of
the vibration is very small, typically a fraction of a millimetre. On both the inlet and
outlet sides of the measuring tube, there are also motion sensing devices, for example
electromagnetic coil and magnet devices, to detect vibration signals. When the fluid is
passing through the sensor, it is accelerated by the measuring tube through the Coriolis
effect which is perpendicular to both the flow and rotating directions. Coriolis
accelerations on the inlet and outlet sides are opposite to each other, which can create
phase difference between the vibration signals. In the sensor, there are also other
temperature and strain sensing devices.
Within a certain limit of the fluid velocity, the time delay between vibration signals can
be regarded as linearly proportional to mass flow rate. In practice, because it is
impossible to obtain a perfectly symmetric structure in terms of its dynamic properties
(mass, stiffness and damping), a small time delay between inlet and outlet motion
sensing devices usually occurs even when there is no flow. Thus a zeroing procedure is
normally required, preferably under a condition similar to the measurement condition.
The final signal used for measuring mass flow rate is, therefore, the time delay with
flow subtracting the zero value when there is no flow. In addition to flow rate
measurement, fluid density can also be measured using the driving frequency.
As one of the major traditional commercial designs, twin tubes bent into a 'U' or other
shapes are used for the sensor. The fluid coming from the inlet process pipe splits
equally between the two parallel measuring tubes. The tubes are caused to vibrate
perpendicular to the plane of the bent shape like a tuning fork. There are also other
commercial designs, such as single or twin straight tube flow sensors [4, 5], which have
their intrinsic advantages, such as compactness, low pressure drop, self-draining, etc. For
cryogenic applications, bent tube designs are suitable because thermal stresses created
from temperature changes are low and within the material limit. However, straight
tube designs have also been tested with success in cryogenic applications.
To measure mass flow rate, the flowmeter is normally calibrated in the factory against a
weigh standard at the reference condition, for example using water at ambient
conditions. This provides a single flow calibration factor which relates time delay to
mass flow rate. It is known that the Young’s modulus of the measuring tube can affect
this flow calibration factor, since the Young’s modulus of a material changes with

Coriolis flow meters – calibration approach for cryogenic applications
October 1, 2013
4
temperature. It is, therefore, necessary to provide another flow correction factor to
compensate the change of fluid temperature. This can be done through individual
calibration or default material data.
In a flow meter design with straight measuring tubes and mechanical oscillating system
arranged in a support tube, a temperature gradient between the support tube and
oscillating system (dynamic temperature changes and different thermal coefficients of
expansion) may exist. These temperature induced influences affect the behaviour of the
mechanical oscillating system and result in temperature induced error to the measured
mass flow rate. These errors are compensated for by measuring the temperature of the
support tube and the temperature of the mechanical oscillating system and these
temperatures are fed into a special correction circuit to correct the measured signal and
thus the mass flow rate.
To measure density, two density calibration factors are determined in the factory using
air and water data. Similar to flow measurement, density correction factor is also
needed to compensate the change of fluid temperature.
Current industry practice is to calibrate the flow meter with water at both room and
elevated temperatures to ensure the best accuracy for a wider temperature application.
Temperature correction factors for both mass flow and density measurements are
stored in the flow meter. These correction factors are typically based on the well known
relationship of Young’s modulus versus temperature as shown in Figure 2-1. Therefore,
these correction factors typically are based on some polynomial of the temperature
reading. Note that the Young’s modulus is fairly linear to temperatures down to, say,
150 K. For lower temperatures the Young’s modules is clearly nonlinear.
Figure 2-1 Youngs Modulus of three types of stainless steel [Source: J.Appl.Phys., Vol. 52, No. 3, march 1981].

Coriolis flow meters – calibration approach for cryogenic applications
October 1, 2013
5
3 Test flow meters
Details of flowmeters tested in this work are listed in table 1. Three meters have twin
bent tube configuration and one meter has twin straight tube configuration.
Since the purpose of this project is to review, validate and improve the calibration
approach currently adopted by industry, the performance of these flow metes is not
directly compared and their identities are therefore kept anonymous.
Test
Flow
meter
Size
[“]
Meter Flow
range,
[kg/s]
Temperat
ure range
[°C]
Pressure
range [bar]
Claimed
Accuracy
(full
scale) [%]
Zero
point
stability,
[kg/s]
A 2 1 to 24 -240 to 204 up to 108 within
0.35 <0.002
B 2 1 to 13 -240 to 200 up to 100 within
0.30 <0.001
C 2 1 to 24 -240 to 204 up to 108 within
0.35 <0.002
D 2 1 to 9 -180 to 230 up to 200 within
0.20 <0.001
Flow meter D was tested previously in another project [9] and the data was made
available to this project. A successor of this flow meter (same make and model but with
newer electronics) was made available to the EMRP project. Hence, actually two
different meters have been used for the measurements indicated for meter D.
It can be seen that all test flow meters were 2” in size as the cryogenic test facilities
employed in this work are limited to this flow meters size and the flow range that can
be covered.

Coriolis flow meters – calibration approach for cryogenic applications
October 1, 2013
6

Coriolis flow meters – calibration approach for cryogenic applications
October 1, 2013
7
4 Test programme
The main objective of the test programme is to assess the transfer of a standard factory
calibration with water at ambient conditions to operation at cryogenic conditions.
An ideal test programme was planned as given below. However, depending on
prevailing circumstances during the project, this sequence was not necessarily followed
for all flow meters:
1. Calibrate the flow meter with water at ambient temperatures (e.g. 20oC)
2. Calibrate the flow meter with liquid nitrogen, typically at temperatures around -
193oC.
3. Calibrate the flow meter with LNG, typically at temperatures around -161oC.
4. Repeat the testing with water in order to establish reproducibility of
measurements and check that the exposure of the flow meter to very low
temperatures has not affected the performance of its sensor.
The following table gives an overview of tests performed for each flow meter and the
institute carried out the test.
Test
Flowmeter
Water flow
range, kg/s &
(Institute)
Liquid Nitrogen
flow range, kg/s
& (Institute)
LNG flow range,
kg/s & (Institute)
A 1 to 12 (VSL) 1 to 9 (NIST)
1 to 5 (VSL)
1 to 4.7 (VSL)
B 1 to 4 (third party) Not tested 1 to 4.7 (VSL)
C 1 to 16.4 (JV) Not tested 4.3 (JV)
1 to 4 (VSL)
D1 1 to 9 (NEL) 1 to 9 (NEL/NIST) 1 to 4 (VSL)
Because the calibrations have been performed at various labs, the calibration
procedures have not been completely the same. However, the following approach has
typically been followed.
The flow meter zero was set for the current testing conditions (ambient or cryogenic).
This was achieved by closing the two valves upstream and downstream of the flow
1 Actually two different meters have been used for the measurements indicated for meter D; the meter used for the tests for LNG is of the same make and model, however a successor of the meter that has been used for the calibrations with water and LIN.

Coriolis flow meters – calibration approach for cryogenic applications
October 1, 2013
8
meter for a short time to avoid any liquid boiling. No further change was made to its
value during subsequent tests. However, for flow meter D, the zero was set for ambient
conditions. At cryogenic conditions, the zero value was monitored and recorded before
and after each test in order to monitor its shift from the stored value. Note, the various
procedures for zeroing the meter together with the zero stability may attribute to a
small discrepancy for low flow rates (worst case scenario is 0.1% for 1 kg/s). It was
observed that the zero stability was much better for LNG than for LIN.
For water, the flow meters have been calibrated between 10% and 50% of full scale
(100% for flow meter D). For LIN, flow meter A has been calibrated up to 40% and flow
meter D up to 100% of full scale. For LNG, flow meters A and C have been calibrated up
to 20% and for flow meter B and D up to 36% and 44% respectively. In the table of
Section 3 the range of the various meters is shown, in the table of Section 4 the tested
flow rate range is shown.
Each flow rate was taken multiple times to assess the repeatability of the
measurements. The whole test was then repeated 4 times. Tests were typically
performed over multiple days. For flow meter D, an additional set of data was taken at
cryogenic conditions to check the flow meter performance when its insulation jacket is
removed. This test is essential to explore the influence of ambient heat gain on the
performance of the meter and importance of using thermal insulation.
The measured values of mass flow rate, density and temperature from the flow meter
were collected in addition to the reference flow rates and physical property data from
the calibration rigs. There were no statistical evaluations done to observe any pressure,
temperature or thermal cycling dependencies.

Coriolis flow meters – calibration approach for cryogenic applications
October 1, 2013
9
5 Test facilities and calibration procedures
5.1 Water Calibration Facilities (VSL, NEL, JV)
In this section the water calibration facilities are described. However, because water
calibration facilities are relatively straightforward, only one facility is shown here (NEL
facility, see Figure 5-1).
Figure 5-1 Schematic diagram of NEL gravimetric test facility.
For all labs, the flow meter was calibrated by comparison of the output value with the
value derived from a reference gravimetric weighing system. The method used was a
diversion technique where the flow was continuous and diverted into the chosen
weight tank for the duration of the test.
The flowrate was calculated using the time taken for the quantity of fluid to pass
through the meter. All measurements are fully traceable to Dutch, Norwegian or UK
National Standards.
The percentage error or meter deviation was calculated for the indicated totalised mass
(Mi) from the device under test with respect to the reference totalised mass (M):
100M
M- MixDeviationPercent
(1)
The same approach was used to calculate the percentage error in measured density.

Coriolis flow meters – calibration approach for cryogenic applications
October 1, 2013
10
The uncertainty estimates quoted are expanded uncertainties based on a standard
uncertainty multiplied by a coverage factor k=2. This provides a level of confidence of
approximately 95%.
Using the test method outlined, the uncertainty in the measurement of the reference
quantity of fluid passed through the flow meter under test is estimated to be 0.1
percent or better for mass flow rate and 0.02 percent or better for density.
5.2 LNG/Liquid Nitrogen Test Facility at VSL
A schematic picture of the measurement set-up of VSL for cryogenic liquids is displayed
in Figure 5-2. It consists of a 1 m3 storage tank, a cryogenic pump, the flow meter under
test and a 0.5 m3 tank placed on a mass balance. The pump drives the cryogenic liquid
from the 1 m3 storage tank through the meter under test (MuT) to the weighing tank. In
order to obtain stable flow conditions at the MuT position (temperature, pressure and
flow rate), the flow is initially circulated from the 1 m3 storage tank through the MuT
back into the storage tank. When the conditions are considered stable, the flow is
diverted to the weighing tank using a set of fast valves. When the weighing tank is
nearly full, the flow is diverted back to the storage tank.
The cryogenic liquid is kept under subcooled conditions to prevent two-phase flows.
This is accomplished by pressurizing the system up to 3 bar(g) to raise the boiling point.
After some time of operation, the liquid temperature will have increased and be in
equilibrium with the elevated pressure. When this happens the liquid is cooled down
again by depressing the system to ambient pressure. Thereafter the cycle starts all over
again.
The totalized flow over the period between the start and stop time stamps is compared
with the weight accumulation in the weighing tank. As vapor is replaced while filling
the weighing tank, the accumulated mass needs to be corrected for this loss in mass.
This mass is measured using a specially designed gas flow meter in the vapor return line.
The uncertainty in the total (corrected) mass is estimated to be better than 0.2% [10].
The deviation is computed with Eq. (1).
Typically, the flow meters are calibrated at different flow rates; namely; 1, 2, 3 and 4
kg/s. At each flow rate, two successive calibrations (batches of roughly 100 kg of LNG)
are performed. The LNG is then pumped back to the main tank by pressure difference
between the weigh tank and the main storage tank. This process is repeated until at
least five reliable measurements of current test flow rate is achieved. This allows
assessment of flow meter repeatability at each test flow rate. The whole process is
repeated for the next test flow rate until all flow rates are competed. The
reproducibility of the whole calibration is then tested by repeating the calibration at a
different day.

Coriolis flow meters – calibration approach for cryogenic applications
October 1, 2013
11
Figure 5-2 Schematic of the Liquid Nitrogen/LNG Flow Calibration Facility at VSL.
Although the principle and measurement procedure are the same for the calibrations
for LIN and LNG, there are two substantial differences between these calibrations. First,
because of a poor pump performance, the pump has been replaced with an improved
model after the LIN calibrations where finished. Second, pressure control for the LNG
calibrations was much more effective than for the LIN calibrations. This is because both
LNG and LIN have been pressurized with Nitrogen. Because of the different boiling
temperatures, the Nitrogen will condense at the LIN interface, however not at the LNG
interface. Because of these two effects, pressure and flow rate stability were much
better for the LNG compared to the LIN calibrations. This may be reflected in a better
reproducibility for the LNG flow meter calibrations.
Finally, there is an important difference to the set-up of VSL compared to set-ups of
NIST (Section 5.3) and JV (Section 5.4) regarding the insulation of the flow meters. In
the VSL facility, the flow meters are additionally insulated by placing them in a so-called
cold-box that is filled with Perlite. The test set-ups of JV and NIST do not make use of
this additional insulation. Therefore, it is anticipated that the ambient heat gain is less
for the VSL calibrations than for the NIST and JV calibrations.
5.3 Liquid Nitrogen Test Facility at NIST
The NIST Liquid Nitrogen Flow Calibration Facility is shown schematically in Figure 5-3.
Liquid nitrogen is circulated throughout the closed loop by a variable-speed centrifugal
pump. The liquid flows through the subcooler, which is a heat exchanger consisting of
a finned tubes submerged in a nitrogen bath. The subcooler removes the thermal
energy added to the system due to pumping and ambient heat leak. The temperature

Coriolis flow meters – calibration approach for cryogenic applications
October 1, 2013
12
of the liquid nitrogen in the flow loop is controlled by adjusting the liquid level and the
vapour pressure in the subcooler tank. Some of the test fluid can be diverted around
the subcooler, if necessary. The fluid then passes through a loop with vacuum-jacketed
piping, through the test section, and into the weigh/catch tank system which constitutes
the reference measurement system.
Figure 5-3 Schematic of the Liquid Nitrogen Flow Calibration Facility at NIST.
The flow system is pressurised with helium to prevent the liquid nitrogen from boiling.
The nitrogen is always subcooled by 10 to 15 K. Helium absorbed in the liquid nitrogen
is claimed not to exceed 0.5 mole percent, according to data by DeVaney, Dalton, and
Meeks [6]. No test points are taken if evidence of bubbles is detected visually through a
sapphire inspection window located downstream of the flow meter being tested.
The overall uncertainty in the measurement of totalized mass is estimated by NIST to be
0.17% (k=2) [7] and [8]. This uncertainty statement applies to the measurements made
within a flow range of 0.95 to 9.5 kg/s which covers the flow range of the test flow
meters described above.
During the tests, the temperature is typically controlled at about 80 K whereas pressure
can be controlled between about 5.6 and 7.4 bar. The flow meter mass and density
errors were calculated using equation 1 above.
Coriolis flow meters – calibration approach for cryogenic applications
October 1, 2013
13
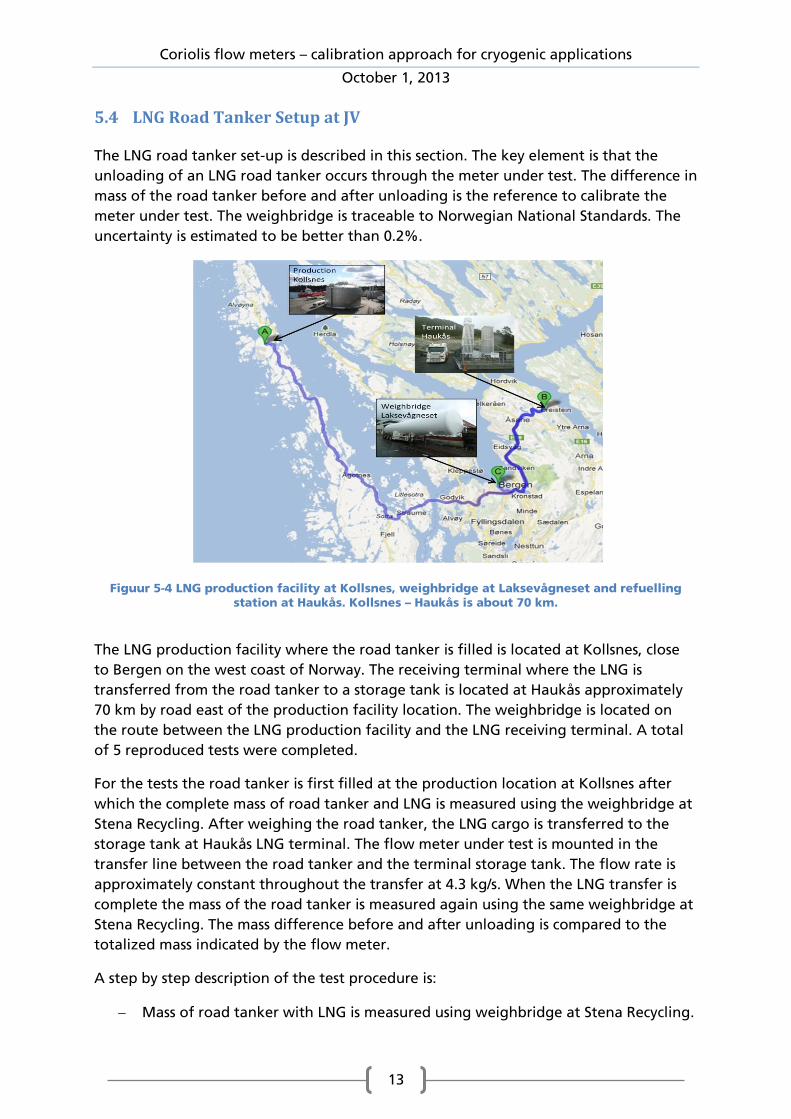
5.4 LNG Road Tanker Setup at JV
The LNG road tanker set-up is described in this section. The key element is that the
unloading of an LNG road tanker occurs through the meter under test. The difference in
mass of the road tanker before and after unloading is the reference to calibrate the
meter under test. The weighbridge is traceable to Norwegian National Standards. The
uncertainty is estimated to be better than 0.2%.
Figuur 5-4 LNG production facility at Kollsnes, weighbridge at Laksevågneset and refuelling station at Haukås. Kollsnes – Haukås is about 70 km.
The LNG production facility where the road tanker is filled is located at Kollsnes, close
to Bergen on the west coast of Norway. The receiving terminal where the LNG is
transferred from the road tanker to a storage tank is located at Haukås approximately
70 km by road east of the production facility location. The weighbridge is located on
the route between the LNG production facility and the LNG receiving terminal. A total
of 5 reproduced tests were completed.
For the tests the road tanker is first filled at the production location at Kollsnes after
which the complete mass of road tanker and LNG is measured using the weighbridge at
Stena Recycling. After weighing the road tanker, the LNG cargo is transferred to the
storage tank at Haukås LNG terminal. The flow meter under test is mounted in the
transfer line between the road tanker and the terminal storage tank. The flow rate is
approximately constant throughout the transfer at 4.3 kg/s. When the LNG transfer is
complete the mass of the road tanker is measured again using the same weighbridge at
Stena Recycling. The mass difference before and after unloading is compared to the
totalized mass indicated by the flow meter.
A step by step description of the test procedure is:
Mass of road tanker with LNG is measured using weighbridge at Stena Recycling.

Coriolis flow meters – calibration approach for cryogenic applications
October 1, 2013
14
LNG is transferred from the road tanker to the storage tank at the Haukås
terminal through meter and the indicated mass from the flow meter is noted.
The empty mass of the road tanker is measured with the weighbridge at Stena
Recycling.
The meter deviation is calculated with Eq. (1).

Coriolis flow meters – calibration approach for cryogenic applications
October 1, 2013
15
6 Results and discussion
In this chapter the results for the water, LIN and LNG calibrations are shown and
discussed. In Sections 6.1 to 6.4 the results for flow meters A to D are shown, whereas in
Section 6.5 these results are further discussed.
6.1 Results for flow meter A
6.1.1 Calibration with water at VSL
Meter A was calibrated in the VSL calibration facility described in Section 5.1. The results
of this calibration test are shown in Figure 6-1. All test data show measurement
accuracy well within the claimed accuracy of the meter and most data fall within
accuracy of ±0.05%.
Figure 6-1 Flow meter A Mass Error, water (VSL).
6.1.2 Calibration with liquid nitrogen at NIST
Flow meter A was also calibrated in the NIST facility described in Section 5.3. Two tests
were performed at two different days to check reproducibility of results. These results
are shown in Figure 6-2. The mean meter deviation falls within the claimed accuracy for
cryogenic application, except for the lowest flow rate. However, note that the meter
under reads for flow rates tested.

Coriolis flow meters – calibration approach for cryogenic applications
October 1, 2013
16
Figure 6-2 Flow meter A Mass Error, liquid Nitrogen (NIST).
6.1.3 Calibration with liquid nitrogen at VSL
Flow meter A was also calibrated for LIN in the VSL facility described in Section 5.2. Tests
were performed at various days to check reproducibility of results. These results are
shown in Figure 6-3.
Figure 6-3 Flow meter A Mass Error, liquid Nitrogen (VSL).

Coriolis flow meters – calibration approach for cryogenic applications
October 1, 2013
17
In contrast to the calibrations performed at NIST, the flow meter does not perform
within its specifications. Further, there is a significant spread in the calibration results.
These two effects could be attributed to either the flow meter or the calibration
standard. As will be discussed in the next section, this flow meter shows a huge
deviation for LNG, indicating a very strong dependency on the temperature. However,
as discussed in Section 5.2, the pressure and flow rate stability is significantly less when
working with LIN than working with LNG. Therefore, the LIN calibration results for flow
meter A are discarded and not discussed further.
6.1.4 Calibration with liquid natural gas at VSL
Flow meter A was also calibrated for LNG in the VSL facility described in Section 5.2. The
tests were performed at various days to check reproducibility of results. These results
are shown in Figure 6-4. The mean meter deviation is much greater that its claimed
accuracy. These results have been discussed with the manufacturer; however there was
no satisfactory explanation found that could cause this significant deviation2. The
calibrations for water for this meter were repeated after the LIN calibrations, however
there was no significant difference found compared to the first calibration with water.
Figure 6-4 Flow meter A Mass Error, liquid natural gas (VSL).
2 Remark, the meter tested was somewhat older than the other meters. However, this should not be an explanation for the large deviation found.

Coriolis flow meters – calibration approach for cryogenic applications
October 1, 2013
18
6.2 Results for flow meter B
6.2.1 Calibration with water (third party)
Meter B was calibrated for water by a third party (no direct traceability to SI standards).
The results of this calibration test are shown in Figure 6-5. All test data show
measurement accuracy well within the claimed accuracy of the meter and most data fall
within accuracy of ±0.05%.
Figure 6-5 Flow meter B Mass Error, water (third party).
6.2.2 Calibration with liquid natural gas at VSL
Flow meter B was also calibrated for LNG in the VSL facility described in Section 5.2.
Tests were performed at various days to check reproducibility of results. These results
are shown in Figure 6-6. These results show that the flow meter measures LNG flow rate
somewhat outside the specified accuracy of ±0.3%, i.e. the maximum deviation is -0.5%.
Further, the flow meter under reads for all flow rates.

Coriolis flow meters – calibration approach for cryogenic applications
October 1, 2013
19
Figure 6-6 Flow meter B Mass Error, liquid natural gas (VSL).
6.3 Results for flow meter C
6.3.1 Calibration with water at JV
Meter C was calibrated in the National Standards Water Flow Measurement Facility at
JV described in section 5.1. The result of this calibration test is shown in Figure 6-7. All
test data show measurement accuracy within the claimed accuracy of the meter (0,1%).
Figure 6-7 Flow meter C Mass Error, Water (JV).

Coriolis flow meters – calibration approach for cryogenic applications
October 1, 2013
20
6.3.2 Calibration with liquid natural gas at JV
Flow meter C was also calibrated for LNG by JV with the road tanker set-up described in
section 5.3. A total of 5 reproduced measurements were carried out. The test results for
a flow rate of approximately 4.3 kg/s are presented in Figure 6-8.
From Figure 6-8 it can be seen that also flow meter B under reads for this flow rate.
However, the deviation of this meter is well within the claimed accuracy specifications
(0.35%). The average error is -0.16% and the reproducibility is 0.06%.
Figure 6-8 Flow meter C Mass Error, liquid natural gas (JV). Flow rate 4.3 kg/s.
6.3.3 Calibration with liquid natural gas at VSL
Finally, flow meter C was also calibrated for LNG by VSL with the set-up described in
Section 5.2. The results for these calibrations are shown in Figure 6-9. Similarly as for the
other LNG calibrations, the flow meter under reads for all flow rates. However, again
the meter (nearly) performs within the claimed accuracy specifications.
Note there is a small discrepancy between the calibrations performed by VSL and JV. For
a flow rate of 4.3 kg/s, JV finds an average deviation of -0.16%, whereas for a flow rate
of 4.0 kg/s, VSL finds an average deviation of -0.37%. However, in [10] it is shown that
these results are actually consistent within the claimed uncertainties of the Dutch and
Norwegian test rigs (both better than 0.2%).

Coriolis flow meters – calibration approach for cryogenic applications
October 1, 2013
21
Figure 6-9 Flow meter C Mass Error, liquid natural gas (VSL).
6.4 Results for flow meter D Flow meter D has been investigated by NEL in a previous project and has been included
in this project. The flow meter was calibrated with water at NEL and liquid nitrogen at
NIST. A successor of this flow meter was made available to VSL during this EMRP project
for calibration with LNG at VSL.
6.4.1 Calibration with water at NEL
Data gathered from the NEL test facility are shown in Figure 6-10 for the deviation of
flow meter D measured totalised mass. The results shown in Figure 6-10 indicate that
the flow meter is performing within its specified accuracy. The mass error varies
between -0.04% and +0.12% for the whole measurement range of 1 to 9 kg/s. This also
shows good measurement repeatability and reproducibility as these tests were
conducted over a few days.
Test results for density are shown in Figure 6-11. The results show that the flow meter
measures the density of water well within its specified accuracy, i.e. the maximum
deviation observed was -0.09%.

Coriolis flow meters – calibration approach for cryogenic applications
October 1, 2013
22
Figure 6-10 Flow meter D Mass Error, water (NEL).
Figure 6-11 Flow meter D Density Error, water (NEL).
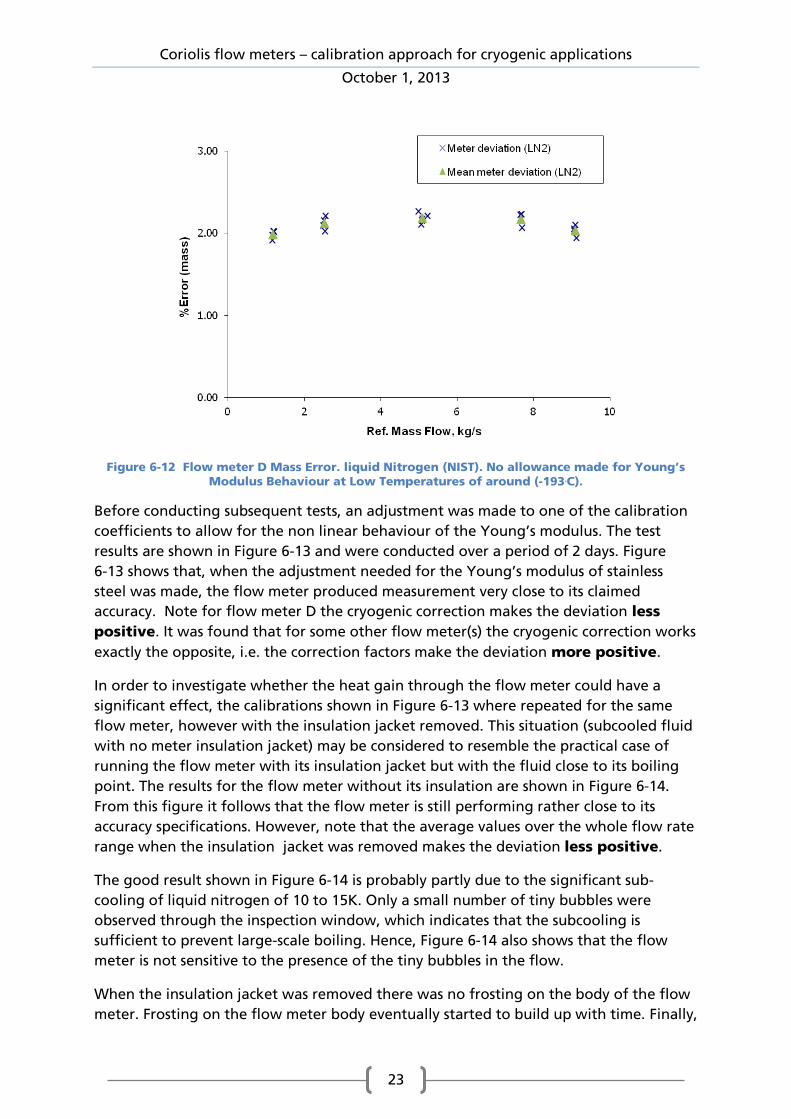
6.4.2 Calibration with liquid nitrogen at NIST
Flow meter D was initially tested in the in the NIST cryogenic test facility with no change
to its configuration parameters or calibration coefficients which were set for the water
testing described above. This means that no adjustment was made to allow for the
temperature dependence of the Young’s modulus of the stainless steel at the very low
temperatures. The test results showed a consistent deviation of about 2% in measured
mass as shown in Figure 6-12. This observation was also reported in reference [2] for a
different meter make.
Coriolis flow meters – calibration approach for cryogenic applications
October 1, 2013
23
Figure 6-12 Flow meter D Mass Error. liquid Nitrogen (NIST). No allowance made for Young’s Modulus Behaviour at Low Temperatures of around (-193oC).
Before conducting subsequent tests, an adjustment was made to one of the calibration
coefficients to allow for the non linear behaviour of the Young’s modulus. The test
results are shown in Figure 6-13 and were conducted over a period of 2 days. Figure
6-13 shows that, when the adjustment needed for the Young’s modulus of stainless
steel was made, the flow meter produced measurement very close to its claimed
accuracy. Note for flow meter D the cryogenic correction makes the deviation less
positive. It was found that for some other flow meter(s) the cryogenic correction works
exactly the opposite, i.e. the correction factors make the deviation more positive.
In order to investigate whether the heat gain through the flow meter could have a
significant effect, the calibrations shown in Figure 6-13 where repeated for the same
flow meter, however with the insulation jacket removed. This situation (subcooled fluid
with no meter insulation jacket) may be considered to resemble the practical case of
running the flow meter with its insulation jacket but with the fluid close to its boiling
point. The results for the flow meter without its insulation are shown in Figure 6-14.
From this figure it follows that the flow meter is still performing rather close to its
accuracy specifications. However, note that the average values over the whole flow rate
range when the insulation jacket was removed makes the deviation less positive.
The good result shown in Figure 6-14 is probably partly due to the significant sub-
cooling of liquid nitrogen of 10 to 15K. Only a small number of tiny bubbles were
observed through the inspection window, which indicates that the subcooling is
sufficient to prevent large-scale boiling. Hence, Figure 6-14 also shows that the flow
meter is not sensitive to the presence of the tiny bubbles in the flow.
When the insulation jacket was removed there was no frosting on the body of the flow
meter. Frosting on the flow meter body eventually started to build up with time. Finally,

Coriolis flow meters – calibration approach for cryogenic applications
October 1, 2013
24
it was found that the flow meter measured temperature was consistently about 3k
lower than the rig measured temperature downstream of the flow meter.
Figure 6-13 Flow meter D mass error, liquid Nitrogen (NIST). Allowance was made for Young’s modulus non linearity at low temperature (-193 C).
Figure 6-14 Flow meter D mass error, liquid Nitrogen (NIST). Allowance was made for Young’s modulus non linearity at low temperature (-193 C). Removed flow meter insulation.
Coriolis flow meters – calibration approach for cryogenic applications
October 1, 2013
25
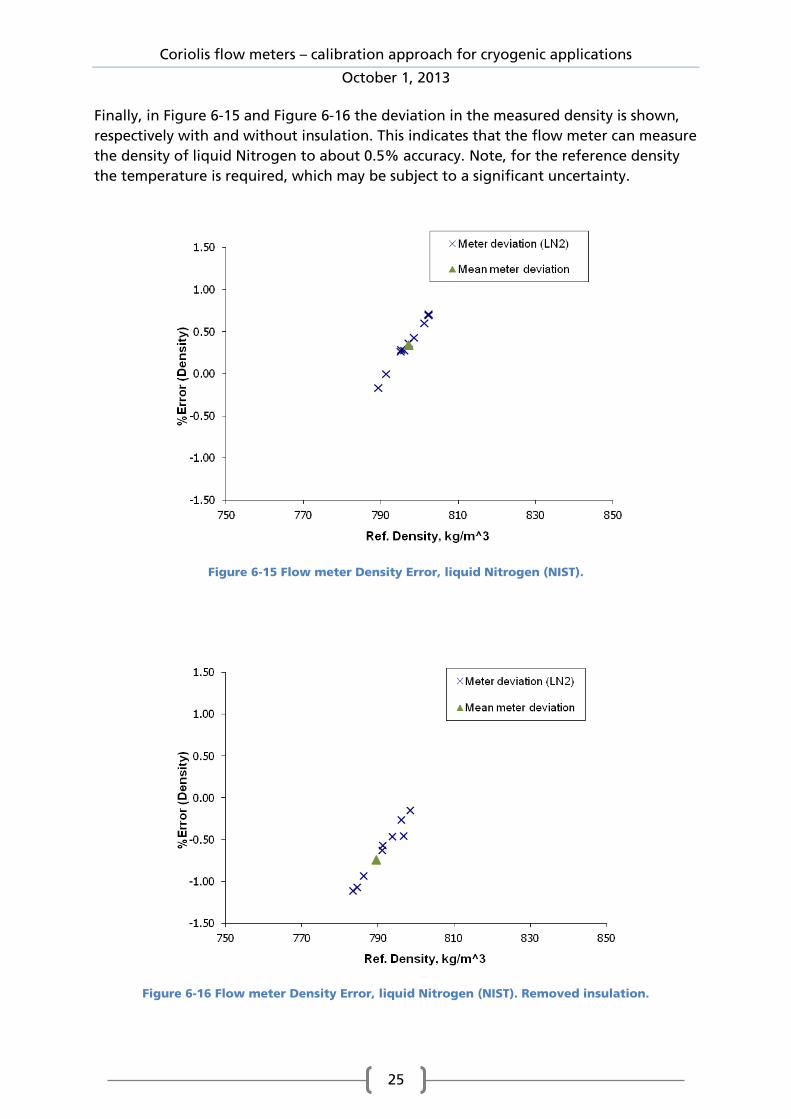
Finally, in Figure 6-15 and Figure 6-16 the deviation in the measured density is shown,
respectively with and without insulation. This indicates that the flow meter can measure
the density of liquid Nitrogen to about 0.5% accuracy. Note, for the reference density
the temperature is required, which may be subject to a significant uncertainty.
Figure 6-15 Flow meter Density Error, liquid Nitrogen (NIST).
Figure 6-16 Flow meter Density Error, liquid Nitrogen (NIST). Removed insulation.
Coriolis flow meters – calibration approach for cryogenic applications
October 1, 2013
26
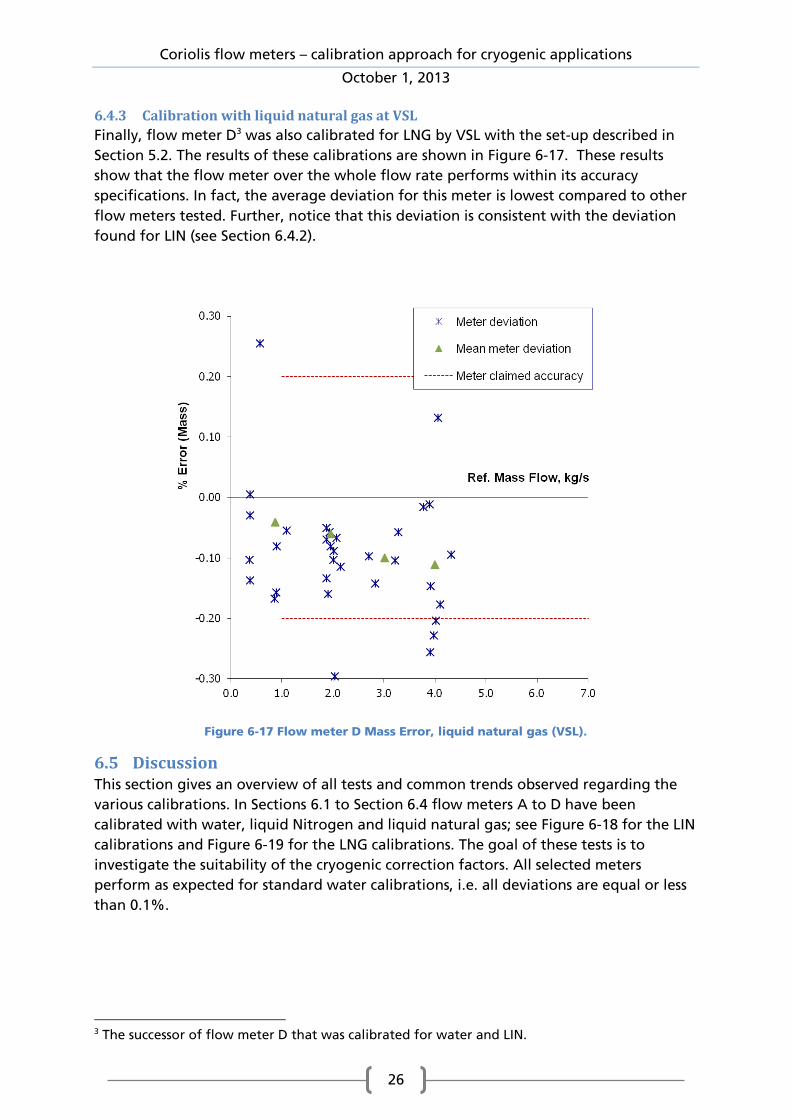
6.4.3 Calibration with liquid natural gas at VSL
Finally, flow meter D3 was also calibrated for LNG by VSL with the set-up described in
Section 5.2. The results of these calibrations are shown in Figure 6-17. These results
show that the flow meter over the whole flow rate performs within its accuracy
specifications. In fact, the average deviation for this meter is lowest compared to other
flow meters tested. Further, notice that this deviation is consistent with the deviation
found for LIN (see Section 6.4.2).
Figure 6-17 Flow meter D Mass Error, liquid natural gas (VSL).
6.5 Discussion This section gives an overview of all tests and common trends observed regarding the
various calibrations. In Sections 6.1 to Section 6.4 flow meters A to D have been
calibrated with water, liquid Nitrogen and liquid natural gas; see Figure 6-18 for the LIN
calibrations and Figure 6-19 for the LNG calibrations. The goal of these tests is to
investigate the suitability of the cryogenic correction factors. All selected meters
perform as expected for standard water calibrations, i.e. all deviations are equal or less
than 0.1%.
3 The successor of flow meter D that was calibrated for water and LIN.

Coriolis flow meters – calibration approach for cryogenic applications
October 1, 2013
27
Figure 6-18 All meter deviations for meters calibrated with liquid Nitrogen.
Figure 6-19 All meter deviations for meters calibrated with liquid natural gas. Deviations for
flow meter A are shown on the right axis.
The results shown in Sections 6.1.2 and 6.4.2 and Figure 6-18 reveal that measurements
of liquid Nitrogen flow can be achieved within the manufactures accuracy claims.
Figure 6-18 show the results obtained for all meters that have been calibrated with LIN
(as discussed the results for meter C are discarded). Although the accuracy claims in
general was met for the meters tested, note that these claims are quite a bit relaxed
compared to accuracy claims for water calibrations; i.e. for water the specified accuracy
Coriolis flow meters – calibration approach for cryogenic applications
October 1, 2013
28
is typically around 0.1%, whereas the specified accuracy for cryogenic calibrations is
typically around 0.3%.
The deviations found for the measurements of liquid natural gas (Sections 6.1.4, 6.2.2,
6.3.3, 6.4.30) are somewhat larger than found for liquid Nitrogen, especially for flow
meter A. In Figure 6-19 the results for all meters calibrated for LNG are shown. The
deviations found for flow meter A and B are outside the accuracy specifications. An
explanation could be that the cryogenic correction models have so far been tuned for
water and liquid Nitrogen. Nevertheless, the cryogenic correction models decrease the
deviation to (almost) acceptable levels. However, note that all flow meter deviations are
negative, i.e. all flow meters under read (without the cryogenic correction factor the
flow meters can under or over read). Because flow meters A to D use different
correction models (different polynomials in temperature), the varying deviation may be
attributed to the various models used.
For flow meter D it was shown that the ambient heat gain plays a significant effect in
the flow meter accuracy (Section 6.4.2). Because all meters are of the Coriolis type, it is
expected that all flow meter readings will be influenced by the ambient heat gain.
Further research would be required to determine the sign and magnitude of the impact
of the ambient heat gain on the flow meter accuracy. This may be especially relevant as
different facilities use different levels of insulation (see Section 5.2).
Finally, the results presented in this report are all for 2” flow meters. It is well-known
that larger Coriolis flow meters can exhibit a different behaviour. Hence, further
research is required to investigate the suitability of the correction models for larger
flow rates.
Coriolis flow meters – calibration approach for cryogenic applications
October 1, 2013
29
7 Summary and conclusions
The Coriolis flow meters under test in this project were calibrated with three fluids;
water at ambient conditions, liquid nitrogen at about -193oC and LNG at about -161oC.
Depending on prevailing circumstances during the project, not all flow meters were
tested with the three fluids, however, each meter was tested with water and one or
both cryogenic fluids. The main objective of the test programme is to assess the
cryogenic correction models that are used in the transfer of a standard factory
calibration with water at ambient conditions to cryogenic conditions
The water testing results show that all flowmeter performed well within their specified
accuracy. The measurements have also shown good measurement repeatability and
reproducibility.
Within certain limits, water calibrations of Coriolis flow meters can be transferred to
cryogenic flow measurements taking into account the non-linear temperature
dependence of the Young’s Modulus. However, even with this correction, the flow
meter deviation remains in the order of 0.2 to 0.5%, which is considerably more than
for water applications (within 0.1%). These results are based on testing 2” flow meters
and in this stage it cannot be assumed that these results apply to larger flowmeters
until larger units are tested in the same way.
Only one flow meter showed a very large deviation for LNG flow measurements, while
the flow measurements for water and LIN where (almost) within the accuracy
specifications.
Ambient heat gain may play a significant role in the flow meter deviation, however
further research is required to determine this effect quantitatively..
Coriolis flow meters – calibration approach for cryogenic applications
October 1, 2013
30
Acknowledgment
The authors would like to thank the manufacturers who contributed to this project by
providing test flow meters and technical input. In this project it was agreed not to
disclose the name of these manufacturers. Furthermore, thanks to Force and NIST for
their support and discussions.
References
[1] ENG03 LNG, Metrology for Liquefied Natural Gas (LNG), EMRP Joint Research
Project Protocol, 2009.
[2] K. Dunphy, “Flow measurement meters compete for LNG business”, LNG journal
March 2006.
[3] R.C. Baker, 2000, “Flow Measurement Handbook”, Cambridge University Press,
Cambridge, UK, Chap. 17.
[4] T. Wang, R.C. Baker and Y. Hussain, “An advanced numerical model for single
straight tube Coriolis flow meters”. Journal of Fluids Engineering – Transactions of the
ASME, 2006. 128 (6): p. 1346-1350.
[5] T. Wang and Y. Hussiain, “Latest research and development of twin-straight tube
Coriolis mass flowmeters”. Sensor Review, 2007. 27 (1): p.43-47.
[6] W.D. DeVaney, B.J. Dalton and J.C. Jr. Meeks, “Vapour-liquid Equilibria of the
Helium-Nitrogen System”, J. Chem. Eng. Data, 8, No. 4, October 1963.
[7] J.L. Scott, M.A. Lewis, “Uncertainty Analysis of the NIST Nitrogen Flow Facility”,
National Institute of Standards and Technology Technical Note 1364; April 1994.
[8] R. Span, E.W. Lemmon, R.T. Jacobsen, W. Wagner and A. Yokozeki, “A Reference
Equation of State for the Thermodynamic Properties of Nitrogen for Temperatures
from 63.151 to 1000 K and Pressures to 2200 MPa”, Journal of Physical and
Chemical Reference Data, Vol. 29, No.6, 2000.
[9] A. Kenbar, Y. Hussiain and T. Wang ,”Calibration of a Coriolis Mass Flowmeter for
LNG at Cryogenic Temperatures”, Production and Upstream Flow Measurement
Workshop, 12-14 February 2008.
[10] Beek, M.P. van der et al, “LNG Flow calibration standards – A dream come true”,
presented at ‘Metrology for LNG conference’, Delft, Netherlands, October 2013.
[11] A.M.A. Kenbar, “UK promotes search for new international standards for LNG flow
measurement”, LNG journal March 2007