Embed Size (px)
Citation preview

Copyright © Profits Run, Inc. Page 1 of 61

Copyright © Profits Run, Inc. Page 2 of 61
DISCLAIMER: Stock, forex, futures, and options trading is not appropriate for everyone. There is a substantial risk of loss associated with trading these markets. Losses can and will occur. No system or methodology has ever been developed that can guarantee profits or ensure freedom from losses. No representation or implication is being made that using the information in this special report will generate profits or ensure freedom from losses. Risks also include, but are not limited to, the potential for changing political and/or economic conditions that may substantially affect the price and/or liquidity of a market. The impact of seasonal and geopolitical events is already factored into market prices. Under certain conditions you may find it impossible to liquidate a position. This can occur, for example, when a market becomes illiquid. The placement of contingent orders by you, such as “stop-loss” or “stop-limit” orders will not necessarily limit or prevent losses because market conditions may make it impossible to execute such orders. In no event should the content of this correspondence be construed as an express or implied promise or guarantee that you will profit or that losses can or will be limited in any manner whatsoever. Past results are no indication of future performance. Information contained in this correspondence is intended for informational purposes only and was obtained from sources believed to be reliable. Information is in no way guaranteed. No guarantee of any kind is implied or possible where projections of future conditions are attempted. Rev #2-20200318
Copyright © by Profits Run, Inc.
All rights reserved. No part of this publication may be reproduced or transmitted in any form or by any means, electronic, or mechanical, including photocopying, recording, or by any information storage and
retrieval system.
Published by:
Profits Run, Inc.
28339 Beck Rd Suite F6
Wixom, MI 48393
www.profitsrun.com

Copyright © Profits Run, Inc. Page 3 of 61
Dear Reader, Everyone knows collecting dividends can be a great way to generate income. Only trouble is the long waiting period between dividend “paydays.” Most companies only pay dividends 4 times a year. Some pay even more infrequently. And certain stocks and funds only pay a dividend once per year! That’s a long time to wait. Luckily, there’s a loophole you can use to start collecting dividends practically every single month of the year! A handful of under-the-radar investments actually pay out MONTHLY income. In this report, you’ll get a deep dive on 12 different investments that provide monthly income. One word of warning before you dive in: Nothing in this report is to be considered investment advice or recommendations. You should do your own research and draw your own conclusions before buying or selling any investment vehicle of any kind. Also, keep in mind the investment yields referenced in this report are accurate at the time of this writing but change frequently. In this report, we’re simply introducing you to a small sample of the type of investments available that pay monthly income. Let’s dive in…

Copyright © Profits Run, Inc. Page 4 of 61
Monthly Income Investment #1: Realty Income Corporation (O)
Brick and mortar retail is dying out, or so you may have been told. The fact is that retail across the US is struggling, but not all retailers and not all retail locations are equal. Some firms and the spots they operate are still successfully delivering results. It stands to reason, then, that the owners of these locations might make for strong investment prospects. Enter Realty Income Corporation (O). With a market capitalization of $26.2 billion, the (largely) commercial REIT may fly under the radar of some investors, but this could be for the better. Upon closer inspection, it comes across as a high-quality prospect worth considering for any investor who is interested in safe, reliable, and robust monthly distributions. A Quality Firm
*Taken from Realty Income Corp. Realty Income is not exactly a cash cow, but its distribution is a respectable 3.5% on an annualized basis. When robust returns are sacrificed, though, safety is the real gain, and Realty Income has illustrated this to be the case. In 23 of the past 24 years, the company has seen growth in positive earnings per share, an impressive feat for a

Copyright © Profits Run, Inc. Page 5 of 61
business that generates 83% of its rental revenue from the dreaded retail industry. The firm has achieved this feat by keeping only high-quality, diverse tenants in its stores and, as of the end of last year, maintaining an occupancy rate of 98.6%. Shareholders have not been blind to this either, pushing the company’s share price up and helping the firm to realize a compound annual total return of 16.5% since 1994. Over that same timeframe, the Equity REIT Index has increased only 10.8% per annum on average.
*Taken from Realty Income Corp.

Copyright © Profits Run, Inc. Page 6 of 61
*Taken from Realty Income Corp. At this time, only 94 of Realty Income’s 6,483 locations are open for lease. Their locations are split between 301 commercial tenants spanning 50 industries in 49 states plus Puerto Rico and the UK. Even among its largest tenants, the firm demonstrates diversity. Its 20 largest occupants make up just 53.3% of its rental revenue, and they are split between 11 different industries. The tenant which Realty Income has the greatest exposure to is Walgreens Boots Alliance (WBA), which last year accounted for only 6.1% of its sales. Meanwhile, 7-Eleven came in second place, representing 4.8% of the REIT’s revenue.
Another great characteristic of the firm is the life of its contracts. According to management, the weighted-average term remaining on its leases is 9.2 years. This duration provides shareholders with a sense of stability and consistency moving forward.

Copyright © Profits Run, Inc. Page 7 of 61
*Source: Profits Run Research As you might expect, strong returns on the investment side must mean robust results on the financial side. Between 2014 and 2019, revenue for the firm grew 59.8%, or 9.8% per annum, from $933.51 million to $1.49 billion, and net income surged 60.5% to $436.50 million. Far more important than either of these metrics, though, was the company’s funds from operations (FFO) and adjusted funds from operations (AFFO). Over the six-year timeframe, FFO per share grew 27.5% from $2.58 to $3.29, while AFFO per share grew 29.2% from $2.57 to $3.32.

Copyright © Profits Run, Inc. Page 8 of 61
*Source: Profits Run Research
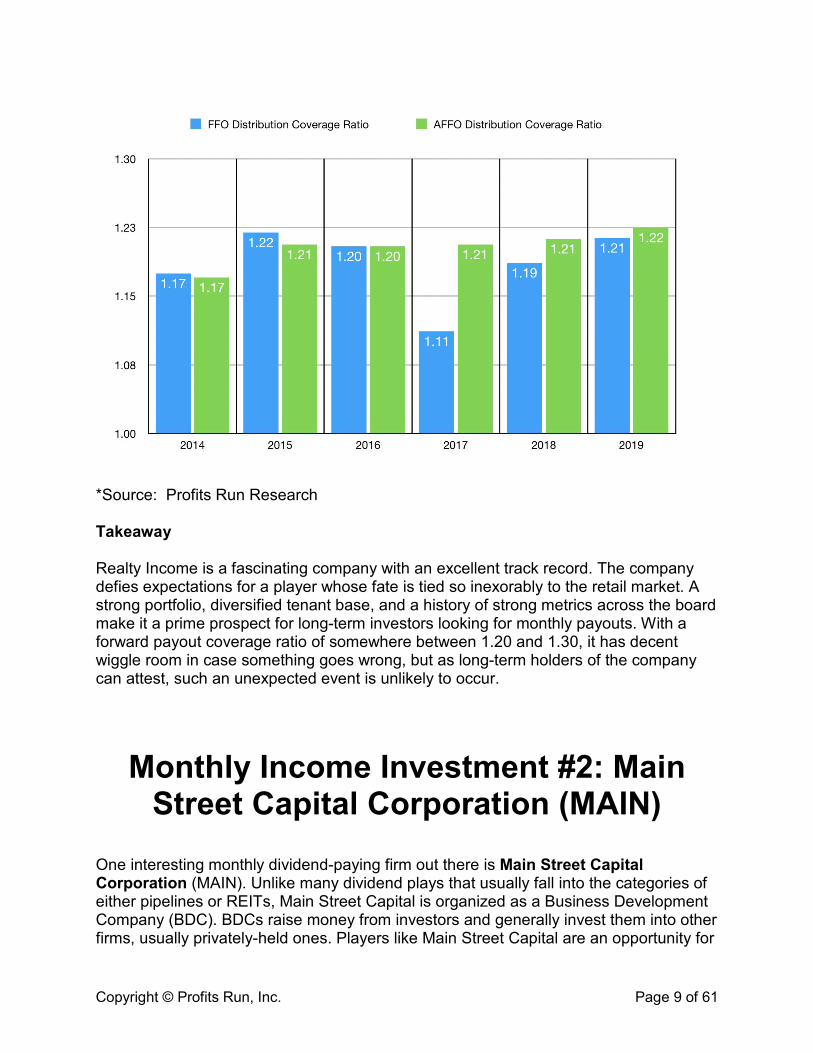
This kind of cash flow growth has been instrumental in allowing the firm to raise its distributions over time. Back in 2014, the company paid out just over $2.19 per share to its investors. Last year, this figure had grown to $2.71. On an annualized basis, its most recently-announced payout works out to $2.79, or $0.2325 per month. More likely than not, though, Realty Income will end up paying more than that this year because management is guiding AFFO to rise to between $3.50 and $3.56 per unit for 2020. This change implies a year-over-year growth rate of between 5.4% and 7.2%. If management elects to keep the same payout ratio (0.82) in 2020 as it did in 2019, investors are looking at around $2.88 per share in payouts, or $0.24 per month, translating to a forward yield of 3.62%.
Copyright © Profits Run, Inc. Page 9 of 61
*Source: Profits Run Research Takeaway Realty Income is a fascinating company with an excellent track record. The company defies expectations for a player whose fate is tied so inexorably to the retail market. A strong portfolio, diversified tenant base, and a history of strong metrics across the board make it a prime prospect for long-term investors looking for monthly payouts. With a forward payout coverage ratio of somewhere between 1.20 and 1.30, it has decent wiggle room in case something goes wrong, but as long-term holders of the company can attest, such an unexpected event is unlikely to occur.
Monthly Income Investment #2: Main Street Capital Corporation (MAIN)
One interesting monthly dividend-paying firm out there is Main Street Capital Corporation (MAIN). Unlike many dividend plays that usually fall into the categories of either pipelines or REITs, Main Street Capital is organized as a Business Development Company (BDC). BDCs raise money from investors and generally invest them into other firms, usually privately-held ones. Players like Main Street Capital are an opportunity for

Copyright © Profits Run, Inc. Page 10 of 61
investors to bet on a large number of companies so small that they usually wouldn’t get the chance to participate in the firms in question outside of arranging individual private deals. An Attractive Firm
*Taken from Main Street Capital Corp. From a macro view, Main Street Capital is a well-diversified player with its hands in several industries. Its greatest exposure is in the Machinery industry, and that only makes up 8% of the entity’s overall portfolio.
The purpose of the investments it makes boils down to a few core categories. About 43% of the capital the firm invests goes on to be used for recapitalizations and refinancing arrangements, and a further 41% goes toward leveraged buyouts and management buyouts.

Copyright © Profits Run, Inc. Page 11 of 61
*Taken from Main Street Capital Corp. Main Street Capital’s business is really divided into three main areas of focus: Lower Middle Marker (LMM), Private Loan, and Middle Market (MM) opportunities. The firm’s LMM operations are its largest, comprising about $1.20 billion (or 47%) of the business’s nearly $2.6 billion in diversified investments. These firms tend to have revenue ranging between $10 million and $150 million, with EBITDA of between $3 million and $20 million. According to management, there are around 175,000 LMM opportunities for it across the US, however the company is judicious with the firms in which it chooses to invest. Currently, it holds a position with 68 individual firms. In 99% of cases the company does receive an equity component, but it also receives generous terms from issuing debt. At present, the weighted average interest rate on its LMM’s debt portfolio stands at 12% per annum. Next in line are Private Loan investments. These are for firms that don’t, for one reason or another, fit in the LMM or MM definitions it has set up. The weighted-average EBITDA of the firms in this space is about $56.3 million. Currently, 62 companies are in this portfolio, comprising $627.9 million, or 25%, of the company’s portfolio. The

Copyright © Profits Run, Inc. Page 12 of 61
average investment size of these firms is about $10.7 million, and the debt components to them carry a weighted-average yield of 9.8%. Finally, we arrive at the largest companies that Main Street Capital invests in: MM firms. These firms have an average EBITDA of about $93.5 million. Investments usually take the form of either first lien, senior secured, and/or floating rate debts. Because these tend to be larger, more stable businesses, Main Street Capital generally has to accept lower returns (between 6% and 10% as a target with a weighted-average rate today of 8.9%) on them. There are an estimated 200,000 prospects for the company to choose from, and at present, only 52 companies are in Main Street Capital’s MM portfolio. In aggregate, these investments make up $548.7 million, or 21%, of the entity’s portfolio. A Strong Track Record No matter how you look at it, Main Street Capital has been successful in establishing an excellent track record. This success is evident not only in terms of growing its assets under management (AUM), but also in growing its Distributable Net Investment Income (DNII) per share. In 2018, the last full year that has been reported, the company’s DNII was $2.76 per share. In the trailing twelve month basis ending in the third quarter last year, its DNII per share was only a bit lower at $2.72.
*Taken from Main Street Capital Corp. By comparison, Main Street Capital’s monthly dividend per share provides a decent margin for the firm. On an annualized basis, the current payout is $2.46 per unit, which comes out to $0.205 each month. For reference, that payout translates to a yield of

Copyright © Profits Run, Inc. Page 13 of 61
5.52% using a share price of $44.55. In addition to the monthly payout, management has regularly been making semi-annual distributions, with the latest being $0.24. Since these payments occur twice per year, this moves Main Street Capital’s distribution to $2.94 per share for a yield of 6.60%.
*Taken from Main Street Capital Corp. Takeaway Main Street Capital is a reliable firm in an interesting space. Very few companies give you the opportunity to benefit from a diversified pool of privately-held firms, and even fewer can offer those types of opportunities with a monthly payout included as part of the deal. Looking solely at its monthly distribution relative to its DNII, the company has some decent wiggle room with a TTM coverage ratio of 1.11. Even accounting for Main Street Capital’s coverage ratio for 2019 coming in a little lower than previously (lowering the yield to 5.52%), the company is still an attractive option for investors seeking a reliable company with monthly dividends.

Copyright © Profits Run, Inc. Page 14 of 61
Monthly Income Investment #3: InfraCap REIT Preferred ETF (PFFR)
Many investors assume that they need to pick one stock that will pay them a monthly distribution. But those who prefer diversification can invest in an Exchange-Traded Fund (ETF). One interesting ETF that warrants special consideration is InfraCap REIT Preferred ETF (PFFR). Instead of investing in common shares like many ETFs do, PFFR mixes things up by investing only in preferred shares of companies that also happen to make monthly distributions to their holders. What’s more, the fund is also interesting in that all of its holdings are REITs. This choice, in theory, should allow it to generate consistent, stable returns, something that monthly-distribution seekers are often pursuing. A Breakdown of PFFR With a niche as focused as PFFR’s, it may sound like there wouldn’t be very many holdings in the fund. After all, you have to check off several boxes, each one narrowing down the field of potential investments considerably. An ETF, check. Pays out monthly, check. Owning preferred securities only, check. And focused entirely on REITs, check. Even with all of these specialized criteria, the company has been able to assemble, as of this writing, 70 different securities that it holds. This number excludes the small percentage of its funds that it currently has allocated in money market accounts and being held in the form of cash and cash equivalents outside of the money market space.

Copyright © Profits Run, Inc. Page 15 of 61
*Taken from PFFR A look at the 10 largest securities does reveal that there is some overlap. For instance, all of the three largest holdings are different preferred units issued by the same company: Annaly Capital Management (NLY). The largest of PFFR’s portfolio are for the Series F Preferred units at 4.17%. These, like the Series G units, pay out a fixed rate to shareholders, 6.95% and 6.50% per annum, respectively, from their $25 per share liquidation preference. Both of these are actually not fixed though, but rather are classified as fixed-to-floating securities. The Series F units pay a fixed distribution up until September 30 of 2022, on and after which they pay at a rate of the three-month LIBOR, plus a spread of 4.993%. Given the current 3-month LIBOR of 1.69%, this translates to an annual payout today of 6.68%. The Series G, meanwhile, will see their 6.50% fixed rate convert to a floating rate on March 31 of 2023. At that time and beyond, the units will pay out at the 3-month LIBOR plus a spread of 4.172% for an annual rate today of 5.86%. Outside of Annaly, which collectively accounts for 9.19% of the ETF’s portfolio value, its holdings are incredibly diversified. Next in line is a series of preferred stock from
Copyright © Profits Run, Inc. Page 16 of 61
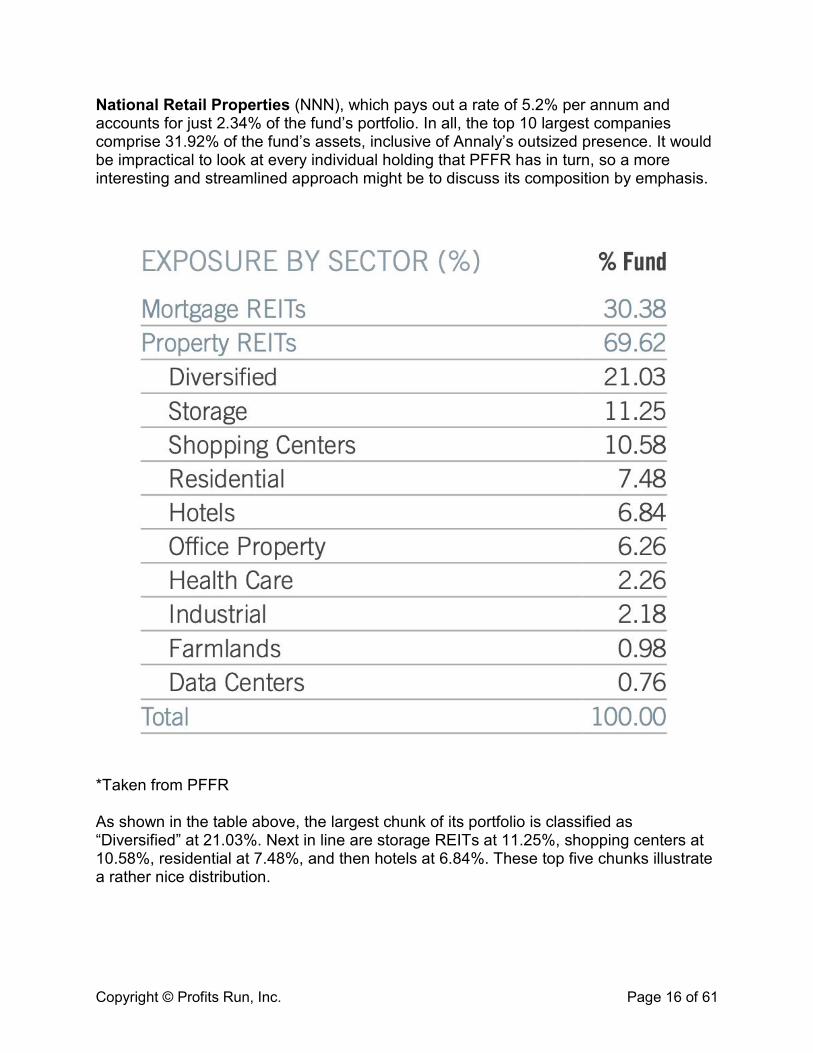
National Retail Properties (NNN), which pays out a rate of 5.2% per annum and accounts for just 2.34% of the fund’s portfolio. In all, the top 10 largest companies comprise 31.92% of the fund’s assets, inclusive of Annaly’s outsized presence. It would be impractical to look at every individual holding that PFFR has in turn, so a more interesting and streamlined approach might be to discuss its composition by emphasis.
*Taken from PFFR As shown in the table above, the largest chunk of its portfolio is classified as “Diversified” at 21.03%. Next in line are storage REITs at 11.25%, shopping centers at 10.58%, residential at 7.48%, and then hotels at 6.84%. These top five chunks illustrate a rather nice distribution.

Copyright © Profits Run, Inc. Page 17 of 61
Another lens to look at the fund through is the type of REIT in question, not as judged by industry focus, but as judged by type of REIT. Doing this, we find that a full 69.62% of PFFR’s portfolio is comprised of property REITs. These are firms that buy, lease, and/or operate various physical assets on another party’s behalf. These types of REITs tend to be more transparent than the alternatives that make up the remainder of the fund’s portfolio: mortgage REITs. Mortgage REITs, as opposed to owning the underlying physical asset, operate by purchasing or originating mortgages and providing similar financing arrangements that utilize the underlying assets as collateral. Takeaway At this time, PFFR makes for a promising prospect. Given the fund’s current price of $24.96, the company provides a yield of 5.77%. It also has a reasonable total expense ratio of only 0.45%. Unlike other ETFs that might own common stock, investors should not expect PFFR’s portfolio to increase or decrease materially. This quality results from preferred units often having both a set liquidation price they trade around and a lack of opportunity for an increase in payout. Although this fact may seem to limit upside potential, it also brings a stability and consistency that wouldn’t come with a common stock ETF and/or with common stocks themselves.
Monthly Income Investment # 4: STAG Industrial (STAG)
There exist many different flavors of REITs on the market these days. One rare but interesting type is the industrial REIT, firms which hold ownership over and operate properties that are heavily involved in ‘industry.’ Examples of these companies include warehouses, manufacturing facilities, and more. One attractive pure-play firm in this space is STAG Industrial (STAG). With a yield of 4.46% and payouts made monthly, STAG is a unique prospect for long-term investors to consider. A Quality Firm STAG is a high-quality player in the industrial REIT space. As of the end of last year, the business owned 91.4 million square feet spread across 450 buildings. It has a physical presence in 38 states, and while the industrial space is not considered particularly attractive these days, the firm boasts a 95% occupancy rate across its assets. Over the past few years, the business has been able to prove that robust growth is possible in a slow-growth market. As an example of this, we need only look at the graph below.

Copyright © Profits Run, Inc. Page 18 of 61
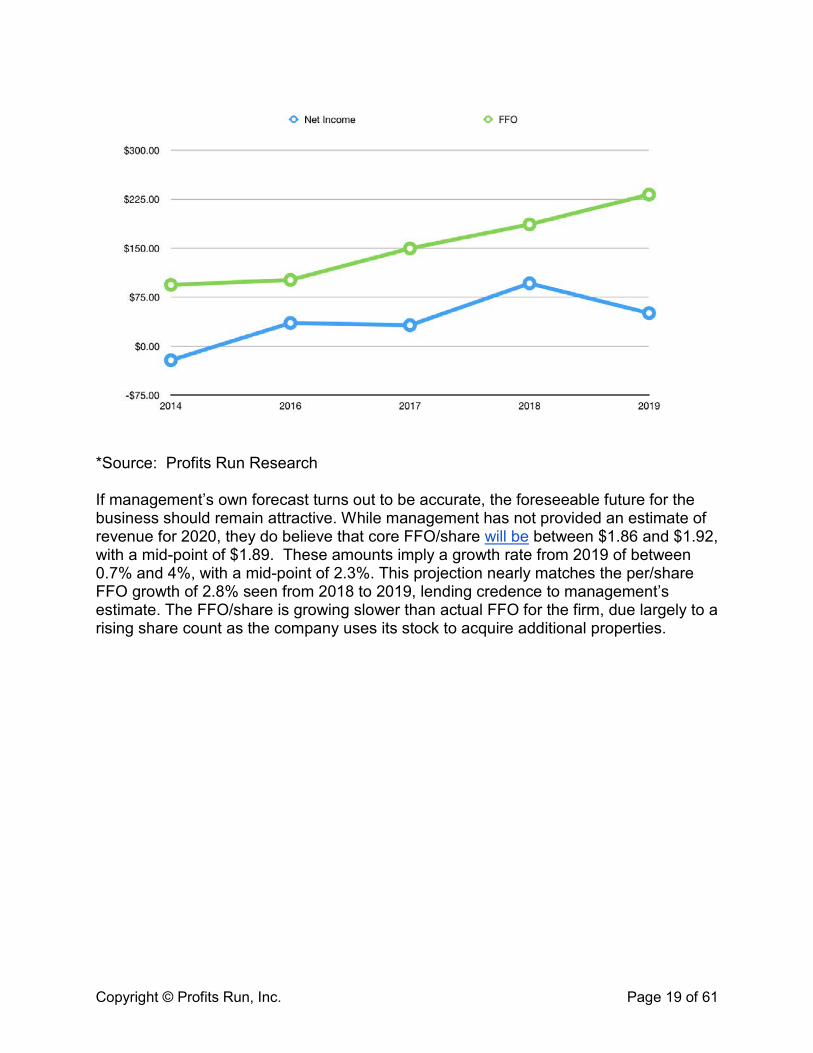
*Source: Profits Run Research As shown, revenue for STAG has risen steadily in recent years. Back in 2015, it stood at $218.63 million. By 2019, it totaled $405.95 million. STAG has shown an annual growth rate of 16.7%, with the rate between 2018 and 2019 coming in strong at 15.7%. In the graph below, it is apparent that net income has been incredibly volatile for the firm, but what really matters is funds from operations (FFO). This metric has done really well over the five-year period covered, growing from $93.95 million to $232.14 million and translating to an annual growth rate of 25.4%.
Copyright © Profits Run, Inc. Page 19 of 61
*Source: Profits Run Research If management’s own forecast turns out to be accurate, the foreseeable future for the business should remain attractive. While management has not provided an estimate of revenue for 2020, they do believe that core FFO/share will be between $1.86 and $1.92, with a mid-point of $1.89. These amounts imply a growth rate from 2019 of between 0.7% and 4%, with a mid-point of 2.3%. This projection nearly matches the per/share FFO growth of 2.8% seen from 2018 to 2019, lending credence to management’s estimate. The FFO/share is growing slower than actual FFO for the firm, due largely to a rising share count as the company uses its stock to acquire additional properties.

Copyright © Profits Run, Inc. Page 20 of 61
*Taken from STAG Industrial For 2020, the firm expects to make some rather large moves. As of mid-February, the company has purchased 7 buildings, representing 1.4 million square feet, for a sum of $103.3 million. It has a further 117 buildings, amounting to 27.3 million square feet, that are worth $2.1 billion in its pipeline for consideration, though this does not guarantee that all of these assets will be acquired. Management currently expects to allocate between $800 million and $1 billion toward acquisitions, with $75 million to $125 million being designed as value-add volume. To help pay for this, it’s planning $150 million to $250 million worth of divestitures. To put this all in perspective, acquisitions in 2018 totaled $1.204 billion, representing 15.98 million square feet across 69 properties. If there is one bad thing about its portfolio, it’s that the weighted-average lease term on its contracts in place is about 5.2 years. That’s about par for the course by industry standards, but it’s lower than most investors would love to see. A Healthy Distribution As of this writing, the distribution paid out by STAG looks quite healthy. On an annualized basis, its current payout comes out to $1.44 per share. By the end of 2020, it will likely be a couple of cents higher, but either way it represents an improvement over the $1.43 seen last year. As with any high-distribution firm, one big question investors should ask is whether or not it can be sustained. Given its history, especially when taken into context with prior figures, STAG looks likely to continue providing this distribution to its common holders.
Copyright © Profits Run, Inc. Page 21 of 61
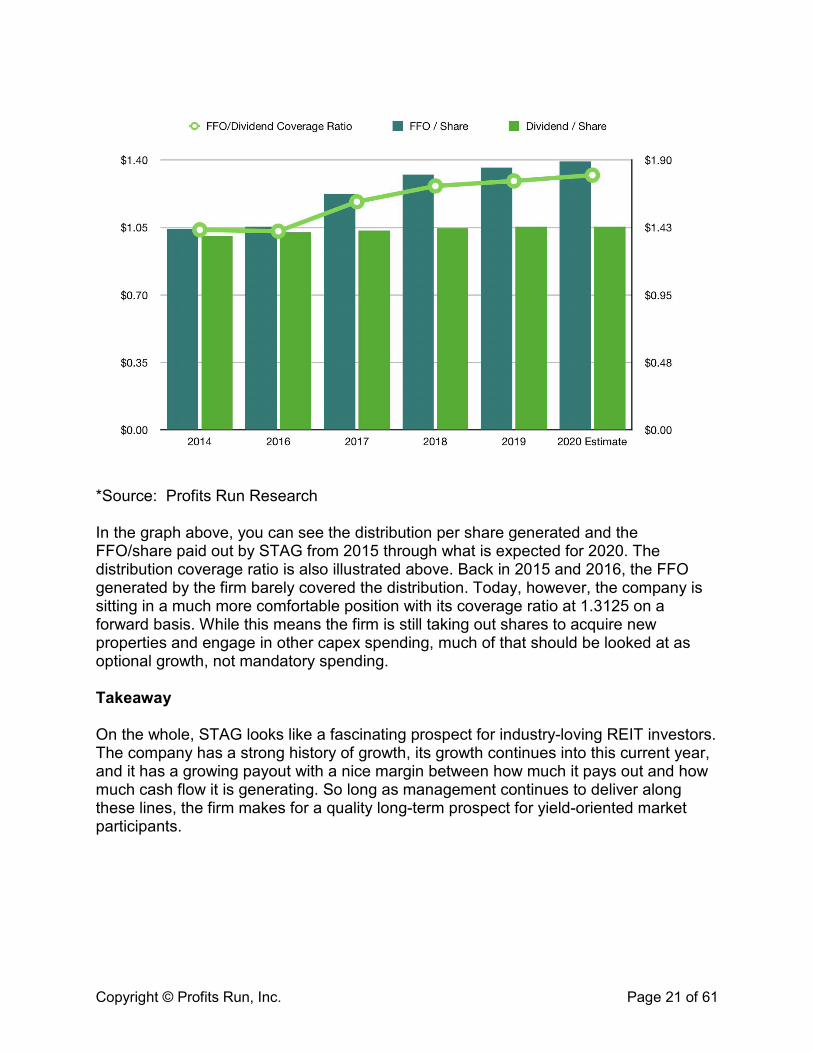
*Source: Profits Run Research In the graph above, you can see the distribution per share generated and the FFO/share paid out by STAG from 2015 through what is expected for 2020. The distribution coverage ratio is also illustrated above. Back in 2015 and 2016, the FFO generated by the firm barely covered the distribution. Today, however, the company is sitting in a much more comfortable position with its coverage ratio at 1.3125 on a forward basis. While this means the firm is still taking out shares to acquire new properties and engage in other capex spending, much of that should be looked at as optional growth, not mandatory spending. Takeaway On the whole, STAG looks like a fascinating prospect for industry-loving REIT investors. The company has a strong history of growth, its growth continues into this current year, and it has a growing payout with a nice margin between how much it pays out and how much cash flow it is generating. So long as management continues to deliver along these lines, the firm makes for a quality long-term prospect for yield-oriented market participants.

Copyright © Profits Run, Inc. Page 22 of 61
Monthly Income Investment #5: Global X SuperIncome Preferred ETF (SPFF)
There are many different types of ETFs on the market today, including those that pay distributions monthly. Many of these ETFs utilize preferred units issued by publicly-traded firms. You might expect for the funds here to be mostly tied to REITs, BDCs, or pipeline operators, but that’s not always true. Case-in-point: Global X SuperIncome Preferred ETF (SPFF). This unique ETF provides comfortable cash flows, with a current yield of 6.04%, to its investors on a monthly basis, but as opposed to many other players out there, its fortunes are tied to the financial sector more than anything else. For investors who want that kind of diversification in their portfolio, this may be an excellent pick for inclusion. A Specialty Play SPFF is, by all accounts, a specialty play. According to its management, the fund invests in only the 50 highest-yielding preferred securities between the US and Canada. However, it’s worth noting that 50 is the upper limit it has set for itself, and currently the fund boasts just 46 holdings. Naturally, investors can expect some concentration, not only in the industries in which it exposes its holders, but also in the individual companies in which it’s invested.
*Source: SPFF To see this concentration, we need only consider the fund’s top 10 holdings, which combined make up 38.56% of the fund’s portfolio. The largest of these is GMAC Capital Trust (ALLY’A) at 5.47% of the fund’s makeup. In second place lies HSBC Holdings Inc. (HSBC’A) at 5.29%. SPFF’s top 5 holdings make up 23.15% of the fund’s total assets, averaging out to about 4.63% of the portfolio’s weight by holding.

Copyright © Profits Run, Inc. Page 23 of 61
*Courtesy of SPFF SPFF differs materially from a lot of other monthly dividend paying ETFs in terms of focus. As the image above illustrates, an impressive 71.94% of the portfolio’s holdings, as measured by assets under management, fall under the category of Financials. By comparison, Utilities come in second place with a paltry 7.54% of the fund’s portfolio. Energy comes in third place at 6.89%, while Real Estate rounds out fourth place with 6.36%. Clearly, SPFF is a fund designed for fans of the finance space. A lot of preferred investments on the market tend to be fixed in nature, meaning their distributions are tied to a fixed amount every quarter or month (in this case month). Even if the common units these preferred units are superior to see their distributions increased, the preferred units rarely, if ever, see a change. The fund assembled here, though, is a different animal entirely.

Copyright © Profits Run, Inc. Page 24 of 61
*Courtesy of SPFF As shown above, 50.16% of SPFF’s assets are allocated toward fixed preferred investments. The remainder, a hefty 49.84%, is allocated toward fixed-to-floating securities, which are preferred units that either currently pay or will pay a distribution pegged at some fixed rate of issue price or liquidation value, but that won’t do so forever. At some point, likely spread over time, these securities will shift to pay out a rate that’s partially pegged to something else (likely LIBOR). This status gives investors both the benefit and the disadvantage that comes along with having a variable rate investment. Takeaway SPFF is a solid prospect for monthly dividend seekers. The yield at this time is appealing and the emphasis on high-yielding, mostly financial opportunities is great for the right kind of investor. The highly-concentrated nature of the ETF may scare some market participants off, but where that might be considered a downside, the preferred nature of the holdings should help to offset this concern.
Monthly Income Investment #6: Pembina Pipeline Corporation (PBA)
Copyright © Profits Run, Inc. Page 25 of 61
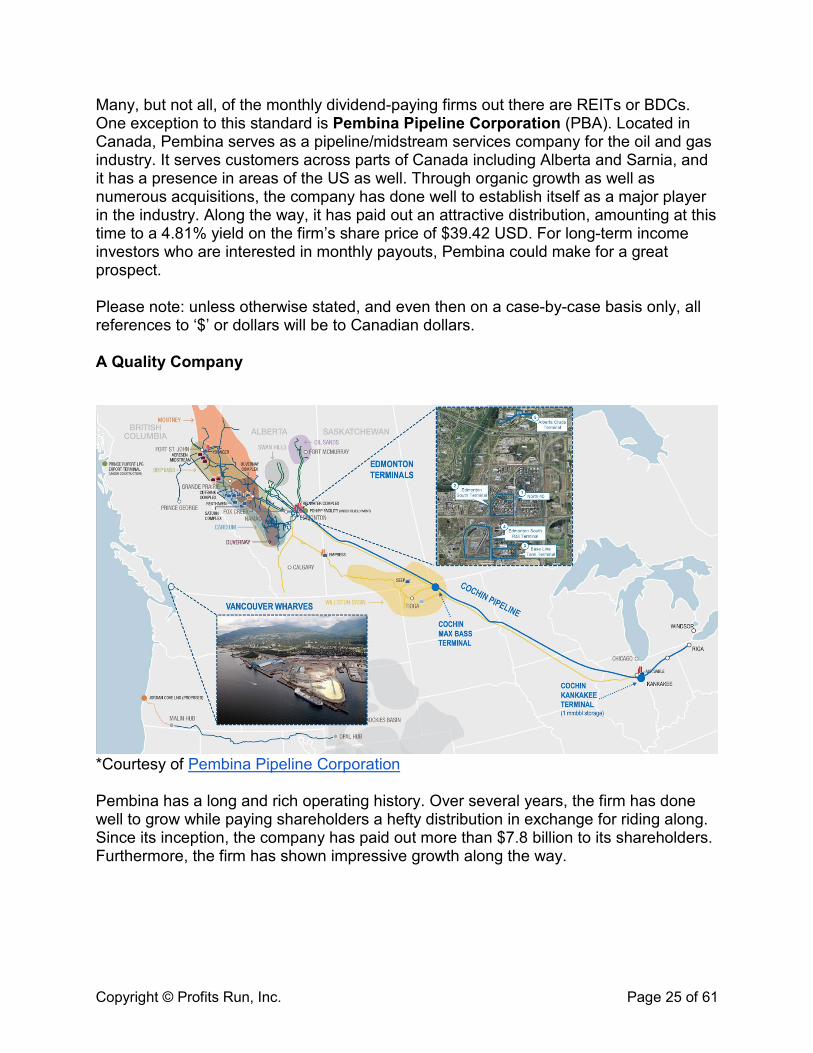
Many, but not all, of the monthly dividend-paying firms out there are REITs or BDCs. One exception to this standard is Pembina Pipeline Corporation (PBA). Located in Canada, Pembina serves as a pipeline/midstream services company for the oil and gas industry. It serves customers across parts of Canada including Alberta and Sarnia, and it has a presence in areas of the US as well. Through organic growth as well as numerous acquisitions, the company has done well to establish itself as a major player in the industry. Along the way, it has paid out an attractive distribution, amounting at this time to a 4.81% yield on the firm’s share price of $39.42 USD. For long-term income investors who are interested in monthly payouts, Pembina could make for a great prospect. Please note: unless otherwise stated, and even then on a case-by-case basis only, all references to ‘$’ or dollars will be to Canadian dollars. A Quality Company
*Courtesy of Pembina Pipeline Corporation Pembina has a long and rich operating history. Over several years, the firm has done well to grow while paying shareholders a hefty distribution in exchange for riding along. Since its inception, the company has paid out more than $7.8 billion to its shareholders. Furthermore, the firm has shown impressive growth along the way.

Copyright © Profits Run, Inc. Page 26 of 61
*Courtesy of Pembina Pipeline Corporation In 1997, the company’s pipeline capacity was around 555 thousand barrels of oil equivalent (boe) per day. Today, it stands at 3.2 million boe per day. Its processing capacity over the past several years has also grown, rising from 0.318 billion cubic feet equivalent (cfe) in 2009 to 6.1 billion cfe per day now. Additionally, Pembina’s condensate stabilization capacity, NGL fractionation capacity, and overall hydrocarbon storage capacity have all seen demonstrable growth over the past decade.
*Courtesy of Pembina Pipeline Corporation
Copyright © Profits Run, Inc. Page 27 of 61
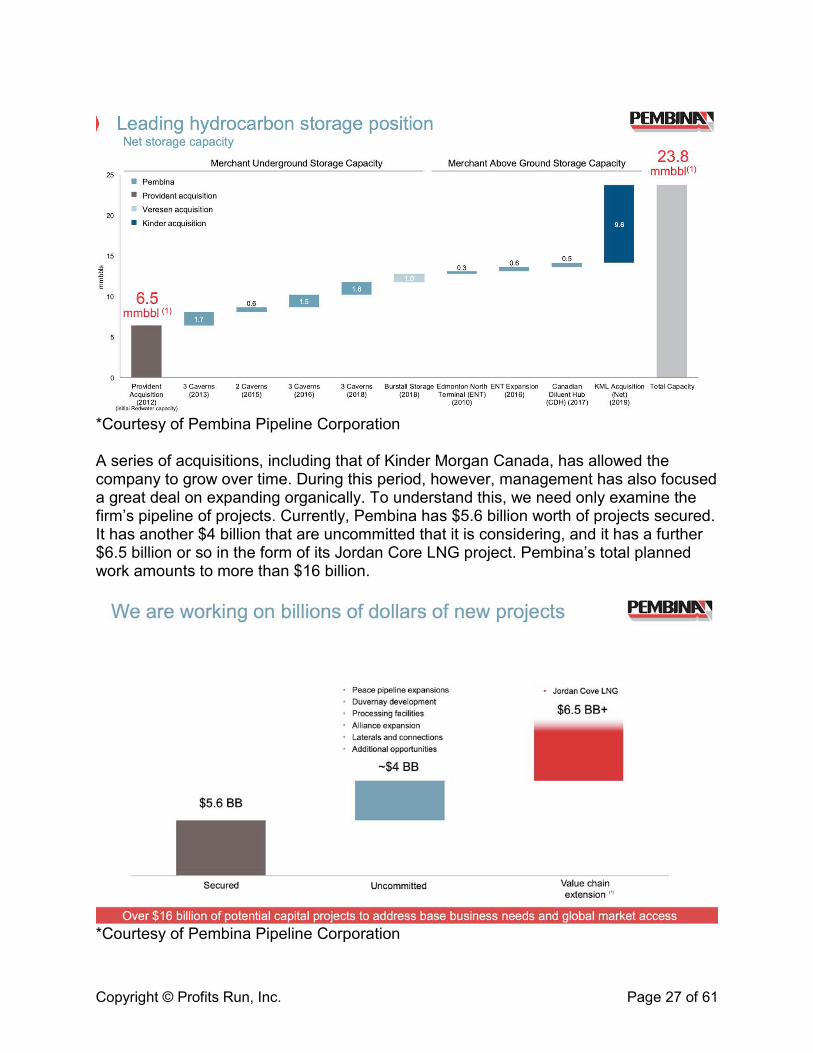
*Courtesy of Pembina Pipeline Corporation A series of acquisitions, including that of Kinder Morgan Canada, has allowed the company to grow over time. During this period, however, management has also focused a great deal on expanding organically. To understand this, we need only examine the firm’s pipeline of projects. Currently, Pembina has $5.6 billion worth of projects secured. It has another $4 billion that are uncommitted that it is considering, and it has a further $6.5 billion or so in the form of its Jordan Core LNG project. Pembina’s total planned work amounts to more than $16 billion.
*Courtesy of Pembina Pipeline Corporation

Copyright © Profits Run, Inc. Page 28 of 61
To understand just how important any one project can be, we should take a look at Pembina’s CKPC PDH/PP Facility. This project involves the construction of an integrated propane dehydrogenation plant and polypropylene upgrading facility capable of handling 550 thousand metric tons of product every year. This facility is the largest of its secured projects, with total gross financing needs of $4.9 billion, but with the company’s commitment totaling only $2.7 billion on a net basis. Once the project comes online in the second half of 2023, management believes that the net EBITDA from it will range between $275 million and $350 million per year. The pipeline/midstream services space can be rather volatile at times, but one thing most players have done to mitigate this is to mandate certain arrangements with industry partners. Pembina, for instance, has arranged for 64% of its EBITDA to be produced by take-or-pay / cost-of-service contracts. A further 22% comes from fee-for service arrangements. Taken together, this means that 86% of the company’s EBITDA is generated by safe, secure cash flows that are easy to plan for and reliable.
*Courtesy of Pembina Pipeline Corporation Room for Distribution Increases
Copyright © Profits Run, Inc. Page 29 of 61
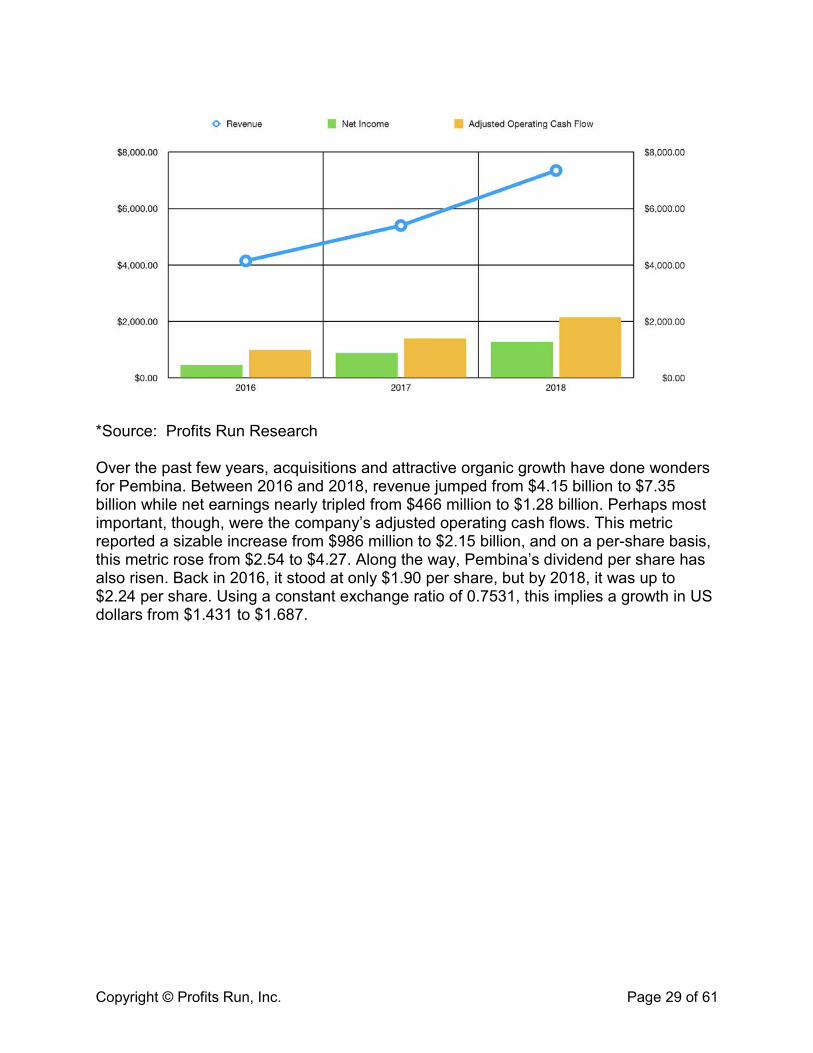
*Source: Profits Run Research Over the past few years, acquisitions and attractive organic growth have done wonders for Pembina. Between 2016 and 2018, revenue jumped from $4.15 billion to $7.35 billion while net earnings nearly tripled from $466 million to $1.28 billion. Perhaps most important, though, were the company’s adjusted operating cash flows. This metric reported a sizable increase from $986 million to $2.15 billion, and on a per-share basis, this metric rose from $2.54 to $4.27. Along the way, Pembina’s dividend per share has also risen. Back in 2016, it stood at only $1.90 per share, but by 2018, it was up to $2.24 per share. Using a constant exchange ratio of 0.7531, this implies a growth in US dollars from $1.431 to $1.687.

Copyright © Profits Run, Inc. Page 30 of 61
*Source: Profits Run Research Full 2019 results are not out yet, but the year is looking up all the same. According to management, revenue is currently down through the third quarter by 2.6%, but net income has risen from $910 million to $1.35 billion. This increase has brought earnings per share up from $1.61 to $2.44. Adjusted operating cash flows over this timeframe have grown from $1.61 billion to $1.66 billion, or from $3.20 per share to $3.25 per share. With the dividend growing over this timeframe from $1.67 per share each nine months to $1.76, the coverage ratio is still robust at 1.85.

Copyright © Profits Run, Inc. Page 31 of 61
*Source: Profits Run Research Takeaway Pembina has proven itself over the past few years to be an attractive monthly dividend-paying firm. Currently, the company’s payout to shareholders in the US (excluding a possible withholding tax owed in Canada) comes out to $0.1582 per month, or $1.898 for the year, which translates to a yield of 4.81%. With the firm’s coverage ratio so high, it could elect to boost this payout some if management so desired, but with a large number of projects lined up, the firm is better off raising its payout gradually over time.
Monthly Income Investment #7: VanEck Vectors J.P.Morgan EM Local Currency
Bond ETF (EMLC)

Copyright © Profits Run, Inc. Page 32 of 61
There are several securities investors can hop into with the expectation of receiving monthly distributions, such as REITs, BDCs, pipelines, as well as security types like common shares, preferred shares, and even ETFs. One other valuable example, though, can be seen by analyzing VanEck Vectors J.P.Morgan EM Local Currency Bond ETF (EMLC). Though technically an ETF, it’s not like other ETFs we have previously examined. Instead of owning some class of shares in companies, EMLC buys into and holds bonds. Though this may not sound like a strong prospect, the ETF pays out a hefty distribution that equates to a yield of 6.13% at current pricing. An Interesting Alternative EMLC is an interesting alternative for investors who want to spice up their portfolio by buying into bonds. The company targets a specific kind of bond: those issued by emerging market governments. These same economies, because of their emerging market status, often carry higher payouts than a developed economy would. Another important note is that the bonds are not denominated in US dollars. Instead, they are denominated in the foreign currencies of the countries that issue them. This characteristic does create some degree of risk that could come back to bite investors in the event of, say, a national devaluation.
*Courtesy of EMLC

Copyright © Profits Run, Inc. Page 33 of 61
A full 95.3% of EMLC’s value is held in emerging market bonds. The next largest chunk is held in cash and cash equivalents. It is interesting to note that the portfolio is fairly diverse when it comes to individual bond issuances. Overall, there are 297 holdings in the portfolio as of this writing. Based on the data provided, the top 10 issues account for 14.19% of the portfolio’s value, with the largest of these labeled as Brazil Notas Do Tesouro Nacional Series. This particular debt security carries a 10% coupon and accounts for just 1.83% of the fund’s assets. Some other notes have coupons as low as 0%, with many of them ranging between 6.25% and 10%. The weighted-average maturity of the bonds is 7.63 years at this time.
c
*Courtesy of EMLC While EMLC is diverse in terms of the number of securities it holds, it is concentrated when looked at by country. Securities issued by Brazil account for 9.61% of the portfolio’s assets under management (AUM), making it the country to which EMLC has

Copyright © Profits Run, Inc. Page 34 of 61
the greatest exposure. Next in line is Indonesia at 9.35%, followed by Mexico at 9.09%. In all, the top 10 countries combined account for 72.57% of the company’s AUM.
*Courtesy of EMLC While EMLC’s portfolio pays out distributions monthly, the distributions can vary according to the ETF. The latest monthly payout was $0.1672 per unit, coming out to $2.0064 per unit each year. Given the ETF’s current price of $32.71 per unit, this results in a yield of 6.13% per annum. The 30-day SEC yield is listed as 4.81%, which is somewhat lower, but the distribution paid out is still attractive nonetheless. Part of this disparity is caused by the expense ratio of the ETF. The gross expense ratio is listed at 0.41%, while the net expense ratio is just 0.3%.

Copyright © Profits Run, Inc. Page 35 of 61
*Courtesy of EMLC
*Courtesy of EMLC Takeaway

Copyright © Profits Run, Inc. Page 36 of 61
EMLC is an interesting ETF for investors who favor monthly distributions but who don’t mind jumping into a diversified pool of bonds to get them, and the yield is appealing as well. The emphasis on the top 10 countries is particularly important in evaluating the ETF’s risk. Emerging nations do carry individual risks of their own and the fact that the bonds in question are denoted in the currencies of the countries that issued them increases that risk. Even so, for the right kind of investor, EMLC is a prospect worth considering.
Monthly Income Investment #8: LTC Properties (LTC)
One interesting niche in the REIT space is healthcare, in particular, those that focus on medical and related properties. These include SNFs (Skilled Nursing Facilities), ALFs (Assisted Living Facilities), ILFs (Independent Living Facilities), MCCs (Memory Care Communities), and combinations thereof. One company whose fortunes are directly tied to this space is LTC Properties (LTC). With a current yield of 4.56%, it’s not the highest paying REIT, but its stability is a balancing factor that makes it an interesting prospect for investors to consider. A Focused, Stable Business LTC Properties is a REIT of incredible focus as it operates solely in the healthcare space. As of the end of its 2019 fiscal year, the company generated $69.09 million of its rental income and $30 million of its interest income from the 92 SNFs it operates. The interest income specifically came from mortgage loans it had on its books over the year (excluding mortgage loans that came due during the year). Another 106 properties make up the company’s ALF operations and, in 2019, accounted for $68.64 million of the company’s revenue. In all, these two sets of operations account for the overwhelming majority of sales and add up to 198 properties. The firm also has one other property operating at this time, as well as two under development, and three parcels of land it hopes to build on in the foreseeable future.

Copyright © Profits Run, Inc. Page 37 of 61
*Courtesy of LTC Properties According to management, many of these properties have come to it as a result of sale-leaseback transactions. It also operates by providing mortgage financing, structured financing arrangements, preferred equity investments, and mezzanine finance solutions for clients. Overall, the firm considers itself to be fairly diversified in this space. It works with 30 operators spread across 28 US states. Even so, its investments are still rather concentrated within just a few states. At this time, 16.4% of its investments have occurred within Texas and 15.9% occurred within Michigan. The data looks even more interesting when examining the metropolitan statistical areas (MSAs). Half of its portfolio resides in the 31 largest MSAs in the US, and 69.2% resides in the top 100 MSAs nationwide.
*Courtesy of LTC Properties Steady Cash Flows
Copyright © Profits Run, Inc. Page 38 of 61
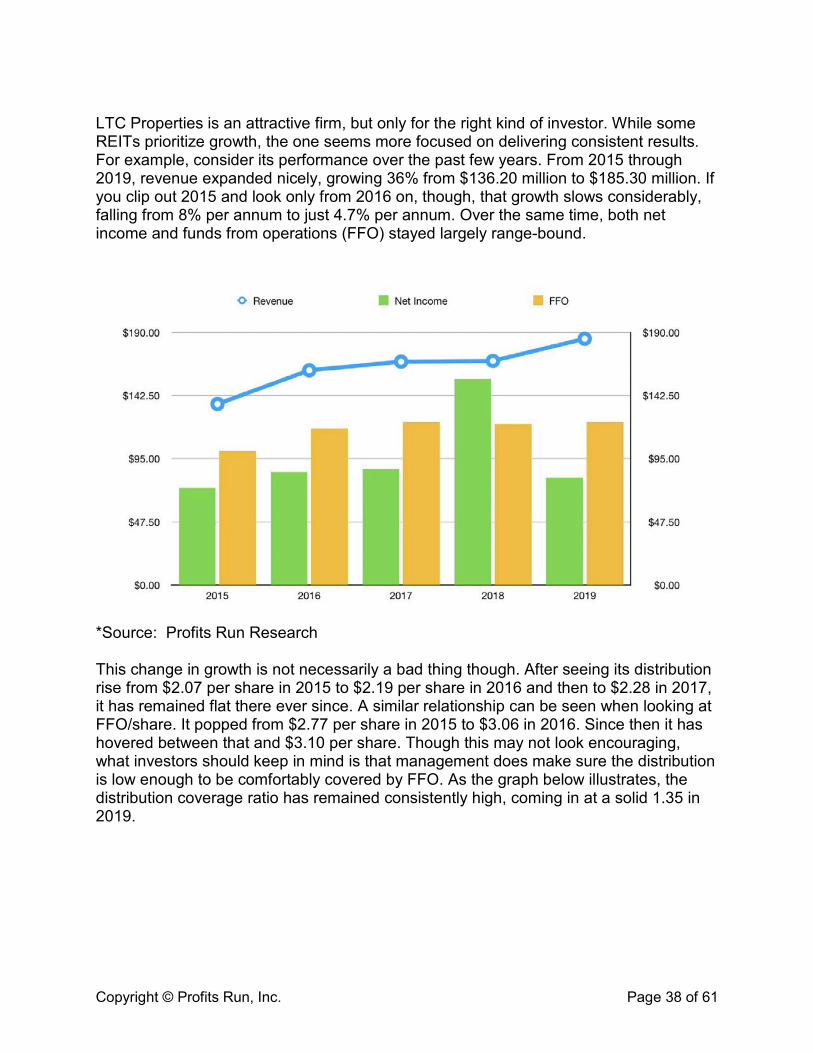
LTC Properties is an attractive firm, but only for the right kind of investor. While some REITs prioritize growth, the one seems more focused on delivering consistent results. For example, consider its performance over the past few years. From 2015 through 2019, revenue expanded nicely, growing 36% from $136.20 million to $185.30 million. If you clip out 2015 and look only from 2016 on, though, that growth slows considerably, falling from 8% per annum to just 4.7% per annum. Over the same time, both net income and funds from operations (FFO) stayed largely range-bound.
*Source: Profits Run Research This change in growth is not necessarily a bad thing though. After seeing its distribution rise from $2.07 per share in 2015 to $2.19 per share in 2016 and then to $2.28 in 2017, it has remained flat there ever since. A similar relationship can be seen when looking at FFO/share. It popped from $2.77 per share in 2015 to $3.06 in 2016. Since then it has hovered between that and $3.10 per share. Though this may not look encouraging, what investors should keep in mind is that management does make sure the distribution is low enough to be comfortably covered by FFO. As the graph below illustrates, the distribution coverage ratio has remained consistently high, coming in at a solid 1.35 in 2019.

Copyright © Profits Run, Inc. Page 39 of 61
*Source: Profits Run Research Takeaway LTC Properties is a stable player in an interesting niche of the REIT space. The company has done well to maintain cash flows and distributions in recent years, and investors buying into it should do so because of the firm’s stability. The goal with this one is not to see it as a strong growth play. With its current 4.56% yield, the company can be a nice place to store capital and collect a decent payout while waiting for other opportunities to arise.
Monthly Income Investment #9: Gladstone Commercial Corporation
(GOOD)
REITs are incredibly diverse entities. Some focus on residential opportunities, others on healthcare facilities, others still on every kind of niche area imaginable. For investors, this is excellent because it gives them the opportunity to be diverse in their holdings and flexible in how and what they invest in. One interesting prospect in this market to consider is Gladstone Commercial Corporation (GOOD). This REIT, unlike many of the other ones out there, doesn’t have one single core area that it focuses on. Instead, the entity invests in and manages properties that fit into two main areas: office space and industrial facilities. While this focus may be attractive to a certain type of investor,
Copyright © Profits Run, Inc. Page 40 of 61
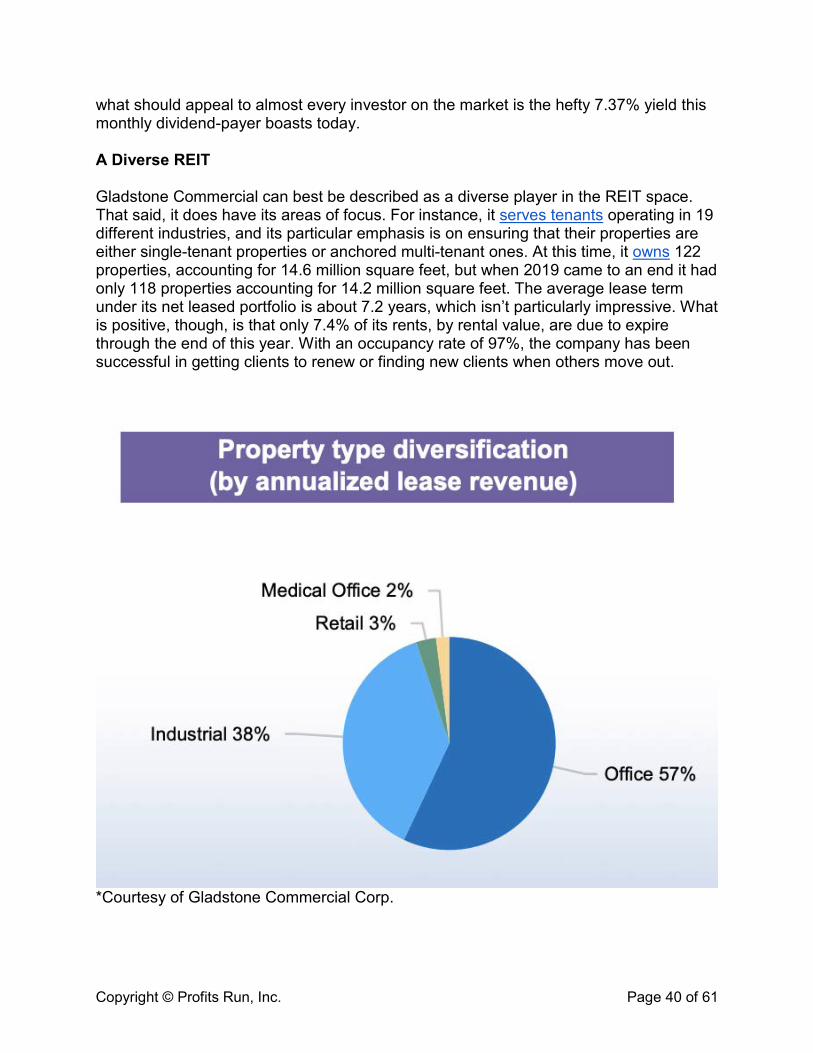
what should appeal to almost every investor on the market is the hefty 7.37% yield this monthly dividend-payer boasts today. A Diverse REIT Gladstone Commercial can best be described as a diverse player in the REIT space. That said, it does have its areas of focus. For instance, it serves tenants operating in 19 different industries, and its particular emphasis is on ensuring that their properties are either single-tenant properties or anchored multi-tenant ones. At this time, it owns 122 properties, accounting for 14.6 million square feet, but when 2019 came to an end it had only 118 properties accounting for 14.2 million square feet. The average lease term under its net leased portfolio is about 7.2 years, which isn’t particularly impressive. What is positive, though, is that only 7.4% of its rents, by rental value, are due to expire through the end of this year. With an occupancy rate of 97%, the company has been successful in getting clients to renew or finding new clients when others move out.
*Courtesy of Gladstone Commercial Corp.

Copyright © Profits Run, Inc. Page 41 of 61
Geographically, Gladstone Commercial’s business is quite diverse as well. It has operations in 28 states, which are also regionally spread out. This diversity further stretches into the purpose of its assets. A full 57% of its annual lease revenue comes from office space. Next in line is industrial, representing 38% of its annual leasing revenue. Together, this amounts to 95% of the firm’s operations, with retail coming in at 3% and medical office space rounding out the last 2%. When you break the data down even more, though, it becomes clear just how diverse the company is.
*Courtesy of Gladstone Commercial Corp. The largest individual sector in which it has tenants is telecommunications, accounting for 17% of the company’s leasing revenue. Diversified/Conglomerate services and automobile are both tied in second place at 13% each. After that, you have healthcare at 12%, banking at 7%, and information technology at 5%. On a company-specific basis, no single firm accounts for a material amount of the company’s business, which is also a positive. General Motors (GM) is the largest tenant by revenue at just 4% of the sales generated by the firm. The top five players combined account for only 16% of the company’s sales.

Copyright © Profits Run, Inc. Page 42 of 61
*Courtesy of Gladstone Commercial Corp. A Steady Payout
*Courtesy of Gladstone Commercial Corp.

Copyright © Profits Run, Inc. Page 43 of 61
As the images above and below both illustrate, revenue and aggregate cash distributions to holders have risen over the past few years. Revenue has grown an impressive 36.6% from $83.8 million in 2015 to $114.4 million last year. This increase has translated to consistent funds from operations (FFO) growth over time as well. Over the same five-year period, FFO has grown 48.3% from $32.9 million to $48.7 million. Given this, you might expect for the distribution per share paid out by the firm to actually rise, but this is not the case.
*Courtesy of Gladstone Commercial Corp. You see, in order to grow, management has continued to issue shares, both preferred and common. In fact, just earlier this year the business issued Series F Preferred units, which carried a 6% annual yield to them. The increase in share count has caused FFO on a per-share basis to be relatively flat, as shown in the image below. Because of this, management has consistently paid out, since at least 2015, $1.50 per share each year in annual distributions (or $0.125 per month). In fact, only in its most recent distribution announcement did the company increase it, raising it to $0.12515 per month, or $1.5018 each year.

Copyright © Profits Run, Inc. Page 44 of 61
*Courtesy of Gladstone Commercial Corp. The spread between the payout and the amount of cash flow the company has to cover the distribution is admittedly slim. In fact, in 2019, the disparity was only $0.05 per common and operating unit. That difference does leave little margin in the event that something bad comes to pass. Even so, the company’s diversity should be seen as a strength to help offset this and, as the image below illustrates, the firm’s leverage has only gotten better over time which further reduces the risk of a bad outcome affecting the business.

Copyright © Profits Run, Inc. Page 45 of 61
*Courtesy of Gladstone Commercial Corp. Takeaway Gladstone Commercial is a small but growing REIT. The company’s consistent payout over the years should be considered appealing by investors. Admittedly, the wiggle room the business has is limited should something go wrong, but for those who believe its diverse, high-quality assets will continue to attract tenants, the positive tradeoff is the hefty yield it offers. As of this writing, those yields stand at 7.37% per year. That’s a nice payout, even if the distribution does not improve in the years to come.
Monthly Income Investment #10: Shaw Communications (SJR)
Telecommunications operations are a necessity in every developed nation. Even so, many of the players are regional in nature, sometimes focusing on only one or two nations. This focus leaves plenty of firms on the market outside of the US for investors to take into consideration. One such example, with our neighbor to the north, is Shaw Communications (SJR). This player operates much like some of its larger US peers, but unlike them it offers investors a nice twist: monthly, as opposed to quarterly, distributions. Please note: Unless otherwise stated, and even then only on a case-by-case basis, all references to ‘$’ or dollars are to Canadian dollars, not US dollars. A Thriving Company

Copyright © Profits Run, Inc. Page 46 of 61
*Courtesy of Shaw Communications Shaw Communications is a thriving player in the telecommunications space. At this time, the firm operates three major segments: Wireline Consumer, Wireline Business, and Wireless. The image below illustrates just how diverse these operations are on a subscriber basis. Wireline Consumer, for instance, has 39% of its subscribers focused on the firm’s Internet services. A full 45% of subscribers under this line of business are video in nature, with two-thirds being cable and the remaining one-third set up as satellite. The rest fall under the company’s wireline phone business.
*Courtesy of Shaw Communications Wireline Business is a slightly different animal. It has the same components as Wireline Consumer, but the breakup is radically different, with 60% of subscribers set up as wireline phone. This fact makes sense when you consider how many businesses still have physical phone lines in place. Its Wireless division, meanwhile, is simpler in

Copyright © Profits Run, Inc. Page 47 of 61
nature. It’s divided between postpaid, where 79% of its subscribers fit, and prepaid, where the remaining 21% are.
*Courtesy of Shaw Communications Over the years, the firm established a significant presence in the wireline communications category. However with recent technological advances and through heavy investment, it is undergoing a transition from wireline to wireless. To illustrate this, we need only look at the image above. As you can see, 20% of its revenue and 9% of its subscribers are now on the wireless side of the equation. Although this shift is causing the company to shrink in some sectors, overall Shaw Communications has continued to grow.
*Courtesy of Shaw Communications In the image above, you can see subscriber numbers provided by management for 2018 and 2019. From 2018 to 2019, the number of subscribers for the company as a whole grew by about 1%, from 7.08 million to 7.15 million. Wireline Business expanded

Copyright © Profits Run, Inc. Page 48 of 61
3% from 612,208 to 630,619 over this period, but Wireline Consumer shrank by 4.1%. This decrease came even though it included a continued increase in Internet subscribers. The real growth machine for the business, though, is its Wireless division. Subscriber count there grew 18.2% year-over-year, rising from 1.40 million to 1.66 million. During the year, it launched its wireless services to 19 new markets in which it did not previously provide them. According to management, further growth prospects there still exist. A series of asset and company acquisitions the firm has made over the past few years, totaling more than $7 billion in all, have made the firm’s services available to 18 million consumers throughout Canada, around half of the country’s population. It has also served to prepare the company to roll out 5G operations in the years to come. Stability with Upside Potential
*Source: Profits Run Research Over the past few years, Shaw Communications has demonstrated impressive growth, even in spite of its weakening legacy business. Revenue grew from $4.88 billion in 2017 to $5.34 billion in 2019. Net income was bumpy, and earnings per share, as the graph above illustrates, saw a pretty wild ride as a result. Perhaps more important than these, though, was the company’s operating cash flow. In the graph below, you can see this figure on a per-share basis over the past three years as well as the company’s distribution per share on an annualized basis.

Copyright © Profits Run, Inc. Page 49 of 61
*Source: Profits Run Research It should be mentioned that the distributions being discussed here refer to the Class B common units. Those are what’s represented by the SJR ticker symbol on the NYSE as well. These units pay an extra $0.0025 per share each year more than the firm’s Class A units. Besides the higher payout, the only substantive difference between the two is voting. Class B common units for Shaw Communications do not carry any voting rights, while the Class A common units do. What’s really interesting here is that, even though the operating cash flow per share for Shaw Communications has risen in recent years, the distribution per share, at $1.1850 (or $0.8919 USD using the current exchange rate for a yield of 4.77%), has remained flat. For 2020, it’s likely to remain flat as well, with distributions for the first quarter having already been discussed by management. The widening gulf between operating cash flow per share and distribution per share may seem unappealing, but investors should see it as a form of safety since there’s plenty of wiggle room available. What’s more, the reason for this disparity is a good one: management continues to invest in growth.

Copyright © Profits Run, Inc. Page 50 of 61
*Courtesy of Shaw Communications Actual free cash flow in 2019 was $538 million. By comparison, distributions paid out to common shareholders totaled $606 million. This year, the situation is looking better, with free cash flow forecasted to total $700 million. This growth is, in part, organic, with EBITDA (and therefore likely operating cash flow) forecasted to increase by between 11% and 12% versus 2019’s reading, and by a decrease in capex from $1.21 billion to around $1.1 billion. This allows capex to remain self-funded while the distribution is covered entirely. If further growth does occur in 2021, then investors might see the distribution increase, but for the time being management is acting prudently. Takeaway At this point in time, Shaw Communications looks like an interesting prospect for investors who are interested in a monthly-paying firm that’s banking on a growing telecommunications market in Canada. The company’s payout, while flat in recent years, is attractive relative to the business’s share price, and current data suggests that if further growth continues beyond this year, the firm could be in a position to raise the distribution further. Until then, capturing growth from its key opportunities, while collecting an attractive yield, is perfectly rational.

Copyright © Profits Run, Inc. Page 51 of 61
Monthly Income Investment #11: Gladstone Investment (GAIN)
Business development companies (BDCs) can offer attractive prospects to investors who are already heavily invested into REITs and pipelines but who want monthly dividend-paying opportunities. One such BDC that pays out to shareholders monthly and that has done well to grow its business steadily in recent years has been Gladstone Investment (GAIN). What is also exciting is not only do the firm’s common shares pay out monthly, but their preferred units do the same. Given current prices, each of its securities outstanding boast a yield exceeding 6%. An Interesting Firm Gladstone Investment is a BDC that’s focused on making investments in largely lower middle market (LMM) companies. These are firms that it defines as operating in the US with an annual EBITDA ranging between $3 million and $20 million. Currently, the firm has investments in 29 different companies, spread across 17 states and operating in 14 industries.
Investment sizes vary based on need and the perceived return prospects of the firm in question, but management stated that they generally invest up to $30 million, with no lower limit established. Gladstone Investment typically steps into deals with the aim of being the lead majority investor for change-of-control buyouts, and it is usually interested in a mix of debt and equity. While most BDCs average about 5% to 10% of their investments going toward equity exposure, Gladstone’s preference is to see this number at around 25%. The remaining 75% of its exposure in a deal is generally allocated toward secured debt.

Copyright © Profits Run, Inc. Page 52 of 61
*Courtesy of Gladstone Investment Though this is the company’s preference, its preference does not always play out. At this time, Gladstone Investment’s portfolio is comprised of about 33% equity, split between both common and preferred units. Another 49% of its portfolio is allocated toward secured first lien debt, with the remaining 18% placed toward secured second lien debt. Overall, Gladstone Investment has a pretty nice mix because although the equity exposes the firm to downside should things go south, the priority of its debt helps to alleviate some of this risk.

Copyright © Profits Run, Inc. Page 53 of 61
*Courtesy of Gladstone Investment From an investment standpoint, the firm is fairly diverse. Its holdings are generally split into three different baskets: manufacturing, business services/distribution, and consumer products. Digging deeper, we find that 38.5% of its portfolio is allocated towards what the firm classifies as diversified/conglomerate services. Next in line is home and office furnishings, housewares, and durable consumer products, comprising 15.8% of the firm’s portfolio. In third place we have personal and non-durable consumer products at 6.8%.
*Courtesy of Gladstone Investment A Unique Opportunity

Copyright © Profits Run, Inc. Page 54 of 61
*Source: Profits Run Research With a lot of monthly dividend firms, you’ll typically find one opportunity to capture income paid out by the business: their common units. Gladstone Investment disrupts this status quo. Before we get there, though, let’s first discuss the firm’s financials over time. In the graph above, you’ll see revenue generated by the company over its past five fiscal years. This metric has slowly risen in recent years, as have the company’s earnings per share. The graph also illustrates distributions paid out to common shareholders in that time period. These largely follow the earnings per share, but what’s interesting is that even as Gladstone Investment pays out essentially all of its profits each year, it has done well to improve its balance sheet. This improvement can be seen in its net asset value (NAV) per share, as well as its aggregate debt, both illustrated in the graph below.

Copyright © Profits Run, Inc. Page 55 of 61
*Source: Profits Run Research As shown, management can pay out robust distributions to shareholders over time, all while growing asset values and reducing debt. Admittedly, though, the small disparity between earnings and distributions may leave some investors wanting additional safety, which is where the firm’s preferred shares come in. It has, at this time, a Series D preferred class of stock, and a Series E preferred class of stock. With monthly payouts of $0.13020833 and $0.1328125 per month (or $1.5625 and $1.59375 per year) respectively, these translate to annual yields of 6.15% and 6.20%. These yields are lower than the 6.66% paid out by the common stock, and the preferred investments don’t benefit from improved growth of the business. However, for those wanting consistent, safe payouts, these may be more sensible than the common units. Takeaway Right now, Gladstone Investment is an interesting investment prospect. What really sets it apart, though, is the diversity in monthly dividend paying securities. The common units are attractive for those who want to capture upside and who don’t mind the risk of something going wrong and causing a distribution cut in the future. Alternatively, the preferred units pay out nearly as much, have far more limited upside, but come with greater security in terms of their payouts.
Monthly Income Investment #12: Sabine Royalty Trust (SBR)
Copyright © Profits Run, Inc. Page 56 of 61
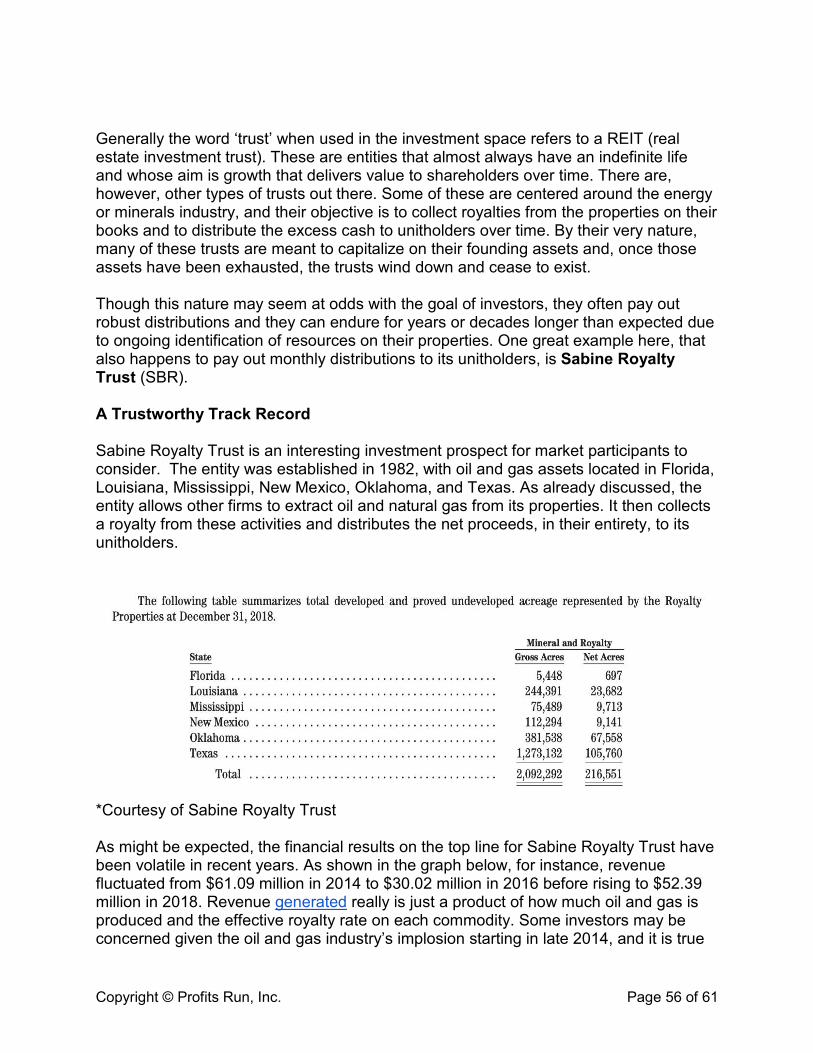
Generally the word ‘trust’ when used in the investment space refers to a REIT (real estate investment trust). These are entities that almost always have an indefinite life and whose aim is growth that delivers value to shareholders over time. There are, however, other types of trusts out there. Some of these are centered around the energy or minerals industry, and their objective is to collect royalties from the properties on their books and to distribute the excess cash to unitholders over time. By their very nature, many of these trusts are meant to capitalize on their founding assets and, once those assets have been exhausted, the trusts wind down and cease to exist. Though this nature may seem at odds with the goal of investors, they often pay out robust distributions and they can endure for years or decades longer than expected due to ongoing identification of resources on their properties. One great example here, that also happens to pay out monthly distributions to its unitholders, is Sabine Royalty Trust (SBR). A Trustworthy Track Record Sabine Royalty Trust is an interesting investment prospect for market participants to consider. The entity was established in 1982, with oil and gas assets located in Florida, Louisiana, Mississippi, New Mexico, Oklahoma, and Texas. As already discussed, the entity allows other firms to extract oil and natural gas from its properties. It then collects a royalty from these activities and distributes the net proceeds, in their entirety, to its unitholders.
*Courtesy of Sabine Royalty Trust As might be expected, the financial results on the top line for Sabine Royalty Trust have been volatile in recent years. As shown in the graph below, for instance, revenue fluctuated from $61.09 million in 2014 to $30.02 million in 2016 before rising to $52.39 million in 2018. Revenue generated really is just a product of how much oil and gas is produced and the effective royalty rate on each commodity. Some investors may be concerned given the oil and gas industry’s implosion starting in late 2014, and it is true

Copyright © Profits Run, Inc. Page 57 of 61
that many firms saw a lot of value destroyed there. Unlike those firms, though, Sabine Royalty Trust’s very structure is geared towards robust cash flows irrespective of the energy price environment.
*Source: Profits Run Research The company’s operating costs are remarkably low. To understand just how low, consider the aforementioned graph, which also shows distributable income for the trust. In 2018, Sabine’s distributable income margin was a robust 95.3% of sales. A similar relationship is evident in each of the years before that, as well as in the three quarters of the trust’s 2019 fiscal year when compared to the same three quarters of its 2018 fiscal year. This comparison is shown in the graph below.

Copyright © Profits Run, Inc. Page 58 of 61
*Source: Profits Run Research Every month, Sabine pays out the cash it has on hand, minus what it needs to keep operating. In 2018, this resulted in a distribution per share of $3.35 versus the $3.42 per share in distributable income. With no debt on hand, there’s no need to leave any meaningful margin between what can be distributed and what is ultimately distributed.
*Source: Profits Run Research

Copyright © Profits Run, Inc. Page 59 of 61
While complete financial results have not been provided for Sabine Royalty Trust for its 2019 fiscal year, we do know that the trust paid out about $3.02 per unit, or nearly $0.2517 per unit each month on average. With a current price of $35.27, this translates to a yield of 8.56%. Using today’s price, the best yield over the past six years would have been 11.62%, while the worst would have been 5.47%. Neither of those figures are unappealing. One fear investors may have is the prospect of the entity running out of oil and gas. While this is a natural concern, in all likelihood the trust should be good for an extended period of time. Every year, the firm produces a report covering how many years it thinks it has in the way of reserves based on existing production trends. Although 2019’s results have not been released as of this writing, the results for 2018 are readily available. In its 2018 annual report, published in early 2019, the company said that it had about 7.3 million barrels of oil and 35.3 billion cubic feet worth of natural gas on its properties. Over its lifetime, it had paid out $1.364 billion in distributions to shareholders out of 21.4 million barrels of oil and 270 billion cubic feet of natural gas extracted from its lands. Based on production back then, the entity estimated that it had between 8 and 10 years worth of reserves left on its books.
*Courtesy of Sabine Royalty Trust If this truly were the case, it would be easy to see if investing, while the company has a market cap of $514.21 million, is sensible or not. It becomes a simple game of calculating its net present value of all future cash flows. In its report, the company was kind enough to offer up a calculation there of its own. Future net revenue forecasted by the firm at then-current energy prices would have been $396.77 million. Using a 10% discount rate, the present value of these cash flows would be $190.33 million, which is significantly removed, and in a bad way, from the firm’s current market value.

Copyright © Profits Run, Inc. Page 60 of 61
*Courtesy of Sabine Royalty Trust This report may send some investors running for the hills, but it shouldn’t scare you away because every year the picture looks more or less the same. Go back to 2012, the oldest year the company has its annual report still available on its website. That year, it also estimated between 8 and 10 years of output. Since then, the trust has paid out an impressive $275 million in cash (through the end of 2018) to its unitholders. In 2019, it likely ended up increasing that by a further $44 million or so. The reason why this takes place is that Sabine Royalty Trust’s properties continue to yield more recoverable oil and gas. Part of this could be chalked up to new discoveries, while other parts could be attributable to technology making more of what was known now viable. Takeaway Sabine Royalty Trust is a unique prospect for the right kind of monthly yield seeker. The trust has done well to distribute significant cash flows to investors over time. While there is always uncertainty over just how long its assets will prove valuable, the market seems to think that the answer is for many years from now. Until then, unitholders are comfortable sitting back and collecting robust payouts.
Final Thoughts You now have a dozen different investments at your disposal. Each of which offer monthly income opportunities. Keep in mind that the average investor isn’t even aware of ANY investments that pay monthly income. Whereas you are now aware of at least 12 different investments that offer monthly income. This puts you in prime position. Armed with this guide you now have a clear road map of what investments can help pave the way towards a more comfortable retirement.

Copyright © Profits Run, Inc. Page 61 of 61
The Strange "Email Profit Signal" That Predicts Big Market Moves...
For the full story, visit:
www.profitsrun.com/strangesignal