Embed Size (px)
Citation preview

Copyright © Cengage Learning. All rights reserved.
Chapter 6
Inventories

Copyright © Cengage Learning. All rights reserved. 6-2
Managing Inventories
• Objective 1– Explain the management decisions related to inventory
accounting, evaluation of inventory level, and the effects of inventory misstatements on income measurement.

Copyright © Cengage Learning. All rights reserved. 6-3
Manufacturing Entities– Maintain other types of
inventories• Raw Materials• Work in Process• Finished Goods
Merchandising Entities
– Merchandise Inventory consists of all goods owned and held for sale in the regular course of business
Inventory
• Considered a current asset because it will normally be sold within a year’s time or within a company’s operating cycle.

Copyright © Cengage Learning. All rights reserved. 6-4
Components of Work in Process and Finished Goods Inventory
• Cost of the raw materials that go into the product• Cost of the labor used to convert the raw materials
to finished goods• Overhead costs that support the production process
(indirect materials like paint, glue; indirect labor such as salaries of supervisors; factory rent; depreciation of plant assets)

Copyright © Cengage Learning. All rights reserved. 6-5
• Inventory processing systems • Costing methods• Valuation methods
Result in different amounts of reported net income, taxes
paid, and cash flows
Inventory Decisions
A primary objective of accounting is to determine income properly by matching costs of the period to revenues.

Copyright © Cengage Learning. All rights reserved. 6-6
Toyota’s Inventory Turnover =
Inventory Turnover = Cost of Goods Sold
Average Inventory
$155,495 m
($15,281 m + $13,799 m) ÷ 2
= 10.7 times
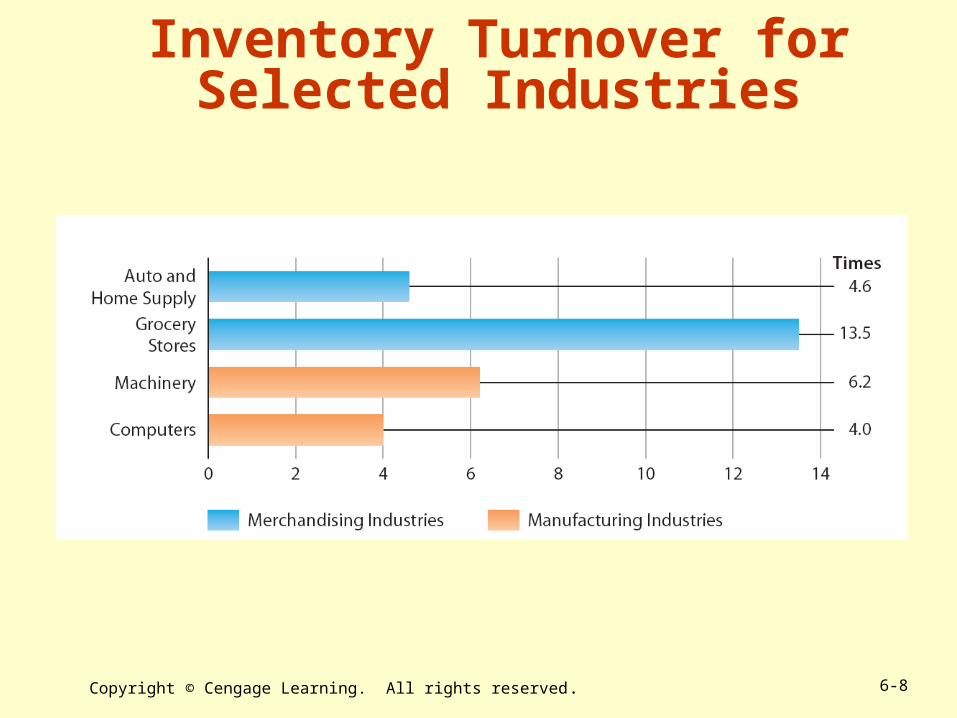
Inventory Turnover
• Measurement of the number of times a company’s average inventory is sold during an accounting period.

Copyright © Cengage Learning. All rights reserved. 6-7
Toyota’s Days’ Inventory on Hand =
Days’ Inventory on Hand = Number of Days in a Year
Inventory Turnover
365 days
10.7 times
= 34.1 days
Days’ Inventory On Hand
Indicates the average number of days required to sell the inventory on hand.
Copyright © Cengage Learning. All rights reserved. 6-8
Inventory Turnover for Selected Industries

Copyright © Cengage Learning. All rights reserved. 6-9
A just-in-time operating environment helps reduce inventory levels by coordinating orders and shipments of products so that they arrive “just in time” for customer orders
Using these procedures and processes means that less money is tied up with carrying inventory
Supply Chain Management Computerized system that a company uses to order
and track inventory goods

Copyright © Cengage Learning. All rights reserved. 6-10
Cost of goods sold is understated
Cost of goods sold is understated
Income before income taxes is understated
If inventory is understated…
Income before income taxes is overstated
If inventory is overstated…
Effects of Inventory Misstatements on Income Measurement

Copyright © Cengage Learning. All rights reserved.Copyright © Houghton Mifflin Company. All rights reserved. 6-11
Column 1Inventory
Correctly Stated
Net Sales $100,000
Beg. Inv. $12,000
Net purchases 58,000
Cost of goods available for sale $70,000
End. Inv. 10,000
Cost of Goods Sold $ 60,000
Gross margin $ 40,000
Operating expenses 32,000
Income before income taxes
$ 8,000
Column 2Inventory Overstated
Column 3Inventory
Understated
$100,000 $100,000
$12,000 $12,000
58,000 58,000
$70,000 $70,000
16,000 4,000
$54,000 $ 66,000
46,000 $ 34,000
32,000 32,000
$14,000 $ 2,000
Inventory Errors: Examples

Copyright © Cengage Learning. All rights reserved. 6-12
Inventory Cost and Valuation
• Objective 2– Define inventory cost, contrast goods flow and cost flow,
and explain the lower-of-cost-or-market (LCM) rule.

Copyright © Cengage Learning. All rights reserved. 6-13
Inventory Cost
• Includes: – Invoice price less purchases discounts
– Freight-in, including insurance in transit
– Applicable taxes and tariffs
– Cost for ordering, receiving, and storing• In principle, should be included in inventory cost
• In practice, are usually considered expenses of the period (too difficult to allocate to specific inventory items)

Copyright © Cengage Learning. All rights reserved. 6-14
Goods Flow and Cost Flow
• Goods Flow
Actual physical movement of goods in the operation of the company
Cost Flow Association of costs with their assumed flow in the operation of the company
Not always the same

Copyright © Cengage Learning. All rights reserved. 6-15
Lower-of-Cost-or-Market Rule Cost is usually the most appropriate basis for the valuation
of inventory. Sometimes inventory should be shown on financial
statements at less than its cost.
Physical deterioration, obsolescence, or decline in price level may cause a loss to occur.
The lower-of-cost-or-market (LCM) rule requires that when the replacement cost of inventory falls below historical cost, based on one of the conventional inventory costing methods, the inventory is written down to the lower value and a loss is recorded.

Copyright © Cengage Learning. All rights reserved. 6-16
Cisco Annual ReportInventories: Inventories are stated at the lower of cost or market. Cost is computed…on a first-in, first-out basis. The company provides allowances on excess and obsolete inventories.
Users should pay attention to the inventory disclosures in the notes to financial statements.
Disclosure of Inventory Methods

Copyright © Cengage Learning. All rights reserved. 6-17
Inventory Cost Under the Periodic Inventory System
• Objective 3– Calculate inventory cost under the periodic inventory
system using various costing methods.

Copyright © Cengage Learning. All rights reserved. 6-18
1. Specific identification method
2. Average-cost method
3. First-in, first-out method
4. Last-in, last-out method
Inventory Costing Methods
Inventory cost is determined using one of the following generally accepted methods, each based on a different assumption of cost flow:

Copyright © Cengage Learning. All rights reserved. 6-19
Specific Identification Method
• Identifies the cost of each item in ending inventory as coming from a specific purchase
• May be used for high-priced articles• Disadvantages
– Difficulty and impracticality of keeping track of the purchase and sale of individual items
– When items are identical but purchased at different costs, deciding which items were sold becomes arbitrary (company can raise or lower income by choosing the lower- or higher-cost items)

Copyright © Cengage Learning. All rights reserved. 6-20
Units in the ending inventory are identified as coming from specific purchases
Inventory Data
April 1 Inventory 160 units @ $10.00 $ 1,600April 6 Purchase 440 units @ $12.50 5,500April 25 Purchase 400 units @ $14.00 5,600Goods available for sale 1,000 units $12,700Sales 560 units On hand April 30 440 units
1,960140 units @ $14.00
2,500200 units @ $12.50
Specific Identification Method
Ending Inventory$5,460440 units
$ 1,000100 units @ $10.00
Specific Identification Method
Cost of Goods Sold = $12,700 – 5,460 = $7,240

Copyright © Cengage Learning. All rights reserved. 6-21
Average-Cost Method
• Computes the average cost of all goods available for sale during the period to determine the value of ending inventory
• Tends to level out the effects of cost increases and decreases
• Is criticized by some who believe that recent costs are more relevant for income measurement and decision making

Copyright © Cengage Learning. All rights reserved. 6-22
Inventory is priced at the average cost of the goods available for sale during the period
Inventory Data
April 1 Inventory 160 units @ $10.00 $ 1,600April 6 Purchase 440 units @ $12.50 5,500April 25 Purchase 400 units @ $14.00 5,600Goods available for sale 1,000 units $12,700Sales 560 units On hand April 30 440 units
Cost of Goods Available for Sale ÷ Units Available for Sale = Average Unit Cost$12,700 ÷ 1,000 units = $12.70
Ending Inventory = 440 @ $12.70 = $5,588
$7,112Cost of goods sold5,588Less April 30 inventory
$12,700Cost of goods avail for sale
Average-Cost Method

Copyright © Cengage Learning. All rights reserved. 6-23
First-In, First-Out (FIFO) Method
• Based on the assumption that the costs of the first items acquired should be assigned to the first items sold.
• The cost of ending inventory reflects the cost of merchandise from the most recent purchases.
• The costs assigned to cost of goods sold are from the earliest purchases.

Copyright © Cengage Learning. All rights reserved. 6-24
Effect of FIFO Method
• Values the ending inventory at the most recent costs and include earlier costs in cost of goods sold.
• During periods of consistently rising prices– FIFO yields the highest possible amount of net income
• Cost of goods sold will show earliest, lower costs incurred
• During periods of consistently falling prices– FIFO yields the lowest possible amount of net income
• Cost of goods sold will show most recent, higher costs incurred
• A major criticism of FIFO is that it magnifies the effects of the business cycle on income.

Copyright © Cengage Learning. All rights reserved. 6-25
First-In, First-Out Method
Assumes that the first units purchased will be the first units sold; Ending inventory is priced using the most recent purchases
Inventory Data
April 1 Inventory 160 units @ $10.00 $ 1,600April 6 Purchase 440 units @ $12.50 5,500April 25 Purchase 400 units @ $14.00 5,600Goods available for sale 1,000 units $12,700Sales 560 units On hand April 30 440 units
First-In, First-Out Method (Value Remaining Inventory)
400 units @ $14.00 from purchase of April 25 $5,600 40 units @ $12.50 from purchase of April 6 500
440 units at a cost of $6,100
$6,600Cost of goods sold6,100Less April 30 inventory
$12,700Cost of goods avail for sale

Copyright © Cengage Learning. All rights reserved. 6-26
Last-In, First-Out (LIFO) Method
• Based on the assumption that the costs of the last items acquired should be assigned to the first items sold.
• The cost of ending inventory reflects the cost of merchandise purchased earliest.
• The costs assigned to cost of goods sold are from the most recent purchases.

Copyright © Cengage Learning. All rights reserved. 6-27
Effect of LIFO Method
• Values the ending inventory at the earlier costs and include most recent costs in cost of goods sold.
• This assumption does not agree with the actual physical movement of goods in most businesses.– Current value of inventory may be unrealistic.
– Balance sheet measures (such as working capital and current ratio) may be distorted and must be interpreted carefully.
– Prohibited by IFRS

Copyright © Cengage Learning. All rights reserved. 6-28
Effect of LIFO Method (cont’d)
• Strong logical argument for LIFO– Fairest determination of income occurs if the current
costs of merchandise are matched against current sales prices.
• Smoothes out fluctuations in the business cycle– As prices move upward or downward, cost of goods sold
will show costs closer to the price level at the time the goods were sold.

Copyright © Cengage Learning. All rights reserved. 6-29
Ending inventory is priced using the earliest purchases
Inventory Data
April 1 Inventory 160 units @ $10.00 $ 1,600April 6 Purchase 440 units @ $12.50 5,500April 25 Purchase 400 units @ $14.00 5,600Goods available for sale 1,000 units $12,700Sales 560 units On hand April 30 440 units
Last-In, First-Out Method 160 units @ $10.00 from April 1 inventory $ 1,600 280 units @ $12.50 from purchase of April 6 3,500
440 units at a cost of $5,100
$7,600Cost of goods sold5,100Less April 30 inventory
$12,700Cost of goods avail for sale
Last-In, First-Out Method

Copyright © Cengage Learning. All rights reserved. 6-30
Impacts of Inventory Cost Flow Assumptions

Copyright © Cengage Learning. All rights reserved. 6-31
Stop & Review
Q. Do the FIFO and LIFO inventory methods result in different quantities of ending inventory?
A. The quantities of ending inventory are the same under FIFO and LIFO. Thesemethods affect the valuation of theinventory, not the quantities

Copyright © Cengage Learning. All rights reserved. 6-32
Impact of Inventory Decisions
• Objective 4– Explain the effects of inventory costing methods on
income determination and income taxes.

Copyright © Cengage Learning. All rights reserved. 6-33
Specific Identification
Method
Average-Cost Method
First-In, First-Out Method
Last-In, First-Out Method
Sales $10,000 $10,000 $10,000 $10,000 Cost of goods sold
Beg.inventory $1,600 $1,600 $1,600 $1,600Purchases 11,100 11,100 11,100 11,100Cost of goods avail. for sale $12,700 $12,700 $12,700 $12,700 Less end. inv. 5,460 5,588 6,100 5,100COGS $7,240 $7,112 $6,600 $7,600
Gross margin $2,760 $2,888 $3,400 $2,400
April Example: Period of Rising Inventory Purchase Prices
In times of declining prices: FIFO results in lowest gross margin, LIFO results in highest gross margin.
Highest gross
margin
Lowest gross
margin
Impact on Gross Margin

Copyright © Cengage Learning. All rights reserved. 6-34
Usage of Costing Methods

Copyright © Cengage Learning. All rights reserved. 6-35
LIFO Method
• Best suited for the income statement because it matches revenues and cost of goods sold.
• Not the best measure of the current balance sheet value of inventory, particularly during a prolonged period of price increases and decreases.

Copyright © Cengage Learning. All rights reserved. 6-36
FIFO Method
• Best suited to the balance sheet because the ending inventory is closest to current values.
• Gives a more realistic view of the current financial assets of a business.
• Does not provide as good a matching of current costs and revenues for income statement purposes.

Copyright © Cengage Learning. All rights reserved. 6-37
Inventory and Income Taxes
• Method chosen must be used consistently from year to year (may change with IRS approval if there is a good reason, exception—a change from LIFO).
• If a company uses LIFO for tax purposes, the IRS requires the same method for financial reporting.
• IRS will not allow lower-of-cost-or-market inventory valuation if LIFO is used.

Copyright © Cengage Learning. All rights reserved. 6-38
FIFO and Average Cost LIFO
Profit may be overstated
Inventory may be valued at a cost far below current prices
Business will pay excess income taxes
LIFO liquidation may occur; inventory quantity at year end falls below the beginning-of-year level
Business will pay higher income taxes
In periods of rising prices…
Effects on Income Taxes

Copyright © Cengage Learning. All rights reserved. 6-39
Stop & Review
Q. Which inventory costing method assumes results in the highest gross margin in times of rising inventory costs?
A. First-in, first-out method (FIFO)

Copyright © Cengage Learning. All rights reserved. 6-40
Chapter Review
1. Explain the management decisions related to inventory accounting, evaluation of inventory level, and the effects of inventory misstatements on income measurement.
2. Define inventory cost, contrast goods flow and cost flow, and explain the lower-of-cost-or-market (LCM) rule.
3. Calculate inventory cost under the periodic inventory system using various costing methods.
4. Explain the effects of inventory costing methods on income, inventory balance, and income taxes.