Embed Size (px)
Citation preview

Copyright 2005 Northrop Grumman Corporation
Measuring the Benefits of Mature Processes20th International Forum on COCOMO and Software Cost Modeling24 October 2005
Rick Hefner, Ph.D. Northrop Grumman Corporation

Copyright 2005 Northrop Grumman Corporation 2
Background
Many organizations have implemented process improvement efforts (CMM, CMMI, ISO, Six Sigma) to become better, cheaper and faster
Some organizations have not realized the quantitative or return-on-investment (ROI) benefits reported in the literature
Are the literature claims of ROI true?
Are their tricks for getting better ROI?
What are the timelines for realizing these benefits?
CMM® and CMMI® are registered trademarks of Carnegie Mellon University

Copyright 2005 Northrop Grumman Corporation 3
Agenda
Principles of process improvement
Industry data on ROI
Issues surrounding the measurement of benefits
Strategic actions needed to achieve maximum ROI
Northrop Grumman lessons learned

Copyright 2005 Northrop Grumman Corporation 4
Software Projects Have Historically Suffered from Mistakes
Reference: Steve McConnell, Rapid Development
People-Related Mistakes 1. Undermined motivation 2. Weak personnel 3. Uncontrolled problem employees 4. Heroics 5. Adding people to a late project 6. Noisy, crowded offices 7. Friction between developers and customers 8. Unrealistic expectations 9. Lack of effective project sponsorship 10. Lack of stakeholder buy-in 11. Lack of user input 12. Politics placed over substance 13. Wishful thinking
Process-Related Mistakes14. Overly optimistic schedules 15. Insufficient Risk Management16. Contractor failure Insufficientplanning 17. Abandonment of planningunder pressure 18. Wasted time during the fuzzy front end 19. Shortchanged upstreamactivities 20. Inadequate design 21. Shortchanged qualityassurance 22. Insufficient managementcontrols 23. Premature or too frequentconvergence 25. Omitting necessary tasks from estimates 26. Planning to catch up later27. Code-like-hell programming
Product-Related Mistakes28. Requirements gold-plating 29. Feature creep 30. Developer gold-plating 31. Push me, pull me negotiation32. Research-orienteddevelopment
Technology-Related Mistakes 33. Silver-bullet syndrome 34. Overestimated savings fromnew tools or methods 35. Switching tools in the middleof a project 36. Lack of automatedsource-code control
Standish Group, 2003 survey of 13,000 projects
• 34% successes• 15% failures• 51% overruns
Standish Group, 2003 survey of 13,000 projects
• 34% successes• 15% failures• 51% overruns

Copyright 2005 Northrop Grumman Corporation 5
Many Approaches to Solving the Problem
Which weaknesses are causing my problems?
Which strengths may mitigate my problems?
Which improvement investments offer the best return?
People
Product
Technology
Tools
ManagementStructure
BusinessEnvironment
Process
Methods
One solution!

Copyright 2005 Northrop Grumman Corporation 6
Approaches to Process Improvement
Data-Driven (e.g., Six Sigma, Lean)
Clarify what your customer wants (Voice of Customer) Critical to Quality (CTQs)
Determine what your processes can do (Voice of Process) Statistical Process Control
Identify and prioritize improvement opportunities Causal analysis of data
Determine where your customers/competitors are going (Voice of Business) Design for Six Sigma
Model-Driven (e.g., CMM, CMMI)
Determine the industry best practice Benchmarking, models
Compare your current practices to the model Appraisal, education
Identify and prioritize improvement opportunities Implementation Institutionalization
Look for ways to optimize the processes

Copyright 2005 Northrop Grumman Corporation 7
Typical Data-Driven Results Cited in Literature
Year Revenue ($B) Invested ($B) Savings ($1B) % Revenue
Motorola
1986-2001 356.9(e) ND 16 4.5
Allied Signal
1998 15.1 ND 0.5 3.3
GE
1996 79.2 0.2 0.2 0.2
1997 90.8 0.4 1 1.1
1998 100.5 0.5 1.3 1.2
1999 111.6 0.6 2 1.8
1996-1999 382.1 1.6 4.4 1.2
Honeywell
1998 23.6 ND 0.5 2.2
1999 23.7 ND 0.6 2.5
2000 25.0 ND 0.7 2.6
1998-2000 72.3 ND 1.8 2.4
Ford
2000-2002 43.9 ND 1 2.3
http://www.isixsigma.com/library/content/c020729a.asp

Copyright 2005 Northrop Grumman Corporation 8
Typical Model-Driven Results Cited in Literature
10:1 Defect
Reduction
10:1 Defect
Reduction
50%Productivity
Increase
More Accurate Estimates
More Accurate Estimates
ReworkDrops From
54% to 4%
ReworkDrops From
54% to 4%
“Benefits of CMM-Based Process Improvement”, Herbsleb et al., Software Engineering Institute, 1994
Category Range
Yearly cost of process improvement activities
$49K - $1,202K
Years engaged in SPI
1 – 9
Cost of SPI per engineer
$490 - $2,004
Productivity gain per year
9% - 67%
Early detection gain per year (defects discovered pre-test)
6% - 25%
Yearly reduction in time to market
15% - 23%
Yearly reduction in post-release defects
10% - 94%
Business value (ROI)
4.0 - 8.8
Copyright 2005 Northrop Grumman Corporation 9
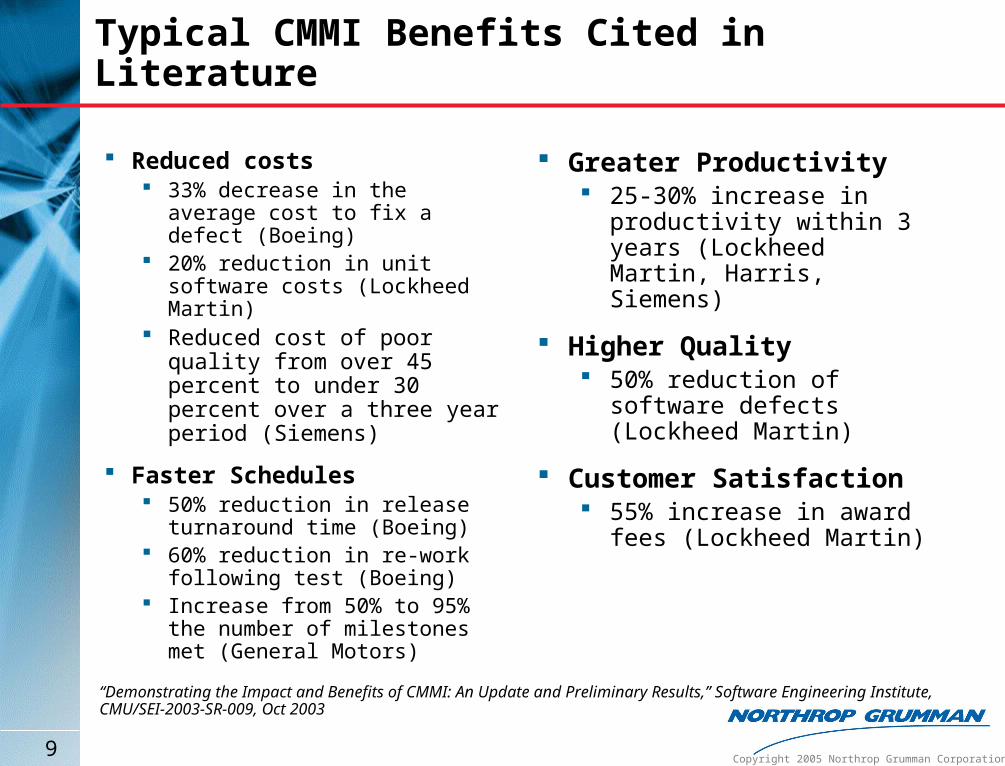
Typical CMMI Benefits Cited in Literature
Reduced costs 33% decrease in the average
cost to fix a defect (Boeing) 20% reduction in unit software
costs (Lockheed Martin) Reduced cost of poor quality
from over 45 percent to under 30 percent over a three year period (Siemens)
Faster Schedules 50% reduction in release
turnaround time (Boeing) 60% reduction in re-work
following test (Boeing) Increase from 50% to 95% the
number of milestones met (General Motors)
Greater Productivity 25-30% increase in
productivity within 3 years (Lockheed Martin, Harris, Siemens)
Higher Quality 50% reduction of software
defects (Lockheed Martin)
Customer Satisfaction 55% increase in award fees
(Lockheed Martin)
“Demonstrating the Impact and Benefits of CMMI: An Update and Preliminary Results,” Software Engineering Institute, CMU/SEI-2003-SR-009, Oct 2003
Copyright 2005 Northrop Grumman Corporation 10
The Knox Cost of Quality Model
Extension of the Cost of Quality model used in manufacturing
Cost Category Definition Typical Costs for Software
Conformance Appraisal Discovering the condition of the product
Testing and associated activities, product quality audits
Prevention Efforts to ensure product quality
SQA administration, inspections, process improvements, metrics collection and analysis
Non-conformance
Internal failures
Quality failures detected prior to product shipment
Defect management, rework, retesting
External failures
Quality failures detected after product shipment
Technical support, complaint investigation, defect notification
Knox’s Theoretical Model for Cost of Software Quality (Digital Technical Journal, vol.5, No. 4., Fall 1993, Stephen T. Knox.)

Copyright 2005 Northrop Grumman Corporation 11
Knox Model – Theoretical Benefits
0
10
20
30
40
50
60 C
ost a
s a
Pe
rce
nt o
f D
eve
lop
me
nt
1 2 3 4 5 SEI CMM Level
Prevention Appraisal Int Failure Ext Failure TCoSQ
COCOMO also predicts ~10% increase in productivity for
each increase in CMMI Level
COCOMO also predicts ~10% increase in productivity for
each increase in CMMI Level

Copyright 2005 Northrop Grumman Corporation 12
Why Measuring ROI is Hard
What do you count as “Investment”? Training? QA? Data gathering? New practices? What would we have done instead?
What do you count as “Savings? Increased predictability – what’s the value? Increased productivity – who gets the benefit? Better competitive position – how measured?
How do you measure the change? Multiple causes – awareness, knowledge, infrastructure Short-term vs. long-term – Hawthorne effect Over what time-frame?
See also The Shangri-La of ROI”, Sarah Sheard and Christopher Miller, Software Productivity Consortium
ROI =Savings
-----------------Investment
Copyright 2005 Northrop Grumman Corporation 13
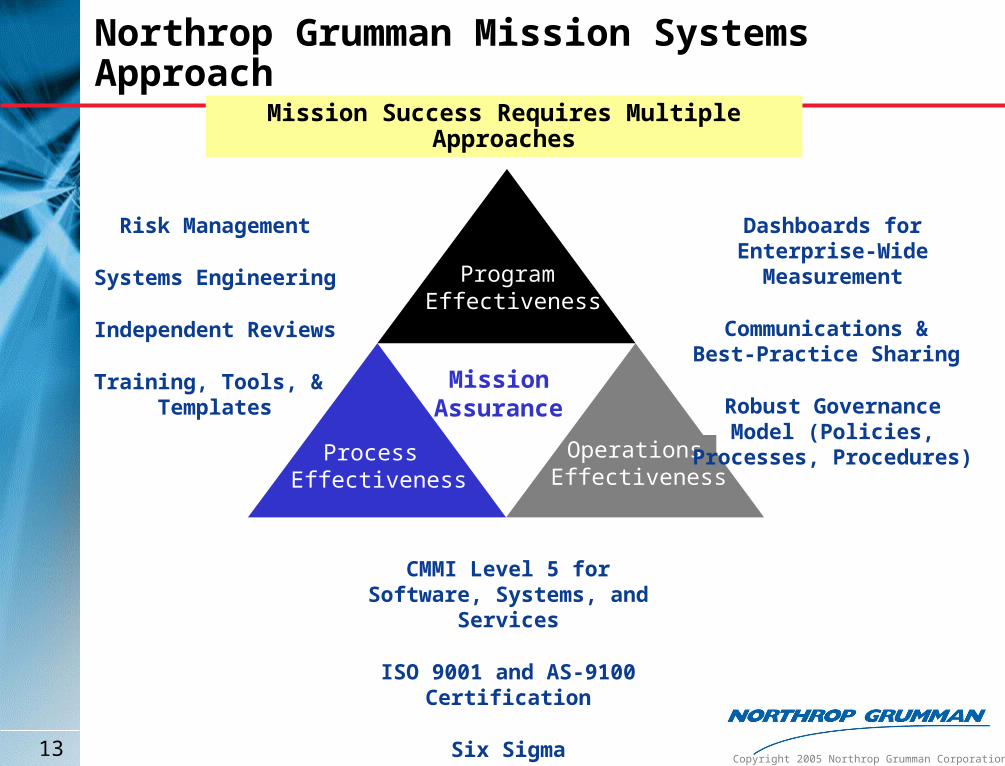
Process Effectiveness
Program Effectiveness
Mission Assurance
Operations Effectiveness
Dashboards for Enterprise-Wide Measurement
Communications & Best-Practice Sharing
Robust Governance Model (Policies, Processes,
Procedures)
Risk Management
Systems Engineering
Independent Reviews
Training, Tools, & Templates
CMMI Level 5 for Software, Systems, and Services
ISO 9001 and AS-9100 Certification
Six Sigma
Northrop Grumman Mission Systems Approach
Mission Success Requires Multiple Approaches

Copyright 2005 Northrop Grumman Corporation 14
Process Effectiveness
• CMMI & Six Sigma courses• Policies & processes course• Standard Training Modules
for each job function: engineering, project management, QA, CM, etc.
Staff Competence & Training
Communications & CollaborationProcess Asset Library
Audits & Appraisals
Assuring mission success by making the people and processes more informed and effective
Assuring mission success by making the people and processes more informed and effective
5
13 Northrop Grumman sitesexternally appraised at CMMI Level 5
13 Northrop Grumman sitesexternally appraised at CMMI Level 5

Copyright 2005 Northrop Grumman Corporation 15
Program Effectiveness
Six Sigma connects process improvement and business value
Six Sigma projects can help focus and measure CMMI-driven process improvements Identify the customer’s needs, maximize the value/cost Tools for management by variation (CMMI Levels 4 and 5)
Results to date 4000 Green Belts, 200 Black Belts, 12 Master Black Belts 500 completed Six Sigma projects, 250 in progress Significant benefit to our customer – lower costs, better performance
Charter team, map process & specify CTQs
Measure process performance
Identify & quantify root causes
Select, design & implement solution
Institutionalize improvement, ongoing control
DEFINE MEASURE ANALYZE CONTROL IMPROVE
Assuring mission success by identifying the customer’s needs and reducing defects
Assuring mission success by identifying the customer’s needs and reducing defects

Copyright 2005 Northrop Grumman Corporation 16
Operational Effectiveness
Assuring mission success by providing independent cost, schedule and risk realism
Assuring mission success by providing independent cost, schedule and risk realism
Tying it all together
ProductProcess Capability
DataRepositor
y Software, Hardware,
AccountingProductivity, Defects,
Maintenance Phase
Relationships,Systems Engineering Functions
Lessons Learned
People
Presence
Tools
ProgramsProcess
Risk AnalysisCost Estimates
Cost Estimation RelationshipsProgram Benchmarking
Life Cycle Productivity AnalysisSoftware Sizing and Modeling
Predictive ModelingQuantitative Management
Parametric Modeling ExpertiseDOD Software Industry Expertise
Risk and Predictive Modeling AnalysisCertified Function Point Specialists
Six Sigma Black Belts
Professional Society Board MembersActive on Government Working groupsKey participants on Milestone reviews)
Commercial Modeling ToolsNorthrop Grumman Developed Tools
Monitor, Manage, Report, Update and Calibrate
Structured Project Reporting, TrainingStandardization of Data, Metrics Manual,
ApprovalCMMI Measurement,

Copyright 2005 Northrop Grumman Corporation 17
Lessons Learned
Model-driven and data-driven process improvements compliment each other
Model-driven improvements are difficult to measure precisely Long improvement cycles and broad focus make it difficult to
isolate cause and effect Substantial anecdotal evidence of significant ROI
Data-drive improvements are more easily measured Short improvement cycles, narrow focus Efforts concentrate data, measurement systems, tie
improvements to business goals