Embed Size (px)
Citation preview

978-1-7281-3815-2/19/$31.00 ©2019 IEEE
Conventional Power Plants to TSO Frequency
Containment Reserves – A Competitive Analysis for
Virtual Power Plant’s Role
Jibran Ali
DITEN & MEAN4SG
University of Genoa
Genova, Italy
Federico Silvestro
DITEN
University of Genoa
Genova, Italy
Abstract—Frequency regulation is one of the basic objectives
in ancillary market, which involves different stages and multiple
participants. There exists different techniques for this service,
where the points of demarcation are the time of service, and the
regulatory requirements. The paper discusses primary frequency
regulation, w.r.t Italian regulations, which is provided by
conventional power plants upon TSO requests. The paper
demonstrates conventional technique with its limitations, and
proposes use of Virtual Power Plant (VPP) for the service
provision. Storage and renewables techniques are compared
under VPP context, and the use of storage is motivated. Finally,
technical and economic comparison amongst potential storage
techniques is done.
Keywords—Frequency regulation; VPP; power plants; TSO;
storage system
I. INTRODUCTION
Intermittencies in power grid requires further flexibility in ancillary market [1]. Two major ancillary services are the voltage and frequency control as in [2], for which real power and reactive power are the control parameters at point of transmission. The common approach is to keep reserves for the services; specifically real power reserves for frequency regulation [3-4]. These reserves vary in terms of regulations, timings requirements, and market participant.
From [5-6], there are three types of frequency reserves: Frequency Containment Reserves (FCR), Frequency Restoration Reserves (FRR) in automatic (secondary) and manual (tertiary) modes, and Replacement Reserves (RR). TSO, in general (excluding some European countries), remunerates the providers for FCR with a 30 seconds activation time [7-8]. The real power reserves that are used for FCR need to be very fast in response, and thus the participants for this service are bound to ensure the use of relevant technologies only [9]. Due to these characteristics requirements, battery energy storage is thus a literature mostly discussed solution as in [10].
The secondary reserves have a time limit of 7.5 minutes with a centralized control from TSO as in [11]. Different TSO of different countries may have different time limits, and different remuneration strategies. In the context of this paper, Italy is used as the reference country, and the primary reserves
are only discussed. For Italian system, FCR has to be sustained for 30 seconds, and secondary reserves within 200 seconds. However, with the large frequency deviations, FCR has to arrive the settling frequency within 10 seconds [12]. With the new service providers in the market, another important service is Fast Frequency Response (FFR) for which TSO remunerates for restoration within 2 seconds [13]. Nadir frequency is assumed to be 100 mHz in the paper (0.2% with reference to 50 Hz), as a pessimistic bound for further analysis [14].
The next section II follows the details of how the service is provided by conventional power plants. The droop control system is implemented in Simulink, using modified IEEE 9 bus system. Two scenarios are investigated: one is the conventional FCR, while other is the FCR with deadline extension. For both scenarios, some test cases are simulated to analyze settling frequency, time of service, and duration of provided service. Section III further elaborates the concept of FCR to FFR, emphasizing on VPP concept with potential comparison amongst the options of storage and renewables. It further compares the different storage options using ES-Select tool. Section IV analyzes the potential use of proposed VPP, while section V concludes the paper.
II. CONVENTIONAL FCR TECHNIQUE – DESCRIPTION,
DEMONSTRATION, & LIMITATIONS
First, Primary frequency control is provided by governor control at turbine, where the frequency is dependent on rotor angular speed. The details are provided in [15], with the equivalent representation of control in Figure 1, with the backward loop of droop control only, adapted from [15]. All values of turbine time constant, governor time constant, and inertia constant H [16] are taken from [15].
The compensation factor is deduced from [17], which occurs from the fact that the frequency variations are high enough, and thus the swing equation mechanical and electrical powers do not void each other. The model for this compensation power is, from [17], introduces a gain factor K incorporating the frequency changes and the dead- band. The modified form for the control is shown in Figure 1 with the gain factor loop. From [17], large dead-band is used to reduce procurement cost, following all the requirements of nadir frequency and FCR timings (settling time, and restoration
This Project has received funding from the European Union's Horizon
2020 research and innovation programme under the Marie Sklodowska-Curie
grant agreement No 676042.
6
Authorized licensed use limited to: Universita degli Studi di Genova. Downloaded on June 12,2020 at 11:15:18 UTC from IEEE Xplore. Restrictions apply.

Fig. 1. Primary frequency control conventional technique – Conventional & Modified ([17])
time). Next step describes the test case that is used for the analysis. Consider the component model of IEEE 9 bus transmission system, as shown in Figure 2 [18-19]. For the sake of analysis, the transmission line (inductive and capacitive effects) and transmission impedances are ignored. In addition, generator 1 is supposed to supply representative loads A, B, and C only. In Italy, there is one area system concept, and thus the other generators are supposed to operate at same frequency (neglected in analysis here). For the rated power, the system is operated at a rated frequency. In other words, the frequency change is zero when there is no variation at the loads. Then, the load is varied from 1% to 10% of rated power (with step size of 1%), and the frequency change is observed. The point of disruption is noted, at that particular load level. The gain factor is applied with the real power reserves to adjust the frequency change within the required dead-band [17]. The time for the service is noted. The system is implemented in MATLAB/Simulink, with Governor time constant = 0.11 seconds, Turbine time constant = 0.40 seconds, Droop = 6%, extended dead-band = 80mHz,
All loads have 100 MW rated power. The results are presented in Table I. Positive load change means reduction in demand, while negative load change indicates the distributed generation or co-generation. For the 10% change in load, the frequency deviation is 63 mHz. The gain factor is set to 10 in all cases. With the case of loss of load, the frequency does not come to settling within 10 seconds, as in Figure 3. With the co-generation of 50%, the frequency deviation violates the dead-band. Deviation is reduced to 22 mHz, and with the gain factor of 5, the frequency deviation is reduced to 27.5 mHz. The problem in both cases is the increase in the time for service provision (i.e. the frequency settling time). The compensation is provided through primary real power reserves, and the conventional technique is the synchronous generators for the
provision. Table I shows all the cases for the provision of service within the dead-band.
Fig. 2. IEEE 9-bus component selection [18-19]
III. PROPOSED VPP TECHNIQUE FOR FCR SERVICE: STORAGE VS
RENEWABLES
In order to create market for FFR, the primary response has
to be fast enough. This requires techniques with fast response for better compensation of real power reserves. The compensation can be provided through conventional, and VPP based techniques; and the analysis is shown in Table II [16]
7
Authorized licensed use limited to: Universita degli Studi di Genova. Downloaded on June 12,2020 at 11:15:18 UTC from IEEE Xplore. Restrictions apply.

[20]. The new actors employ inverter-based techniques for the service with emphasis on response to service request, service restoration time, and economics for low/high provision. The table shows that storage system is best suited in terms of better flexibility, adequacy, and response time. Next step is to compare potential storage technologies for the frequency service.
TABLE I. ANALYSIS RESULTS
Fig. 3. Frequency behavior with loss of load
Literature suggests a variety of electrical storage options in various forms, and the distinctions are made according to applications. For the provision of FFR, the parameters of interest include response time, discharge duration, rated power, and the maturity level of technology. From a long list of potential technologies, four are chosen on technical grounds and for further economic analysis. The choice covers all
maturity levels of technology, and suitable parameters range for this application [21].
The first one is flywheel, with response time in seconds; up to 15 minutes discharge duration, and commercial availability. Next commercial solution is advanced Li-ion with better response time and discharge duration. Lead acid is chosen as mature, and flow batteries mechanism is considered as developing option. The selection is based on analysis in [21]. Further selection amongst these four depends on capital/operating costs, and the procurement application. Next section is dedicated to economic analysis amongst these four technologies, and then to analyze the performance of the selected one w.r.t base conventional technique in section II.
Fig. 4. Frequency behavior with 47% co-generation
TABLE II. POTENTIAL SERVICE PROVIDERS
Percentage
change in load
(%)
Frequency
change within
deadband?
Time of service
- seconds
+10 Yes- 63 mHz 8
Loss of Load
Yes (but do not
settle within 10
seconds)
Failure
(Figure 3)
-10 Yes-65 mHz 6
-50 No-81 mHz Failure
-48
Yes-79.69
mHz(but do not
settle within 10
seconds)
Failure
-49 No-80.36 mHz Failure
-47 Yes- 79.71
mHz 7 (Figure 4)
Technique Name Key points
Synchronous Generator
High amount of provision at high costs.
High activation time
of 5-6 seconds. Provision can be as long as the machine is in operation.
VPP based battery storage system
High amount of provision with better
flexibility than SG. Only point is
absence of grid inertia Faster than SG; battery discharges at
a faster rate. 200 m-sec response time. Low
activation time [20]
VPP based wind farm
High (but investments are required to build doubly fed induction generators
plant). Grid inertia provided by
supplementary control loop Activation in 12 seconds
Intermittent without storage
Suitable for small scale [16]
0 5 10 15 20 25 30-0.07
-0.06
-0.05
-0.04
-0.03
-0.02
-0.01
0
0.01
0.02
Time in seconds
Fre
quency d
evia
tion in H
ert
z
Loss of load
0 5 10 15 20 25 30-0.08
-0.07
-0.06
-0.05
-0.04
-0.03
-0.02
-0.01
0
X: 1.624
Y: -0.07971
Time in seconds
47 percent co-generation
Fre
quency d
evia
tion in H
ert
z
8
Authorized licensed use limited to: Universita degli Studi di Genova. Downloaded on June 12,2020 at 11:15:18 UTC from IEEE Xplore. Restrictions apply.
IV. ANALYSIS FOR PROPOSED VPP WITH POTENTIAL STORAGE
OPTIONS FOR FCR
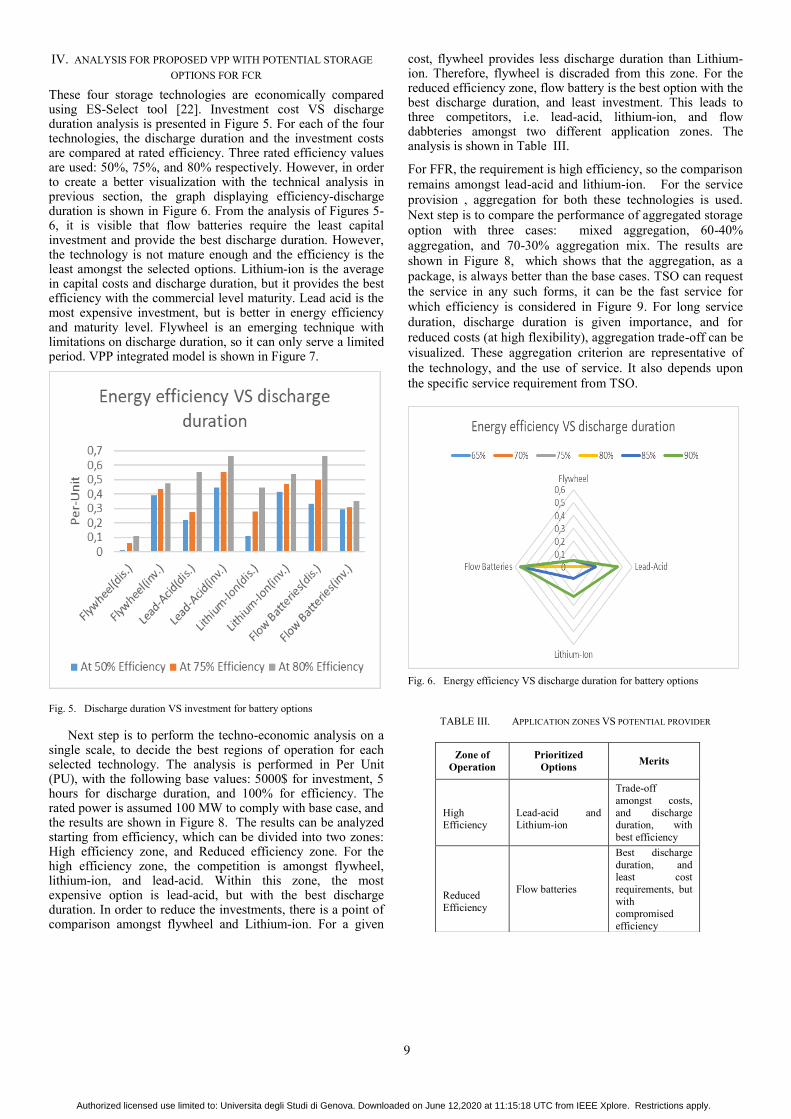
These four storage technologies are economically compared using ES-Select tool [22]. Investment cost VS discharge duration analysis is presented in Figure 5. For each of the four technologies, the discharge duration and the investment costs are compared at rated efficiency. Three rated efficiency values are used: 50%, 75%, and 80% respectively. However, in order to create a better visualization with the technical analysis in previous section, the graph displaying efficiency-discharge duration is shown in Figure 6. From the analysis of Figures 5-6, it is visible that flow batteries require the least capital investment and provide the best discharge duration. However, the technology is not mature enough and the efficiency is the least amongst the selected options. Lithium-ion is the average in capital costs and discharge duration, but it provides the best efficiency with the commercial level maturity. Lead acid is the most expensive investment, but is better in energy efficiency and maturity level. Flywheel is an emerging technique with limitations on discharge duration, so it can only serve a limited period. VPP integrated model is shown in Figure 7.
Fig. 5. Discharge duration VS investment for battery options
Next step is to perform the techno-economic analysis on a single scale, to decide the best regions of operation for each selected technology. The analysis is performed in Per Unit (PU), with the following base values: 5000$ for investment, 5 hours for discharge duration, and 100% for efficiency. The rated power is assumed 100 MW to comply with base case, and the results are shown in Figure 8. The results can be analyzed starting from efficiency, which can be divided into two zones: High efficiency zone, and Reduced efficiency zone. For the high efficiency zone, the competition is amongst flywheel, lithium-ion, and lead-acid. Within this zone, the most expensive option is lead-acid, but with the best discharge duration. In order to reduce the investments, there is a point of comparison amongst flywheel and Lithium-ion. For a given
cost, flywheel provides less discharge duration than Lithium-ion. Therefore, flywheel is discraded from this zone. For the reduced efficiency zone, flow battery is the best option with the best discharge duration, and least investment. This leads to three competitors, i.e. lead-acid, lithium-ion, and flow dabbteries amongst two different application zones. The analysis is shown in Table III.
For FFR, the requirement is high efficiency, so the comparison
remains amongst lead-acid and lithium-ion. For the service
provision , aggregation for both these technologies is used.
Next step is to compare the performance of aggregated storage
option with three cases: mixed aggregation, 60-40%
aggregation, and 70-30% aggregation mix. The results are
shown in Figure 8, which shows that the aggregation, as a
package, is always better than the base cases. TSO can request
the service in any such forms, it can be the fast service for
which efficiency is considered in Figure 9. For long service
duration, discharge duration is given importance, and for
reduced costs (at high flexibility), aggregation trade-off can be
visualized. These aggregation criterion are representative of
the technology, and the use of service. It also depends upon
the specific service requirement from TSO.
Fig. 6. Energy efficiency VS discharge duration for battery options
TABLE III. APPLICATION ZONES VS POTENTIAL PROVIDER
Zone of
Operation
Prioritized
Options Merits
High Efficiency
Lead-acid and Lithium-ion
Trade-off
amongst costs,
and discharge duration, with
best efficiency
Reduced
Efficiency
Flow batteries
Best discharge
duration, and least cost
requirements, but
with compromised
efficiency
9
Authorized licensed use limited to: Universita degli Studi di Genova. Downloaded on June 12,2020 at 11:15:18 UTC from IEEE Xplore. Restrictions apply.

Fig. 7. Frequency control integrated technique – with VPP ([17])
The idea of Virtual Power Plant here is to involve the
different market participants, and storage is the current market trend. However, the integration of VPP in the current market scenario will impose regulatory, technical, interoperability, and privacy challenges. These peculiarities of VPP involves the identification of new possible market schemes, which comply with the requirements of integration.
Fig. 8. Combined performance of battery options
V. CONCLUSION
The paper demonstrates FCR with conventional technique
and the potential use of VPP for FFR. Storage technique is
emphasized, and different storage options are compared for the service. The results demonstrate that the technical and economic feasibility of FFR has trade-off amongst the VPP based strategies, and it is a good rationale to aggregate them as a future potential solution.
Future work involves secondary and tertiary frequency reserves on top of FCR service, and the extension of VPP involvement towards other ancillary services, example reactive power for voltage support. Another possible extension is the real-time validation of TSO based procurement for the service.
Fig. 9. Aggregated performance of battery options
10
Authorized licensed use limited to: Universita degli Studi di Genova. Downloaded on June 12,2020 at 11:15:18 UTC from IEEE Xplore. Restrictions apply.

ACKNOWLEDGMENT
This project has received funding from the European
Union's Horizon 2020 research and innovation programme under the
Marie Sklodowska-Curie grant agreement No 676042.
REFERENCES
[1] G.D. Zotti, S.A. Pourmousavi, H. Madsen, and N.K. Poulsen, “Ancillary
services 4.0: a top-to-bottom control-based approach for solving ancillary services problems in smart grids,” IEEE Access, vol. 6, pp. 11694-11706, February 2018.
[2] Y.G. Rebours, D.S. Kirschen, M. Trotignon, and S. Rossignol, “A survey of frequency and voltage control ancillary services – part ii: economic features,” IEEE Transactions on Power Systems, vol. 22, pp. 358-366, February 2007.
[3] E. Du, N. Zhang, C. Kang, B. Kroposki, H. Huang, M. Miao, and Q. Xia, “Managing wind power uncertainty through strategic reserve purchasing ,” IEEE Transactions on Power Systems, vol. 32, pp. 2547-2559, July 2017.
[4] A.V. Ntomaris, E.A. Bakirtzis, D.I. Chatzigiannis, C.K. Simoglou, P.N. Biskas, and A.G. Bakirtzis, “Reserve quantification in insular power systems with high wind penetration,” IEEE PES Innovative Smart Grid Technologies-Europe, vol. A247, October 2014, Istanbul, Turkey.
[5] “Evolution of ancillary services needs to balance the Belgian control area towards 2018”, ancillary services study, horizon 2018. Available:
http://www.elia.be/~/media/files/Elia/Grid-data/Balancing/Reserves-Study-2018.pdf
[6] T. Hesser, and S. Succar, “Chapter 9 – renewables integration through direct load control and demand response ,” Smart Grid, Integrating Renewable, Distributed & Efficient Energy, vol. 2012, pp. 209-233, 2012.
[7] “Frequency Containment Reserve (FCR)”, European union electricity market glossary. Available:
https://www.emissions-euets.com/internal-electricity-market-glossary/793-frequency-containment-reserve
[8] “Frequency Containment Reserve (FCR)”. Available:
https://www.entsoe.eu/network_codes/eb/fcr/
[9] M. Langeveld, “What is Frequency Containment Reserve”, 2017. Available:
https://senfal.com/en/2017/05/02/what-is-frequency-containment-reserve
[10] T. Thien, D. Schweer, D.V. Stein, A. Moser, and D.U. Sauer, “Real-world operating strategy and sensitivity analysis of frequency containment reserve provision with battery energy storage systems in the german market,” Journal of Energy Storage, vol. 13, pp. 143-163, October 2017.
[11] “Balancing markets”. Available:
https://www.next-kraftwerke.be/en/knowledge-hub/balancing-markets/
[12] “Mandatory response services ”. Available:
https://www.nationalgrideso.com/balancing-services/frequency-response-services/mandatory-response-services
[13] “Frequency Services, Fast Frequency Response”. Available:
http://schwungrad-energie.com/services/frequency-services/
[14] I. Green, “Frequency response requirements – basic concepts,” California ISO Public, 2018. Available:
https://www.wecc.org/Administrative/07%20FRR%20Basic%20Concepts-%20Green.pdf
[15] H. Saadat, “Power System Analysis,” edition 3.
[16] P. Jung, “System-wide evaluation of inertia support potentials from wind farms ,” Project Report, Chalmers university of technology, 2017. Available: http://publications.lib.chalmers.se/records/fulltext/248302/248302.pdf
[17] J. Jomaux, T. Mercier, and E.D. Jaeger, “A methodology for sizing primary frequency control in function of grid inertia,” IEEE International Energy Conference, April 2016, Leuven, Belgium.
[18] “P.M. Anderson Test Case”. Available:
http://www.fglongatt.org/Test_Systems/PM_Anderson.html
[19] P.W. Sauer, and M.A. Pai, “Power System Dynamics and Stability,” 1998, Prentice Hall
[20] “Feasibility of Fast Frequency Response Obligations of New Generators”, 2017. Available:
https://www.aemc.gov.au/sites/default/files/content/661d5402-3ce5-4775-bb8a-9965f6d93a94/AECOM-Report-Feasibility-of-FFR-Obligations-of-New-Generators.pdf
[21] F. Nadeem, S.M.S. Hussain, P.K. Tiwari, A.K. Goswami, and T.S. Ustun, “Comparative Review of Energy Storage Systems, Ther Roles, and Impacts on Future Power Systems,” IEEE Access, vol. 7, pp. 4555-4585, December 2018.
[22] “ES-Select ToolTM”. Available:
https://www.sandia.gov/ess-ssl/tools/es-select-tool/
11
Authorized licensed use limited to: Universita degli Studi di Genova. Downloaded on June 12,2020 at 11:15:18 UTC from IEEE Xplore. Restrictions apply.