Embed Size (px)
Citation preview

Contribution of Statistical Iterative ReconstructionAlgorithm For Orthopaedic Applications: A StudyWith A Cone-Beam CT PrototypeStéphanie Uk
B3OA, UMR 7052 CNRS, U 1271 Inserm, Université de ParisFanny Morin
THALES AVSValerie Bousson
Hôpital Lariboisière, Radiology departmentRémy Nizard
Hôpital Lariboisière, Orthopedic departmentGuillaume Bernard
THALES AVSChristine Chappard ( [email protected] )
B3OA, UMR 7052 CNRS, U 1271 Inserm, Université de Paris
Research Article
Keywords: cone beam computed tomography, image reconstruction, radiation dosimetry, orthopaedicsurgery, bone geometry
Posted Date: June 15th, 2021
DOI: https://doi.org/10.21203/rs.3.rs-559091/v1
License: This work is licensed under a Creative Commons Attribution 4.0 International License. Read Full License
Version of Record: A version of this preprint was published at Journal of Surgery and Research onJanuary 1st, 2022. See the published version at https://doi.org/10.26502/jsr.10020206.

1
Contribution of statistical iterative reconstruction algorithm for orthopaedic
applications: a study with a cone-beam CT prototype
Stéphanie Uk MSc,*; Fanny Morin, PhD†; Valérie Bousson MD, PhD,‡; Rémy Nizard MD,
PhD ϕ; Guillaume Bernard, PhD†; and Christine Chappard MD, PhD,*
Affiliations
* B3OA, UMR CNRS 7052, Inserm U1271 Université de Paris, 10 avenue de Verdun, 75010
Paris, France
† THALES AVS, 460 rue du Pommarin, 38430 Moirans, France
‡ Service d’Imagerie Ostéo-Articulaire, Viscérale et Vasculaire, Hôpital Lariboisière, APHP,
Nord Université de Paris, 2 rue Ambroise Paré, 75010 Paris, France
ϕ Département d’Orthopédie Hôpital Lariboisière, 2 rue Ambroise Paré, 75010 Paris, France
Corresponding author:
Christine Chappard
B3OA
10, avenue de Verdun
75010 Paris
Tel 33 157278536, fax: 33157278570
Email: [email protected]

2
Abstract
Three-dimensional reconstruction for image-guidance in orthopaedic surgery necessitates a
high degree of geometrical precision but not necessary structure details. With the aim to reduce
as much as possible the dose, a cone beam CT prototype was tested with decreasing intensities,
the number of projections or different angular range. We tested two methods of reconstruction:
classical Feldkamp-Davis-Kress (FDK) reconstruction and the Simultaneous Algebraic
Reconstruction Technic with Total Variation (SART-TV).
Based on this protocol, on a knee cadaveric specimen, we combined qualitative assessment
performed by radiologists and orthopedic surgeons, objective metrics of image quality such as
signal-to-noise ratio, or related to bone geometric contour, grey level restitution and texture of
trabecular bone, and finally the quality of joint space segmentation.
Objective indicators related to signal-to-noise ratio, the quality of geometry and segmentation
have shown better results for SART-TV than FDK in case of decrease projections number and
angular range. On the contrary, qualitative assessment, and indexes about grey level restitution
and textural quality of trabecular bone produced the best results for FDK reconstruction. These
results showed that SART-TV reconstruction has a good capability to restore the geometry in
case of low dose protocol and consequently could be a good candidate for orthopaedic surgery.
Key words: cone beam computed tomography, image reconstruction, radiation dosimetry,
orthopaedic surgery, bone geometry
3
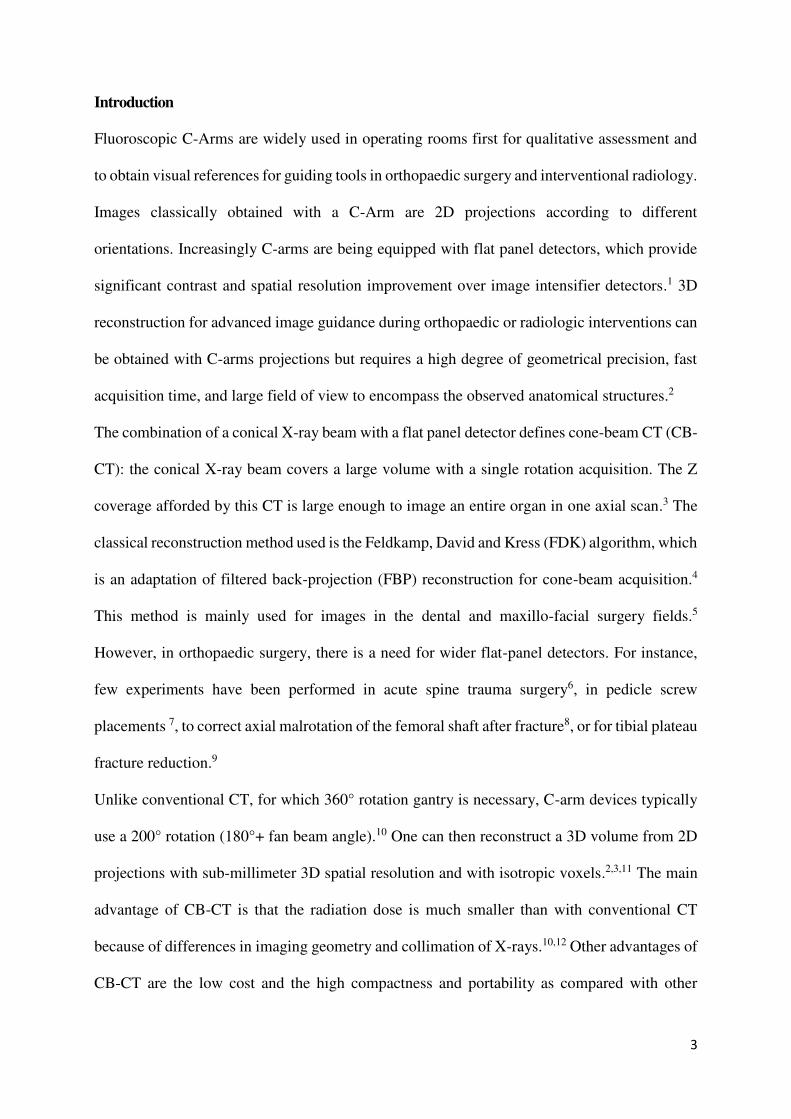
Introduction
Fluoroscopic C-Arms are widely used in operating rooms first for qualitative assessment and
to obtain visual references for guiding tools in orthopaedic surgery and interventional radiology.
Images classically obtained with a C-Arm are 2D projections according to different
orientations. Increasingly C-arms are being equipped with flat panel detectors, which provide
significant contrast and spatial resolution improvement over image intensifier detectors.1 3D
reconstruction for advanced image guidance during orthopaedic or radiologic interventions can
be obtained with C-arms projections but requires a high degree of geometrical precision, fast
acquisition time, and large field of view to encompass the observed anatomical structures.2
The combination of a conical X-ray beam with a flat panel detector defines cone-beam CT (CB-
CT): the conical X-ray beam covers a large volume with a single rotation acquisition. The Z
coverage afforded by this CT is large enough to image an entire organ in one axial scan.3 The
classical reconstruction method used is the Feldkamp, David and Kress (FDK) algorithm, which
is an adaptation of filtered back-projection (FBP) reconstruction for cone-beam acquisition.4
This method is mainly used for images in the dental and maxillo-facial surgery fields.5
However, in orthopaedic surgery, there is a need for wider flat-panel detectors. For instance,
few experiments have been performed in acute spine trauma surgery6, in pedicle screw
placements 7, to correct axial malrotation of the femoral shaft after fracture8, or for tibial plateau
fracture reduction.9
Unlike conventional CT, for which 360° rotation gantry is necessary, C-arm devices typically
use a 200° rotation (180°+ fan beam angle).10 One can then reconstruct a 3D volume from 2D
projections with sub-millimeter 3D spatial resolution and with isotropic voxels.2,3,11 The main
advantage of CB-CT is that the radiation dose is much smaller than with conventional CT
because of differences in imaging geometry and collimation of X-rays.10,12 Other advantages of
CB-CT are the low cost and the high compactness and portability as compared with other
4
technologies.13 However, there are also few disadvantages: scattered radiation, relatively
limited dynamic range of x-ray detectors, potential truncated views and beam hardening
artifacts.14 Moreover, the limitation of the angular span poses a great challenge in image
reconstruction. These drawbacks can affect the quality of images and potentially any
segmentation process.
The usual strategy to reduce the radiation exposure for both patients and staff is to decrease the
voltage or current, but another strategy in conventional CT could be to use iterative
reconstruction (IR) methods with fewer projections, which is an alternative to FBP.15
There are multiple algebraic methods using iterative methods, with three main families:
projective methods, a statistical method for noise reduction, and finally compressed sensing
reduction of projection number. The adaptative statistical IR method has been found reliable to
reduce the dose, with acceptable image quality despite low tube intensity.16,17 The oldest
method is the projective one based on a ray-by-ray method passing pixels by pixels called the
algebraic reconstruction technique (ART), resulting volumes might be quite noisy, but the
convergence rate is high (i.e., few iterations needed).18 The simultaneous IR technique treats all
rays at the same time (i.e., all pixels of all projections). There is less noise in reconstructions,
but the algorithm requires more iterations to converge.19 Simultaneous ART (SART) is a hybrid
of ART and simultaneous IR technique and is compatible with a clinical acquisition time with
little noise and a good convergence rate.20 This method was previously tested for 3D cone-beam
reconstruction.19 It treats the ray projection by projection, sampling is based on a group of
voxels including potentially sub-volume voxels. In addition, SART proposes to add a Hann
window during projection. Finally, ordered-subset SART is based on SART, but projections
are not treated independently but rather subset by subset. As previously, less noise is observed
in reconstructed volume but at higher convergence cost.19 To improve the quality for clinical

5
requirements, Total variation (TV) based regularization method was able to suppress streak like
artifacts for few CT.21
The goal of our study was to test the performance in terms of image quality of a CB-CT
prototype evaluated under different imaging conditions for orthopaedic surgery application. We
compared 3D image reconstructions obtained with the CB-CT prototype at different tube
currents, with different numbers of projections and angular span and with FDK or an IR method,
specifically SART-TV.
Results
The description of the protocol performed on one knee specimen, acquisition and different
scenarios of reconstruction is shown in the Fig.1. As a benchmark, the FDK reconstruction
was performed with large number of views: 720 projections over 360° at 15 mA.
In the number of projections reduction scenario (DAS scenario: 400 to 80 decreasing
projections, fixed 200° angle), with SART-TV reconstruction, mean signal-to-noise ratio (SNR)
was 43.9 (range 38.4 to 51.6) and was relatively constant for number of projections > 280; the
results were slightly better at 15 than 10 and 5 mA (Fig. 2). With FDK reconstruction, SNR
values regularly decreased from 42.2 to 14.5 with decreasing number of projections from 400
to 80. In the decreasing angular range scenario (DAR scenario: from 200° to 140° with one
projection every degree), with SART-TV, the mean SNR was 47.6 (relatively constant from
41.4 to 52.7); with FDK, the mean SNR was lower, 21.7 (relatively constant from 17.9 to 26.6)
(Fig. 2).
In the DAS scenario, the Difference of the textural parameter Entropy measured in a trabecular
bone region of interest between reference images and tested images was higher with SART-TV
than FDK, with an increase that appeared with < 200 projections, the results were paralleled in
the DAR scenario (Fig. 3).
6
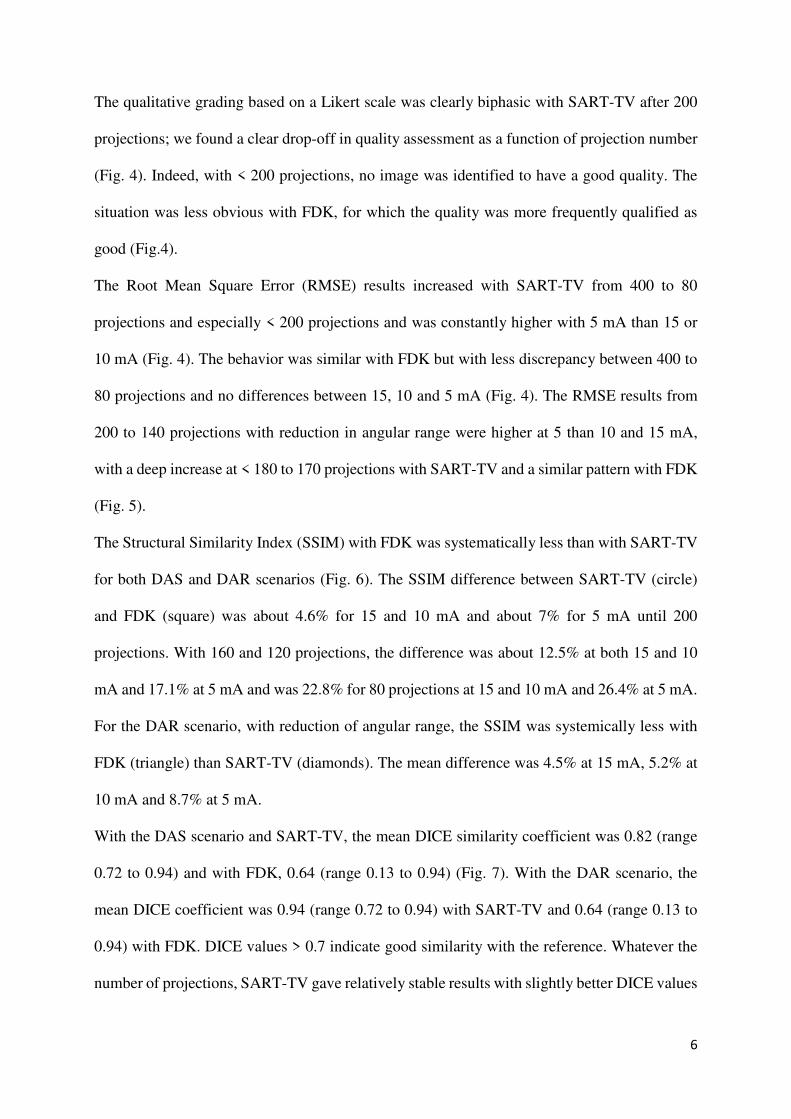
The qualitative grading based on a Likert scale was clearly biphasic with SART-TV after 200
projections; we found a clear drop-off in quality assessment as a function of projection number
(Fig. 4). Indeed, with < 200 projections, no image was identified to have a good quality. The
situation was less obvious with FDK, for which the quality was more frequently qualified as
good (Fig.4).
The Root Mean Square Error (RMSE) results increased with SART-TV from 400 to 80
projections and especially < 200 projections and was constantly higher with 5 mA than 15 or
10 mA (Fig. 4). The behavior was similar with FDK but with less discrepancy between 400 to
80 projections and no differences between 15, 10 and 5 mA (Fig. 4). The RMSE results from
200 to 140 projections with reduction in angular range were higher at 5 than 10 and 15 mA,
with a deep increase at < 180 to 170 projections with SART-TV and a similar pattern with FDK
(Fig. 5).
The Structural Similarity Index (SSIM) with FDK was systematically less than with SART-TV
for both DAS and DAR scenarios (Fig. 6). The SSIM difference between SART-TV (circle)
and FDK (square) was about 4.6% for 15 and 10 mA and about 7% for 5 mA until 200
projections. With 160 and 120 projections, the difference was about 12.5% at both 15 and 10
mA and 17.1% at 5 mA and was 22.8% for 80 projections at 15 and 10 mA and 26.4% at 5 mA.
For the DAR scenario, with reduction of angular range, the SSIM was systemically less with
FDK (triangle) than SART-TV (diamonds). The mean difference was 4.5% at 15 mA, 5.2% at
10 mA and 8.7% at 5 mA.
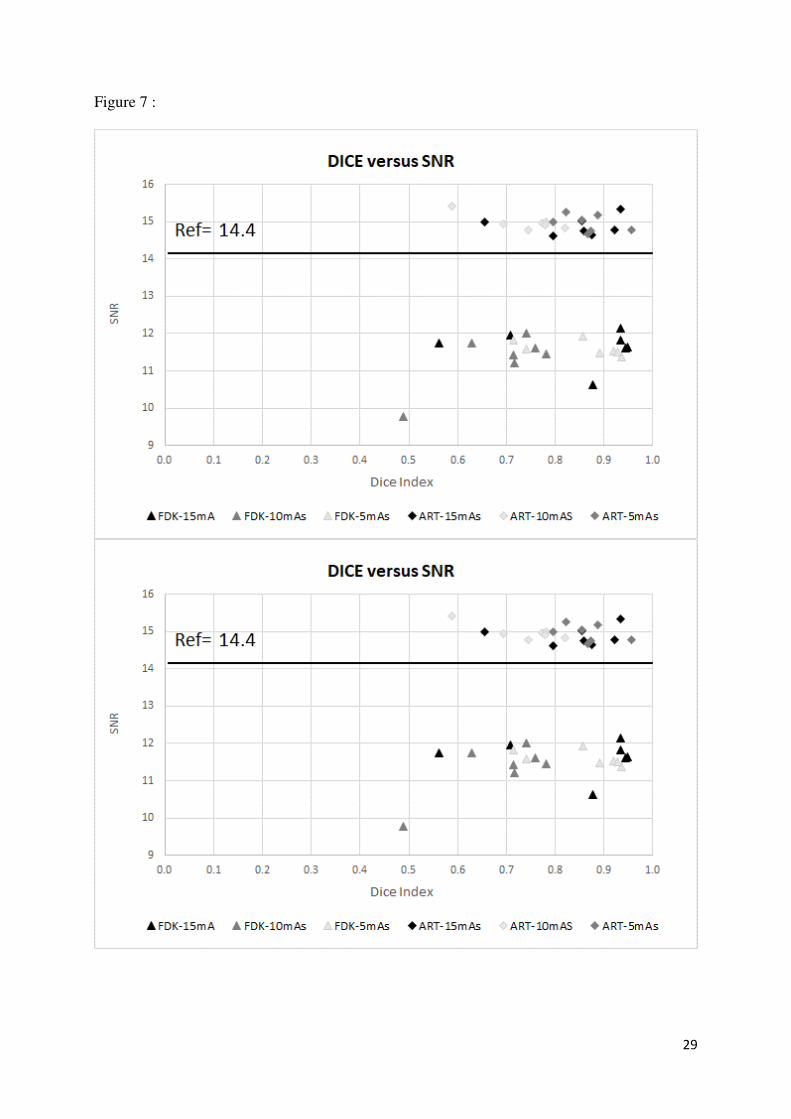
With the DAS scenario and SART-TV, the mean DICE similarity coefficient was 0.82 (range
0.72 to 0.94) and with FDK, 0.64 (range 0.13 to 0.94) (Fig. 7). With the DAR scenario, the
mean DICE coefficient was 0.94 (range 0.72 to 0.94) with SART-TV and 0.64 (range 0.13 to
0.94) with FDK. DICE values > 0.7 indicate good similarity with the reference. Whatever the
number of projections, SART-TV gave relatively stable results with slightly better DICE values

7
at 15 mA. In contrast, with FDK, results were dissipated and less coherent between different
projections whatever the intensity. With the DAR scenario, DICE values ranged from 0.59 to
0.96 with SART-TV and 0.13 to 0.95 with FDK, with large discrepancies not depending on the
intensity. As a conclusion, the segmentation was more efficient with SART-TV than FDK
reconstruction and especially in the DAS scenario.
Discussion
Real-time intra-operative imaging must be improved for unequivocal localization,
identification of anatomical landmarks, and reinforcing the patient-specific anatomy
knowledge. 3D CT reconstruction is ideal for guidance in interventional or orthopaedic fixation
procedures because the results can be checked instantly and potentially corrected before leaving
the operating room. All these factors help greatly enhance surgical confidence and could
improve the learning curve for young orthopaedic surgeons.22 Moreover, it could decrease the
surgery time and radiation dose exposure to the patient and staff by avoiding unnecessary trial
and error imaging. With orthopaedic surgery, one must be able to distinguish bone from soft
tissue and restore the geometry of bone contours as much as possible.
CB-CT imaging is based on a 2D flat panel detector and a cone-beam X-ray which yield
isotropic voxel and high image spatial resolution.11 Nevertheless, as compared with
multidetector CT, the contrast resolution of the flat panel detector is lower because of lack of
filtration and scatter rejection.14 The important scatter radiation due to wider x-ray beam
collimation in CB-CT leads to significant degradation of image quality as compared with
classical CT. Combining CB-CT with a C-arm might have a negative effect on image quality
and poses a great challenge to image reconstruction due to a limited angular span and possible
artifacts when using conventional reconstruction methods. The FDK reconstruction method is
classically used on CB-CT machine but iterative reconstruction (IR) can be used as an

8
alternative method and has the ability to reduce image noise despite a significant reduction in
tube current resulting in a reduction in overall radiation dose.15
The aim of this study was to identify the acceptable limits in terms of number of projections
with CB-CT, with a direct impact on dose radiation, for a preserved and interpretable image
quality for orthopaedic applications. We simulated dose reduction by current reduction and/or
by undersampling the projections and tested the classical algebraic reconstruction (SART-TV)
as an iterative method of reconstruction compared to the FDK reconstruction with 720
projections over 360° at 15 mA.
Thus, from our findings, SART-TV reconstruction is a good candidate for surgical orthopaedic
applications, with a minimum of 200 projections. Objective indicators such as SNR, SSIM and
DICE indexes derived from our segmentation analysis showed better results with SART-TV
than FDK reconstruction in situations of low projection number and the reduction of rotation
angular range. However, qualitative assessment and quality indexes derived on a grey level,
such as RMSE and textural analysis, produced the best results with FDK reconstruction.
The objective indicator SNR was relatively stable around 40 for SART-TV with decreased
number of projections. In contrast, with FDK, the SNR decreased regularly with number of
projections. The number of projections seemed to have more effects than reduction in angular
span. Usually, all strategies for reducing radiation dose result in an increased image noise
compromising diagnostic image quality.23 Our results are consistent with classical CT iterative
reconstruction: in a phantom of lumbar spine, Gervaise et al. found that adaptative iterative
dose reduction reduced image noise without altering the spatial resolution as compared with
filtered-back projection (FBP).24 In case of sparse acquisitions from 100 to 20 projections based
on phantoms imaging, the contrast to noise ratio used for testing the similarity between the
reconstructed and the FDK reference images have shown better results in case of iterative
9
reconstruction compared to classical FDK.21 The use of IR in clinical CT of the spine allowed
for 50% reduction of tube current intensity.25
Indeed, the FBP and derived FDK reconstructions gave more details inside the bone volume
(Fig. 8) and were thus more frequently qualified as good by evaluators. One of the strengths of
FBP reconstruction is well-known image texture.26 The over-smooth appearance of IR
reconstruction could affect the qualitative assessment because evaluators were not familiar with
this appearance, contrary to FBP reconstruction. This observation was previously noted; IR
methods are subject to over-smoothing degrading depiction of fine structure details and
especially when the acquisition is at very low dose.17,26
The RMSE is the simplest and widely used image-quality index, calculated by the root mean
squared intensity differences of distorted and reference image pixels.27 It is based on grey-level
differences and details of the image: a well-textured image gives the best RMSE, which could
explain the concordance we found with qualitative assessment.
Most evaluators considered the FDK reconstructed images to have quite good quality as
compared with SART-TV images. RMSE values were convergent with the qualitative
assessment as was entropy, which is based on the co-occurrence matrix and an indicator of the
coarseness aspect of texture.
The structural similarity index (SSIM) is sensitive to the edge information between the
reference and tested images and is considered reliable to assess structural information and
structural distortion.27 The similarity between the reconstructed and the FDK reference images
have shown better results in case of iterative reconstruction compared to classical FDK.21 On
MRI images, the SSIM did not show significant correlation with the radiologist’s opinion of
diagnostic image quality, contrary to the RMSE.28 Our results showed that for both RMSE and
SSIM, reducing the number of projections beyond 200 is not recommended.

10
Segmentation processes are considered of great importance in medical imaging, and
segmentation quality is classically assessed by the DICE index.29 The metric is sensitive to both
the delineation of the boundary (contour) and the size (volume of the segmented object). In a
previous study, we used 15 control points for initialization, followed by a snake model to
segment joint space in knees.30 Better results were clearly obtained with the IR reconstruction,
with consistent results whatever the intensity, contrary to FDK. Therefore, The DICE index
results are convergent with the SSIM results.
One of the limitations of the study is to assess only one knee specimen but we are confident in
the performance results as they can only be related to the different reconstruction scenarios
everything else being equal.
In the present study, we assessed only 3D reconstruction algorithms coupled with cone-beam
acquisition. The geometrical deformation usually encountered with the C-arm, real-time
tracking of the trajectory and calibration process have not been addressed. One other advantage
of IR reconstruction is that it can integrate particular acquisition geometries that are potentially
useful with a robotic C-arm capable of rotational orbits with oblique angulation.31 Moreover,
photon starvation artifacts, beam hardening, and metal artifacts likely decrease the quality of
images. Further studies are required to study the impact of metal implants on IR
reconstructions.32 Nevertheless, TV regularization-based optimization integrated in the iterative
framework has a positive effect for reducing metal artifacts.33
As summary, the preservation of edges and geometry and the SNR were found favorable with
an algebraic reconstruction even with low-dose protocol, with as a condition a minimum of 200
projections. The aim is not to restore all details, contrasts and textures but to have an image
quality sufficient with a good anatomical restoration of bone geometry. Consequently, image
quality provided by algebraic reconstruction is probably sufficient with respect to high contrast
anatomy for application in orthopaedic surgery.

11
Materials and methods
Experimental setup
The CB-CT prototype was equipped with a detector Thales Pixium (2630S); the source-detector
distance was 122 cm, object–detector distance 15 cm providing a 2000*2000 mm volumetric
field of view (FOV), and pixel size of the detector 260 µm (matrix size: 768x768). The spot
size of the x-ray source was 0.6 mm with 15° divergence and was operated in pulsed mode. The
tube potential was fixed at 70 kVp; the effective tube currents tested were 15, 10 and 5 mA with
exposure time 20 ms. An aluminum filter of 2 mm was applied in addition to the 2.5-mm
(equivalent Al) inherent filter. The motor rotates in an orbital range of 360° collecting 720
projections with a total duration scan of 1 min. The projections were corrected for offset, gain
and defects only, and a geometric calibration provided projection matrices to capture the source-
detector position and orientation of each acquisition.
At 70kVp with 360° and 20 ms per acquisition, the dose measurement was directly performed
on the detector (R 225 ACS Ralco). The absorbed dose was 0.5 mGy at 5 mA, 0.8 mGy at 10
mA and 1.2 mGy at 15 mA.
Specimen and imaging acquisition
One knee specimen from the Institute of Anatomy, Paris Descartes University, was used. The
subjects willed their body to science and were anonymous. The study was approved by the
Ethics Committee of Paris University, Paris. The Tissues collection was approved by Direction
Générale de la Recherche et de l’Innovation-Cellule Bioéthique (n°DC-2018-3366). The
collection of these human tissue specimens was performed in accordance with their guidelines
and regulation. Because of this regulation, no data were available regarding the cause of death,
previous illnesses, or medical treatments of this individual. After soft-tissue removal, the knee
specimen was stored at −20°C, then scanned in an upright position.

12
Image reconstruction
In the first scenario, decreasing angular subsample (DAS), the number of projections was
reduced from 400 to 80, with a reduction of 40 projections for each reconstruction, but a fixed
angular range at 200°. In the second scenario, decreasing angular range (DAR), both the number
of projections and angular range were reduced in parallel, from 200° to 140°, with number of
projections ranging from 200 to 140. These two scenarios were tested with three different
currents: 15, 10, and 5mA (Fig. 1A).
Analytical reconstruction methods such as FBP have been adapted considering conical
acquisition geometry and were developed by Feldkamp, Davis and Kress in 1984.4 The FDK
algorithm is based on three main steps. First, a cosine weight is applied to the projections. Then,
the projections are filtered in the frequency domain using a ramp filter combined with a Hann
window. Finally, the filtered projections are back-projected to reconstruct the volume (Fig. 1B).
The state of the art for the algebraic method, the ART, is based on projective method
developed by G. Herman and coworkers, it seeks to minimize the “alpha” value, the
approximate value reducing the distance between P and [A].18 Alpha is calculated by the least
square method:
J(α)= ∥P−[A].α∥² (1)
where α is the operator matrix projection, all projective methods look for the alpha value to
minimize J(α), a convex function, which is noted by:
α=argminJ(α) (2)
We used SART-TV, projections were ordered to optimize entropy between two consecutive
projections as the subset size was set to 1 projection (i.e., one angle at once) (Fig. 1B).20 The
convergence is calculated by measuring the differences between two iterations in the images,
in our case 4 iterations have been necessary. To improve image quality and reduce noise with
a good convergence rate, the convergence does not take place toward a point but toward a zone

13
and the zone depends on the starting point. Moreover, TV regularization was added to increase
image quality in case of sparse acquisitions.21
Image reconstructions in 16 bits obtained with the two reconstruction methods (FDK and
SART-TV) for the different scenarios showed variable quality of images (Fig. 2).
Segmentation method
We previously developed a semi-automatic segmentation method of the joint space on CT
images.30 Briefly, the method is applied on the frontal view, and a region of interest
corresponding to the medial compartment of the knee is manually selected. For removing noise,
a circular averaging filter within the square matrix of 8 size is used. For extracting bone from
soft tissues, a hysteresis threshold method using the quantile of grayscale followed by
morphological operations (closing and opening operators) is used. Finally, the user draws 15
control points in the pertinent region for initializing the snake model. The process involves
using MATLAB. We compared the segmentation results between the referent reconstructions
and the different scenarios.
Image quality analysis
Frontal and transverse views of the reconstructions were selected from the three situations
mentioned above. Finally, we randomly displayed 90 anonymized images: 6 reference images
(720 projections, 360°) performed at different currents: 15, 10, and 5 mA with the 2 methods
of reconstruction, FDK and SART-TV, for 42 images with decreasing number of projections
and fixed 200° rotation angle (scenario DAS) and 42 images with decreasing number of
projections and rotation angle 200° to 140° (scenario DAR).
In total, 12 physicians — 6 orthopedic surgeons (5 junior resident and 1 senior surgeon with an
experience of 20 years) and 5 junior radiologist residents and 1 rheumatologist with an
experience of 20 years in quantitative analysis in osteo-articular diseases and bone imaging —
scored images with blinding by using a Likert scale from 1, very poor; 2, poor; 3, acceptable;
14
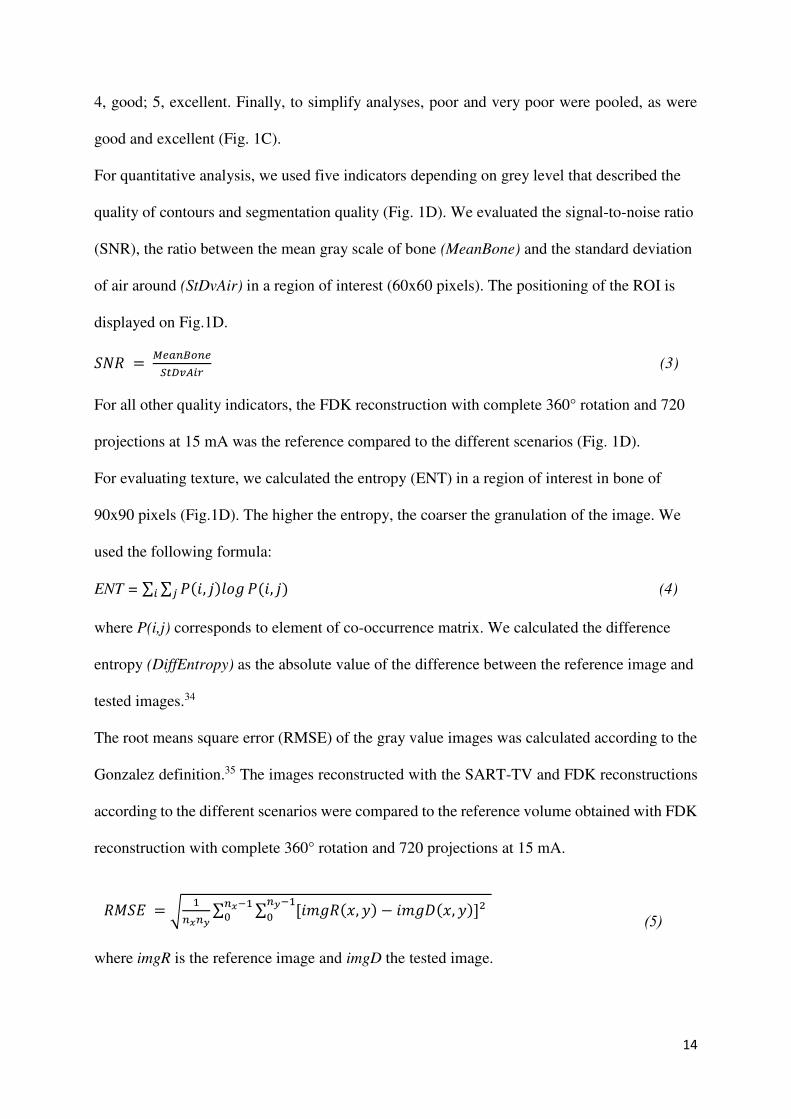
4, good; 5, excellent. Finally, to simplify analyses, poor and very poor were pooled, as were
good and excellent (Fig. 1C).
For quantitative analysis, we used five indicators depending on grey level that described the
quality of contours and segmentation quality (Fig. 1D). We evaluated the signal-to-noise ratio
(SNR), the ratio between the mean gray scale of bone (MeanBone) and the standard deviation
of air around (StDvAir) in a region of interest (60x60 pixels). The positioning of the ROI is
displayed on Fig.1D. 𝑆𝑁𝑅 = 𝑀𝑒𝑎𝑛𝐵𝑜𝑛𝑒𝑆𝑡𝐷𝑣𝐴𝑖𝑟 (3)
For all other quality indicators, the FDK reconstruction with complete 360° rotation and 720
projections at 15 mA was the reference compared to the different scenarios (Fig. 1D).
For evaluating texture, we calculated the entropy (ENT) in a region of interest in bone of
90x90 pixels (Fig.1D). The higher the entropy, the coarser the granulation of the image. We
used the following formula:
ENT = ∑ ∑ 𝑃(𝑖, 𝑗)𝑙𝑜𝑔 𝑃(𝑖, 𝑗)𝑗𝑖 (4)
where P(i,j) corresponds to element of co-occurrence matrix. We calculated the difference
entropy (DiffEntropy) as the absolute value of the difference between the reference image and
tested images.34
The root means square error (RMSE) of the gray value images was calculated according to the
Gonzalez definition.35 The images reconstructed with the SART-TV and FDK reconstructions
according to the different scenarios were compared to the reference volume obtained with FDK
reconstruction with complete 360° rotation and 720 projections at 15 mA.
(5)
where imgR is the reference image and imgD the tested image.
𝑅𝑀𝑆𝐸 = √ 1𝑛𝑥𝑛𝑦 ∑ ∑ [𝑖𝑚𝑔𝑅(𝑥, 𝑦) − 𝑖𝑚𝑔𝐷(𝑥, 𝑦)]²𝑛𝑦−10𝑛𝑥−10

15
Then we used the structural similarity index (SSIM) plugin developed by Renieblas et al. and
defined in the following formula:36
(6)
The small constants C1, C2 stabilize the computation of the equations when denominators
become small with C1= (0.01*L)2 and C2=(0.03*L)2 where L is the grey level number of the
image therefore 65025.
These methods assessing perceptual image quality allowed for quantifying errors between a
distorted image and the reference image. SSIM gives edge information between the reference
and test images.36 These two metrics are classically used to assess model performance.37
To evaluate segmentation results of the knee joint space from the frontal central image,
similarity coefficient index DICE values were calculated, with the coefficient defined as
follows:
𝐷𝐼𝐶𝐸 (𝑆𝑒𝑔𝑅𝑒𝑓 , 𝑆𝑒𝑔𝐷𝑒𝑔) = 2(𝑆𝑒𝑔𝑅𝑒𝑓∩ 𝑆𝑒𝑔𝐷𝑒𝑔)(𝑆𝑒𝑔𝑅𝑒𝑓 + 𝑆𝑒𝑔𝐷𝑒𝑔) (7)
where 𝑆𝑒𝑔𝑅𝑒𝑓 is the JS segmentation from the reference image considered as ground truth and 𝑆𝑒𝑔𝐷𝑒𝑔 is the JS segmentation from the tested images. The DICE values range from 0 to 1;
DICE = 1 means complete overlap; DICE 0–1, partial overlap; and DICE = 0, no overlap. A
DICE value > 0.7 has been reported as good similarity performance.38
Acknowledgements
We acknowledge the financial support of the program FUI-3Dc4arm.
Competing interests
SSIM(x,y) = (2𝜇𝐼𝑚𝑔𝑅𝜇𝐼𝑚𝑔𝐷+𝐶1)(2𝜎𝐼𝑚𝑔𝑅𝜎𝐼𝑚𝑔𝐷+𝐶2)(𝜇𝐼𝑚𝑔𝑅2 +𝜇𝐼𝑚𝑔𝐷2 +𝐶1)(𝜎𝐼𝑚𝑔𝑅2 +𝜎𝐼𝑚𝑔𝐷2 +𝐶2)
16
Two of the authors of this manuscript (Guillaume Bernard and Fanny Morin) are employees
of Thales AVS. The remaining authors declare that they have no competing interests.
References
1. Ning R, et al. Flat panel detector-based cone-beam volume CT angiography imaging:
system evaluation. IEEE Trans Med Imaging 19(9) 949–963 (2000).
2. Siewerdsen JH, et al. Volume CT with a flat-panel detector on a mobile, isocentric C-
arm: pre-clinical investigation in guidance of minimally invasive surgery. Medical
Physics 32(1) 241–254 (2005).
3. Gupta R, et al. Ultra-high resolution flat-panel volume CT: fundamental principles,
design architecture, and system characterization. European Radiology 16(6) 1191–1205
(2006).
4. Feldkamp LA, Davis LC, Kress JW. Practical cone-beam algorithm. Journal Optical
Society America 1 (6) 612–619 (1984).
5. Pohlenz P, et al. Clinical indications and perspectives for intraoperative cone-beam
computed tomography in oral and maxillofacial surgery. Oral Surgury Oral Medicine
Oral Patholology Oral Radiology Endodocrinology 103(3) 412–417 (2007).
6. Schouten R, et al. Intra-operative cone-beam CT (O-arm) and stereotactic navigation in
acute spinal trauma surgery. Journal Clinical Neuroscience 19(8) 1137–1143 (2012).
7. Tabaraee E, et al. Intraoperative cone beam-computed tomography with navigation (O-
ARM) versus conventional fluoroscopy (C-ARM): a cadaveric study comparing
accuracy, efficiency, and safety for spinal instrumentation. Spine 38(22) 1953–1958
(2013).

17
8. Khoury A, et al. Intraoperative cone-beam CT for correction of periaxial malrotation of
the femoral shaft: a surface-matching approach. Medical Physics 34 (4) 1380–1387
(2007).
9. Khoury A, et al. Intraoperative cone-beam CT for image-guided tibial plateau fracture
reduction. Computer Aided Surgery 12 (4) 195-207 (2007).
10. Fahrig R, et al. Dose and image quality for a cone-beam C-arm CT system: Cone-beam
C-arm CT system. Medical Physics 33(12) 4541–4550 (2006).
11. Akpek S, Brunner T, Benndorf G, Strother C. Three-dimensional imaging and cone beam
volume CT in C-arm angiography with flat panel detector. Diagnostic Interventional
Radiology 11(3), 10–13 (2005).
12. Chau AC, Fung K. Comparison of radiation dose for implant imaging using conventional
spiral tomography, computed tomography, and cone-beam computed tomography. Oral
Surgury Oral Medicine Oral Patholology Oral Radiology Endodocrinology 107(4) 559-
65 (2009).
13. Amiri S, Wilson DR, Masri BA, Anglin C. A low-cost tracked C-arm (TC-arm) upgrade
system for versatile quantitative intraoperative imaging. International Journal Computer
Assisted Radiology and Surgery 9(4) 695–711 (2014).
14. Orth RC, Wallace MJ, Kuo MD. Technology Assessment Committee of the Society of
Interventional Radiology: C-arm cone-beam CT: general principles and technical
considerations for use in interventional radiology. Journal Vascular Interventional
Radiology 19(6) 814–820 (2008).
15. Kalender WA. Dose in x-ray computed tomography. Physics in Medicine and Biology
59(3) R129-150 (2014).
16. Singh S, et al. Adaptive statistical iterative reconstruction technique for radiation dose
reduction in chest CT: a pilot study. Radiology 259:565-73 (2011).

18
17. Alshamari M, Geijer M, Norrman E, Geijer H. Low-dose computed tomography of the
lumbar spine: a phantom study on imaging parameters and image quality. Acta
Radiologica 55(7) 824–832 (2014).
18. Gordon R, Bender R, and Herman GT. Algebraic reconstruction techniques (ART) for
three-dimensional electron microscopy and X-ray photography. Journal of Theoretical
Biology 29(3), 471-481 (1970).
19. Kak AC and Slaney M. Principles of Computerized Tomographic Imaging, Society of
Industrial and Applied Mathematics, Collection: classics in applied mathematics, e-
books (2001).
20. Andersen AH, Kak AC Simultaneous algebraic reconstruction technique (SART): a
superior implementation of the art algorithm. Ultrasonic Imaging 6 (1) 81-94(1984).
21. Bian J, et al. Evaluation of sparse-view reconstruction from flat-panel-detector cone-
beam CT. Physics in Medicine and Biology . (2010)
22. Conlan, TK, Beebe, MJ, Weinlein JC. New Imaging, Diagnostic, and Assessment
Techniques in Orthopedic Trauma. Orthopaedic Clinical North America 50 (1) 47–56
(2019).
23. Willemink MJ, et al. Iterative reconstruction techniques for computed tomography part
2: initial results in dose reduction and image quality. European Radiology 23(6):1632-
42 (2013).
24. Gervaise A, et al. CT image quality improvement using Adaptive Iterative Dose
Reduction with wide-volume acquisition on 320-detector CT. European Radiology 22
(2) 295–301 (2012).
25. Yang C-H, et al. Imaging quality and diagnostic reliability of low-dose computed
tomography lumbar spine for evaluating patients with spinal disorders. Spine Journal
14(11) 2682–2690 (2014).

19
26. Stiller W. Basics of iterative reconstruction methods in computed tomography: A
vendor-independent overview. European Journal Radiology Dec 109 147–154 (2018).
27. Wang Z, Bovik AC, Sheikh HR, Simoncelli EP (2004) Image quality assessment: from
error visibility to structural similarity. IEEE Transactions Image Processing 13(4) :600-
12.
28. Mason A, et al. Comparison of Objective Image Quality Metrics to Expert Radiologists'
Scoring of Diagnostic Quality of MR Images. IEEE Transactions Medical Imaging 39
(4): 1064-1072 (2020).
29. Taha AA, Hanbury A. Metrics for evaluating 3D medical image segmentation: analysis,
selection, and tool. BMC Medical Imaging 12 15-29 (2015).
30. Mezlini-Gharsallah H, Youssef R, Uk S, Laredo JD, Chappard C. Three-dimensional
mapping of the joint space for the diagnosis of knee osteoarthritis based on high
resolution computed tomography: Comparison with radiographic, outerbridge, and
meniscal classifications. Journal Orthopedic Research 36 (9) 2380–2391(2018).
31. Stayman W and Siewerdsen J. Task-based trajectories in iteratively re-constructed
interventional cone-beam CT. in Proceedings of the 12th Meeting on Fully Three-
Dimensional Imaging Reconstruction in Radiology and Nuclear Medicine (Lake Tahoe,
2013): 257–260.
32. Gang GJ, Stayman JW, Zbijewski W, Siewerdsen JH. Task-based detectability in CT
image reconstruction by filtered backprojection and penalized likelihood estimation.
Medical Physics 41(8): 081902 (2014).
33. Zhang H, et al. Iterative metal artifact reduction for x-ray computed tomography using
unmatched projector/backprojector pairs. Medical Physics 43(6):3019-3033 (2016).
34. Lui Z, Laganière R. Phase congruence measurement for image similarity assessement.
Pattern Recognition Letters 28 (1): 166-172 (2005).

20
35. Gonzalez RC, Woods RE. Digital image processing, 3rd ed. ed. Prentice Hall, Upper
Saddle River, N.J. (2008)
36. Renieblas GP, et al. Structural similarity index family for image quality assessment in
radiological images. Journal Medical Imaging (Bellingham) 4(3), 035501 (2017).
37. Pedersen M. Full-Reference Image Quality Metrics: Classification and Evaluation. FNT
in Computer Graphics and Vision 7, 1–80 (2011).
38. Zijdenbos AP, Dawant BM, Margolin RA, Palmer AC. Morphometric analysis of white
matter lesions in MR images: method and validation. IEEE Transactions on Medical
Imaging 13(4) 716–724 (1994).
Acknowledgements
We acknowledge the financial support of the program FUI-3Dc4arm.
Competing interests
Two of the authors of this manuscript (Guillaume Bernard and Fanny Morin) are employees
of Thales AVS. The remaining authors declare that they have no competing interests.
Figure Legends
Figure 1. Description of the protocol performed on one knee specimen, acquisition and different
scenarios of reconstruction (A), reconstruction methods with the number of volume
reconstructs (B), qualitative analysis (C) and quantitative analysis (D).
Figure 2. Signal-to-noise ratio (SNR) according to projection number with fixed angular range
of acquisition, 200°, and various projection numbers (decreasing angular subsample scenario)
for the two methods of reconstruction: SART-TV (A) and FDK (A).

21
SNR according to the projection number with variable angular range of acquisitions from
200°to 140° with equivalent number of projections (decreasing angular range scenario)
reconstructed with the two methods: SART-TV (B) and FDK (B).
Figure 3. Differences in entropy compared to the reference image (15 mA, 360°,720
projections) in a region of interest inside bone according to the projection number with a fixed
angular range of acquisition: 200° and various projection numbers (scenario decreasing
angular subsample) for the two methods of reconstruction: SART-TV (A) and FDK (A).
Differences in entropy compared to the reference image (15 mA, 360°,720 projections) in a
region of interest inside bone according to the projection number with an angular range of
acquisition from 200° to 140° and the same number of projections for the two methods of
reconstruction: SART-TV (B) and FDK (B).
Figure 4. Qualitative analysis and root mean square error (RMSE) values with decreasing
number of projections and a fixed angular rotation of 200° with 3 different currents, 15, 10
and 5 mA, for the two methods of reconstruction: SART-TV and FDK. The right abscissa is
the number of observers and the left is the RMSE.
Figure 5. Qualitative analysis and RMSE values with decreasing number of projections and
decreasing angular range from 200° to 140° with 3 currents, 15, 10 and 5 mA, for the two
methods of reconstruction: SART-TV and FDK. The right abscissa is the number of observers
and the left is the Structural Similarity Index (SSIM) value varying from 1 to 0 (1 is perfect
similarity and 0 absence of similarity).
Figure 6. SSIM values according to projection number with fixed angular range of
acquisition, 200°, and projection number from 400 to 80 (decrease number of projections,
circles) and from 200° to 140° (decrease angular range, lozenges) for the two methods of
reconstruction: SART-TV and FDK.

22
Figure 7. Distribution of DICE results according to the SNR for decreasing number of
projections at 200° (decrease number of projections, upper graph) and decreasing angular
range from 200° to 140° (decrease angular range, bottom graph). Circles correspond to
SART-TV and squares to FDK. The SNR for the reference image (360° rotation, 720
projections, 15 mA and FDK.
Figure 8. Image quality of the two reconstruction methods (Feldkamp-Davis-Kress [FDK] and
simultaneous algebraic reconstruction technique [SART]) with a fixed angular range, 200°,
and decrease in projection number — 400 projections (A1) and 80 projections (A2) — and
decrease in angular range — 200° with 200 projections (B1) and 140° with 140 projections
(B2).

23
Figure 1

24
Figure 2 :
A
B

25
Figure 3 :
A B

26
Figure 4 :

27
Figure 5 :

28
Figure 6 :
0.4
0.5
0.6
0.7
0.8
0.9
1
80120160200240280320360400
SS
IM
projections number
SART
15 mA 15 mA 10 mA 10 mA 5 mA 5 mA
0.4
0.5
0.6
0.7
0.8
0.9
1
80120160200240280320360400
SS
IM
projections number
FDK
15 mA 15 mA 10 mA 10 mA 5 mA 5 mA
29
Figure 7 :

30
Figure 8
SART
-TV
1 2
2 1
SART- FD
K
FD
K
1 2
SART-
SART-
FD
2
1
1
FD

Figures
Figure 1
Description of the protocol performed on one knee specimen, acquisition and different scenarios ofreconstruction (A), reconstruction methods with the number of volume reconstructs (B), qualitativeanalysis (C) and quantitative analysis (D).

Figure 2
Signal-to-noise ratio (SNR) according to projection number with �xed angular range of acquisition, 200°,and various projection numbers (decreasing angular subsample scenario) for the two methods ofreconstruction: SART-TV (A) and FDK (A). SNR according to the projection number with variable angularrange of acquisitions from 200°to 140° with equivalent number of projections (decreasing angular rangescenario) reconstructed with the two methods: SART-TV (B) and FDK (B).

Figure 3
Differences in entropy compared to the reference image (15 mA, 360°,720 projections) in a region ofinterest inside bone according to the projection number with a �xed angular range of acquisition: 200°and various projection numbers (scenario decreasing angular subsample) for the two methods ofreconstruction: SART-TV (A) and FDK (A). Differences in entropy compared to the reference image (15 mA,360°,720 projections) in a region of interest inside bone according to the projection number with anangular range of acquisition from 200° to 140° and the same number of projections for the two methodsof reconstruction: SART-TV (B) and FDK (B).

Figure 4
Qualitative analysis and root mean square error (RMSE) values with decreasing number of projectionsand a �xed angular rotation of 200° with 3 different currents, 15, 10 and 5 mA, for the two methods ofreconstruction: SART-TV and FDK. The right abscissa is the number of observers and the left is the RMSE.

Figure 5
Qualitative analysis and RMSE values with decreasing number of projections and decreasing angularrange from 200° to 140° with 3 currents, 15, 10 and 5 mA, for the two methods of reconstruction: SART-TVand FDK. The right abscissa is the number of observers and the left is the Structural Similarity Index(SSIM) value varying from 1 to 0 (1 is perfect similarity and 0 absence of similarity).

Figure 6
SSIM values according to projection number with �xed angular range of acquisition, 200°, and projectionnumber from 400 to 80 (decrease number of projections, circles) and from 200° to 140° (decreaseangular range, lozenges) for the two methods of reconstruction: SART-TV and FDK.
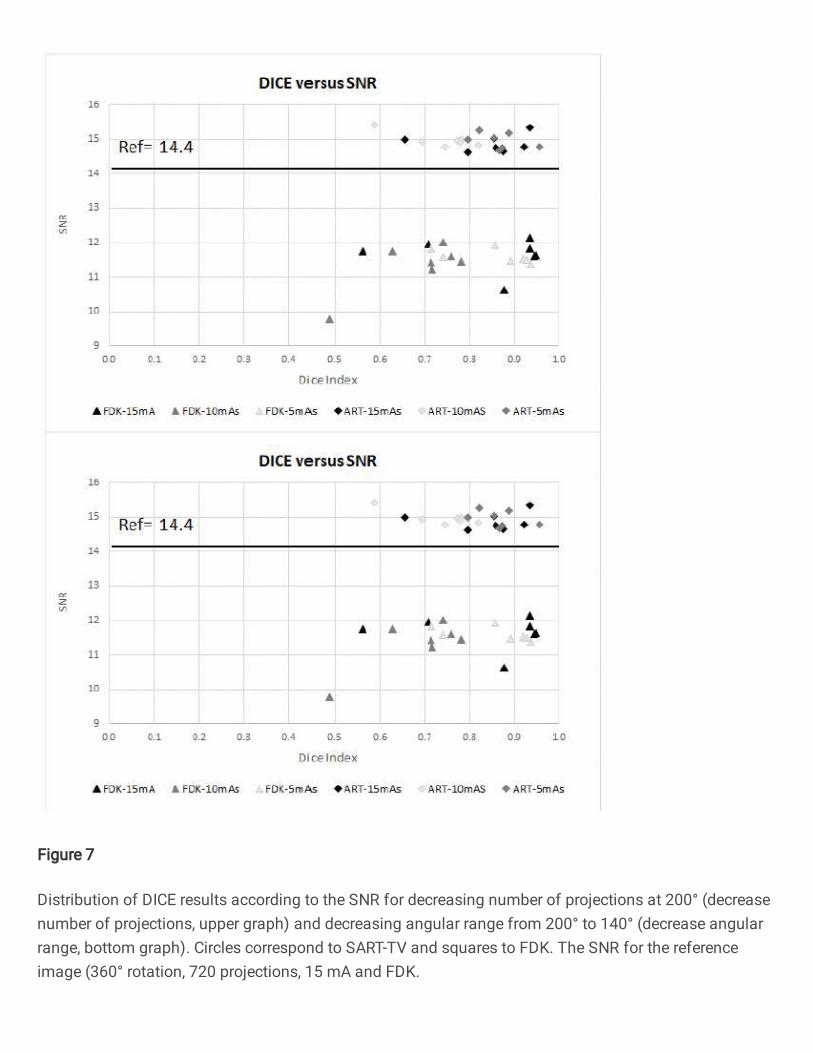
Figure 7
Distribution of DICE results according to the SNR for decreasing number of projections at 200° (decreasenumber of projections, upper graph) and decreasing angular range from 200° to 140° (decrease angularrange, bottom graph). Circles correspond to SART-TV and squares to FDK. The SNR for the referenceimage (360° rotation, 720 projections, 15 mA and FDK.

Figure 8
Image quality of the two reconstruction methods (Feldkamp-Davis-Kress [FDK] and simultaneousalgebraic reconstruction technique [SART]) with a �xed angular range, 200°, and decrease in projectionnumber — 400 projections (A1) and 80 projections (A2) — and decrease in angular range — 200° with 200projections (B1) and 140° with 140 projections (B2).