Embed Size (px)
Citation preview

CONTRACT REPORT
CR-07-021-ENV
BIODEGRADATION OF DENSE NON-AQUEOUS PHASE LIQUIDS (DNAPLs) THROUGH BIOAUGMENTATION OF SOURCE AREAS DOVER NATIONAL TEST SITE, DOVER, DELAWARE by Naval Facilities Engineering Service Center and Geosyntec Consultants May 2007
ENGINEERING SERVICE CENTERPort Hueneme, California 93043-4370
Approved for public release; distribution is unlimited.

Environmental Security Technology Certification Program (ESTCP)
FINAL REPORT for
Biodegradation of Dense Non-Aqueous Phase Liquids (DNAPLs) Through Bioaugmentation of Source Areas Dover National Test Site, Dover, Delaware
ESTCP Project Number ER-0008
May 2007
Revision 3.0

ER0008 ii 2007.05.24 Revision 3.0
TABLE OF CONTENTS
Page
1. INTRODUCTION...........................................................................................................1
1.1 Background......................................................................................................................1
1.2 Objectives of the Demonstration .....................................................................................5
1.3 Regulatory Drivers...........................................................................................................6
1.4 Stakeholder/End-User Issues ...........................................................................................6
2. TECHNOLOGY DESCRIPTION...................................................................................8
2.1 Technology Development and Application .....................................................................8
2.2 Molecular Characterization Techniques ........................................................................12
2.3 Stable Carbon Isotope Analysis .....................................................................................13
2.4 Previous Testing of the Technology ..............................................................................13
2.5 Factors Affecting Cost and Performance.......................................................................14
2.6 Advantages and Limitations of the Technology ............................................................15
3. DEMONSTRATION DESIGN.....................................................................................16
3.1 Performance Objectives .................................................................................................17
3.2 Selecting Test Site..........................................................................................................18
3.3 Test Site Description......................................................................................................21
3.4 Pre-Demonstration Testing and Analysis ......................................................................26
2.1.1 Analytical Tools to Support the Assessment of Biodegradation ...............................12
3.3.1 Facility History ..........................................................................................................22
3.3.2 Site Description..........................................................................................................23
3.3.3 Environmental Setting and Geology..........................................................................23
3.3.4 Hydrogeology ............................................................................................................24
3.3.5 Contaminant Distribution within the Test Cell..........................................................25

ER0008 iii 2007.05.24 Revision 3.0
3.5 Testing and Evaluation Plan ..........................................................................................28
3.6 Selection of Analytical/Testing Method ........................................................................41
3.7 Selection of Analytical/Testing Laboratory...................................................................41
4. PERFORMANCE ASSESSMENT...............................................................................43
4.1 Performance Criteria......................................................................................................43
4.2 Performance Confirmation Methods..............................................................................47
4.3 Data Analysis, Interpretation, and Evaluation of Laboratory Demonstration ...............47
4.4 Data Analysis, Interpretation, and Evaluation of Field Demonstration.........................49
5. COST ASSESSMENT ..................................................................................................63
3.4.1 Pre Design Laboratory Studies ..................................................................................26
3.4.2 Preliminary Test Cell Investigation ...........................................................................27
3.4.3 DNAPL Release.........................................................................................................27
3.5.1 Demonstration Installation and Start-Up ...................................................................31
3.5.2 Period of Operation....................................................................................................36
3.5.3 Amount/Treatment Rate of Material to be Treated....................................................37
3.5.4 Residuals Handling ....................................................................................................37
3.5.5 Operating Parameters for the Technology .................................................................38
3.5.6 Experimental Design..................................................................................................39
3.5.7 Sampling Plan ............................................................................................................40
3.5.8 Demobilization...........................................................................................................41
4.4.1 Tracer Testing ............................................................................................................52
4.4.2 Phase 2 - Baseline ......................................................................................................53
4.4.3 Phase 3 - Biostimulation ............................................................................................54
4.4.4 Phase 4 - Bioaugmentation ........................................................................................55
4.4.5 Phase 5 – Post Bioaugmentation................................................................................57
4.4.6 Molecular Monitoring................................................................................................58
4.4.7 Carbon Compound Specific Isotope Monitoring.......................................................58
4.4.8 Summary of Field Demonstration Results.................................................................61

ER0008 iv 2007.05.24 Revision 3.0
5.1 Cost Reporting ...............................................................................................................63
5.2 Cost Analysis .................................................................................................................64
6. IMPLEMENTATION ISSUES.....................................................................................79
6.1 Environmental Checklist................................................................................................79
6.2 Other Regulatory Issues.................................................................................................80
6.3 End-User Issues .............................................................................................................80
7. REFERENCES..............................................................................................................82
8. POINTS OF CONTACT ...............................................................................................87
6.1.1 Regulatory Issues .......................................................................................................79
6.1.2 Hazardous Material Storage.......................................................................................80
6.1.3 Air Discharge .............................................................................................................80
6.1.4 Wastewater Discharge ...............................................................................................80
6.1.5 Waste Storage, Treatment, and Disposal ...................................................................80
6.3.1 Technology Transfer..................................................................................................81
ER0008 v 2007.05.24 Revision 3.0
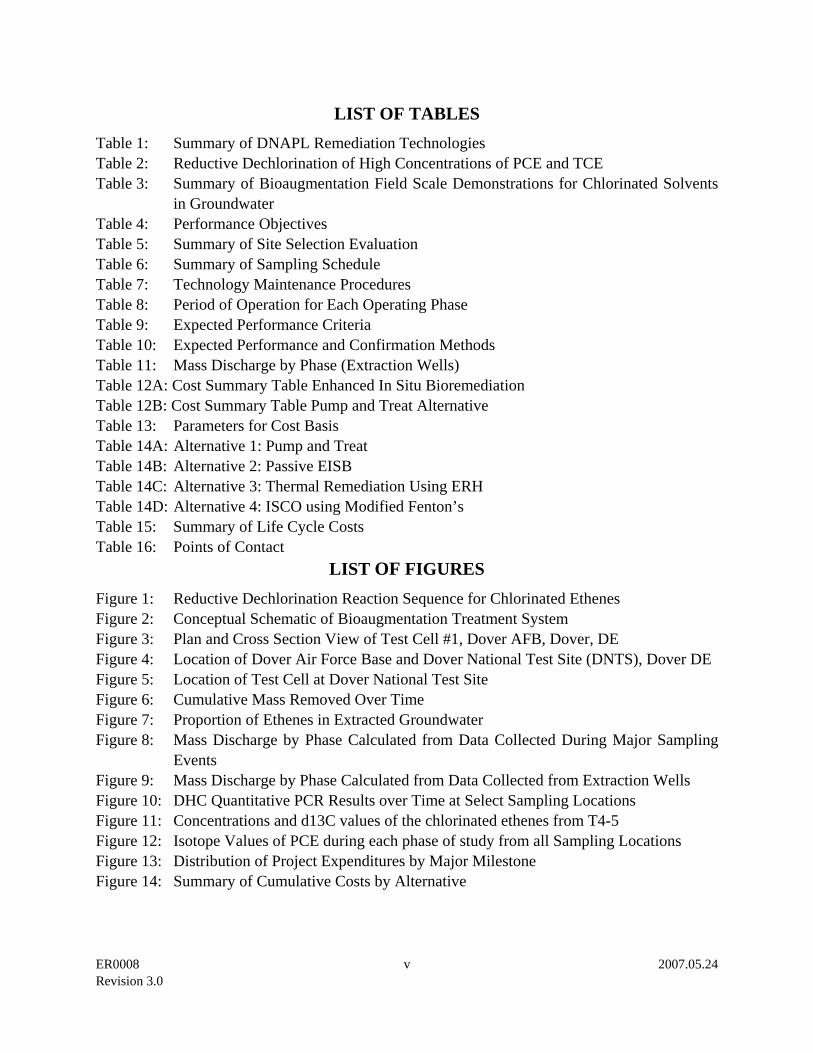
LIST OF TABLES Table 1: Summary of DNAPL Remediation Technologies Table 2: Reductive Dechlorination of High Concentrations of PCE and TCE Table 3: Summary of Bioaugmentation Field Scale Demonstrations for Chlorinated Solvents
in Groundwater Table 4: Performance Objectives Table 5: Summary of Site Selection Evaluation Table 6: Summary of Sampling Schedule Table 7: Technology Maintenance Procedures Table 8: Period of Operation for Each Operating Phase Table 9: Expected Performance Criteria Table 10: Expected Performance and Confirmation Methods Table 11: Mass Discharge by Phase (Extraction Wells) Table 12A: Cost Summary Table Enhanced In Situ Bioremediation Table 12B: Cost Summary Table Pump and Treat Alternative Table 13: Parameters for Cost Basis Table 14A: Alternative 1: Pump and Treat Table 14B: Alternative 2: Passive EISB Table 14C: Alternative 3: Thermal Remediation Using ERH Table 14D: Alternative 4: ISCO using Modified Fenton’s Table 15: Summary of Life Cycle Costs Table 16: Points of Contact
LIST OF FIGURES Figure 1: Reductive Dechlorination Reaction Sequence for Chlorinated Ethenes Figure 2: Conceptual Schematic of Bioaugmentation Treatment System Figure 3: Plan and Cross Section View of Test Cell #1, Dover AFB, Dover, DE Figure 4: Location of Dover Air Force Base and Dover National Test Site (DNTS), Dover DE Figure 5: Location of Test Cell at Dover National Test Site Figure 6: Cumulative Mass Removed Over Time Figure 7: Proportion of Ethenes in Extracted Groundwater Figure 8: Mass Discharge by Phase Calculated from Data Collected During Major Sampling
Events Figure 9: Mass Discharge by Phase Calculated from Data Collected from Extraction Wells Figure 10: DHC Quantitative PCR Results over Time at Select Sampling Locations Figure 11: Concentrations and d13C values of the chlorinated ethenes from T4-5 Figure 12: Isotope Values of PCE during each phase of study from all Sampling Locations Figure 13: Distribution of Project Expenditures by Major Milestone Figure 14: Summary of Cumulative Costs by Alternative

ER0008 vi 2007.05.24 Revision 3.0
LIST OF APPENDICES Appendix A: Analytical Methods Supporting the Design Appendix B: Analytical Methods Supporting the Sampling Plan Appendix C: Quality Assurance Project Plan Appendix D: Health and Safety Plan Appendix E: Summary of Laboratory Experiments Appendix F: Site Information Appendix G: Analysis of Tracer Testing Appendix H: Measurement of Solute Mass Discharge Appendix I: Summary of Field Operations Appendix J: Summary of Field Parameter Measurements Appendix K: Laboratory Analytical Results and Volatile Organic Compound Trend Plots

ER0008 vii 2007.05.24 Revision 3.0
LIST OF ACRONYMS bgs Below Ground Surface cis-1,2-DCE cis-1,2-Dichloroethene CO2 Carbon Dioxide CPT Cone Penetrometer Testing DAFB Dover Air Force Base DGGE Denaturing Gradient Gel Electrophoresis Dhc Dehalococcoides Ethenogenes DHG Dissolved Hydrocarbon Gases (e.g., methane) DNAPL Dense Non-Aqueous Phase Liquid DNTS Dover National Test Site DoD Department of Defense DOE Department of Energy DO Dissolved Oxygen DOT Department of Transportation ED Electron Donor ESTCP Environmental Security Technology Certification Program EPA Environmental Protection Agency GAC Granulated Activated Carbon GPR Ground Penetrating Radar GRFL Groundwater Remediation Field Laboratory HASP Health and Safety Plan MCL Maximum Contaminant Level MSDS Material Safety Data Sheet NAS Naval Air Station NFESC Naval Facilities Engineering Service Center NPV Net Present Value O&M Operations and Maintenance OSU Oregon State University ORP Oxidation Reduction Potential OSHA Occupational Safety and Health Administration PCE Perchloroethene (or tetrachloroethene) ppb Parts Per Billion

ER0008 viii 2007.05.24 Revision 3.0
LIST OF ACRONYMS (CONTINUED) PTC Pilot Test Cell QAPP Quality Assurance Project Plan RPM Remedial Project Manager SCIA Stable Carbon Isotope Analysis TCE Trichloroethene UofT University of Toronto USEPA United States Environmental Protection Agency UW University of Wyoming VC Vinyl Chloride VFA Volatile Fatty Acid VOC Volatile Organic Compound

ER0008 ix 2007.05.24 Revision 3.0
ACKNOWLEDGEMENTS This report has been prepared jointly by the Naval Facilities Engineering Service Center
(NFESC) and by Geosyntec Consultants Incorporated (Geosyntec). NFESC and Geosyntec gratefully acknowledge the work completed by the following organizations in support of this project:
• University of Toronto (Drs. E. Edwards, B. Sherwood Lollar, P. Morrill, K. Mo, and B. Sleep, Mr. D. Seepersad and Ms. C. Heidorn.
• Dover National Test Site (Mr. T. McHale, Ms. Dale Williams and Mr. R. Young).
ER0008 x 2007.05.24 Revision 3.0
EXECUTIVE SUMMARY
This demonstration evaluated the use of biological processes to enhance the dissolution of a tetrachloroethene (PCE) from an aquifer known to have PCE present in a dense non-aqueous phase liquid (DNAPL) form. There are no currently available, proven technologies that can reliably remove 100% of DNAPL (both free product and residual) mass. There is a critical need for technologies that can effectively treat DNAPL sources in the saturated zone, resulting in both destruction and containment with reduced treatment times and lower costs. The approach of this demonstration was to introduce naturally-occurring, dehalo-respiring microbial consortia that function at the solubility limits of chlorinated solvents, into DNAPL source areas. Bioaugmentation is an in situ remediation approach where complete dechlorination of chlorinated ethenes is stimulated by supplying microorganisms that have demonstrated the ability to completely dechlorinate chlorinated ethenes in the presence of the appropriate electron donors and nutrients. The objective is for the microorganisms to enhance rates of biodegradation at the DNAPL:water interface thereby increasing the concentration gradient driving DNAPL dissolution. Increasing the concentration gradient will result in more rapid DNAPL dissolution and a reduction in the time required for cleanup. In summary this demonstration was successful and was able to prove that biological systems can be applied and promote enhanced dissolution of a PCE DNAPL.
Prior to field demonstration, a comprehensive laboratory study, conducted by researchers at the University of Toronto, was completed. This work was both a pre-cursor of field work and served to confirm observations seen in the field. Microcosm studies evaluated the thresholds of aqueous phase degradation for PCE and a 2-dimensional (2-D) model aquifer study, using a control (biostimulation) box and bioaugmented (amended with KB-1) box were designed to evaluate the objectives of the demonstration listed above. The 2-D model aquifer study results were published by Sleep et al. (2006) and several related publications and presentations have been made as a result of this research effort (e.g., Seepersad, 2004). This research was co-funded by other agencies (e.g., NSERC and Ontario graduate scholarships). The 2-D studies concluded that a three-fold enhancement of PCE dissolution occurred about 100 days after bioaugmentation, while without bioaugmentation PCE degradation was not observed. The study, also found that delivering electron donor to the DNAPL source area was challenging and that for portions of the experiment the areas very close to the DNAPL were electron donor limited. Similar results were observed in the field demonstration as discussed below. During the 2-D box studies many analyses were completed to assess the changes in microbial populations within and between the two 2-D boxes. This work provided confirmatory results, through increases in the number and presence of dechlorinating organisms within the 2-D boxes.

ER0008 xi 2007.05.24 Revision 3.0
The field demonstration was conducted within one of the Test Cells at the Dover National Test Site. Previous researchers had released 100 L (~165 kg) of PCE into this enclosed cell. The release of the PCE was in both the unsaturated and saturated zones within the cell. Portions of the PCE remained in the vadose zone throughout this current demonstration, partially impacting the interpretation of the results. An SVE system was installed and successfully removed more than 18 kg of PCE.
The demonstration was instrumented to operate as a recirculation system with three extraction wells and three injection wells. Extracted groundwater was combined, treated with granular activated carbon (to remove VOCs, and more accurately simulate a natural gradient system). During biostimulation and bioaugmentation phases the groundwater was amended with electron donor prior to re-injection. This design provided gradient and generated almost no wastes (soil or water) requiring off-site treatment. Within the test cell were 13 multi-level monitoring points and four fully-screen monitoring wells. Sampling events were completed at the extraction wells and within the test cell (transect sampling events). Performance evaluations were made using the results obtained from transect sampling events and from the extraction wells. The results between the two measurements were useful and valuable for this demonstration. The table below summarizes the PCE equivalent mass discharge (in grams/day), for each operational phase, as calculated from the extraction wells and from transect sampling events.
PCE Equivalent Mass Discharge Calculated from Phase Major Sampling Events 1 Extraction Wells 1
Baseline 113 152
Biostimulation 67 55 Bioaugmentation 97 26
Post-bioaugmentation 73 31 1. expressed in PCE equivalent grams/day 2. See Appendix H for supporting information
The first phase (termed baseline) of the demonstration re-circulated groundwater until a “steady state” mass flux was observed. The relatively young age (recent spill) of PCE resulted in this phase being operated for over 9 months. During this phase key observations included: (i) high mass discharge at early time (likely due to the high surface area of mobile PCE stringers present within the test cell); (ii) no increase in PCE daughter products (the ratio of chlorinated ethene to total ethenes in groundwater remained constant with PCE representing more than 99.8% of the total ethenes; (iii) molecular characterization failed to detect dechlorinating organisms in the samples collected; and (iv) a “steady-state” mass discharge at the extraction wells, was never achieved, the mass discharge continued to decline until this phase was complete.

ER0008 xii 2007.05.24 Revision 3.0
Biostimulation was promoted through the addition of soluble electron donors (ethanol and lactate). Electron donor was amended at two times the stoichiometric demand of PCE (at saturation). The biostimulation phase lasted for just over 4 months. Key observations of this phase included: (i) continuation of an overall decrease in mass discharge, at the extraction wells; (ii) the dominant chlorinated ethene remained PCE, with PCE representing more than 99.8% of the total ethenes; and (iii) minor amounts of trichloroethene and cis-1,2-dichloroethene were observed at the end of the biostimulation phase, but the limited success of the control (biostimulation) 2-D box in the laboratory studies suggested it may take a long period to develop sufficient biomass. Furthermore the intent of the demonstration was to enhance source dissolution not evaluate the development of a microbial population.
Bioaugmentation was completed using 60L of KB-1 dechlorinating culture. The culture was added to each injection well and to two of the four fully screened monitoring wells. Electron donor addition continued (as listed above). Approximately four months after bioaugmentation all locations sampled in the test cell for Dehalococcoides reported at least 107 dechlorinating organisms per liter. Over this same time period the dominant chlorinated ethene at the extraction wells was cis-1,2-dichloroethene. Ten months after bioaugmentation phase began 71% of the ethenes extracted were as ethene, the completely dechlorinated end product of PCE. Dechlorination products were observed at all sampling locations, inferring that dechlorination activity was distributed throughout the test cell. Methane formation was suppressed in areas of high VOC concentration (a common observation). Enhanced bioactivity also caused fouling and some bioclogging is suspected based on the second tracer test, conducted at the end of the bioaugmentation phase. The clogging changed the flow paths within the test cell and resulted in the occlusion of some PCE from receiving electron donor. Key observations of this phase included: (i) bioaugmentation, with KB-1, resulted in a rapid change in the number and distribution of dechlorinating organisms within the test cell; (ii) the lower than expected mass discharge from the extraction wells may be attributed to the preferential partitioning of dechlorination products back into the DNAPL source; bioclogging restricting the delivery of electron donor to all areas of the test cell.
The study employed the use of new analytical techniques, namely molecular characterization and stable carbon isotope analysis (SCIA). Prior to this study the use of molecular characterization tools was not common. In both the laboratory and the field demonstrations these new techniques provided timely and meaningful corroboration of the aqueous geochemical data (VOC and other supporting data). The development and eventual commercialization of the quantitative PCR (qPCR) method was of benefit to this project. These results support the groundwater VOC results obtained in the field demonstration.
The SCIA analyses were particularly suited to the DNAPL source investigation and results from this study were able to confirm the removal of residual phase PCE at some of the

ER0008 xiii 2007.05.24 Revision 3.0
monitoring locations. The results of the CSIA sampling for the field demonstration indicated biodegradation of some compounds was detected before conventional groundwater analytical results confirmed biodegradation was occurring. This was most pronounced in the observation of cis-DCE and VC isotopic fractionation, indicating biodegradation of cis-DCE to VC and VC to ethene within the test cell. This suggests that in cases where a variety of processes may be occurring CSIA can be used to demonstrate if biodegradation processes are significant contributors via reductive dechlorination mechanisms. During baseline and biostimulation the PCE signature in the test cell was very stable, conversely, during the later stages of the bioaugmentation phase the CSIA PCE isotopic signature at the wells furthest down gradient of the source showed a significant isotopic enrichment (>1 ‰) suggesting that degradation became dominant, possibly due to source depletion in these wells (Morrill, 2005). These results support the very low groundwater PCE concentrations observed at the extraction wells at this same time.
In summary, bioaugmentation was required to promote dechlorination of the PCE to cis-1,2-dichloroethene, vinyl chloride and ethene. The rate of mass discharge increased during bioaugmentation but was limited by biolclogging. The bioclogging occurred as a result of electron donor addition and eventually caused the flow paths within the test cell to change and the electron donor was no longer being delivered to those zones with significant amounts of residual PCE (i.e., the uppermost saturated portions of the test cell). The post-bioaugmentation period, where no additional electron donor was amended but groundwater circulation continued, could be characterized as being a time when PCE concentrations at the extraction wells steadily increased (suggesting that biodegradation rate decreased such that PCE was again reaching the extraction wells).
The total mass of PCE removed from the test cell, via groundwater treatment means, was estimated to be 77 kg. Of this 15 kg, as PCE, was estimated to be degradation products, which is supported by the chloride mass balance. During bioaugmentation only 2.9 kg of PCE and 12.9 kg of PCE daughter products (TCE, cis-1,2-DCE, VC and ethene) were captured at the extraction wells. In this same interval more than 12 kg of chloride was produced. During bioaugmentation, 4.5 times more daughter products were reported at the extraction wells than PCE (4.7 versus 21.6 grams of PCE/day). This suggests that the enhanced mass discharge may have ranged from at least 2 (based on the doubling of chloride mass) to as high as 4.5 (based on the daughter products observed during bioaugmentation compared to the amount of PCE in this same period).

ER0008 1 2007.05.24 Revision 3.0
1. INTRODUCTION
1.1 Background
Trichloroethene (TCE) and tetrachloroethene (or perchloroethene; PCE) are two commonly detected groundwater contaminants. These compounds were often used as degreasing solvents in manufacturing processes. PCE and TCE are examples of dense non-aqueous phase liquids (DNAPLs). DNAPLs have very low aqueous solubilities that may exceed regulatory criteria by as much as five orders of magnitude (Pankow and Cherry, 1996).
The physico-chemical properties of PCE and TCE make these contaminants particularly difficult to remove from groundwater. Both are relatively insoluble and hydrophobic and tend to form ganglia of the pure phase liquid in the subsurface. It is now widely recognized that pump-and-treat is primarily a containment approach due to the slow dissolution of solvents from residual or pooled DNAPL sources (U.S. Environmental Protection Agency, 1992) and therefore will need to be operated for long periods of time (i.e., decades to centuries) incurring continuing annual operations and maintenance (O&M) costs over that period. Thus, treatment technologies that enhance the dissolution rate of a DNAPL will decrease the remediation time, which ultimately reduces total lifecycle costs of remediation. The difficulty in removing PCE and TCE DNAPL from contaminated aquifers has emphasized the need for effective in situ treatment technologies that target DNAPL source zones. In situ treatment technologies capable of treating DNAPL source zones are listed in Table 1. Those technologies offering mass destruction are advantageous in that the DNAPL mass is not simply transferred into a second matrix but destroyed in situ.
Chlorinated solvents are present in groundwater at a significant number of United States Department of Defense (DoD) facilities as a result of their widespread use as degreasing agents. The estimated capital and O&M (present worth) cost of cleanup at each site is $3.6 and $3.5M, respectively, resulting in a total cleanup cost of $787M (as a net present worth amortized over a 30 year period at 8%). Promoting conditions favoring the complete conversion of PCE and TCE to ethene could provide a biological containment system limiting the migration of the dissolved phase plume. In comparison to pump-and-treat, the capital and O&M costs of this technology are expected to be significantly lower.

ER0008 2 2007.05.24 Revision 3.0
TABLE 1: SUMMARY OF DNAPL REMEDIATION TECHNOLOGIES1
Focus Technology Class Remediation Technology Physico-chemical Remediation ProcessReactive Barriers Zero-valent Iron -minimizes the migration of contaminated groundwater by
intercepting and degrading the dissolved phase contaminants
Containment Impermeable WallsPump and Treat
Bioremediation Monitored Natural Attenuation
-minimizes migration of contaminated groundwater by degrading the dissolved phase contaminant
Flushing AlcoholSurfactantOxidant -removes DNAPL by rapidly degrading the dissolved phase
contaminant
Volatilization Soil Vapor ExtractionAir SpargingIn-well Stripping
Thermal Steam FlushingElectrical HeatingIn Situ Vitrification
Enhanced Bioremediation
Biostimulation -removes DNAPL mass by enhancing the rate of biodegradation within the source zone
Bioaugmentation -minimizes migration of contaminated groundwater (increases degradation rate and promotes complete dechlorination to ethene) by increasing the activity of dechlorinating microorganisms
Note1 After Fountain (1998)
Plum
e M
anag
emen
tSo
urce
Man
agem
ent -removes vapor phase contaminant from either the vadose or
saturated zones by enhancing partitioning into the vapor phase
-removes DNAPL by enhancing volatilization and/or mobilizing the pure phase
-minimizes the migration of contaminated groundwater by either preventing groundwater flow or hydraulically containing the contaminated groundwater
-removes DNAPL by either mobilizing pure phase or increasing the solubility of the contaminant
There are no currently available, proven technologies that can reliably remove 100% of DNAPL (both free product and residual) mass. Volatilization, containment, and flushing are the main classes of technologies for DNAPL remediation. Attempts have been made to remove the DNAPL sources through heating to enhance volatilization from the DNAPL into the vapor phase (steam flushing, electrical heating, etc.); however, the effectiveness of this approach is restricted by the high energy costs and the large volume of porous media requiring treatment. Containment technologies limit the migration of the dissolved phase plume either hydraulically or through an engineered process. For example, containment may be achieved by using impermeable cut-off walls (slurry or sheet-piling walls), permeable reactive barriers (e.g., zero valent iron; ZVI), or groundwater extraction and treatment (pump-and-treat). An alternative approach is to flush the DNAPL source area with a surfactant solution or an oxidizing agent. These approaches are limited in that these agents will move primarily through the most permeable zones, providing little mixing of the active flushing agent with the target contaminant. Unless either surfactant or

ER0008 3 2007.05.24 Revision 3.0
oxidant addition can achieve essentially complete removal of the DNAPL mass, the remaining non-aqueous phase mass will continuously re-contaminate groundwater in the treatment zone.
There is a critical need for technologies that can effectively treat DNAPL sources in the saturated zone, resulting in both destruction and containment with reduced treatment times and lower costs. One approach is to introduce naturally-occurring, dehalo-respiring microbial consortia that function at the solubility limits of chlorinated solvents, into DNAPL source areas. Bioaugmentation is an in situ remediation approach where complete dechlorination of chlorinated ethenes is stimulated by supplying microorganisms that have demonstrated the ability to completely dechlorinate chlorinated ethenes in the presence of the appropriate electron donors and nutrients. Table 2 presents a summary of completed laboratory and field scale tests showing reductive dechlorination of high concentrations of PCE and TCE. With the success of bioaugmentation of dissolved phase plumes, and the results of laboratory batch and column studies suggesting that under the appropriate conditions cultures can be adapted to grow at high volatile organic compound (VOC) concentrations, a field demonstration of the bioaugmentation technology evaluating its effect on DNAPL mass removal is warranted. Using either naturally occurring microorganisms or those added through bioaugmentation, enhanced rates of biodegradation at the DNAPL:water interface will increase the concentration gradient driving DNAPL dissolution. Increasing the concentration gradient will result in more rapid DNAPL dissolution and a reduction in the time required for cleanup. In the event that the increase in degradation rates is insufficient to significantly enhance DNAPL removal, rapid biodegradation of the high VOC concentrations typically encountered in DNAPL source zones (e.g., tens to hundreds of mg/L) will provide biological containment of the groundwater plume, thereby reducing clean-up times and/or reducing the O&M cost of continuous groundwater plume management.
ER0008 4 2007.05.24 Revision 3.0
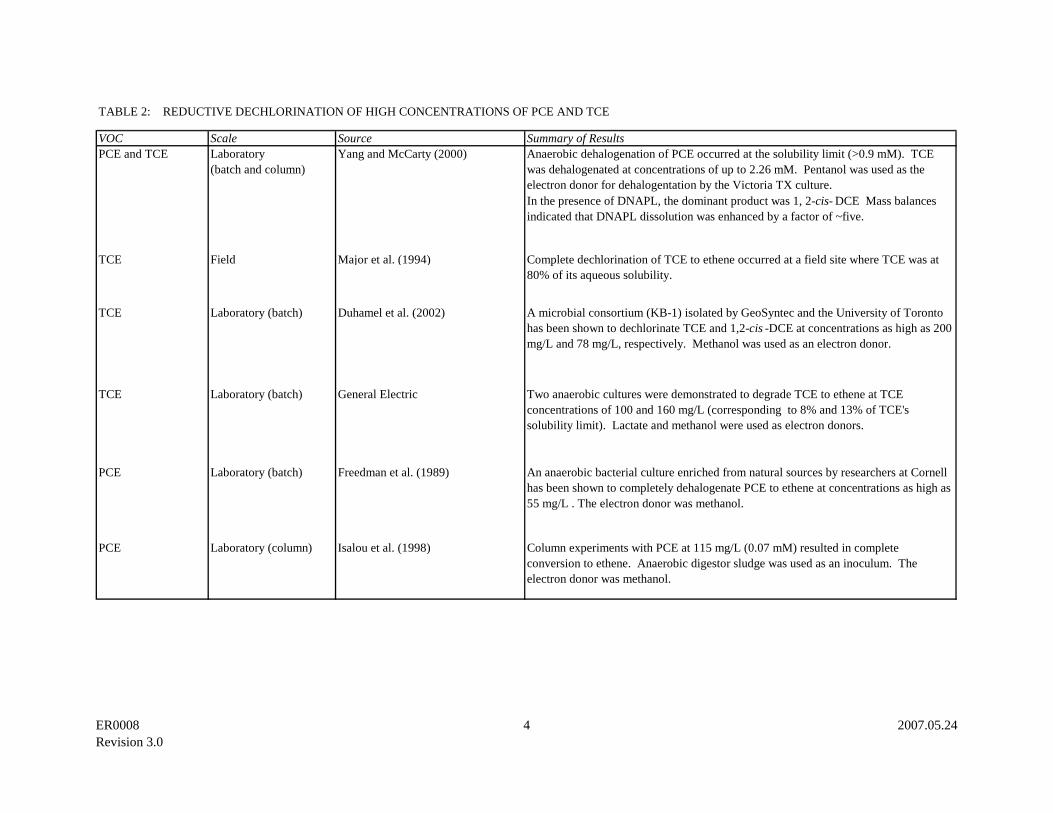
TABLE 2: REDUCTIVE DECHLORINATION OF HIGH CONCENTRATIONS OF PCE AND TCE
VOC Scale Source Summary of ResultsPCE and TCE Laboratory
(batch and column)Yang and McCarty (2000) Anaerobic dehalogenation of PCE occurred at the solubility limit (>0.9 mM). TCE
was dehalogenated at concentrations of up to 2.26 mM. Pentanol was used as the electron donor for dehalogentation by the Victoria TX culture. In the presence of DNAPL, the dominant product was 1, 2-cis- DCE Mass balances indicated that DNAPL dissolution was enhanced by a factor of ~five.
TCE Field Major et al. (1994)
TCE Laboratory (batch) Duhamel et al. (2002)
TCE Laboratory (batch) General Electric
PCE Laboratory (batch) Freedman et al. (1989) An anaerobic bacterial culture enriched from natural sources by researchers at Cornell has been shown to completely dehalogenate PCE to ethene at concentrations as high as 55 mg/L . The electron donor was methanol.
PCE Laboratory (column) Isalou et al. (1998) Column experiments with PCE at 115 mg/L (0.07 mM) resulted in complete conversion to ethene. Anaerobic digestor sludge was used as an inoculum. The electron donor was methanol.
Complete dechlorination of TCE to ethene occurred at a field site where TCE was at 80% of its aqueous solubility.
Two anaerobic cultures were demonstrated to degrade TCE to ethene at TCE concentrations of 100 and 160 mg/L (corresponding to 8% and 13% of TCE's solubility limit). Lactate and methanol were used as electron donors.
A microbial consortium (KB-1) isolated by GeoSyntec and the University of Toronto has been shown to dechlorinate TCE and 1,2-cis -DCE at concentrations as high as 200 mg/L and 78 mg/L, respectively. Methanol was used as an electron donor.

ER0008 5 2007.05.24 Revision 3.0
1.2 Objectives of the Demonstration
The primary objectives of the demonstration were:
• To enhance the dissolution rate (discharge) of a DNAPL source via enhanced biological activity (bioaugmentation);
• To demonstrate that enhanced biodegradation is an effective means of containing a high concentration source zone by rapidly degrading the dissolved phase plume emanating from the source zone;
• To validate the performance of the technology at field scale; and,
• To provide valuable operational data that may be used to guide future applications of this technology.
This demonstration of bioaugmentation to enhance the dissolution of a DNAPL used PCE as the primary DNAPL in a porous media groundwater system. The demonstration consisted of field and laboratory investigations to determine if bioaugmentation can stimulate complete dechlorination to non-toxic end products and that the mass flux from a source zone increases when biological dehalorespiration activity is enhanced through nutrient addition and or bioaugmentation.
The lab demonstration was conducted by researchers at the University of Toronto. At the time this project was initiated (2000) there were only a few known cultures available for bioaugmentation and none were considered ‘commercially’ available. A set of microcosm experiments were completed to compare the three microbial cultures known to promote rapid anaerobic reductive dechlorination of PCE to ethane (KB-1, UT and Pinellas). Following this a two-dimensional bench scale aquifer systems (2-D model aquifer boxes) using soil and groundwater from Dover Air Force Base, DE was operated to evaluate DNAPL behaviour with biostimulation and bioaugmentation.
The field demonstration was conducted at the Dover National Test Site (DNTS) in Dover, Delaware, which has five hydraulically contained sheet pile cells. On 16 and 30 July 2001, a group of researchers from the University of Wyoming (UW) and Oregon State University (OSU) released 100 L PCE as a DNAPL into Test Cell #1 (Test Cell) at the DNTS. The purpose of the controlled release was to test non-invasive DNAPL mapping techniques at a source zone. Following the mapping techniques effort, the Naval Facilities Engineering Service Center (NFESC) and Geosyntec conducted a bioaugmentation demonstration using the PCE release in the Test Cell. During the field demonstration, the Test Cell was flushed at a constant groundwater velocity (1.8 ft/day during initial tracer test) and a number of test phases evaluated

ER0008 6 2007.05.24 Revision 3.0
the rate of DNAPL removal and the extent of VOC treatment during extraction, biostimulation and bioaugmentation.
At the start of the investigation the perceived advantages of the technology to be proven by this demonstration included:
• An accurate determination of the time required to completely remove the DNAPL using bioaugmentation, given that the DNAPL mass at the start of the demonstration will be known; and,
• Hydraulic isolation from the surrounding aquifer to prevent VOC mass losses from the treatment zone, which will improve the mass balance calculations.
1.3 Regulatory Drivers
Since 1976, both PCE and TCE have been designated by the United States Environmental Protection Agency (USEPA) as priority pollutants. The Safe Drinking Water Act Amendments of 1986 strictly regulate these compounds; each has a Maximum Contaminant Level (MCL) in drinking water of 5 parts per billion (ppb) (USEPA, 1996). When concentrations of these compounds at a contaminated site exceed these criteria, remedial action is required to lower these concentrations and reduce the risk to human health and the environment.
Additionally the DoD lists the following directives as high priority requirements:
• Navy: 1.I.1.g. Improved remediation of groundwater contaminated with chlorinated hydrocarbons and other organics.
• Army: A(1.2.c) Enhanced Alternative and In-Situ Treatment Technologies for Solvents and Halogenated Organics in Groundwater (96-97) Air Force: 2000: Methods and Remedial Techniques are Needed to More Effectively Treat Groundwater Contaminated with Chlorinated Solvents Such as TCE, TCA, and PCE
1.4 Stakeholder/End-User Issues
This demonstration helped develop an interpretation methodology for efforts that biologically enhance or contain the mass flux from DNAPL source zones. The project’s outcome provides the fundamental components (e.g., level of monitoring, parameters to monitor, sampling frequency, distribution or mixing of nutrients/microorganisms, loading of nutrients) that are necessary to apply the bioaugmentation technology at other sites. As a result, development of a User’s Manual (Protocol) was warranted, and requested by ESTCP.

ER0008 7 2007.05.24 Revision 3.0
The demonstration also provided an estimation of the enhancement in the mass flux and the corresponding decrease in treatment time that ultimately justifies the selection of this technology as a source remediation alternative. In addition, the bioaugmentation demonstration provided rigorous operational and performance data that will encourage regulatory acceptance of the technology.
Conducting the demonstration under the controlled field conditions at the Test Cell does not preclude its applicability to other sites.

ER0008 8 2007.05.24 Revision 3.0
2. TECHNOLOGY DESCRIPTION
The technology could be applied in a variety of configurations depending on the site characteristics and constraints. An overview of how this technology will be applied at the demonstration site is provided in the following sections.
2.1 Technology Development and Application
Conventional remediation technologies have emphasized treatment of the dissolved phase plume. While a number of plume management technologies, including pump-and-treat, air sparging, and permeable reactive barriers, have proven effective in containing plume migration, the low solute flux from many DNAPL source zones implies that operation and maintenance of the technology will be required for an indefinite duration ranging from decades to centuries (Pankow and Johnson, 1992). The presence of DNAPL at contaminated sites has been identified as one of the principal limitations to the effectiveness of pump-and treat remediation (National Research Council, 1994) since the rate of mass removal is limited by the low aqueous solubility and the weak mixing effects of dispersion. Accordingly, much of the research in the last decade has emphasized the development of treatment technologies that aggressively remove or degrade the DNAPL in the source zone. Typical treatment technologies were summarized in Table 1. These technologies offer the benefit of reducing the time required for clean-up by increasing the mass flux from the source zone. However, the applicability of these technologies may be limited by cost, regulatory acceptance, and uncertain performance.
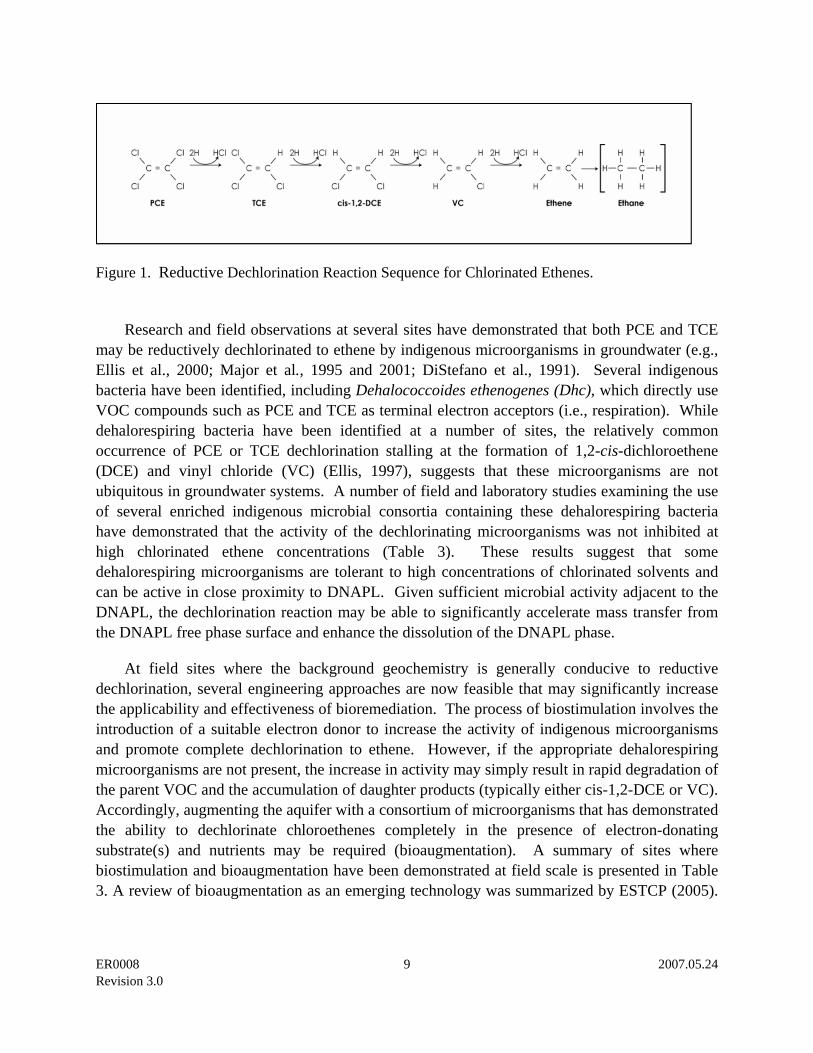
Of particular interest are biological remediation approaches for chlorinated solvent contamination that use either aerobic or anaerobic degradation processes. Aerobic processes require the addition of co-substrates and are often limited in the concentrations of VOCs that can be treated because of the solubility constraints of oxygen in groundwater and possible toxicity effects of intermediate compounds on the microorganisms. Anaerobic reductive dechlorination does not share these limitations and is more commonly used to degrade chlorinated solvents. Under anaerobic conditions, reductive dechlorination is a well-understood degradation mechanism for PCE and the lesser chlorinated alkenes that may result in complete dechlorination to ethene and ethane. Reductive dechlorination involves the step-wise replacement of individual chlorine atoms with hydrogen atoms (Figure 1) where the chlorinated ethene acts as an electron acceptor while an electron donor is required to provide energy for this process (McCarty, 1994). Hydrogen is generally considered the direct electron donor for reductive dechlorination, and is typically produced from the anaerobic oxidation of other carbon substrates, such as organic acids or alcohols (Maymo-Gatell et al., 1997).
ER0008 9 2007.05.24 Revision 3.0
Figure 1. Reductive Dechlorination Reaction Sequence for Chlorinated Ethenes.
Research and field observations at several sites have demonstrated that both PCE and TCE
may be reductively dechlorinated to ethene by indigenous microorganisms in groundwater (e.g., Ellis et al., 2000; Major et al., 1995 and 2001; DiStefano et al., 1991). Several indigenous bacteria have been identified, including Dehalococcoides ethenogenes (Dhc), which directly use VOC compounds such as PCE and TCE as terminal electron acceptors (i.e., respiration). While dehalorespiring bacteria have been identified at a number of sites, the relatively common occurrence of PCE or TCE dechlorination stalling at the formation of 1,2-cis-dichloroethene (DCE) and vinyl chloride (VC) (Ellis, 1997), suggests that these microorganisms are not ubiquitous in groundwater systems. A number of field and laboratory studies examining the use of several enriched indigenous microbial consortia containing these dehalorespiring bacteria have demonstrated that the activity of the dechlorinating microorganisms was not inhibited at high chlorinated ethene concentrations (Table 3). These results suggest that some dehalorespiring microorganisms are tolerant to high concentrations of chlorinated solvents and can be active in close proximity to DNAPL. Given sufficient microbial activity adjacent to the DNAPL, the dechlorination reaction may be able to significantly accelerate mass transfer from the DNAPL free phase surface and enhance the dissolution of the DNAPL phase.
At field sites where the background geochemistry is generally conducive to reductive dechlorination, several engineering approaches are now feasible that may significantly increase the applicability and effectiveness of bioremediation. The process of biostimulation involves the introduction of a suitable electron donor to increase the activity of indigenous microorganisms and promote complete dechlorination to ethene. However, if the appropriate dehalorespiring microorganisms are not present, the increase in activity may simply result in rapid degradation of the parent VOC and the accumulation of daughter products (typically either cis-1,2-DCE or VC). Accordingly, augmenting the aquifer with a consortium of microorganisms that has demonstrated the ability to dechlorinate chloroethenes completely in the presence of electron-donating substrate(s) and nutrients may be required (bioaugmentation). A summary of sites where biostimulation and bioaugmentation have been demonstrated at field scale is presented in Table 3. A review of bioaugmentation as an emerging technology was summarized by ESTCP (2005).

ER0008 10 2007.05.24 Revision 3.0
The results of this study concluded that well monitored field demonstrations have shown that adding dechlorinating cultures can establish in saturated zones and result in faster dechlorination of chlorinated ethenes (ESTCP 2005). The results of this demonstration support these findings.
Potential applications of the bioaugmentation technology include those sites where a suspected or known DNAPL source (pool or residual) is present. Figure 2 presents an overall schematic of the addition of an appropriate dehalorespiring culture and/or electron donors to a source area to promote enhanced DNAPL dissolution. Although it is often difficult to define the exact location of the source area, it is relatively inexpensive to increase the volume treated by simply increasing the number of nutrient injection locations. Furthermore, the dehalorespiring microorganisms will grow and spread towards the DNAPL sources where they have a competitive advantage over indigenous microorganisms incapable of using VOCs for respiration.
Figure 2. Conceptual Schematic of Bioaugmentation Treatment System

ER0008 11 2007.05.24 Revision 3.0
Demonstration Location
Geologic Setting Bioaugmentation Culture
Reference/Source 1
TCE, DCE, & VC
Gilbert-Mosley Site, Wichita, KS
Sand Burkholderia cepacia PR1301
Bourquin et al. (1997)
TCE Industrial Facility, Pennsauken, NJ
Silty, fine to medium sand with clay lenses
Burkholderia cepacia ENV435
Steffan et al. (1999)
TCE Flemington, NJ Moderately permeable weathered bedrock
Burkholderia cepacia ENV435
Walsh et al. (2000)
TCE Chico Municipal Airport, Chico, CA
Cobbles and finer-grained materials
Methylosinus trichosporium OB3b
Duba et al. (1996)
PCE, TCE, 1,1,1-TCA, chloroform
Caldwell Trucking Superfund Site, NJ
Fractured bedrock KB-1 Finn et al. (2003)
PCE & TCE Evenblij Site, Hooeveen, the Netherlands
Sand On-site anaerobic bioreactors innoculated with sludge from an industrial reactor
Henssen et al. (2001)
TCE Cape Canaveral AFS, FL
Fine to medium sand, silt, and shells
KB-1 Battelle (2004)
TCE Dover AFB, DE Fine sand and silt Pinellas Ellis et al. (2000)
TCE Aerojet Superfund Site, Sacramento, CA
Unconsolidated fluvial deposits containing sand and
l
KB-1 Cox et al. (2000)
TCE Industrial Facility, Boston, MA
Unconsolidated fluvial deposits underlain by glacial
KB-1 Chang et al (2002); Chang et al (2003)
PCE & Carbon Tetrachloride
Dow Facility, Pittsburgh, CA
Unconsolidated fluvial/alluvial deposits (clay, silt, sand & gravel)
Site groundwater Jin et al. (2002); Droy et al. (2002)
PCE Kelly AFB, TX Unconsolidated alluvial deposits
KB-1 Major et al. (2002)
PCE Dover AFB, DE Fine sand and silt KB-1 McMaster et al. (2002)
PCE Industrial Facility, Chester, SC
Fractured metagabbro KB-1 GeoSyntec unpublished data; Konzuk (2002)
Fine to medium grained sand
Lendvay et al. (2003)
Carbon Tetrachloride
Schoolcraft, MI Glacial outwash sands Pseudomonas stutzeri KC
Dybas et al. (1998); Dybas et al. (1997)
Notes
TABLE 3: SUMMARY OF BIOAUGMENTATION FIELD DEMONSTRATIONS FOR CHLORINATED SOLVENTS IN GROUNDWATER
Ana
erob
icA
erob
ic
1 references provided in Section 7
Bachman Road culture (Bio-Dechlor)
Contaminants
PCE Bachman Road Residential Wells Site, MI

ER0008 12 2007.05.24 Revision 3.0
2.1.1 Analytical Tools to Support the Assessment of Biodegradation
Direct evidence of biodegradation activity in the field requires an accumulation of a broad base of evidence (i.e., presence of VOC degradation products, appropriate geochemical conditions, and microbiological evidence if possible). It was important during this demonstration to distinguish the PCE degradation products (i.e., TCE, cis-1,2-DCE and VC) generated from biodegradation that was occurring down gradient of the DNAPL zone (i.e., the dissolved phase plume) and that which was occurring proximal to the DNAPL:water interface. Simply monitoring the effluent VOC and associated parameters (i.e., field measurements such as dissolved oxygen, oxidation-reduction potential, degradation products and geochemical parameters) from the extraction wells would not adequately address the project objectives. Recent advances in molecular characterization techniques for soil and groundwater samples have provided new tools to qualitatively determine the presence of dechlorinating organisms. As well, stable carbon isotopes can provide direct evidence of bioremediation. Brief reviews of each analytical tool are provided in the following sections.
2.2 Molecular Characterization Techniques
In situ detection of Dehalococcoides species at chloroethene-contaminated sites is important because it is the only Genus of organisms known to dechlorinate PCE to ethene. Decisions on the necessity for bioaugmentation are dependent on the presence or absence of Dehalococcoides ethenogenes in the indigenous microbial community. Polymerase chain reaction (PCR) based tests for Dehalococcoides ethenogenes (the Dhc-PCR assay) that allow the detection of these organisms in soil and ground water have been developed by several researchers including Loffler et al. (2000), and Hendrickson et al (2002).
The may change to Dhc-PCR assay consists of four fundamental steps:
(1) DNA extraction from bacteria present in site groundwater or soil;
(2) PCR of 16S rRNA genes from all bacteria using non-specific primers;
(3) PCR with primers specific for Dhc 16S rRNA gene sequences;
(4) gel electrophoresis to view PCR products.
DNA extraction protocols typically involve the use of a bead heating method to break down the bacterial cell walls. After DNA extraction, PCR is used to amplify the 16S rRNA genes using the DNA extracted from the site microorganisms as a template. The second PCR step uses the results of the initial PCR step as a template, and amplifies sequences specific to the Dhc 16S rRNA genes. This approach (nested PCR) increases sensitivity and provides a positive control for the PCR reaction. The final step in the Dhc-PCR assay is the detection of the PCR products

ER0008 13 2007.05.24 Revision 3.0
using gel electrophoresis. If Dehalococcoides sequences are present above the detection limit then a PCR band will be visible on a gel. If the sequences are not present, then the reaction will fail to occur and no band will be visible. The detection level of this PCR approach was estimated by Löffler et al. (2000) to be 1000 cells/ gram of sandy aquifer material for a Desulfuromonas sp.
The advancement of molecular characterization techniques moved quickly, even over the duration of this demonstration. At the start of the field demonstrations the nested PCR approach was used to determine the Dhc present, but by early 2003 the quantitative PCR (qPCR, 16S rRNA) was becoming more accepted and was an improved analytical technique. This technique has been recognizes as most frequently used for current applications (SERDP Final MBT Report, October 2005).
2.3 Stable Carbon Isotope Analysis
Stable carbon isotope analysis involves the measurement of 12C and 13C to establish a ratio of the two isotopes in a given compound. The application of stable carbon isotope analysis (SCIA) provides evidence of biodegradation based on the change in the carbon isotope ratio (a process termed fractionation). Sherwood Lollar et al. (1999) demonstrated that biodegradation of TCE resulted in the enrichment of the 13C, and that other processes (e.g., dispersion, advection, diffusion) could not account for such isotopic fractionation shifts. Sherwood Lollar et al. (2001) found that isotopic signatures could be used to quantify the relative extent of biodegradation between different zones of a contaminant plume. Recent work with the RTDF, the University of Toronto, and Geosyntec at Kelly AFB has shown that SCIA can be a powerful tool for tracking biodegradation (Morrill et al., 2001). This method is also insensitive to analytical and dilution errors which frequently occur during analysis with high VOC concentrations. Fractionation changes over distances or time can be used to determine biodegradation rates and in some cases source depletion rates (Sherwood Lollar et al. 2001).
For this project, the SCIA analysis was an effective way to determine where and when PCE degradation occurred. An initial sample of the PCE DNAPL was used to determine the baseline isotopic signature. Throughout the technology demonstration, sampling was completed to screen for changes to this initial isotopic signature.
2.4 Previous Testing of the Technology
Field evidence exists to suggest that microbial populations can exist close to DNAPLs and enhance dissolution rates (e.g., Major et al., 1995). As discussed earlier (Section 2.1) there is a growing body of laboratory evidence that suggests microbial populations can degrade high concentrations of PCE and TCE (see Table 2). These studies involve column and batch tests where dechlorinating cultures were exposed to saturated or supersaturated concentration of

ER0008 14 2007.05.24 Revision 3.0
chlorinated solvents. Yang and McCarty (2000) showed that PCE degrading microorganisms could completely dechlorinate PCE at concentrations up to the PCE solubility limit. The dissolution rate of the PCE DNAPL under these conditions was enhanced by ten to fourteen times over baseline conditions. Recently completed field tests specifically designed to monitor biologically mediated enhanced dissolution of a DNAPL include Battelle (2004).
2.5 Factors Affecting Cost and Performance
A number of factors influence the full-scale implementation cost of bioaugmentation. Primary factors affecting the cost of the technology include the time required for remediation, the maximum depth at which the contaminants are present, and the presence of available infrastructure. The duration of remediation is a function of the performance of the technology also controlled by a number of factors. The spatial extent of the DNAPL can add significant cost to total implementation costs. Since enhanced bioremediation relies upon the delivery of amendments (e.g., electron donor, nutrients, and biomass) through injection wells to promote contaminant degradation, the volume of the aquifer defined by the horizontal and vertical extent of the DNAPL will control the amendment flow rate, the size of the amendment dosing system, and the number of wells required to circulate the amendments through the treatment zone.
While an enhanced removal rate of the DNAPL may be achieved through bioaugmentation, the rate of mass removal may still be small in comparison to the mass of DNAPL initially present, suggesting that at those sites where a large mass of DNAPL is present may limit the measurable effectiveness of the technology. Because the technology requires the establishment of anaerobic and reducing conditions in the source zone, the ability to support reductive dechlorination while maintaining intrinsic (background) redox conditions will also improve the performance of this technology.
Geological heterogeneity will strongly influence the performance of bioaugmentation by limiting the delivery of the amendments to the microorganisms adjacent to the DNAPL. In particular, the delivery of a sufficient concentration of electron donor to support the microbial activity may limit the maximum concentration of the target contaminant that can be degraded. This limitation will depend on the type and concentration of the electron donor added into the source zone, the utilization rate by the microorganism, and the design of the nutrient delivery system.
Another limitation of the technology will be the costs associated with locating a DNAPL source zone for treatment. At some sites, it may not be cost-effective to accurately locate the DNAPL; instead, the design of the treatment system should be sufficiently large as to encompass the entire DNAPL source zone. This may increase the annual treatment costs (i.e., O&M) of a bioaugmentation system; however, this may be offset by the reduction in the cost of site investigation activities.
ER0008 15 2007.05.24 Revision 3.0
2.6 Advantages and Limitations of the Technology
The main advantages of the technology are:
• Lower expected capital and O&M costs than alternative technologies (McDade et al., 2005 and see Table 1).
• Enhancing the dissolution rate of a DNAPL will decrease clean-up times;
• A source zone with a faster dissolution rate will cost less to contain from a long-term O&M perspective;
• Mass will be destroyed and not simply transferred to another medium;
• Expansion of a treatment area to include uncertainties related to the location of a source zone are unlikely to be difficult or significantly increase total cost; and,
• Application at increased depths (below ground surface) and at lower costs than some comparable technologies (see Table 1).
The main limitations of the technology are:
• Like any source remediation technology there is a need to understand and identify the extent of the source zone and estimate the mass present in order to minimize the zone to be treated. Such an effort would require capital cost expenditures;
• A limitation of all source remediation technologies involves contacting the treatment with the DNAPL/source material. Specifically, for biological processes attempting to enhance the dissolution of the source, this could include limitations related to delivering nutrients and/or microorganisms to the source;
• Certain geochemical conditions (e.g., high sulfate) may be inhibitory to biodegradation;
• Some co-contaminants may inhibit dechlorination (e.g., chloroform and hydrogen sulfide); and,
• Some common biodegradation daughter products can have higher solubilities than the parent products. With very high concentrations of chlorinated solvents it is feasible that intermediate products formed may be toxic. This impact would be localized and likely transient due to the flux of groundwater through the source zone acting to dilute concentrations.
ER0008 16 2007.05.24 Revision 3.0
3. DEMONSTRATION DESIGN
A variety of configurations were possible to demonstrate the technology. The most appropriate configuration depends on the site geology, hydrogeology, infrastructure, and contaminant distributions. For this demonstration, the selected configuration had controlled groundwater flow and well-defined contaminant distribution to allow for better data interpretation, better contact between the treatment agents (electron donor and dechlorinating bacteria) and performance validation of the technology.
Specifically, the configuration of the technology demonstration for this demonstration is shown in Figure 3. Enclosing the source zone within an impermeable barrier wall contained groundwater flow within the treatment zone. The impermeable barrier wall ensured complete capture of the injected components (e.g., tracer, electron donor) and simplified the calculation of mass balances. A more common application will provide hydraulic containment using a groundwater recirculation system. The extraction wells serve to control and induce groundwater flow through the DNAPL zone. Extracted groundwater was treated using a small on-site treatment system (liquid phase granular activated carbon [GAC]) to remove VOCs from the groundwater. Following liquid phase GAC treatment, the groundwater was amended with electron donors (e.g; lactate and ethanol) to stimulate the activity of the indigenous and/or bioaugmented microorganisms and re-injected, via the injection wells, into the Test Cell. Bioaugmentation was completed once the appropriate reducing conditions were present in the aquifer.

ER0008 17 2007.05.24 Revision 3.0
Figure 3: Plan and Cross Section View of Test Cell #1 Dover AFB, Dover, DE
3.1 Performance Objectives
Performance objectives were used to meet the project objectives described in Section 1.2 and to evaluate the performance and cost of the bioaugmentation demonstration. These performance objectives are provided below in Table 4.

ER0008 18 2007.05.24 Revision 3.0
TABLE 4: PERFORMANCE OBJECTIVES
Type of Performance
ObjectivePrimary Performance Criteria Expected Performance Actual Performance (Objective Met?)
Increase PCE Degradation Rate Increase in degradation rate following bioaugmentation
Significant increase in PCE degradation over the baseline and post bioaugmentation
Increase Extent of Dehalogenation Complete dehalogenation to ethene Significant increase in ethene generation following a decrease in aqueous PCE concentrations
Increased mass flux from DNAPL during treatment > after amendment with electron donor > after bioaugmentation
Increase in mass flux above the base case treatment1
No change in DNAPL flux during biostimulation. Large increase in mass flux from DNAPL post bioaugmentation
Change in PCE mass flux Decrease in mass flux following bioaugmentation
Large decrease in PCE mass flux post bioaugmentation
Reduce DNAPL mass Reduction in DNAPL mass greater than base case treatment1
Uncertain. The young 'age' of the PCE emplaced source and residual PCE in the unsaturated zone serving as on-going source made for significant mass removal in base case. Bioaugmentation resulted in increased DNAPL mass removal compared to biostimulation.
Decrease mobility of groundwater plume Decrease in the steady-state length of the ground water plume
Probably. Given configuration of test cell this was not simply an extrapolation.
Note1 Base case treatment - operation of pilot system without addition of electron donor/nutrients or bioaugmentationDNAPL - dense, non-aqueous phase liquid
Qualitative
Quantitative
These performance objectives provide a basis for evaluating the performance and costs of the technology. Based on the laboratory and field studies described in Section 3.5 and 3.6 respectively, the addition of electron donor alone did not stimulate the activity of the native microbial population. Bioaugmentation caused an increase in the PCE degradation rate and a corresponding increase in the extent of VOC dechlorination. A summary of the approach taken to assess the mass reduction/discharge from the laboratory experiments is provided in Appendix E and from the field demonstration in Appendix H. The results of the demonstration are summarized in Section 4.
3.2 Selecting Test Site
Efforts were made to identify favorable field sites at which the demonstration could be validated. The preliminary list of sites was screened for the presence of target compounds (PCE and/or TCE) and dechlorinated daughter products (e.g., cis-1,2-dichloroethene and VC). This reduced the number of sites to ten. Remedial Project Managers (RPM) at eight of these sites

ER0008 19 2007.05.24 Revision 3.0
were contacted by NFESC and supplied with a brief description of the bioaugmentation project objectives. Data provided by each RPM was reviewed by NFESC and Geosyntec and assessed against a number of site selection criteria including:
• The presence or suspected presence of DNAPL;
• DNAPL present in a region of relatively high permeability porous media;
• Background geochemistry favorable to reductive dechlorination;
• The feasibility of securing access to the area above the source zone;
• A shallow depth to groundwater to facilitate the installation of boreholes and monitoring wells; and,
• The extent to which the geologic stratigraphy was delineated.
The results of the sites screened for the demonstration are presented in Table 5. Based on review of the available site characterization data, two of these sites potentially satisfied the site selection criteria identified for this project. The first (East Gate Disposal Yard site, Fort Lewis, WA) was a likely candidate site based on the shallow depth, the strong evidence of incomplete dechlorination to cis-1,2-DCE, and the previous acceptance of a RABBITT pilot test. The second candidate site is Test Cell #1 at DNTS. The Test Cell consists of a section of aquifer isolated by sheet piling (approximate dimensions of 28’ x 18’) which is intended to contain controlled demonstrations of groundwater monitoring and remediation technologies. DNTS has an on-site analytical laboratory and water treatment infrastructure and held a regulatory permit allowing controlled releases into the Test Cells.
The site selection screening process identified DNTS at Dover Air Force Base (DAFB) as the most appropriate site for the demonstration, which provided an opportunity to unequivocally demonstrate the technology. In addition to the degree of experimental control and the availability of infrastructure at DNTS, the project team was able to link this project with two additional research initiatives conducted by the University of Wyoming (Dr. J. Bradford) and Oregon State University (Dr. L. Semprini). These projects focused on evaluating the DNAPL distribution using non-invasive techniques. At the initiation of these projects, the University of Wyoming research team released a known quantity of PCE DNAPL (100L) into the Test Cell and used ground penetrating radar (GPR) to delineate the distribution of DNAPL. The Oregon State University research team evaluated the use of radon as a partitioning groundwater tracer. The DNAPL release fulfilled one of the primary criteria in our selection process (i.e., a well-defined source location and mass estimate).

ER0008 20 2007.05.24 Revision 3.0
TABLE 5: SUMMARY OF SITE SELECTION EVALUATION
1 2 3 4 5 6 7 8 9 10Presence of TCE or PCE DNAPL y n ? y y y y ? ? ?Defined source area (extent/mass) n ? ? y ? ? y ? ? ?Incomplete dechlorination ? n ? y y ? y ? ? ?Shallow groundwater y y ? y ? ? y ? ? ?Source area well instrumented n n ? ? ? ? y ? ? ?Accessible power/infrastructure* y y ? y y y y ? ? ?Suitable K and i y y ? y ? n y ? ? ?Low sulfate/chloride concentrations n n ? ? ? ? y ? ? ?No/low chloroform/1,1,1-TCA concentrations y y ? ? n ? y ? ? ?Enlightened regulatory environment ? ? ? y ? ? y ? ? ?
NotesSite ID1 - NAS North Island, San Diego, CA - OU 19/20
2 - NAS North Island, San Diego, CA - OU 24
3 - NASURFWARCENDIV Crane, IN4 - Fort Lewis, WA East Gate Disposal Yard5 - NAS Cecil Field, FL, Site 16 OU76 - NAS Charleston, NC7 - Dover AFB, DE, National Test Facility
8 - NWIRP Dallas, TX, Site 189 - NIROP Minneapolis, MN, Site 310-NAS Cherry Point, NC, Site 4
* - includes POTW/extracted groundwater treatment
No data was provided by the site owner / RPM.No data was provided by the site owner / RPM.No data was provided by the site owner / RPM.
Will release known amounts of DNAPL, two concurrent projects will be demonstrating non-invasive techniques to estimate location and mass of DNAPL.
Criteria
Latest available data from 1986; site only available after new field work to characterize distribution of VOCs is completed in Spring 2001.Possible alternate site, with potentially complex hydrogeology. An air stripping unit is operationalPresence of TCA may inhibit dechlorination.
Site ID
Complete dechlorination observed at other locations of this site indicates that effect of bioaugmentation may not be discernable.
Complete dechlorination to ethene observed at this site which indicates that dehalorespiring microbial community is present.

ER0008 21 2007.05.24 Revision 3.0
Test Cell #1 at the Dover National Test Site provided a number of advantages including:
• A controlled PCE DNAPL release inside a double-walled sheet pile Test Cell that served as the DNAPL source;
• Site infrastructure for the demonstration was available;
• The water table and contamination are located at shallow subsurface depths below ground surface (~12 ft bgs) which minimized drilling costs and provided better control of groundwater flow in the Test Cell;
• Both the regulators and the personnel at DAFB were receptive to the injection of microbial cultures and had previously approved the injection of electron-donors/nutrients into the subsurface; and
• A known mass of DNAPL was released, which enhanced performance assessment (i.e., better mass accounting in the system in comparison to a site where the mass of DNAPL was not well defined); and,
• DNTS has a Cone Penetrometer Testing (CPT) rig for on-site investigative activities and provided access to data collection and on-site analysis, thereby reducing costs or allowing for additional sampling.
3.3 Test Site Description
The field demonstration was conducted in a Test Cell located at DNTS (formerly known as the Groundwater Remediation Field Laboratory National Test Site or GRFL NTS). DAFB is located three miles southeast of Dover, Delaware (pop. 50,000). The locations of DAFB and DNTS are presented in Figure 4.

ER0008 22 2007.05.24 Revision 3.0
Figure 4. Location of Dover Air Force Base and Dover National Test Site (DNTS), Dover DE.
3.3.1 Facility History
DAFB began operation in December 1941, at the site of the partially constructed Dover Municipal Airfield. At this time, the airfield was leased to the U.S. Army Air Corps for use by the Eastern Defense Command as a coastal patrol base equipped with P-47 aircraft. In early 1942, the facility expanded to make the airfield more suitable for heavy aircraft, specifically the B-25 “Mitchell” medium bomber.
In August 1943, the mission of the field changed to an operational training base for combat training of P-47 fighter pilots. It also became the site for the development of air-launched rockets. At the close of World War II, the base became a Pre-Separation Processing Center for personnel leaving the service. The base was deactivated in September 1946 and periodically used by the Air National Guard for training exercises between 1946 and 1950. In July 1950, the base was reactivated and designated DAFB. From early 1951, until March 1952, the base was used for air/land defense operations. In March 1952, DAFB came under the command of the Military Air Transport Service (MATS) and became the East Coast terminal for cargo operation missions. Aircraft used from 1954 to 1965 included C-54, C-124, C-133 and C-141 cargo planes. A Strategic Air Command (SAC) detachment for fighters and KC-97 aircraft was located on-base from 1960 until 1965. In 1966, the MATS was re-designated Military Airlift

ER0008 23 2007.05.24 Revision 3.0
Command (MAC). Subsequently, in 1992, the MAC was re-designated Air Mobility Command (AMC). Currently, DAFB is equipped with C-5 Galaxy aircraft to provide global airlift capability. The present host organization of DAFB is the 436th Airlift Wing, whose primary mission is to provide immediate airlift of troops, cargo, military equipment, and humanitarian relief material and personnel (USAF, 1993 and 1994).
3.3.2 Site Description
The DNTS is located within DAFB and is designed to support the needs of researchers developing and demonstrating technologies for the clean-up of soil and groundwater contaminated with fuels and solvents. DNTS is located at DAFB because of the hydrogeologic environment combined with a history of innovative technology demonstrations and a favorable regulatory climate. DNTS covers approximately 3.5 acres in an unused, maintained open area in the northwest corner of the base. The St. Jones River and residential housing are located off base to the west of the site. Directly east of the site is a soccer field and running track. To the north is the Dover AFB boundary and to the south is an open field with an electrical transformer station. Since the primary focus of DNTS is the demonstration of technologies to remediate DNAPLs, DNTS maintains the capabilities (i.e., has a valid permit) to conduct controlled contained releases of DNAPLs into the water table aquifer. The location of DNTS and the proposed Test Cell for this demonstration are shown on Figure 5. A plan and cross section view of the Test Cell is presented in Figure 3.
3.3.3 Environmental Setting and Geology
DAFB is generally level with little topographic relief. The surface elevation ranges from 10 to 35 feet above mean sea level. The area has a continental type of climate that is marked by well-defined seasons. January is the coldest month with an average daily high of 42.5oF and an average daily low of 25.3oF. July is the warmest month with an average daily high of 88.9oF and an average daily low of 68.0oF. Average annual rainfall is 44.37 inches per year, and is generally evenly distributed with May being the wettest month (5.16 inches) and October the driest (2.59 inches). DAFB is underlain by sediments of Cretaceous to Recent age, forming a wedge of sediments, which thickens to the southeast. The Pleistocene Columbia (1.0 Ma) and Lynch Heights (0.5 Ma) Formations forms a water table aquifer in the area. Generally, these formations are composed of medium to fine sands with gravely sand, silt, and clay lenses. The Columbia Formation is characterized by a fining-upward sequence of silty, poorly sorted sands. The Lynch Heights Formation overlies the Columbia Formation, and is composed of a coarsening upward sequence of silty sands. Discontinuous clay lenses are common in the Lynch Heights Formation, and occasional gravely sand lenses. Underlying the Columbia Formation is the upper unit of the Calvert Formation (Miocene). This unit generally consists of gray, firm, dense marine clays with thin laminations of silt and fine sand. The thickness of this unit ranges from 20 to 28 feet beneath the base of the Columbia Formation. The Frederica aquifer is a 22-foot thick sand unit within the Calvert Formation. Beneath the upper sand unit is a middle silt

ER0008 24 2007.05.24 Revision 3.0
and clay unit with a thickness of greater than 80 feet. It is unlikely that sediments deeper than the middle silt and clay unit of the Calvert Formation will be of concern at the site of the proposed demonstration.
3.3.4 Hydrogeology
The primary water bearing unit in the area of the NTS is the Columbia aquifer, which forms a water table aquifer overlying the Frederica, Cheswold, and Piney Point aquifers (confined aquifers). Analyses of water level data collected during pumping tests conducted in the Columbia suggest that the hydraulic conductivity of the formation is in the range of 3 x 10⁻³ cm/sec to 1 x 10⁻² cm/sec (Jordan, 1964). Pumping tests at the GRFL suggest that the hydraulic conductivity of the unconfined Columbia aquifer ranges from 2.8 x 10⁻³ to 1.2 x 10⁻² cm/sec.
Groundwater from the Columbia aquifer is generally soft, slightly acidic, and characterized by low dissolved-solids content. High iron content and low pH are the only natural characteristics that commonly require treatment (Johnston, 1973). The underlying Calvert formation is composed of marine, estuarine, and delta plain silty clays, and forms an aquitard to the unconfined Columbia aquifer. Beneath DAFB, the aquitard thickness ranges between 18 and 28 feet (average of 22 feet). The estimated range of the vertical hydraulic conductivity of this unit is 2.7 x 10⁻⁸ to 1 x 10⁻⁷ cm/sec (Leahy, 1982). Included in the Calvert Formation is the Frederica aquifer, which is a thin, confined zone composed of a fine sand that lies approximately 66 to 88 feet bgs.
Regional water supply aquifers in the DAFB area include the Piney Point, Cheswold, Frederica, and Columbia aquifers. The top of the Cheswold is approximately 175 feet bgs at DAFB, and is separated from the Frederica aquifer by approximately 87 feet of silty clays of the Calvert Formation. The top of the Piney Point aquifer is approximately 334 feet below ground surface at DAFB, and is separated from the Cheswold aquifer by approximately 87 feet of silty clay.

ER0008 25 2007.05.24 Revision 3.0
Figure 5: Location of Test Cell at Dover National Test Site
3.3.5 Contaminant Distribution within the Test Cell
Previous experiments at the Test Cell have included an in situ co-oxidation study of chlorinated solvents during bioventing of petroleum hydrocarbons. The chemicals added were JP4 (as an LNAPL), toluene, xylene, PCE, TCE, and chlorobenzene (dissolved in the LNAPL). This test was completed in 1996. Vogel et al. (1998) estimated that 99 kg total hydrocarbon, 1.75 kg total BTEX, 40 g of TCE, less than 115 g PCE and 40 g of chlorobenzene remained after seven months of bioventing (removed only 5.7% of the total mass of contaminant). The placement of the LNAPL within the vadose zone is unlikely to impact the DNAPL PCE since JP-4 can serve as an electron donor for biodegradation. The impact of the existing chemicals in the Test Cell was assessed during Phase 1 of this demonstration (see Section 3.4.5).
ER0008 26 2007.05.24 Revision 3.0
3.4 Pre-Demonstration Testing and Analysis
Prior to initiating the demonstration, a number of pre-demonstration tasks were completed to collect essential data required to effectively implement this technology demonstration. As described in the following sections, these tasks included pre-design laboratory studies including microcosm and model aquifer testing (Section 3.4.1), phase 1 test cell investigation (Section 3.4.2) and controlled DNAPL release (Section 3.4.3).
3.4.1 Pre Design Laboratory Studies
At the time this project was initiated (2000) there were only a few known cultures available for bioaugmentation and none were considered ‘commercially’ available. A set of microcosm experiments were completed to compare the three microbial cultures known to promote rapid anaerobic reductive dechlorination of PCE to ethane (KB-1, UT and Pinellas). The results of these experiments lead to the selection of the KB-1 culture for use in the pilot demonstration. A summary of these experiments is provided in Appendix E.
The main objectives of the model aquifer experiments included:
1) characterizing spatial trends in dechlorination;
2) establishing increased microbial activity around a PCE DNAPL zone; and
3) identifying any inhibitory conditions limiting dechlorination of VOCs.
The study was conducted in two-dimensional bench scale aquifer systems (2-D model aquifer boxes) using soil and groundwater from Dover Air Force Base, DE. After establishment of PCE source zones in each aquifer system, one system was biostimulated while the other was biostimulated and bioaugmented with the KB-1 dechlorinating culture. Under biostimulation, no dechlorination was observed regardless of donor used (methanol, ethanol, acetate) but with bioaugmentation dechlorination to ethene was achieved. Sixty five percent (65%) of the initial emplaced PCE was removed in the bioaugmented, dechlorinating system in 890 days. In contrast, only 39% of the initial emplaced PCE was removed from the non-bioaugmented (biostimulated only) system. The maximum total ethenes concentrations (3 mM) in the bioaugmented system occurred approximately 100 days after bioaugmentation, indicating that there was at least a three-fold enhancement of PCE dissolution. Removal rates decreased substantially beyond this time, particularly during the last 200 days of the laboratory evaluation, when the maximum concentrations of total ethenes were only about 0.4 to 0.6 mM. The reductions in removal rates are attributed to both a shrinking DNAPL source area, and reduced flow through the DNAPL source area in the aquifer boxes due to bio-clogging and pore blockage from methane gas generation.

ER0008 27 2007.05.24 Revision 3.0
Several publications and presentations have been produced from the laboratory work a summary is provided in Appendix E.
3.4.2 Preliminary Test Cell Investigation
A soil investigation was completed to assess the distribution and extent of contaminants present within the Test Cell prior to the controlled DNAPL release. Soil samples were collected from eight borehole locations located within the test cell in March, April and May 2001 for analysis of the priority pollutants and xylenes by gas chromatography. These samples were also analyzed for JP-4 (Jet Fuel) using a modified method 8015B. Appendix A describes the procedures used for the collection of soil samples and Appendix F includes the borehole logs and geophysical analytical results.
A total of 6 VOCs were detected in the soil samples collected from the test cell (PCE, TCE, ethylbenzene, toluene, o-xylenes and m,p-xylenes). At three locations, TCE was present in soil samples collected below the water table at concentrations ranging from 75 to 220 micro grams per kilogram (µg/kg). All other VOCs were detected in samples collected from the unsaturated zone. JP-4 was detected at two locations within the unsaturated zone (9.5 and 11ft bgs). In general, the presence of JP-4 coincided with the detection of VOCs.
The remaining LNAPL and associated VOCs did not impact the performance of the PCE remedial technology.
3.4.3 DNAPL Release
The DNAPL release was conducted by the Bradford group from UW on July 1, 2001. A total of 100 L of pure phase PCE was released into injection wells installed in the vadose zone (screened from 4-5 ft bgs) and the saturated zone (screened from 12-13 ft bgs). The saturated zone injection point is located directly above a course grained/fine grained sand boundary and is expected to form a zone of DNAPL accumulation with a high volumetric saturation above the boundary. By May 10, 2002, prior to startup of the groundwater recirculation system, the water level in the Test Cell had dropped to 16 ft bgs, thus stranding the ‘saturated zone’ injection in the unsaturated zone. Leaving unknown PCE mass in the unsaturated zone made it difficult to estimate the starting or remaining mass of PCE in the saturated zone. Furthermore, water table increases would result in more PCE mass being added to the saturated zone, thereby affecting mass balance estimations. Two corrective measures were implemented:
1. In January 31, 2003 and for the duration of the demonstration, the average water level maintained within the Test Cell was approximately 16 ft bgs. To achieve this, potable water was added to the test cell on a periodic basis. A summary of the water level elevations are shown in Appendix J.

ER0008 28 2007.05.24 Revision 3.0
2. In an attempt to estimate the potential residual mass of PCE in the unsaturated zone a soil vapor extraction (SVE) system was installed at the Test Cell. The, an SVE system was installed and operated on 25 non-consecutive days during which a A total of 16 kg of PCE was extracted from the unsaturated zone. A summary of the SVE system design, operations and monitoring results are presented in Appendix F. While not achieving complete removal of the vadose zone PCE this did remove at least 16 more kg of mass, and this unit can be used to during the clean-up of the test cell during decommissioning.
3.5 Testing and Evaluation Plan
The following sections detail the phases in the course of the technology demonstration. All phases were completed in accordance with the site specific health and safety plan developed by Geosyntec and approved by NFESC (Appendix D).
The operational phases of the technology demonstration included:
• Baseline Operation – This phase consisted of extracting the contaminated groundwater, removing VOCs (GAC system) and re-injecting the groundwater into the test cell. The main purpose for this phase was to enhance pumping / extraction rates and determine the effect of flushing the DNAPL source with groundwater. An additional objective of this phase was to assess the rate and extent of VOC dechlorination by indigenous microorganisms in the absence of an abundant electron donor. The original plan was to operate under baseline conditions for 9-12 weeks. However, an Action Item resulting from the 2001 IPR suggested to operate in baseline mode until steady state was reached. This took over 39 weeks as opposed to the 9 to 12 week period originally proposed (see Table I1 in Appendix I). In this phase dechlorination by indigenous microorganisms was not observed. This finding was not surprising, as similar results were obtained in the model aquifer studies, where results indicated the indigenous dechlorinating cultures were not capable of PCE dechlorination.
• Electron Donor Addition – During the second phase, the contaminated water was extracted to the surface, VOCs were removed (GAC system) and then amended with electron donor (ethanol and sodium lactate) prior to re-injection. The purpose of this phase was to increase bacterial activity and attempt to stimulate complete VOC dechlorination by the indigenous microorganisms. This phase was used to determine whether electron donor addition (biostimulation) alone could increase the rate of DNAPL mass removal and/or promote complete dechlorination of PCE to ethene. Since previous studies in the Dover aquifer had demonstrated that the indigenous microorganisms in this aquifer were unable to fully dechlorinate PCE and produce ethene (Ellis et al., 2000), it was anticipated that the addition of the electron donor would

ER0008 29 2007.05.24 Revision 3.0
not increase the rate of VOC removal. This phase operated for 17 weeks and at the latter stages some dechlorination to cis-DCE had started to occur.
• Electron Donor Addition and Bioaugmentation – During the 3rd operational phase electron donor addition continued at a rate and concentration similar to the previous biostimulation phase and the Test Cell was bioaugmented with KB-1™ (the microbial consortium selected during the pre-design laboratory studies outlined in Section 3.4). The culture rapidly established itself within the test cell, ethene production increased and dechlorination occurred in all monitored areas of the Test Cell.
• Post-Bioaugmentation Baseline – During the Post-Bioaugmentation operation phase, the source zone was flushed with groundwater. The purpose of this phase was to evaluate the impact of the bioaugmentation on the DNAPL source under ambient groundwater geochemistry (i.e., without the continued addition of electron donor). . It was expected that complete dechlorination would continue to occur, although potentially at a slower rate. After 11 weeks the final monitoring event was completed and at this point complete dechlorination was still occurring. The previous treatments had shifted the ambient microorganisms into a population structure that is capable of providing enhanced biological containment of the DNAPL.
• Operation of an SVE system to Extract Vadose Zone PCE (as discussed in Section 3.4.3.) - After operation of the groundwater circulation system began it became apparent that residual PCE mass was perched in the unsaturated zone. Since site operations were on going and the DNTS had a requirement to remove as much PCE as possible from the Test Cell, an SVE system was constructed and operated with minimal effort. Appendix F contains a summary of this effort.
During each phase, groundwater samples were collected, as described in Table 6, from the extraction wells, and select piezometers within the Test Cell and regularly analyzed for field parameters (pH, DO, oxidation reduction potential, [ORP], temperature), VOCs, dissolved hydrocarbon gases (DHGs) (e.g., methane, ethene and ethane), volatile fatty acids (VFA), inorganic anions, stable carbon isotopes, and molecular characterization. Samples from the mixed injection feed were regularly collected to confirm the injected concentration of the electron donor and to ensure VOC breakthrough of the GAC did not occur for significant periods of time. A complete description of the sampling activities within the test cell is presented in Section 3.6.7 (Sampling Plan) with supporting documentation provided in Appendices A, B, C, F and I. A description of the groundwater circulation system is described in Subsection 3.5.1.2.

ER0008 30 2007.05.24 Revision 3.0
TABLE 6: SUMMARY SAMPLING SCHEDULE
Analysis Analytes Reported Sample Location Schedule
VOCs PCE, TCE, cis-DCE, Extraction Wells Weekly, Snap Shot Sample RoundsVC, Ethylbenzene, Injection Water Weekly, Snap Shot Sample RoundsBenzene, Toluene, Fully Screened Wells Snap Shot Sample Roundso,m,p-Xylene Multilevel Piezometers Snap Shot Sample Rounds
DHGs Ethene, Methane, Extraction Wells Bi-monthly1, Snap Shot Sample RoundsEthane Injection Water Bi-monthly1, Snap Shot Sample Rounds
Fully Screened Wells Snap Shot Sample RoundsMultilevel Piezometers Snap Shot Sample Rounds2
VFAs Lactate3, ethanol Extraction Wells Bi-monthly1, Snap Shot Sample RoundsInjection Water Bi-monthly1, Snap Shot Sample RoundsFully Screened Wells Snap Shot Sample RoundsMultilevel Piezometers Snap Shot Sample Rounds2
Anions Cl-, Br-, PO4-3, Extraction Wells Bi-monthly1, Snap Shot Sample Rounds
NO2-, NO3
-, SO2-2 Injection Water Bi-monthly1, Snap Shot Sample Rounds
Fully Screened Wells Snap Shot Sample RoundsMultilevel Piezometers Snap Shot Sample Rounds4
SCIAs PCE, TCE, cis-DCE, Extraction Wells Snap Shot Sample RoundsVC Injection Water Not Analyzed
Fully Screened Wells Not AnalyzedMultilevel Piezometers Snap Shot Sample Rounds5
DHC-PCR Dehalococcoides Extraction Wells Snap Shot Sample Roundsethenogenes Injection Water Not Analyzed
Fully Screened Wells Snap Shot Sample RoundsMultilevel Piezometers Not Analyzed
Notes:VOCs- volatile organic compoundsDHGs - dissolved hydrocarbon gasesVFAs - volatile fatty acidsSCIAs - stable carbon isotopic analysisDHC-PCR - dehalococcoides ethenogenes 16s RNA polymerase chain reaction1 - bi-monthly sample collection started in April 20042 - DHGs collected from select multi-level sample locations T-1, 2, 3, 7, 8, 9, 11, 12 at all depths3 - lactate concentration includes degradation products propanoate and acetate4 - anions collected from all multi-level sample locations5 - SCIAs collected from select multi-level sample locations T-4, 5, 6, 10, 13 at all depths

ER0008 31 2007.05.24 Revision 3.0
3.5.1 Demonstration Installation and Start-Up
This technology demonstration involved the installation of three fully screened groundwater extraction and three groundwater injection wells, a groundwater circulation and VOC treatment system with automated control system, a network of 13 multilevel monitoring well locations, and 4 fully screened bioaugmentation wells. A map of the test cell is shown in Figure 3. A process and instrumentation diagram of the groundwater circulation and treatment system is included in Appendix F. The following presents the details of the installation and start up of the technology demonstration.
3.5.1.1 Soil Borehole Sampling and Monitoring Well Installation and Development
Injection, extraction and monitoring well installation was completed during several consecutive field visits concurrently with the soil borehole investigation discussed in Section 3.4.5. Three injection, three extraction and four fully screened monitoring wells and a series of thirteen multilevel piezometers were installed in March, April, May and October 2001 and a series of soil samples collected for laboratory analysis (Section 3.4.5). All fully screened wells and multilevel piezometers were developed in February 2002 following the completion of the above ground recirculation system. Details regarding soil sampling and monitoring well installation and development are presented in Appendix A.
3.5.1.2 Recirculation System Design and Installation
As described in Section 3.5, the demonstration was divided into several phases in order to collect data that would support the project objectives. To accomplish this, groundwater was extracted, treated to remove VOCs and injected upgradient of the source to induce groundwater flow through the DNAPL source zone. The entire system and test cell were enclosed in a RUB™ tent supplied by the DNTS for security and health and safety purposes.
The recirculation system consists of five major elements: flow control; above ground treatment; biostimulation; injection; and, data acquisition and control. A process and instrumentation diagram of the groundwater circulation and treatment system is presented in Figure F2 in Appendix F. The process piping, pumps, flow elements, and above ground treatment were completed by Geosyntec with support from the DNTS. All electrical inputs, wiring, programmable logic controls and data acquisition software programming was performed by Calcon Systems, Inc (Calcon). The test cell was outfitted with a 240 volt power supply that was stepped down to 120 volts to meet the requirements of all of the electrical equipment.
Control of the extraction and injection of groundwater within the test cell was necessary to simulate a natural aquifer system. Three 0.13 gallon bladder pumps (replaced with 0.26 gallon bladders in October 2004) with air pressure control manifolds and a 60 gallon air compressor were used to extract and discharge the groundwater into a 1,000 gallon polyethylene settling tank. The bladder pumps were expected to deliver a combined flow of 1 gpm into the settling

ER0008 32 2007.05.24 Revision 3.0
tank. A Grundfos Redi Flow III variable speed transfer pump that allows for remote control of the injection flow rate, transfers the groundwater within the settling tank through the above ground treatment system and into the three injection wells. Through the use of the variable speed control, an injection flow rate of approximately 1 gpm was expected.
Above ground treatment of the extracted groundwater consisted of two GAC drums in series to prevent the injection of VOC contaminated water into the test cell. This was later decreased to one GAC drum due to onsite water treatment regulations required by state environmental officials.
A multi-channel variable flow peristaltic pump with computer input terminal (chemical feed pump) was installed to allow for the automated injection of electron donor to the test cell during the biostimulation and bioaugmentation phases of the demonstration. During the biostimulation phase and the first half of the bioaugmentation phase a 13 minute pulse of electron donor equal to approximately 3 times the calculated stoichiometric demand of the test cell was dosed into the treated groundwater on a daily basis (March 5, 2003 and May 28, 2004). For the latter half of the bioaugmentation phase a 13 minute pulse of donor equal to 3 times the stoichiometric demand of the test cell was dosed into the circulating groundwater every 48 hours in an effort to reduce the effects of biofouling within the circulation system and injection wells.
Remote control of the extraction, transfer and chemical feed pumps were accessed through a data acquisition and control system. The system consisted of an on site laptop computer with modem and DSL line, with CITECT for Windows 95/ NT Version 5.40 Rev. 00 to control all of the inputs and outputs of the equipment. The data acquisition system was programmed to record system data on an hourly basis and saved to a data file at the end of each day. A second program would average the hourly readings over the entire day and incorporate them in a summary data file (Appendix J).
3.5.1.3 Recirculation System Shakedown
The initial testing of the recirculation system required a stepwise testing procedure to ensure that all equipment was functioning as intended. The extraction pump air solenoid emergency shutoff, bladder control modules, flow elements, level alarms and discharge piping were the first units tested. Calibration and confirmatory testing of the extraction well flow meters and optimization of the bladder pump extraction rates was completed. Initial testing of the groundwater transfer and above ground treatment system determined that there were logic control and wiring issues between the Grundfos pump and the PLC. These issues were remedied by the PLC vendor (Calcon). The final phase of testing involved the injection and biostimulation system. The injection system flow meters were calibrated and the remote control settings for the biostimulation system were edited remotely by Calcon.
At the request of the DNTS program manager (T. McHale), high level alarms were wired to an auto dial out system in all above ground secondary containment areas.

ER0008 33 2007.05.24 Revision 3.0
Prior to start up, cold temperatures and a power outage caused the heat tracing tape connected to the above ground process piping to fail. As a result, several lines that contained water from initial testing of the equipment froze and cracked. Affected piping, pipe fittings and control devices were replaced. Most of the original piping was replaced and subsequent leak testing confirmed no other damage to the above ground components of the system. An indoor heating unit was installed within the RUB™ tent for operation during the winter months for the remainder of the pilot study.
3.5.1.4 Technology Maintenance Procedures
Maintenance procedures were developed to prevent possible equipment failures and ensure that the operation of the groundwater recirculation system continued to run at the designed specifications. The maintenance procedures performed over the course of the demonstration are described in Table 7.

ER0008 34 2007.05.24 Revision 3.0
TABLE 7: TECHNOLOGY MAINTENANCE PROCEDURES
Inspection / test Frequency Purpose
Above ground process piping Daily Identify and repair leaks as necessary
Extraction well sediment filters Daily Determine if filter needs to be replaced.
Pre treatment (GAC) bio-filter Daily Determine if filter needs to be replaced.
Injection well biofilm filters Daily Determine if filter needs to be replaced.
Flow meters Daily Ensure that flow meter is operational.
Data acquisition system At least weekly Observe flow trends and system down time and correct as necessary
Chemical feed pump At least weekly Verify actual electron donor addition meets targets
Air Compressor Weekly Ensure it is operating at suitable pressures.
Groundwater sample collection from GAC treatment system Weekly
Prevent injection of VOC contamination into test cell
Down load data files At least monthly To monitor system operations remotely
Ground water low rates At least monthly
Ensure that groundwater recirculation approximating continuous flow at target of 1 GPM
Flow meters At least monthly Verify against flow rate test that flow meters are recording flow accurately
Measure water levels in test cell At least monthly Track changes in groundwater elevation in cell
Extraction pumps and bladders Semi annually
Determine if bladder needs replacing or pump requires preventative maintenance
Inline ORP probe calibration check Semi annually Ensure measuring ORP correctly
Emergency shut down alarm system Semi annually Confirmation of continuing operation Notes: GPM - gallons per minute GAC - granular activated carbon VOC - volatile organic compounds ORP - oxidation - reduction potential
3.5.1.5 Operational Issues and Corrective Action
The groundwater recirculation system began operating on a continuous basis on March 25, 2002. Overall the field system operated for more than 154 weeks. The following is a summary

ER0008 35 2007.05.24 Revision 3.0
of operational issues or corrective actions that were completed with the system. Appendix I contains a summary of the field operation and contains a summary of sampling and operational changes that occurred over the duration of the experiment.
• Initially, the injection flow rate consistently exceeded the rate of extraction. It was determined that the injection pump selected was more powerful then required. Rather than replace the pump, the variable frequency drive was set to the minimum set point and a flow restricting globe valve was installed on the effluent of the pump. These actions effectively decreased the on-off cycling of the injection system. This change is noted on the process and instrumentation diagram in Appendix F.
• Baseline operation of the recirculation system continued until October 2, 2002. A monthly inspection of the extraction pumps determined that the bladders of two extraction pumps had filled with silt and had damaged some of the internal components. The pumps were sent off-site for repair and the extraction wells were developed in the same manner as described in Appendix A. The system was restarted for normal operations on November 4, 2002.
• In October 2004, due to decreasing extraction flow rates, the bladders in each extraction pump were replaced with 0.26 gallon bladders. This allowed for a slightly less frequent pressurization cycle, decreasing the wear on the bladder pumps.
• The biostimulation phase of the demonstration began on March 5, 2003, and included the injection of electron donor (sodium lactate and ethanol) to the test cell as described in Subsection 3.5.1.2. Electron donor addition continued until the end of the bioaugmentation stage on March 25, 2005, marking the beginning of the final post-bioaugmentation phase of the demonstration which continued until May 26, 2005. Over these three phases, biofouling and precipitate accumulation within the extraction, circulation and injection system became increasingly problematic. As a result of the increasing biofilm growth, the extraction, circulation and injection system was augmented in stages to deal with each rising issue. Prior to this phase, the groundwater was extracted to the surface and into a 1000 gallon storage tank for transfer to the GAC treatment system and injected into the Test Cell by a submersible pump. On June 2, 2004 the groundwater circulation piping was altered such that extracted groundwater was processed directly through the GAC treatment system and into the injection wells due to rapid biofilm growth within the storage tank. The storage tank was then plumbed to receive water from the GAC treatment system whenever the pressure relief valve was triggered (6 psi). Due to persistent biofilm growth and increasing precipitation of suspected iron sulfides within the circulation system, a 10 micrometer (µm) filter was added upgradient of the GAC treatment system and a 5 µm filter installed upgradient of each injection well (IW) flow meter. A 5 µm filter upgradient of each extraction well (EW) flow meter were installed at the outset of the demonstration (Appendix F).

ER0008 36 2007.05.24 Revision 3.0
• Despite the changes listed above, frequent cleaning or replacement of the flow meters and circulation piping as well as re-development of the EW and IW wells was required. Cleaning of the injection lines was completed by circulating Citrinox® (a phosphate free, biodegradable liquid acid cleanser and detergent for removal of scale, metal oxides, metal complexes, trace inorganics, milkstone, soil, grit, buffing compound, grime, grease, fats, oils, particulates, deposits, chemical and solvents), and a 10% dilute bleach solution and containing the waste water in the storage tank for eventual injection into the test cell. EW and IW development was consistent with the methods described in Appendix A. IW treatments involved the addition of 1 L of chlorine bleach and a contact time of 30 minutes at each well prior to removing the treatment solution during development activities.
As part of the maintenance schedule, water levels within the test cell were measured on at least a monthly basis. Review of the groundwater elevation data implied that the water table within the test cell was decreasing with time from 12 ft bgs in July 2001 to 15 ft bgs in May 2002. The cause of the lowering water level was suspected to be caused by the combined effect of the removal of water from the closed system through regular sampling volumes and changing storage volumes of as little as 50 gallons within the above ground components of the recirculation system. It is noteworthy to mention that due to the relatively small size and low effective porosity (estimated to be 0.12) of the confined cell, high and low atmospheric pressure systems have been known to affect a 1 foot variance in the water level within the test cell. A total of 3,600 gallons of potable water were added to the test cell between January 31, 2003 and May 17, 2005 in an attempt to maintain the water level at a minimum of 16 ft bgs, 1 ft above the first sample depth of the multilevel piezometers.
3.5.2 Period of Operation
This subsection describes the dates and duration of each phase of the demonstration. Table 7 summarizes the lengths of time for the different phases of operation. Table I1 in Appendix I describes the activities that occurred during each phase of the demonstration.
Table 8 - Period of Operation for Each Operating Phase
Phase of OperationStart End
Phase 1 - Design Installation and Tracer Testing 1-Apr-01 24-May-02 418Phase 2 - Baseline 25-May-02 25-Feb-03 276Phase 3 - Biostimulation 5-Mar-03 16-Jul-03 133Phase 4 - Bioaugmentation 18-Jul-03 4-Mar-05 595Phase 5 - Post Bioaugmentation 11-Mar-05 26-May-05 76
Period of Operation Total Number of Days

ER0008 37 2007.05.24 Revision 3.0
3.5.3 Amount/Treatment Rate of Material to be Treated
As described in Section 3.4.6, approximately 26.4 gallons (100 L), corresponding to 162 kg, of PCE DNAPL were released into the test cell. The VOC mass removed as PCE equivalents varied between the operational phases of the demonstration.
To the end of May 2005, approximately 84 pore volumes of groundwater were extracted, treated and re-injected into the test cell. Figure 6 shows the cumulative mass extracted over time, as PCE in kg. The mass was calculated by summing the total VOCs reported in the effluent samples (collected weekly), correcting them to PCE equivalents and then accounting for the total groundwater extracted during that same time interval and expressing it as a mass. This calculation estimates that approximately 79 kilograms (kg) of PCE mass was removed from the groundwater over the demonstration. This represents approximately 49% of the total PCE mass assuming that all of the 100L (162 kg) of PCE released in the cell was in the saturated zone. As discussed in Section 3.5.1, it was known that at least some of the original PCE source was perched in the unsaturated zone and therefore the exact mass distribution is unknown. Appendix H provides details on the calculations of mass balance.
Operation of the SVE system is estimated to have removed an additional 16 kg of the PCE mass from the unsaturated zone (not included in Figure 6). In total approximately 59% of the PCE mass originally released in the Test Cell were removed and treated. At the completion of the demonstration residual mass of PCE still remained in both the saturated and unsaturated zones with the test cell.
3.5.4 Residuals Handling
Drill cuttings from the initial test cell investigation and spent GAC from the groundwater treatment system were characterized and disposed of by DNTS personnel according to base hazardous waste disposal procedures. Solid waste (e.g., gloves, sample tubing, syringe filters and syringes) were disposed of as regular waste. Groundwater extracted from the test cell during purging and development activities was discharged into the settling tank for treatment through the GAC canisters and re-injection into the test cell.

ER0008 38 2007.05.24 Revision 3.0
0
10
20
30
40
50
60
70
80
90
0 200 400 600 800 1000 1200
Time (days)
Cum
ulat
ive
Mas
s R
emov
ed (a
s PC
E Eq
uiva
lent
s, in
kg)
BiostimulationBaseline BioaugmentationPost
Bioaugmentation
Figure 6. Cumulative Mass Removed Over Time
Notes: As calculated from VOC measurements at the extraction wells, corrected for ethene recirculated, as applicable.
3.5.5 Operating Parameters for the Technology
The demonstration of the technology was designed to be completed in sequential operational phases (see Table 8). After system start up and shakedown (Phase 1) baseline operation (Phase 2), started on 25 March 2002. Phase 3, began on 5 March 2003 when we began supplementing with electron donor to increase the activity of the indigenous microorganisms and attempt to stimulate complete VOC dechlorination of the PCE DNAPL. On 18 July 2003, the test cell was bioaugmented with KB-1, a bacterial consortium containing Dehalococcoides species, initiating the start of Phase 4. The final phase of operation (Phase 5), post-bioaugmentation without the addition of electron donor, was initiated on 4 March 2005. Table I1 details all of the major events, such as groundwater sample events, equipment malfunctions and water addition to the test cell that occurred over the course of the demonstration.
The initial site investigation and the installation of the monitoring points and groundwater circulation system required the services of contractors to safely install soil boreholes, complete electrical wiring and set up the programmable logic controller (PLC). In general, one field technician was required on a daily basis to ensure the optimal operation of the demonstration during operational phases 2 through 5. Tasks identified as requiring regular monitoring include
ER0008 39 2007.05.24 Revision 3.0
those described in Table 6 (Section 3.5), though unforeseen issues such as those described in Section 3.5.1.5 were also handled by the onsite field technician as required. More laborious tasks, such as the installation of the multilevel piezometers and fully screened injection and extract wells, set up, calibration and testing of the above ground recirculation system and collection of groundwater samples on scheduled snap shot sample rounds, required two technicians to complete the work in a timely manner. The on site PLC allowed for remote monitoring of the recirculation system flow rates, water levels, oxidation reduction potential of injected groundwater and alarm conditions. Data files were created on a daily basis by the PLC and down loaded for review on at least a weekly basis. The average daily operational parameters as recorded by the PLC are shown in Table J2.
The progress of the demonstration was monitored by collecting groundwater samples from the test cell and tracking the VOCs, dissolved hydrocarbon gases (DHGs), volatile fatty acids (VFAs), anions, and DHC within the test cell. Weekly samples were collected from the three extraction wells and from the treated groundwater, in order to assess the mass discharge from the test cell and to ensure that VOCs were effectively removed from the injection water by the GAC treatment system. Snap shot sampling events were scheduled at varying intervals within each operational phase of the demonstration to gain detailed information regarding the effectiveness of the technology across three transects within the test cell. The timing of each snap shot sampling round was scheduled based on the VOC concentration in samples collected from the EWs in previous months and on the availability of the on site laboratory. The analytical data generated from the weekly EW samples and from each snap shot sample round was utilized to calculate changes in the mass discharge across the three transects during each phase of the demonstration. In January 2004, a sampling plan was developed to include quarterly sampling events from all sample locations for analyses, weekly samples for VOC analysis and bi-monthly samples for VFA and DHG analyses from the extraction wells. This was adjusted on 4 June 2004 to weekly collection of groundwater samples from the extraction wells for analysis of VOCs, DHGs and VFAs. Details regarding the purging and sampling methods employed to track the progress of the demonstration are presented in Appendix A. Details regarding the laboratory standard operating procedures for the analysis of the samples submitted over the course of the demonstration are presented in Appendix B.
3.5.6 Experimental Design
The primary objectives of the demonstration were: • To enhance the dissolution rate (discharge) of a DNAPL source via enhanced biological
activity (bioaugmentation); • To demonstrate that enhanced biodegradation is an effective means of containing a high
concentration source zone by rapidly degrading the dissolved phase plume emanating from the source zone;
• To validate the performance of the technology at field scale; and,

ER0008 40 2007.05.24 Revision 3.0
• To provide valuable operational data that may be used to guide future applications of this technology.
The approach used to meet the project objectives was to compare the mass discharge of VOCs from the PCE DNAPL under baseline conditions (Phase 2), to enhanced bioremediation (Phase 3) with the addition of electron donor, bioaugmented conditions (Phase 4) and bioaugmented conditions without the addition of electron donor (Phase 5). It was anticipated that the removal rate of PCE would be significantly higher during Operational Phase 4 (bioaugmented conditions) than during the other operational phases. Further, the VOC mass discharge in groundwater was expected to be lower during Phase 5 (post bioaugmentation – no electron donor addition) since the dehalorespiring microorganisms will degrade the chlorinated solvents at a lower rate due to electron donor limitations.
Prior to initializing operational Phase 2 (baseline) a tracer test was performed within the test cell to determine the hydraulic characteristics of the aquifer materials. Appendix G presents the results of the tracer tests. Prior to initializing operational Phase 5 (post-bioaugmentation), a second tracer test was performed for the purpose of identifying possible changes in flow paths within the test cell. This comparison would help with data interpretation collected over the course of the demonstration.
A number of operating parameters were maintained at constant set points in order to meet the demonstration objectives. The groundwater circulation rate was maintained at approximately 1 gpm during all of the operational phases. The groundwater elevation within the test cell ranged from 15 to 17 ft bgs (as described in Section 3.5.1.5). Phase 2 of operations was initiated with the addition of a daily dose of electron donor (sodium lactate and ethanol) into the injection water stream. The time weighted average of ethanol and lactate added to the test cell on a daily basis for Phases 2 and 3 was 60 mg/L and 24 mg/L, respectively. In May 2004 (in Phase 4), the ethanol and sodium lactate addition schedule was decreased to one dose every two days in order to decrease the concentration of electron donor reaching the extraction wells and the rate of bacterial growth that was fouling the groundwater circulation system.
Monitoring of the performance of the demonstration consisted of daily system inspections as described in Section 3.5.1.4 and scheduled groundwater monitoring as described in Section 3.5.5.
3.5.7 Sampling Plan
The evaluation of the effectiveness of biologically enhanced dissolution of the PCE DNAPL was based on the results of groundwater sampling and analysis (Table 7). The analytical results from samples collected from the EWs on a weekly basis were used to develop the schedule for the detailed snap shot rounds for each phase of the demonstration. Groundwater samples were collected on multiple occasions following system installation, during the tracer tests, prior to electron donor addition, and before, during and following bioaugmentation. These samples were

ER0008 41 2007.05.24 Revision 3.0
analyzed in both the field and in the laboratory as described in Appendix A. Table A1 lists the analytical sampling schedule for each sampling location, the analysis performed, and the analytes reported. Details regarding field groundwater parameter measurements and sample collection methods are provided in Appendix A. Details regarding Laboratory Methods for the analysis of site soil and groundwater samples are provided in Appendix B.
The experimental controls (trip blanks and field duplicate samples) incorporated in the design of the demonstration served to ensure that the interpretation of the monitoring data provided a reliable assessment of the applicability of bioaugmentation at DoD sites. Weekly samples collected from the EWs and a total of 4, 2, 8 and 1 snap shot sample rounds were completed to compare the mass discharge from the DNAPL source during the background, biostimulation, bioaugmentation and post-bioaugmentation phases of the demonstration, respectively. The methods for the collection of experimental control samples and calibration of field instrumentation are detailed in Appendix A. The data quality parameters, calibration procedures, quality control procedures, and data quality indicators, employed to ensure that the data was representative, complete and accurate, are provided in the Quality Assurance Plan (QAPP; Appendix C). Data quality parameters and calibration procedures for each analytical laboratory are described in Appendix B.
3.5.8 Demobilization
At the completion of the demonstration, DNTS requested that the site infrastructure established under this demonstration project be maintained for future projects within the test cell. As a result, no demobilization costs were realized. Estimated costs for demobilization are described in Section 5.
3.6 Selection of Analytical/Testing Method
The primary and secondary analytes chosen to monitor the performance of the technology included VOCs, DHGs, VFAs, anions, and dissolved and total metals (iron and manganese). Where possible, the methods chosen were standard methods promulgated by either the USEPA or American Standard for Testing and Materials (ASTM). A summary of the laboratory analytical methods used for the demonstration is presented in Table B1. The analytical methods used during the demonstration are presented in Appendix B.
3.7 Selection of Analytical/Testing Laboratory
Commercial analytical laboratories were selected on the criteria of lowest cost and demonstrated technical competence. Soil VOC and JP-4 Jet Fuel analysis was performed by Columbia Analytical Services of Rochester, NY. Groundwater samples collected for VOC analysis were performed by DNTS (on-site laboratory) and SiREM Laboratory (Guelph, Ontario), while analysis of DHGs, VFAs, anions and microbial characterization (DGGE, quantitative PCR, Genetrac Dhc assay, microcosms) were performed by SiREM. Groundwater

ER0008 42 2007.05.24 Revision 3.0
samples collected for SCIA analysis were performed by the University of Toronto Isotope Laboratory Toronto, Ontario.
ER0008 43 2007.05.24 Revision 3.0
4. PERFORMANCE ASSESSMENT
4.1 Performance Criteria
The performance of the field demonstration was evaluated using the general performance criteria provided in Table 9. Qualitative and quantitative criteria are classed as either primary or secondary performance assessment criteria, respectively.
The primary criteria constitute the performance objectives (previously presented in Table 4) of the technology demonstration. As stated in Section 1.2, the general objectives of the demonstration were to enhance the dissolution of the DNAPL source and to contain down-gradient migration of contaminated groundwater by increasing the rate of biodegradation within the source zone. In general, the performance criteria were used to evaluate these objectives by:
• Quantifying the effect of the technology on the mass discharge from the source zone;
• Quantifying the effect of the technology on VOC degradation rates;
• Assessing the potential benefits of bioaugmentation;
• Determining the ability of the added microbial consortia to colonize the source zone; and,
• Evaluating the difficulty in implementing this technology at the field scale.

ER0008 44 2007.05.24 Revision 3.0
TABLE 9: EXPECTED PERFORMANCE CRITERIA Test Cell #1, Dover AFB, Delaware
Performance Criteria Description of Criteria
Qualitative
Increase PCE Degradation Rate An increase in the degradation rate of the parent compound (PCE) will enhance the rate of DNAPL removal dissolution; faster DNAPL removal will decrease length of remediation
Increase Extent of Dehalogenation Stimulating complete degradation to ethene will limit the mobility of the chlorinated daughter
products Extent of Dehalogenation Stimulating complete degradation to ethene will limit the mobility of the chlorinated daughter
products Duration of Remediation Time required to remove the source zone using enhanced bioremediation/bioaugmentation
relative to flushing with unamended groundwater (base case treatment)1.
Mass Flux from DNAPL during treatment Rate that mass is removed from DNAPL by remedial technology; presence of DNAPL mass
requires remediation of the groundwater plume over a period of decades to centuries. Mass Flux from DNAPL following treatment Mass flux of groundwater plume emanating from DNAPL source; reduction in flux following
treatment caused by removal of DNAPL and enhanced biodegradation of parent PCE to ethene.
DNAPL Mass Fraction of the initial DNAPL mass removed by demonstration; significant DNAPL removal required to eliminate groundwater plume.
Quantitative
Increased mass flux from DNAPL during treatment (after amendment with electron donor and after
bioaugmentation)
Rate that mass is removed from DNAPL by remedial technology. Presence of DNAPL mass requires remediation of the groundwater plume over a period of decades to centuries.
Change in plume mass flux Mass flux of groundwater plume emanating from DNAPL source; reduction in flux following
treatment caused by removal of DNAPL and enhanced biodegradation of parent PCE to ethene.
PRIM
AR
Y
Reduce DNAPL mass and mobility of groundwater plume
Fraction of the initial DNAPL mass removed by demonstration; significant DNAPL removal required to eliminate groundwater plume.
Mobility of Groundwater Plume Extent of steady-state plume controlled by the rate and extent of VOC degradation
Microbial Activity In Source Zone The ability of the inoculated consortia to colonize the source zone is essential to enhancing the
mass flux of PCE
Factors Affecting Performance 1. location and amount of biomass injected into test
cell. 2. location and concentration of electron donor
injected into test cell. 3. geologic heterogeneity
1. Creating a zone of highly active dehalogenating biomass in the immediate vicinity of the DNAPL is of critical importance; colonization of dehalogenating microorganisms is influenced by specifications of innoculum, location of injection point, and concentration of electron donor at injection point. 2. Electron donor is anaerobically fermented to produce hydrogen (the primary substrate) which can be utilized by non-dehalogenating microorganisms; need to ensure that electron donor is supplied to active dehalogenators in the source zone 3. The presence of low permeability zones may limit delivery of both the inoculum and electron donor to the source zone
Ease of Implementation Design of a bioaugmentation system requires a diverse team of professionals, including
microbiologists and hydrogeologists
Safety Minimal training requirement for on site personel include OSHA 40-Hour HAZWOPER
certification
Maintenance Requirements One operator with minimal additional training is required for occasional visits during the demonstration; weekly adjustments and maintenance will be needed in addition to sample collection
Appropriate Redox Conditions Low dissolved oxygen concentration and oxidation-reduction potential are required to permit an increase in the activity of the dehalogenating microorganisms
Process Waste None expected
Reliability Operation of system expected to be highly reliable and capable of operating without the need for a full-time operator
SEC
ON
DA
RY
Hazardous Materials Generated None expected (potentially dehalogenation daughter products)
Note:
1 The base case condition consists of flushing the source zone with unamended groundwater; the rate of DNAPL removal is analagous to remediation using pump and treat

ER0008 45 2007.05.24 Revision 3.0
TABLE 10: EXPECTED PERFORMANCE AND PERFORMANCE CONFIRMATION METHODS
Performance Criteria
Expected Performance Metric
Performance Confirmation Method2 Actual
Qualitative
PCE Degradation Rate
Increase in degradation rate
following bioaugmentation
Interpretation of trend and distribution of
VOCs, ethene, and Cl- in groundwater
Evidence of increased degradation following bioaugmentation however data interpretation is complicated by a loss in permeability (biofouling) in the Test Cell as described in Section 4.3. Between Phases 2 and 4 there was an increase in daughter production from 2 to 278 mmol/day. There was no difference in production of daughter products between Phases 2 and 3. The decrease in PCE over the same interval is shown in Table H6.
Extent of Dehalogenation
Complete dehalogenation to
ethene
Analysis of groundwater samples for PCE and
PCE daughter products, and SCIA signature
Complete dechlorination to ethene observed during both bioaugmentation and post bioaugmentation phases. SCIA analyses at late time indicate PCE dissolution had occurred in some locations within the test cell.
Duration of Remediation
Remediation endpoint (e.g., 5 µg/L)
achieved faster
Interpretation of trends and distribution of
VOCs, ethene, and Cl- in groundwater
Evidence of increased degradation rate following bioaugmentation however data interpretation is complicated by a loss in permeability in the Test Cell. Data from the chloride mass balance suggest a 2 fold increase in degradation, other data (from transects) suggest possibly as high as 4.5 times increase in daughter products from the addition of electron donor.
Quantitative Mass Flux from DNAPL 1. after amendment with electron donor
Increase in mass flux above the base case1 treatment
2. after bioaugmentation
Decrease in mass flux of chlorinated VOCs relative to base case1 treatment
Measurement of the concentrations of VOCS, ethene, and Cl-
The base case mass flux was elevated over expected amount due to how recently the DNAPL had been released (See Appendix H); if the early time data, while DNAPL was still mobile, is not included in the analysis than there was an increase in mass discharge (30 g/day) above the biostimulation phase (67 g/day) during the bioaugmentation phase (97 g/day). Chloride results (Appendix H) indicate that mass discharge increase as a result of biodegradation processes was measured by an increase of chloride (12kg) between the biostimulation and bioaugmentation phase. During bioaugmentation phase 4.5 times more daughter products were extracted compared to PCE (22 vs 4.5 g/day)
DNAPL Mass Reduction in DNAPL mass greater than base case1 treatment
Mass balance based on the estimated PCE mass flux
There was a significant decrease in PCE DNAPL mass at the extraction wells between the base case (biostimulation - 56 g/day as PCE and more than 98% of the mass extracted was as PCE) and the bioaugmentation phase (5 g/day as PCE with this being less than 20% of the total mass extracted, the remaining 80% was TCE, cis-DCE, VC and ethene).
PRIM
AR
Y C
RIT
ER
IA
Mobility of Groundwater Plume
Decrease in the steady-state plume length
Calculated based on simulated steady-state plumes using degradation rates estimated with from VOC, geochemical and CSIA results
Results sugges that steady state plume had not been reached, even during biostimulation and bioaugmentation phases. This suggests that predicting a decrease in steady state plume may not yield meaningful results. The CSIA results (measured by a stable PCE parent isotope signature) indicate that PCE indicative of a source zone persisted in most of the monitor locations for the duration of the test.
TABLE 10: EXPECTED PERFORMANCE AND PERFORMANCE CONFIRMATION METHODS (continued)
Performance Criteria
Expected Performance Metric
Performance Confirmation Method2 Actual
Qualitative
SEC
ON
DA
RY
C
RIT
ER
IA
Microbial Activity In Source Zone
Increase in the concentration of biomass and the extent of colonization of source by bioaugmented consortia
DGGE and DHE analyses and molecular probes to identify bioaugmented consortia
There was a large increase in biomass throughout the test plot as evidenced by the PCR Gene Trac analysis (Table K4 in Appendix K)

ER0008 46 2007.05.24 Revision 3.0
Factors Affecting Performance 1. location and
amount of biomass injected into test
cell
Mobility of biomass may be limited in porous media; accumulation of biomass in the source zone preferred
Experience from operation of demonstration; collection of samples for microbial characterization. This demonstration found increased biomass at extraction wells (reductions in well yield).
Groundwater results (VOC and PCR Gene-Trac) suggest that biomass developed throughout the test cell. The proximity to DNAPL was not investigated through soil sampling.
2. location and concentration of
electron donor injected into test
cell
Electron donor may be preferentially consumed by biomass without stimulating dehalogenation of chlorinated ethenes
Experience from operation of demonstration; collection of groundwater samples and analysis of electron donor concentration. Results from the demonstration showed the electron donors were detected in most (>80%) of the sample points. PCE degradation products were also observed in a majority of sample locations.
The injection technique was able to distribute electron donor throughout the test cell. Biofouling within the test plot and injection wells interfered with the distribution of the electron donor and negatively impacted performance.
3. geologic heterogeneity
Low permeability may limit the delivery of electron donor and biomass to the source
Experience from operation of demonstration; tracer testing.
Tracer test indicated that there was some variability within the groundwater flow paths within the test cell that were attributed to geologic heterogeneity and would have affected electron donor distribution during the early part of the demonstration.
Ease of Implementation
Operator training required
Experience from demonstration operations
Acceptable; operator training was successful with minor expense
Safety 1. personal protective equipment
PPE Level D required Experience from operation of
demonstration
no health and safety incidents occurred
2. chemical hazards
None expected Ethanol (electron donor) is a flammable substance. Review of storage and volumes stored should be
completed prior to electron donor selection. Maintenance Requirements
Replacement of tubing in peristaltic
pumps; frost protection; adjustment
of injection level control system;
replenishment of amendments
Experience from demonstration; evaluation of
maintenance records
See Appendix I for Summary of Operations which details O&M activities. In general for this
demonstration the maintenance requirements were more than expected. But this was due to nature of the test cell. Specifically keeping the water table within a 1 foot interval took effort. This would not be required at other sites. Equipment wear/tear/replacement was as
expected. Quantitative
Achieve Appropriate Redox
Conditions
Anaerobic and reducing
groundwater in test cell
Field measurements of dissolved oxygen and oxidation/reduction
potential
Appropriate redox conditions achieved. During bioaugmentation phase conditions ranged from sulfate
reducing to methanogenic (-50 to -250 mv).
Process Waste GAC vessels disposed of by
DNTS
Experience from operation of demonstration
Minimal - see Section 3.5.4
Reliability Fraction of time system is shut
down (zero flow)
Evaluation of system operational records
Moderate; some system shut down time due to biofouling and operations - see Appendix I
Hazardous Materials Generated
None Analysis of groundwater samples for PCE daughter
products
No hazardous materials generated other then the production of temporary degradation intermediate
daughter products (cDCE and VC) as PCE is converted to ethene.
Notes
1 The base case condition consists of flushing the source zone with unamended groundwater; the rate of DNAPL removal is analagous to remediation using pump and treat
2 All chemicals and microbial analyses were performed using the sampling and laboratory methods and QA/QC protocols described in Appendix A and B

ER0008 47 2007.05.24 Revision 3.0
4.2 Performance Confirmation Methods
The success of the technology demonstration was evaluated using the performance expectations and confirmation methods presented in Table 9. Table 10 lists the actual performance metrics. As discussed in Section 3.5.3 above, and Section 4.3 below, successful implementation of the technology demonstrated that there was a significant increase in the degradation of aqueous PCE with rapid and complete degradation to ethene in operational Phase 4 over all other operational phases. This finding is confirmed through numerous analyses conducted throughout the course of the demonstration.
Sample collection and laboratory analytical methods used over the course of the technology demonstration are provided in Appendix A and Appendix B, respectively. Appendix C contains a copy of the quality assurance plan that was used to ensure data met the specified data quality objectives. Appendix E contains a summary or the work completed as part of the laboratory experiments. A summary of site information, including information regarding process control information, borehole and well construction logs and a summary of the operation of the SVE system is provided in Appendix F. Information on the metrics and data interpretation for the tracer tests completed in the test cell is provided in Appendix G. The methods used to calculate the mass discharge of VOCs from the test cells are provided in Appendix H. A chronology of the field operation activities completed for the field demonstration is provided in Appendix I. As outlined in Table 8 routine field parameter measurements were taken from the field demonstration to monitor the geochemical conditions; the complete data set of the field parameter measurements is provided in Appendix J. A summary of the organic and geochemical samples collected over the duration of the field demonstration is provided in Apprendix K. Figure K1 to K13 in Appendix K are VOC trend plots of the data collected.
4.3 Data Analysis, Interpretation, and Evaluation of Laboratory Demonstration
As described in Section 3.4 there were a number of laboratory experiments completed as part of this demonstration. This work was completed by researchers at the University of Toronto (Drs. E. Edwards, K. Mo, B. Sleep, B. Sherwood Lollar, and their staff, including Dr. P. Morrill, Mr. D. Seepersad and Ms. C. Heidorn). Appendix E contains a summary of the results of this work. The laboratory experiments included batch microcosm tests and the 2-D model aquifer tests.
The purpose of the batch microcosm test was to evaluate dechlorinating cultures for dechlorination rates and to select a suitable culture for use in the model aquifer and field studies. Three cultures were tested during the batch microcosm tests: 1) the Pinellas culture, 2) KB-1, and 3) TM (Toronto Main). In the laboratory batch microcosm test, the Pinellas culture was able to degrade PCE to VC at a faster rate and produced slightly less methane than KB-1. However,

ER0008 48 2007.05.24 Revision 3.0
the KB-1 culture was selected for the model aquifer and pilot testing, because at the time of this work (mid-2001) it had the most substantial information on its molecular characterization (ie., routinely was tested to be free of pathogens, and had other research supporting developing techniques for quantitation etc).
The major component of the laboratory work was the 2-D model aquifers (2D boxes). This work was partially completed as the masters thesis of D. Seepersad (2003) and a copy of this thesis has been provided to ESTCP. A peer reviewed paper, Sleep et al (2006), has been prepared and the abstract for this paper is provided in Appendix E. In summary, the study by Sleep et al (2006) found:
• Under biostimulation conditions, no dechlorination to ethene was observed, regardless of electron donor used.
• PCE dechlorination to ethene was achieved only after bioaugmentation, After 890 days the bioaugmented 2-D model aquifer box had removed 65% of the emplaced PCE source, while the non-bioaugmented box had removed only 39% of the original PCE source.
• Removal rates reached their peak approximately 100 days after bioaugmentation but then bioclogging (biofouling) occurred, which decreased removal rates. Reduction rates ranged from 2 to 3 fold. The declining reduction rates were attributed to a depleting DNAPL source area and reduced flow in the DNAPL source due to bioclogging and pore blockage caused by methane gas generation.
• The native Dover soil microbial community contained a member of the Dehalococcoides group that was not able to dechlorinate PCE;
• The presence of a PCE DNAPL source did not noticeably affect the native or bioaugmented microbial community;
• Dehalococcoides proliferated after bioaugmentation, even in the source zone;
• Microbially mediated PCE reductive dechlorination resulted in up to a 3-fold increase in PCE dissolution.
In summary, the batch microcosm and the 2-D aquifer experiments demonstrated that microbial dechlorination of an emplaced PCE source can enhance the dissolution rate of a DNAPL source above that achievable by groundwater flushing alone. Limiting factors include controlling bioclogging, which restricted the delivery of electron donor to the source area, and methane generation, which also restricts flow due to pore blockage. The use of quantitative PCR

ER0008 49 2007.05.24 Revision 3.0
techniques and microbial community analysis were beneficial in corroborating the presence and quantities of target microbial populations.
4.4 Data Analysis, Interpretation, and Evaluation of Field Demonstration
The field demonstration operated for over 1,200 days, substantially longer than originally planned. A brief chronology of the operational issues that occurred during the demonstration from a field implementation perspective is provided in Section 6. During the field demonstration groundwater samples were collected from the extraction wells and from the multi-level piezometers within the test cell. Samples were collected for a range of parameters (e.g., geochemical, organic, inorganic and microbiological parameters). The extraction well data was collected on a frequent (weekly) basis while the multi-level piezometer data was typically collected on a quarterly basis. Supporting information for the data analysis and interpretation is provided in Appendix H (Measurement of Solute Mass Flux and Mass Discharge) and Appendix K (Laboratory Analytical Results and VOC Trend Plots).
In general, data will be presented as summaries of the extraction well data and data from transects within the test cell (Figure 3), or as a combination of both of these monitoring locations. Transect 1 was the closest to the injection wells and comprised multi-levels T1, T4 and T7 (Figure 3). Transect 2 was located near the midway point between injection and extraction wells and comprised multilevels T2, T5, T8, T10 and T12. Transect 3 was located in the final third of the test cell, nearest to the extraction wells and comprised multilevels T3, T6, T9, T11 and T13. Each multi-level piezometer had 5 sampling depths (Appendix F).
Table 7 presents the ratio of each chlorinated ethene to the total ethenes in the groundwater collected from the extraction wells over the demonstration. Figure 8 presents the mass discharge for each phase using data collected during the major sampling events. Figure 9 presents the mass discharge, by phase, using data collected from the extraction wells.
The demonstration was completed over five operational phases of varying duration starting on November 1, 2001 and ending May 25, 2005. A summary of Phase 1 (start up and shakedown) was provided in Section 3.5. The following sections present a summary of the tracer testing (Section 4.4.1), each operational phase (Section 4.4.2 to 4.4.5), summaries of results of molecular monitoring (Section 4.4.6), stable carbon isotope monitoring (Section 4.4.7), and a summary of mass removal (Section 4.4.8).

ER0008 50 2007.05.24 Revision 3.0
Figure 7. Proportion of Total Ethenes in Extracted Groundwater
Note: Proportion of Total Ethenes corrected for ethenes present in injected groundwater
0%
20%
40%
60%
80%
100%
120%
0 200 400 600 800 1000 1200Days of Recirculation
Perc
ent o
f Tot
al E
then
es
PCETCEcis-DCEVCEthene
BaselinePost
BioaugmentationBiostimulation Bioaugmentation

ER0008 51 2007.05.24 Revision 3.0
0
20
40
60
80
100
120
phase 2 (baseline) phase 3 (biostimulation) phase 4 (bioaugmentation) phase 5 (post-bioaugmentation)
PCE
equi
vale
nts
(g/d
ay)
PCE TCE
DCE VC
Ethene
Total = 113 g/day
Total = 67 g/day
Total = 97 g/day
Total = 73 g/day
Figure 8. Mass Discharge by Phase Calculated from Data Collected during Major Sampling Events. Notes: (1) Not corrected for ethenes present in circulated groundwater. (2) Mass removal is based on data
collected from multilevel piezometers and extraction wells during major sampling rounds completed in each phase. (3) Mass removal calculated as the geometric mean of PCE and PCE degradation products as PCE equivalents in grams. See Appendix H for more details.
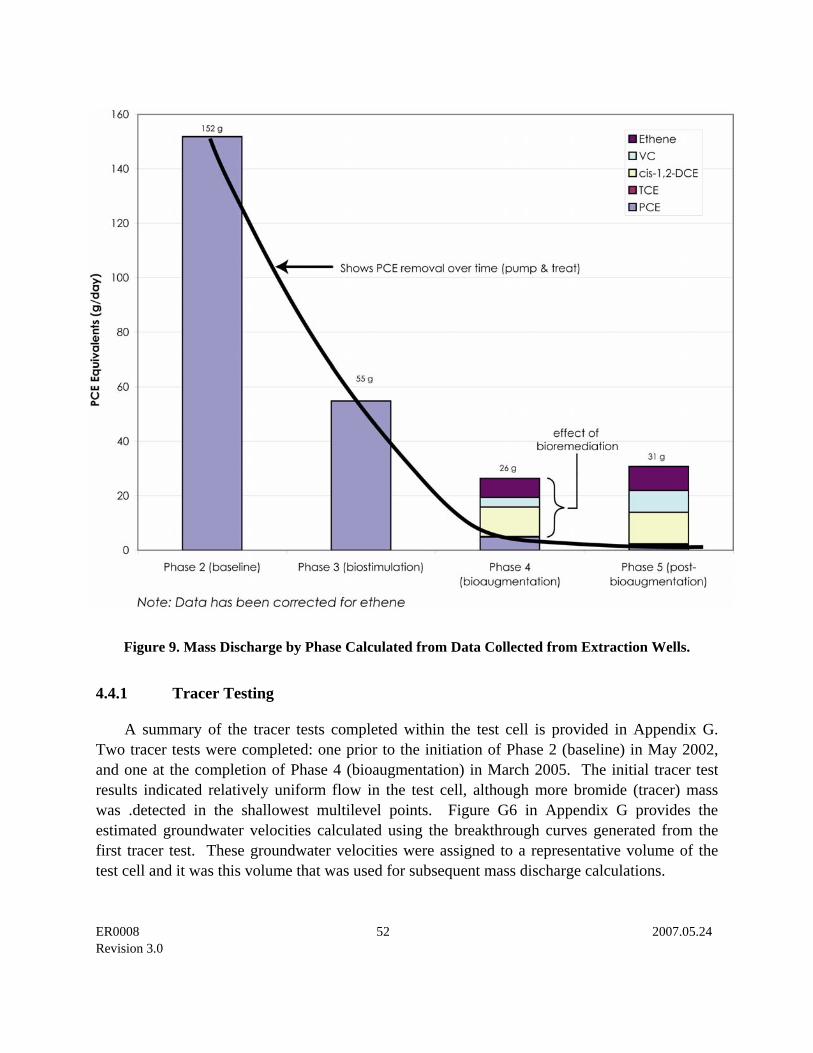
ER0008 52 2007.05.24 Revision 3.0
Figure 9. Mass Discharge by Phase Calculated from Data Collected from Extraction Wells.
4.4.1 Tracer Testing
A summary of the tracer tests completed within the test cell is provided in Appendix G. Two tracer tests were completed: one prior to the initiation of Phase 2 (baseline) in May 2002, and one at the completion of Phase 4 (bioaugmentation) in March 2005. The initial tracer test results indicated relatively uniform flow in the test cell, although more bromide (tracer) mass was .detected in the shallowest multilevel points. Figure G6 in Appendix G provides the estimated groundwater velocities calculated using the breakthrough curves generated from the first tracer test. These groundwater velocities were assigned to a representative volume of the test cell and it was this volume that was used for subsequent mass discharge calculations.

ER0008 53 2007.05.24 Revision 3.0
The second tracer test, completed at the end of Phase 4, indicated that the groundwater flow paths had changed. Figure G8 in Appendix G shows the estimated groundwater velocities calculated using the breakthrough curves generated from the second tracer test. These groundwater velocities indicate that the dominant flow areas within the test cell were along the middle and bottom portions of the cell. The lower groundwater velocities in the top third of the test cell may be due to a decrease in permeability in this portion of the cell. The decrease in permeability may be due to biofouling occurring around well screens as well as within the porous matrix of the test cell. The biofouling may be greater in the shallower portions of the test cell where the fluctuating water table and contact with the unsaturated zone could increase the oxygen levels in water. Due to the inability to determine the occurrence of the change in flow within the test cell, the original tracer test results were used to assign a representative volume to each multilevel within piezometers for all operational phases for mass discharge estimations. It should be noted that while flow paths may have changed over the duration of the demonstration, the target extraction rate (a combined rate of 1 gpm from three extraction wells) was maintained.
4.4.2 Phase 2 - Baseline
Phase 2, baseline, was operated for 15 months (145 days without groundwater flow/recirculation and 336 days with recirculation) and aimed to evaluate the effect of flushing the very young DNAPL source with groundwater in the presence of the indigenous microorganisms of the test cell. Another objective of this stage was to achieve a steady state discharge of PCE from the residual mass such that future operational phases could be compared without complications due to changing PCE residual mass. At early times, very high mass discharge rates were observed (see Tables H3 and H4 in Appendix H); this is likely due to the high surface area of the mobile PCE stringers present within the test cell as a result of the young age of the DNAPL source. Without knowing the DNAPL distribution, architecture or ganglia to pool ratio (efforts by those groups that emplaced the DNAPL were not successful (personal communication T. McHale, DNTS)) the team was unable to confidently predict if steady state conditions had been reached. After more than 13 months of recirculation the mass discharge appeared to be reaching more asymptotic removal rates. The treatment rate observed in the last two months of Phase 2 suggested a geomean PCE removal rate of about 500 mmol/day (down from over 1200 mmol/day). The decision to move forward with biostimulation was made. Given the subsequent declines in PCE mass (Table 11), there is no evidence to conclusively support that steady state had been reached at the time Phase 2 was considered complete.
Another objective of Phase 2 was to evaluate the microbial changes that occurred during this operational period (Figure 10). The ratio of each chlorinated ethene to the total ethenes in the groundwater remained constant with PCE representing 99.8% of the total ethenes present (Figure 7). The very low concentrations of other chlorinated ethenes detected in samples from the extraction wells and multilevel piezometers collected during Phase 2 suggest that in the absence

ER0008 54 2007.05.24 Revision 3.0
of a suitable electron donor, the indigenous microbial community were not capable of dechlorinating the PCE DNAPL. This is corroborated by the results of the stable carbon isotopic analysis (See Section 4.4.7) of samples collected over the baseline phase (Figure 12).
Table 11. Mass Discharge By Phase from Extraction Wells
PCEDaughter Products 1
Percent Increase in Mass from Daughter
Products 2
Kg/Day Kg/DayPhase 2 (baseline) 336 0.1517 0.0002 0%Phase 3 (biostimulation) 141 0.0548 0.0001 0%Phase 4 (bioaugmentation) 597 0.0048 0.022 82%Phase 5 (post-bioaugmentation) 83 0.0019 0.029 94%
Notes:Calculated using mass data provided in Table H4.1 Mass removed corrected for ethenes present in injected groundwater2. Increase in Mass Daughter products include TCE, cis-1,2-DCE, VC, and ethenePCE - tetrachloroetheneTCE - trichloroethenecis-1,2-DCE - cis-1,2-dichloroetheneVC - vinyl chloridekg - kilograms
Days / Phase
4.4.3 Phase 3 - Biostimulation
Phase 3, biostimulation with the addition of electron donor, lasted for a period of five months. On 5 March 2003, the treated groundwater was amended once daily with a combination of ethanol and sodium lactate equal to three times the calculated stoichiometric demand of the test cell. The purpose of adding electron donor to the injection water was to increase the activity of the indigenous microorganisms and attempt to stimulate complete dechlorination of the PCE. The addition of electron donor promoted reducing conditions (i.e., negative oxidation reduction potential and low concentrations of dissolved oxygen) in the test cell. As would be expected, the shallowest sections of the test cell were the last regions to attain reducing conditions (due to oxygen influx from the vadose zone). The relatively short duration of this operational phase was

ER0008 55 2007.05.24 Revision 3.0
based on the comparison of analytical results reported in previous studies of the Dover aquifer (Ellis et al., 2000 and Seepersad, 2003) which showed there was very little dechlorinating activity exhibited by indigenous microorganisms.
The mass discharge from the extraction wells continued to decline (Figure 9) over the duration of Phase 3 and the dominant chlorinated ethene within the extracted groundwater continued to be PCE (99% of total ethenes), with minor amounts of TCE and cis-DCE (Figure 9). The decision to move to Phase 4 was made prior to the collection of the 17 July 2003 data set. This data set suggested that dechlorination had begun in some areas of the test cell. While it would have been of scientific interest to see how long it may have taken for the indigenous microbial community to develop, the intent of this demonstration was to investigate biologically enhanced dissolution of a source and therefore the decision was made to continue to the next phase of operation.
4.4.4 Phase 4 - Bioaugmentation
Phase 4, post bioaugmentation with KB-1 and continued electron donor addition, was operated for a period of 20 months. On July 18, 2003, approximately 60 liters of KB-1 was injected into 5 locations within the test cell (Figure H1). Electron donor addition continued as noted above (Phase 3) until May 17, 2004 when the electron donor addition was decreased to once every 48 hours rather than daily to reduce the amount of biofouling. This donor addition sequence continued until Phase 4 was complete (February 26, 2005). As expected, the mass discharge of VOCs from the DNAPL increased with time. The calculated mass discharge from the extraction wells decreased during August 2003 to December 2003, while the dominant chlorinated ethene detected in groundwater samples changed from PCE (86% in August 2003) to cis-DCE (69% in December 2003). The total ethenes mass discharge increased to a maximum 357 mmol/day from January 2004 to January 2005. This increase in total ethenes mass discharge included a change in the dominant chlorinated ethene distribution as the production of ethene within the groundwater increased significantly and the percent of cis-DCE decreased to 15% in May 2004 from the 69% in December 2003. By May 2004, ethene represented 71% of the total ethenes in the extracted groundwater. The proportion of ethene in the extracted groundwater fluctuated between 20% and 70% for the remainder of the phase, likely due to the change in electron donor addition initiated in May 2004. The lower then expected mass discharge from the extraction wells for this phase relative to the previous 2 phases may be a function of preferential partitioning of the dechlorination products back into the DNAPL source or due to changing flow paths (biofouling) within the cell as indicated by the second tracer test in early 2005 (See Appendix G).
Overall during Phase 4 only 2.9 kg of PCE and 12.9 kg of PCE daughter products (TCE, cis-1,2-DCE, VC and ethene) were captured at the extraction wells (Table H4) removed. In this

ER0008 56 2007.05.24 Revision 3.0
same interval more than 12 kg of chloride was produced (see Appendix H). A 4.5 fold increase in daughter products was observed at the extraction wells over PCE (4.7 g/day of PCE versus 21.6 grams/day of the combined daughter products, in PCE equivalents). This suggests that the enhanced mass discharge may have ranged from at least 2 (based on the doubling of chloride mass) to as high as 4.5 (based on the daughter products observed during Phase 4 compared to the amount of PCE in this same period).
The lower than expected mass discharge from the extraction wells may be attributed to preferential partitioning of the dechlorination products back into the DNAPL source; bioclogging restricting the delivery of electron donor to all areas of the test cell (and likely some areas with residual PCE present) or the residual PCE mass continuing to progress to steady state.
Figure 10 shows the distribution and population densities of Dehalococcoides. Before bioaugmentation, there was a low density of organisms as suggested by qualitative PCR analysis performed during baseline operations. As summarized in section 4.3, Mo et al (in submission) concluded that the strain of Dehalococcoides detected during baseline operations was not proficient in PCE dechlorination. Bioaugmentation was completed in a specific approach to evaluate the distribution of Dehalococcoides. As shown in Figure 10, KB-1 culture was not applied to the north OSU wells, only to IW1, but in the southern portions of the cell both OSU wells and the remaining two injection wells received KB-1. It was expected that KB-1 distribution would be observed first at EW3 and EW2 and last at EW1. This was the case (see data in Table K4 in Appendix K or in Figure 10). It took approximately four months for Dehalococcoides to be uniformly distributed throughout the test cell.
Supporting indicators of biological enhancement included the results obtained using carbon CSIA (see Section 4.4.7) and chloride mass accounting (see Section 4.4.8).
The total amount of electron donor added (through Phase 3 and 4) was 144 kg of ethanol (190L of SDA-3 grade 95% ethanol) and 168 Kg of lactate (212L of Wilclear™ remediation grade sodium lactate).
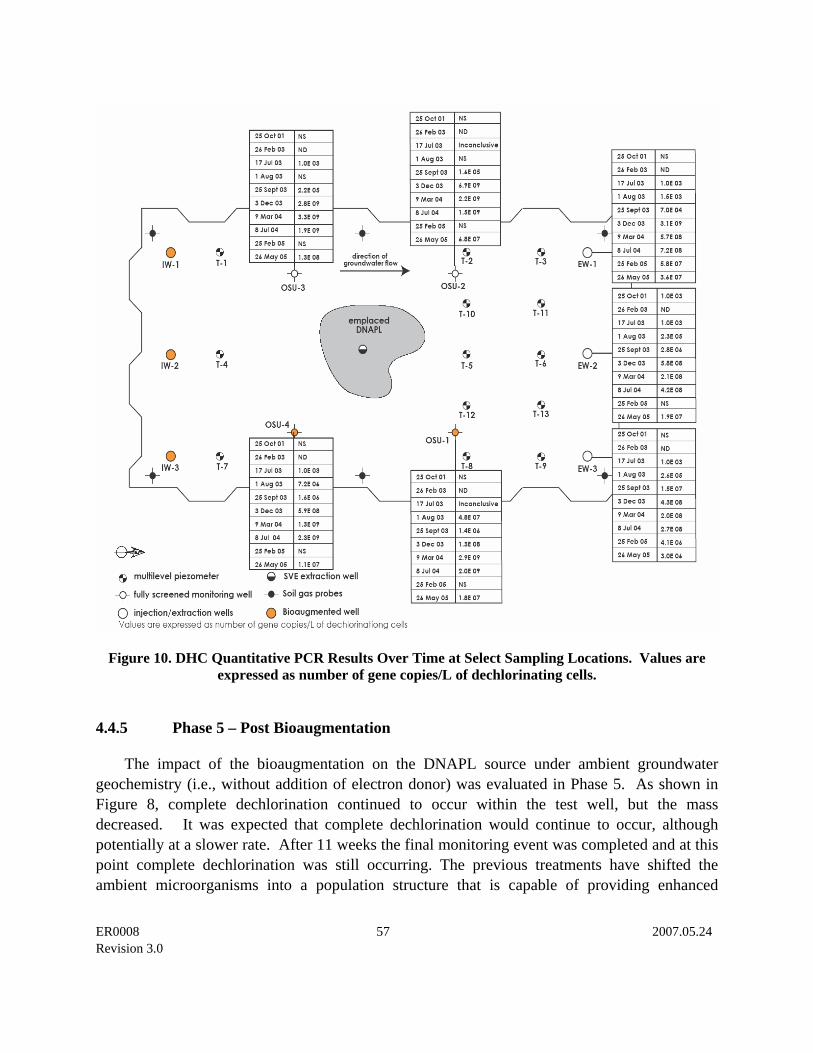
ER0008 57 2007.05.24 Revision 3.0
Figure 10. DHC Quantitative PCR Results Over Time at Select Sampling Locations. Values are expressed as number of gene copies/L of dechlorinating cells.
4.4.5 Phase 5 – Post Bioaugmentation
The impact of the bioaugmentation on the DNAPL source under ambient groundwater geochemistry (i.e., without addition of electron donor) was evaluated in Phase 5. As shown in Figure 8, complete dechlorination continued to occur within the test well, but the mass decreased. It was expected that complete dechlorination would continue to occur, although potentially at a slower rate. After 11 weeks the final monitoring event was completed and at this point complete dechlorination was still occurring. The previous treatments have shifted the ambient microorganisms into a population structure that is capable of providing enhanced

ER0008 58 2007.05.24 Revision 3.0
biological containment of the DNAPL. As was expected, the number of Dehalococcoides organisms decreased in Phase 5 relative to Phase 4. It would be expected that the Dehalococcoides populations would slowly decline with the limitation of electron donor over time. The residual biomass will itself serve as electron donor.
4.4.6 Molecular Monitoring
The molecular analysis was used to provide semi-quantitative estimates of Dehalococcoides species (using the DHC-PCR assay) and population densities in the source area. The results show that a dechlorinating culture could be established in a source area. After bioaugmentation, samples were collected to quantify the numbers of dechlorinating organisms present within the test cell. The results are shown in Figure 10 and summarized in Table K4 in Appendix K. These results clearly show that the non-detectable to low population of Dehalococcoides species determined during baseline operations increased to 105 cells per liter one month after bioaugmentation and increased to a maximum population of 109 cells per liter five months later. The distribution of Dehalococcoides was also relatively uniform throughout the test cell four months after bioaugmentation. Bioaugmentation quickly established dechlorination throughout the test cell and demonstrated that dechlorinating organisms were not impacted by the presence of PCE DNAPL. The development and eventual commercialization of the quantitative PCR (qPCR) method was of benefit to this project. These results support the groundwater VOC results obtained in the field demonstration. DGGE evaluations were not completed at the field demonstration. DGGE was used for the laboratory experiments (Appendix E and Mo et al., submitted). DGGE is a specialized application tool and any results obtained from using this method, to other sites was not likely to be great (i.e., is a site specific tool). Therefore qPCR (a more widely applicable tool) was used. The results of this will be comparative to other sites.
4.4.7 Carbon Compound Specific Isotope Monitoring
Carbon compound specific isotope analysis (CSIA) measures the ratio of 13C to 12C for an individual compound in a sample. CSIA has the potential to differentiate between chlorinated ethene biodegradation and non-degradative, physical processes (Morrill, 2005). Preferential biodegradation of 12C-containing compounds results in an enrichment of the heavy isotope (13C) in the remaining substrate which changes the isotope value of the parent compound. The fact that biodegradation changes the isotope value makes it an isotopically fractionating process. In contrast, non-degradative processes such as dissolution, volatilization and sorption do not cause a significant change the isotope values (they remain within +/-0.5 ‰, which is the analytical error associated with this method), and are therefore non-isotopically fractionating processes.

ER0008 59 2007.05.24 Revision 3.0
As discussed previously, groundwater samples were collected from the test cell and analyzed for CSIA at the University of Toronto. This work is the component of a Doctoral thesis (Morrill, 2005). The broad objectives of the CSIA sampling were:
• To confirm if this method (CSIA technique) would provide early detection of biodegradation (i.e., in advance of traditional groundwater VOC data);
• To evaluate the PCE isotopic signature during biodegradation. The hypothesis was that in the presence of a PCE DNAPL the isotopic signature of PCE would remain unchanged, due to a constant supply of isotopically non-fractionated PCE from the DNAPL.
The results of the CSIA sampling for the field demonstration indicated that biodegradation of some compounds was detected before conventional groundwater analytical results confirmed biodegradation was occurring. This was most pronounced in the observation of cis-DCE and VC isotopic fractionation, indicating biodegradation of cis-DCE to VC and VC to ethene within the test cell (See Figure 11 below). This suggests that in cases where a variety of processes may be occurring CSIA can be used to demonstrate if biodegradation processes are significant contributors via reductive dechlorination mechanisms.
Figure 12 shows that the PCE signature in the test cell was very stable over Phases 2 and 3 (baseline and biostimulation). During Phase 4 the PCE isotopic signature was stable (within +/-0.5 ‰ of the initial PCE isotope value) at 13 of 26 monitoring locations, confirming that the groundwater samples collected at these locations were still in the vicinity of a PCE source (DNAPL), and that the constant input of newly dissolved, non-fractionated PCE during the reductive dechlorination of PCE suppressed the isotopic fractionation associated with PCE biodegradation. Conversely, in the later stages (ca. Day 714) of Phase 4 the CSIA PCE isotopic signature at the wells furthest down gradient of the source (T6, T13 and EW2) showed a significant isotopic enrichment (>1 ‰) suggesting that degradation became dominant, possibly due to source depletion in these wells (data available in Morrill, 2005). These results support the very low groundwater PCE concentrations observed at EW2 (see Table K2 in Appendix K).

ER0008 60 2007.05.24 Revision 3.0
Figure 11. Concentrations (A) and d13C values (B) of the chlorinated ethenes from well T4-5.
The solid line represents the d13C of the initial PCE. Error bars on concentration values represent ± 10% reproducibility for GC analysis. Error bars on d13C represent ± 0.5‰ accuracy and reproducibility and are smaller than the plotted symbols. Based on d13CcDCE values, enrichment trends characteristic of cDCE biodegradation are first detected on Day 546, 42 days before the same conclusions can be drawn using concentration data. Based on d13CVC values, enriched isotope values characteristic of VC biodegradation are first detected on Day 588, 28 days before the same conclusions can be drawn using concentration data.
δ
13C
()
‰C
onc.
(m)
g/L
0.0
0.5
1.0
1.5
2.0
2.5
405 505 605 705
-35
-30
-25
-20
-15
-10
405 505 605 705
A
cDCE
VC
Points at which and degradation can be confirmed using concentration values.
cDCEVC
TCE
cDCE
δ13CPCEo
B
VCPCE
Points at which and degradation can be confirmed using isotope values.
cDCEVC

ER0008 61 2007.05.24 Revision 3.0
-32.0-31.0-30.0-29.0-28.0-27.0-26.0-25.0-24.0-23.0
50 150 250 350 450 550 650 750
Days
d13C
PC
E ‰
Figure 12. Isotope values of PCE during each phase of the study from all sampling locations.
Error bars on d13C represent ± 0.5‰ accuracy and reproducibility of CSIA. The solid line represents the d13C of the PCE DNAPL, while dotted lines represent ± 0.5‰ error.
4.4.8 Summary of Field Demonstration Results
In summary, bioaugmentation was required to promote dechlorination of the PCE to cis-DCE, VC and ethene. The rate of mass discharge increased during bioaugmentation but was limited by biofouling and/or biolclogging. The biofouling occurred as a result of electron donor addition and eventually caused the flow paths within the test cell to change and the electron donor was no longer being delivered to those zones with significant amounts of residual PCE (i.e., the uppermost saturated portions of the test cell). The post-bioaugmentation period, where no additional electron donor was amended but groundwater circulation continued, could be characterized as being a time when PCE concentrations at the extraction wells steadily increased (suggesting that biodegradation rate decreased such that PCE was again reaching the extraction wells).
The total mass of PCE removed from the Test Cell, via groundwater treatment means, was estimated to be 77 kg. Of this 15 kg, as PCE, was estimated to be degradation products, which is supported by the chloride mass balance. During Phase 4 only 2.9 kg of PCE and 12.9 kg of PCE daughter products (TCE, cis-1,2-DCE, VC and ethene) were captured at the extraction wells (Table H4) removed. In this same interval more than 12 kg of chloride was produced (see Appendix H). During Phase 4, 4.5 times more daughter products were reported at the extraction wells than PCE (4.7 versus 21.6 grams/day). This suggests that the enhanced mass discharge may have ranged from at least 2 (based on the doubling of chloride mass) to as high as 4.5 (based
Phase 2 Phase 4

ER0008 62 2007.05.24 Revision 3.0
on the daughter products observed during Phase 4 compared to the amount of PCE in this same period).

ER0008 63 2007.05.24 Revision 3.0
5. COST ASSESSMENT
5.1 Cost Reporting
Project costs were tracked during the course of the demonstration to determine the cost-effectiveness of bioaugmentation as a remedial approach for source zones. Costs were tracked by project milestones. The distribution of project funds by milestone is shown in Figure 13. The highest-cost milestone was the operation of the demonstration system (including monitoring) which comprised 34% of the total project cost.
Project Startup & Site Selection,
$81,351
Pre-design Laboratory Study,
$117,601
Site Preparation & Characterization,
$29,823
System Operation, $288,833
Post-Bioaug Assessment,
$13,824
SVE System, $70,000
Reporting and Meetings, $65,252
System Installation and Startup,
$183,710
FIGURE 13: DISTRIBUTION OF PROJECT EXPENDITURES BY MAJOR MILESTONE
ER0008 64 2007.05.24 Revision 3.0
The total cost of the demonstration was $850,000, resulting in the treatment of approximately 77 kg of PCE. The corresponding unit costs of the demonstration are $11,000/kg-PCE. The unit costs incurred during the demonstration are much higher than those likely to be experienced during full-scale implement due to: 1) the small scale of the demonstration; 2) the extensive monitoring effort; and 3) the implementation of a groundwater recirculation system.
The following aspects of the demonstration are considered unique to the Test Cell demonstration:
• Field Activities: Water level management activities (routinely monitoring gradients within the Test Cell and adding water as necessary to maintain a constant water level) and heating of the temporary enclosure costs were incurred that would not be normally part of other field applications.
• Additional Analytical Parameters: The quantity of DHE and SCIA samples analyzed and the routine weekly sampling (completed for mass balance) at all extraction wells would be reduced at many other applications/sites.
• Other Systems: (1) Operation of the Soil Vapor Extraction (SVE) system was to aid in mass balance (by determining the amount of PCE remaining in the unsaturated zone). SVE systems are often operated in concert with Enhanced In Situ Bioremediation (EISB) and pump-and-treat (P&T) adding these costs to this evaluation is not considered appropriate as they are not a required component of all remedies (2) For mass balance the extracted groundwater was treated with Granulated Activated Carbon (GAC). This would not be considered as part of conventional EISB remedies and the costs associated with this are not included in the cost summary. The GAC costs are used in the evaluation of the alternative analysis (Section 5.2).
• Tracer Testing: The demonstration completed two tracer tests, at conventional sites this is likely a start-up activity. The costs reflect a tracer test as part of start-up (for both EISB and conventional).
5.2 Cost Analysis
Two types of cost analyses were completed to determine bioaugmentation costs. The first involved comparing the mass extracted, using during Phase 4 (bioaugmentation) of the demonstration to the mass extracted without biostimulation and bioaugmentation (Phase 2 of the

ER0008 65 2007.05.24 Revision 3.0
demonstration). The second approach develops a hypothetical site containing a source and similar geochemical and physical aquifer properties to the DNTS Test Cell, and compares conventional source remediation approaches (e.g., in situ thermal and in situ chemical reduction to EISB). The following sections present these evaluations.
5.2.1 Comparison of Actual Costs from the Pilot Test
During Phase 2 of this demonstration (baseline operation which consisted of extracting unamended groundwater) the system operated in a manner very similar to pump and treat (P&T), with extraction wells and GAC treatment as a component of the test cell design. The additional cost due to EISB can be obtained by comparing to P&T (by using the results of mass captured and treated in Phase 4). The assumption is that if no biodegradation occurred within the test cell then the mass of PCE extracted would be that which was captured from a P&T system. This was the basis for this comparison.
The costs to operate the system were estimated on an annual basis and the mass extracted as PCE (equivalent to pump and treat) and that with bioaugmentation and electron donor (EISB) were compared. These tables were developed using the format outlined in FRTR (1998). Tables 12A and 12B present the cost comparisons between EISB and P&T (respectively). In this scenario the quantity of PCE extracted and treated by P&T was taken from the PCE concentrations observed at the extraction wells of the demonstration during Phase 4 (see Table 11). Using this value (0.005 kg/day of PCE) the annual mass of PCE extracted using a “pump and treat” configuration was estimated. For EISB, the total daughter products, as PCE equivalents, are used. Using this value the annual mass of PCE extracted using EISB is determined. These are then used to estimate the costs of removal per kg. In this scenario the costs per Kg of PCE removed for pump and treat and EISB are estimated to be $5,726 and $4,796, respectively. This is a function of the design (i.e., low flow and using recirculation for EISB). Note that even with a lower unit cost the mass extracted in the EISB scenario is 30% more than that obtained during P&T; again demonstrating that enhanced degradation contributes to mass removal.

ER0008 66 2007.05.24 Revision 3.0
TABLE 12A: COST SUMMARY TABLE ENHANCED IN SITU BIOREMEDIATION
Cost ($/Year Basis)
Cost for Calculating Unit Cost
1. Capital Costs
Mobilization, set up $25,000(5K labor, 10K site preparation (electrical), 10K mobilization for subs)
Planning and Preparation $15,000 (4 days @1500/day, Drawings and specifications remainder)
Site Work (well installation) $48,900 (drilling and oversight to install wells based on actual)
Equipment (pumps, controller, SCADA, dose pump) $125,000(based on actual costs)
Start-up and Testing (baseline sampling, bioaugmentation) $40,399Total Capital Costs $254,299
2. Operation, Maintenance, and Monitoring (per year)
Labor (weekly visit, monthly biofoul mtce, snap shot sampling 6 times a year) $55,200(4 hours for weekly and monthly @$75/hr Semi annual 2 staff 120 hours @ $75/hr)
Materials (electron donor, supplies, pump replacement, sampling equipment) $6,500(estimate based on site use at Dover)
Utilities and fuel (overwinter protection) $2,100(estimate based on site use at Dover)
Equipment ownership, rental or lease $2,500(estimate based on site use at Dover)
Performance testing and analysis $57,480(weekly cost of $600 comprised of $300 labor and $300 laboratory costs)
Other
Total OM&M Costs $123,780
3. Other Technology Specific Costs
Compliance Testing and Analysis $0
Soil excavation collection and control $0
Disposal of Residues $0
4. Other Project CostsNone $0
Total technology cost (Year basis for cost) $378,079
Total cost for calculating unit cost $378,079
Quantity treated (kg of PCE and daughter products produced during bioaugmentation phase, per year)* 79
Calculated Unit Cost (/kg of PCE) $4,796
NOTESanticipated system configuration: recirculation, up to 3 gpm, using 3 extraction wells and 3 injection wells * amount listed is based on 3 gpm total flow

ER0008 67 2007.05.24 Revision 3.0
TABLE 12B: COST SUMMARY TABLE PUMP AND TREAT ALTERNATIVE
Cost ($/Year Basis)
Cost for Calculating Unit Cost
1. Capital Costs
Mobilization, set up $25,000(5K labor, 10K site preparation (electrical), 10K mobilization for subs)
Planning and Preparation $15,000 (4 days @1500/day, Drawings and specifications remainder)
Site Work (well installation) $48,900 (drilling and oversight to install wells)
Equipment (design, air stripper, vapor phase GAC, piping) $125,000 (estimate from vendor for skid mounted system to treat VOCs listed)
Start-up and Testing (baseline sampling) $40,400(hydraulic testing, flowfield verification and sampling: (2 months of labor @ $600/day plus $16,400 equipment and lab)Total Capital Costs $254,300
2. Operation, Maintenance, and Monitoring (per year)
Labor (weekly visit) $15,600(4 hours per week @$75/hr)
Materials (carbon, pump replacement, sampling equipment) $15,000(8 drums GAC/yr (8K) , $5K pump, 2K sampling equipment)
Utilities and fuel (overwinter protection) $2,100(estimate based on site use at Dover)
Equipment ownership, rental or lease $2,500(water tape, pH, ORP, DO meters)
Performance testing and analysis (3 locations weekly) $24,000(weekly cost of $600 comprised of $300 labor and $300 laboratory costs)
Other
Total OM&M Costs $59,200
3. Other Technology Specific Costs
Compliance Testing and Analysis $0
Soil excavation collection and control $0
Disposal of Residues $0
4. Other Project Costsnone $0
Total technology cost (Year basis for cost) $313,500
Total cost for calculating unit cost $313,500
Quantity treated (kg of PCE removed during biostimulation phase, per year)* 55
Calculated Unit Cost (/kg of PCE) $5,726
NOTESanticipated system configuration: recirculation, up to 3 gpm, using 3 extraction wells and 3 injection wells
* amount listed is based on 3 gpm total flow
ER0008 68 2007.05.24 Revision 3.0
5.2.2 Comparison of Costs for Hypothetical Site
The second approach to cost analysis involved developing full scale system to treat a hypothetical plume, using commercially available source treatment options. Using this hypothetical plume, costs for the following technologies were compared:
• in situ thermal remediation (Electrical Resistive Heating),
• in situ chemical oxidation (modified Fenton’s reagent),
• pump and treat, and
• enhanced in situ bioremediation (biostimulation with EVO and bioaugmentation).
The pump and treat scenario was used as a benchmark. The assumptions for this source area and plume are provided in Table 13. The site would be comprised of a treatment area, roughly 300 ft wide, 600 ft long and have PCE contamination over a 30 foot thickness. The aquifer system presented in Table 13 is for a system similar (geochemically) to the one at the Dover test cell but with larger extraction rates and treatment areas. Table 14 summarizes the costs associated with each alternative.
Start-up costs consist of all activities through installation, planning, sample collection, regulatory negotiations, and permitting. Capital costs include costs related to supply/equipment acquisition and any modification made to existing infrastructures necessary. Operation and maintenance costs will include calibration of instruments, sampling, analytical work (field and laboratory based, but excluding site characterization), maintenance, replacement of consumables (e.g., electron donor), but not waste handling and disposal as these costs tend to be region specific. The following sections provide a review of the specific configuration of the treatment technology for this evaluation and for in situ thermal and in situ chemical oxidation a summary of the treatment technology and the application selected for this evaluation.
5.2.2.1 Alternative 1: Pump-and-treat
Pump-and-treat (P&T) systems can be designed for different remediation objectives. Possible objectives of P&T systems include removal of dissolved contaminants from the subsurface, containment of contaminated ground water to prevent migration, and DNAPL removal/source area remediation. If removal of dissolved contaminants is the chosen objective of the pump-and-treat (P&T) system, the level of cleanup must be determined. If containment is the chosen objective, ground water pumping is used as a hydraulic barrier to prevent off-site migration of contaminant plumes. P&T is used for control and treatment of groundwater plumes

ER0008 69 2007.05.24 Revision 3.0
and is not generally used in source areas. If P&T is used in source areas it is generally applied as a multiphase extraction system. P&T is often used in as plume containment remedy, in conjunction with other DNAPL source area remedies (e.g., in situ bioremediation, surfactant flushing, or chemical oxidation).
This scenario assumes installation of three (3) groundwater extraction wells screened over a nominal thickness of 30 feet and equipped with electrically-operated submersible pumps. The total groundwater extraction rate is assumed to be 10 gpm. Extracted groundwater will be treated using an air stripping tower and then recharged back to the aquifer via an infiltration gallery. The vapor stream from the air stripping tower will be treated using two granular activated carbon vessels connected in series. The system would operate for 30 years. Cost Drivers for this technology include the on-going operation and maintenance (O&M) costs.

ER0008 70 2007.05.24 Revision 3.0
Parameter Unit Quantity
Site Characteristics
Source Dimensions (200x90x10) m3 180,000Porosity v/v 0.27Pore Volume m3 48,600Bulk Density kg/m3 1,800Mass of Soil kg 87,480,000Total Depth of Treatment Area m 20Depth to Water m 10
GeochemistryAverage PCE concentration in soil mg/kg 75PCE Mass in Soil to Treat kg 6,560Sulfate mg/L 150Oxygen mg/L <1
EISB: Electron Donor ApproachSelect Emulsified Vegetable Oil, Amend in barrier configuration 20 ft ROI, amend at 3% EVO row 6Number of points per row points per row 15Total number of points 90
ISCO: Application of Modified Fenton'sModified Fenton's (hydrogen peroxide) dose % 12Radius of Injection ft 25Number of Amendment Points points 230Volume to Amend per point L 42,000
Thermal: Application of ERHNumber of electrodes each 559Distance between electrodes m 6.1Off-gas treatment with GAC kg 63,000
Treatment ParametersDuration of Pump and Treat years 30Duration of ISCO years 5Duration of EISB (amend three times in 10 years) years 15Duration of Thermal years 2Discount Rate % 4.5
TABLE 13: Parameters for Cost Basis

ER0008 71 2007.05.24 Revision 3.0
5.2.2.2 Alternative 3: Thermal treatment using Electrical Resistive Heating
Thermal treatment technologies are a group of technologies that use heat to facilitate contaminant mobilization, solubilization, removal, and/or degradation. Thermal treatments that are most commonly applied for in situ remediation of chlorinated solvents include steam enhanced extraction (SEE; also referred to as steam flushing), electrical resistance heating (ERH; both three-phase and six-phase heating) and electrical conductive heating (ECH; also referred to as in situ thermal desorption and thermal conductive heating). In most cases, in situ thermal treatments are used in NAPL source areas, and the technology is used in conjunction with soil vapor extraction (SVE) to contain and recover contaminant vapors. ERH involves the application of electrical current into and through the subsurface via electrodes that generate heat. ERH uses the naturally occurring electrical resistance of the subsurface that allows electrical energy to be focused into a specific source zone. Steam is generated when the in situ resistance heating heats the subsurface to the boiling point of the pore water. The steam strips the contaminants from the soils and enables them to be extracted from the subsurface. In addition, the heat causes the contaminants to be directly volatilized from unsaturated soils, and can catalyze abiotic degradation of certain solvents (e.g., 1,1,1-TCA hydrolysis to acetic acid). The extracted liquids and vapors are treated using conventional aboveground treatment technologies. ERH may be used for several remedial purposes including: steam stripping VOCs, enhancing SVE and MPE efforts, increasing biological degradation rates, and increasing chemical dechlorination reaction rates.
For this case ERH, using 3 phase heating, was selected as the thermal application method. A vendor quote was obtained, which recommended the treatment area contain about 560 heater wells set on 20 ft centers. It was assumed the system would operate for up to 700 days. The vapors would be extracted and treated using granular activated carbon. The principal cost drivers for the technology infrastructure costs such as injection heater well installation, electrode costs and electrical costs.
5.2.2.3 Alternative 4: In Situ Chemical Oxidation Using Modified Fenton’s
In situ chemical oxidation (ISCO) refers to a group of specific technologies that each use differing combinations of oxidants and delivery techniques. ISCO has been shown to destroy or degrade an extensive variety of hazardous wastes in groundwater and soil, including fuel hydrocarbons, chlorinated solvents (e.g., PCE, TCE), fuel oxygenates (e.g., methyl-tert-butyl-ether [MTBE]), and polycyclic aromatic hydrocarbons (PAHs). Various oxidants have been used in laboratory and field applications to aggressively destroy chlorinated solvents, including

ER0008 72 2007.05.24 Revision 3.0
permanganate, ozone, and Fenton’s reagent. The oxidants react with the contaminants (i.e., breaking molecular bonds of and capturing electrons from the contaminant) and convert them to innocuous compounds commonly found in nature such as carbon dioxide (CO2), water and inorganic chloride. ITRC (2005) provides a review of the various oxidants available and the characteristics of each.
Modified Fenton’s was selected for this site as its application (commonly by direct push injections) is similar to the EISB approach selected above. The treatment area was configured to contain 220 injection points set on 25 foot centers. It was assumed the wells would be installed using direct push technology to minimize investigation derived waste disposal costs. A solution containing 12% hydrogen peroxide and catalyst would be amended to each point. The target treatment area was set to 20% of the pore volume. Most vendors prefer to perform a pilot test to confirm site specific application concerns (natural oxidant demand, geological heterogeneities) are refined before full-scale application. It was assumed that a second injection to a subset of the treatment area would be required. A five year remediation program was selected. The principal cost drivers for the technology are oxidant, labor required for the injection events, performance monitoring, and reporting.
5.2.2.4 Life Cycle Costs
The estimated life-cycle costs varied for each of the technologies as shown on Table 13. The EISB technology is based on the capital cost of the infrastructure, plus operations and maintenance (including electron donor, performance monitoring and reporting over the period of technology implementation. Table 15 shows the total lifecycle costs of each alternative, calculated as the net present value over time periods of:
• 30 years for Pump and Treat,
• 15 years for EISB,
• 5 years for ISCO, and
• 2 years for Thermal.
All costs are calculated at annual discount rates of 4.5%. Summaries of the costs of the alternatives (including both capital and annual operations and maintenance) are provided in Table 15. The total costs over the operating period (extended for 30 years for all technologies) are provided in Figure 14.
For the EISB configuration there would be three applications of electron donor to the source area to enhance the remediation. As shown in Table 15 the highest cost was the thermal remedy

ER0008 73 2007.05.24 Revision 3.0
and the lowest cost EISB. Capital costs to amend electron donor are more than the capital costs to install a conventional (i.e., off-the shelf) air stripper/GAC treatment system. The cost savings for the EISB remedy relate to lower annual O&M costs for those years that electron donor re-amendment is not completed.
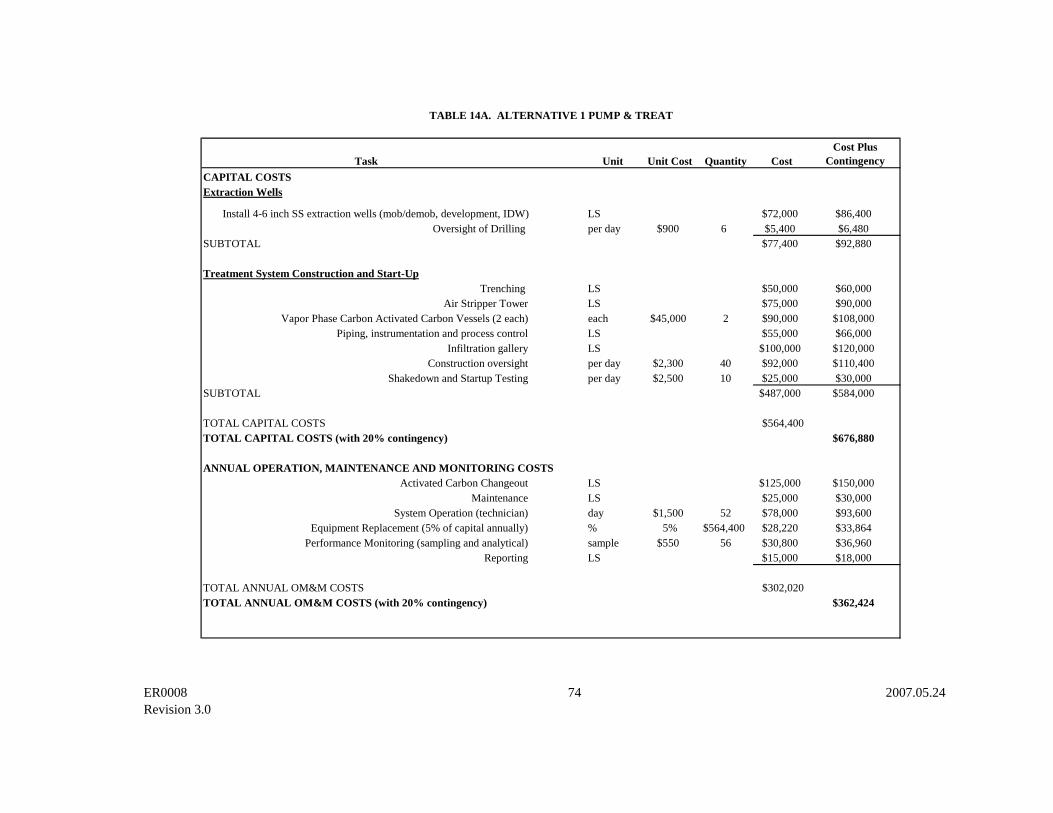
ER0008 74 2007.05.24 Revision 3.0
Task Unit Unit Cost Quantity CostCost Plus
ContingencyCAPITAL COSTSExtraction Wells
Install 4-6 inch SS extraction wells (mob/demob, development, IDW) LS $72,000 $86,400Oversight of Drilling per day $900 6 $5,400 $6,480
SUBTOTAL $77,400 $92,880
Treatment System Construction and Start-UpTrenching LS $50,000 $60,000
Air Stripper Tower LS $75,000 $90,000Vapor Phase Carbon Activated Carbon Vessels (2 each) each $45,000 2 $90,000 $108,000
Piping, instrumentation and process control LS $55,000 $66,000Infiltration gallery LS $100,000 $120,000
Construction oversight per day $2,300 40 $92,000 $110,400Shakedown and Startup Testing per day $2,500 10 $25,000 $30,000
SUBTOTAL $487,000 $584,000
TOTAL CAPITAL COSTS $564,400TOTAL CAPITAL COSTS (with 20% contingency) $676,880
ANNUAL OPERATION, MAINTENANCE AND MONITORING COSTSActivated Carbon Changeout LS $125,000 $150,000
Maintenance LS $25,000 $30,000System Operation (technician) day $1,500 52 $78,000 $93,600
Equipment Replacement (5% of capital annually) % 5% $564,400 $28,220 $33,864Performance Monitoring (sampling and analytical) sample $550 56 $30,800 $36,960
Reporting LS $15,000 $18,000
TOTAL ANNUAL OM&M COSTS $302,020TOTAL ANNUAL OM&M COSTS (with 20% contingency) $362,424
TABLE 14A. ALTERNATIVE 1 PUMP & TREAT
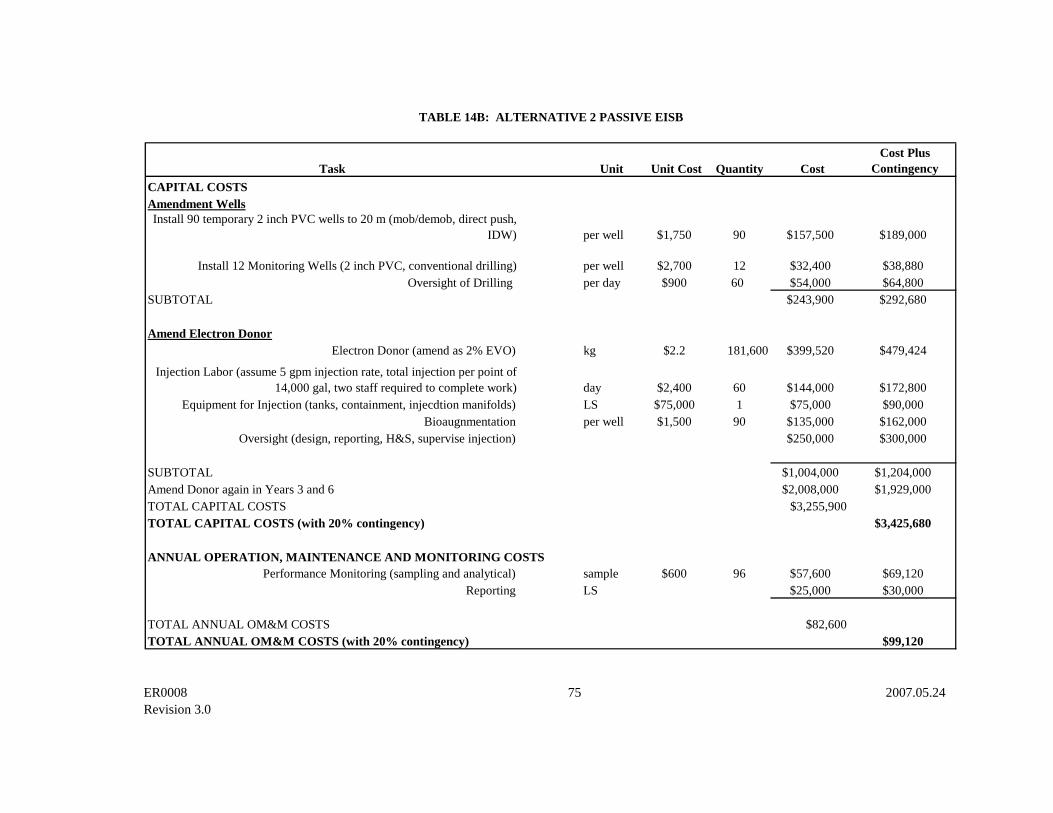
ER0008 75 2007.05.24 Revision 3.0
Task Unit Unit Cost Quantity CostCost Plus
ContingencyCAPITAL COSTSAmendment WellsInstall 90 temporary 2 inch PVC wells to 20 m (mob/demob, direct push,
IDW) per well $1,750 90 $157,500 $189,000
Install 12 Monitoring Wells (2 inch PVC, conventional drilling) per well $2,700 12 $32,400 $38,880Oversight of Drilling per day $900 60 $54,000 $64,800
SUBTOTAL $243,900 $292,680
Amend Electron DonorElectron Donor (amend as 2% EVO) kg $2.2 181,600 $399,520 $479,424
Injection Labor (assume 5 gpm injection rate, total injection per point of 14,000 gal, two staff required to complete work) day $2,400 60 $144,000 $172,800
Equipment for Injection (tanks, containment, injecdtion manifolds) LS $75,000 1 $75,000 $90,000Bioaugnmentation per well $1,500 90 $135,000 $162,000
Oversight (design, reporting, H&S, supervise injection) $250,000 $300,000
SUBTOTAL $1,004,000 $1,204,000Amend Donor again in Years 3 and 6 $2,008,000 $1,929,000TOTAL CAPITAL COSTS $3,255,900TOTAL CAPITAL COSTS (with 20% contingency) $3,425,680
ANNUAL OPERATION, MAINTENANCE AND MONITORING COSTSPerformance Monitoring (sampling and analytical) sample $600 96 $57,600 $69,120
Reporting LS $25,000 $30,000
TOTAL ANNUAL OM&M COSTS $82,600TOTAL ANNUAL OM&M COSTS (with 20% contingency) $99,120
TABLE 14B: ALTERNATIVE 2 PASSIVE EISB

ER0008 76 2007.05.24 Revision 3.0
Task Unit Unit Cost Quantity CostCost Plus
ContingencyCAPITAL COSTS
Design, Work Plans, Permits ls $114,000 1 $114,000 $136,800
Electrode Materials Mobilization ls $2,442,000 1 $2,442,000 $2,930,400Subsurface Installation ls $597,000 1 $597,000 $716,400Surface Installation and Start-up ls $930,000 1 $930,000 $1,116,000Drilling and Soil Sampling ls $1,806,000 1 $1,806,000 $2,167,200Drill Cuttings and Waste Disposal ls $439,000 1 $439,000 $526,800
Remediation System Operation (about 700 days) ls $3,570,000 1 $3,570,000 $4,284,000Demobilization ls $178,000 1 $178,000 $213,600
TOTAL CAPITAL COSTS $10,076,000TOTAL CAPITAL COSTS (with 20% contingency) $12,091,200
ANNUAL OPERATION, MAINTENANCE AND MONITORING COSTS (YEAR 1)Electrical Utility Connection to PCU: $40,000 $48,000Electrical Energy Usage: $5,429,000 $6,514,800Carbon Usage, Transportation & Regeneration: $226,000 $271,200Water/Condensate Disposal: $10,000 $12,000Other Operational Costs: $283,000 $339,600Reporting LS $50,000 $60,000
TOTAL ANNUAL OM&M COSTS (Year 1) $6,038,000TOTAL ANNUAL OM&M COSTS (with 20% contingency) $7,245,600
ANNUAL OPERATION, MAINTENANCE AND MONITORING COSTS (YEARS 2 through 5)Performance Monitoring (sampling and analytical) sample $600 24 $14,400 $17,280
Reporting LS $25,000 $30,000TOTAL ANNUAL OM&M COSTS (Year 2 through 5) $39,400TOTAL ANNUAL OM&M COSTS (with 20% contingency) $47,280
TABLE 14C: ALTERNATIVE 3 THERMAL REMEDIATION USING ERH

ER0008 77 2007.05.24 Revision 3.0
Task Unit Unit Cost Quantity CostCost Plus
ContingencyCAPITAL COSTSAmendment Wells
Install 230 direct push wells to 20 m (assume 4 locations per day) per day $2,000 63 $126,500 $151,800
Install 12 Monitoring Wells (2 inch PVC, conventional drilling) per well $2,700 12 $32,400 $38,880Oversight of Drilling per day $900 63 $56,700 $68,040
SUBTOTAL $215,600 $258,720
Amend Modified FentonsPilot Test LS $150,000 1 $150,000 $180,000
Modified Fentons (12% H202, dilute to apply at 5%) point $13,000 230 $2,990,000 $3,588,000
Injection Labor (assume 5 gpm injection rate, total injection per point of 11,000 gal, two staff required to complete work) day $2,400 63 $151,200 $181,440
Equipment for Injection (tanks, containment, injecdtion manifolds) LS $15,000 1 $15,000 $18,000Oversight (design, reporting, H&S, supervise injection) $250,000 $300,000
SUBTOTAL $3,406,000 $4,087,000Amend Second Event in Year 2 (to 50% of area) $1,810,900 $2,173,000TOTAL CAPITAL COSTS $5,432,500TOTAL CAPITAL COSTS (with 20% contingency) $6,518,720
ANNUAL OPERATION, MAINTENANCE AND MONITORING COSTS (for up to 5 years)Performance Monitoring (sampling and analytical) sample $600 96 $57,600 $69,120
Reporting LS $25,000 $30,000
TOTAL ANNUAL OM&M COSTS $82,600TOTAL ANNUAL OM&M COSTS (with 20% contingency) $99,120
TABLE 14D: ALTERNATIVE 4 IN SITU CHEMICAL OXIDATION USING MODIIFED FENTON'S

ER0008 78 2007.05.24 Revision 3.0
Table 15: Summary of Life Cycle CostsP&T EISB ISCO THERMAL
Capital Cost $564,400 $3,255,900 $5,432,500 $10,076,000O & M $302,000 $82,600 $82,600 $6,038,000NPV $5,483,600 $4,143,000 $5,795,100 $15,854,000
Discount rate 0.045 0.045 0.045 0.045Period (year) 30 15 5 1P/A, i%, n 16.2889 10.7395 4.3900 0.9569
NPV = Capital Costs + O&M Costs * (P/A, i%, n)
$0
$2,000,000
$4,000,000
$6,000,000
$8,000,000
$10,000,000
$12,000,000
$14,000,000
$16,000,000
$18,000,000
0 5 10 15 20 25 30 35
Years of Operation
Cos
t ($)
Alternative 1 (P&T)
Alternative 2 (EISB
Alternative 3(Thermal)Alternative 4 (ISCO)
FIGURE 14: SUMMARY OF CUMULATIVE COSTS BY ALTERNATIVE

ER0008 79 2007.05.24 Revision 3.0
6. IMPLEMENTATION ISSUES
The demonstration was completed in accordance with applicable federal, state, and/or local laws and regulations. Regulations consulted for this demonstration are listed below:
• Occupational Safety and Health Administration (OSHA) regulations;
• State, local, or DAFB wastewater discharge criteria; and,
• State, local, or DAFB regulations for underground injection of the microbial cultures, electron donors, and nutrients, and the re-injection of groundwater containing PCE and chlorinated PCE biodegradation products.
6.1 Environmental Checklist
This section describes all applicable or relevant regulatory requirements related to the activities discussed in Section 3. These requirements include the acquisition of permits and the compliance to regulations.
6.1.1 Regulatory Issues
The necessary permitting and compliance issues are described below.
1. Permit to Release DNAPL.
a. DNTS has a unique permit (Permit to Operate and Maintain a Groundwater Remediation Field Laboratory at Dover Air Force Base, DE, State of Delaware Department of Natural Resources and Environmental Control Permit #98-PRP-03) that allows the use of up to 100 liters of PCE within each Test Cell provided there is strict adherence to the constraints imposed by the permit. All operations must comply with all applicable federal, state, and local regulations for which permits would normally be required. Additionally, all operations must be subject to all applicable DAFB requirements.
2. Approval from Local and State Authorities to Release Microbial Consortium.
a. DNTS obtained the necessary approvals for the release of a natural consortium of microorganisms into the Test Cell.
b. DNTS maintained compliance with their permits by monitoring the system on a routine basis.

ER0008 80 2007.05.24 Revision 3.0
6.1.2 Hazardous Material Storage
During the demonstration, hazardous materials were stored on-site in a secure location. Materials were properly stored and labeled with the appropriate labeling and placards as required by RCRA, Department of Transportation (DOT), and DAFB. A material safety data sheet (MSDS) for each hazardous compound was kept on site in a location readily accessible to all on-site personnel.
6.1.3 Air Discharge
During treatment of the extracted groundwater to remove VOCs from the groundwater stream there is little potential for volatilization of some components. GAC off-gas treatment from SVE system operation was used and PID readings were taken to ensure that fugitive emissions were not being discharged.
6.1.4 Wastewater Discharge
All waste water generated during well development and groundwater purging water was discharged to the storage tank of the groundwater circulation system and treated prior to being injected into the test cell. A process and instrumentation diagram is shown in Appendix F. Procedures for well development and groundwater purging are described in Appendix A.
6.1.5 Waste Storage, Treatment, and Disposal
All soil cuttings generated during drilling activities were disposed of according to the DNTS permit specifications. Soil and groundwater samples submitted to an off-site lab for analysis were managed according to the laboratory’s established sample disposal protocols.
6.2 Other Regulatory Issues
There were no other regulatory issues encountered for this demonstration.
6.3 End-User Issues
Bioaugmentation is potentially widely applicable at chlorinated solvent sites throughout North America. Recently, a bioaugmentation white paper (ESTCP 2005) was released, and this paper documents the status of development of bioaugmentation as a tool for remediation of chlorinated solvents and it discusses the current status and research needs for bioaugmentation in this area. The completion of this successful demonstration and other bioaugmentation studies and publication of the results in both peer-reviewed and other technical literature allows site managers to learn with more certainty the likelihood of success when evaluating this technology.

ER0008 81 2007.05.24 Revision 3.0
All of the equipment used in the demonstration was commercially available off the shelf equipment. There were a number of design components installed at added cost, just for this demonstration that would not need to be applied at other sites. For example:
• The efforts to track mass balance need not be as rigorously applied to other sites as starting mass unlikely to be quantified;
• GAC treatment prior to re-injection (which was used during this demonstration to facilitate mass balance);
• The extent of water table manipulation was an added effort that would not be required in a non-sheet pile test cell setting; and
• The number and frequency of multilevel monitoring wells can be decreased for an expanded setting. This demonstration used a higher degree of instrumentation for proof of concept purposes.
6.3.1 Technology Transfer
Technology transfer occurred throughout the demonstration. Future efforts include: dissemination of the Implementation Guidance Document (the protocol), presentations during training seminars and sessions currently offered through organizations such as NFESC, the Remediation Technologies Development Forum (RTDF), and the Interstate Technology Regulatory Council (ITRC). In the Spring 2006, the DNAPL Bioremediation ITRC team sponsored a Case Study Forum in which remedial performance was evaluated at 6 DNAPL source zone sites, including this demonstration. Close coordination with the ITRC for communication to the environmental industry and to insure rapid acceptance by industry and local governments will continue beyond the case study forum.
Technology transfer is also ensured through direct communication with Remedial Program Managers (RPMs) and site owners through initiatives such as NFESC’s Remediation Innovative Technologies Seminars (RITS) and Tiger Team visits. During such visits, NFESC engineers advise RPMs on best strategies to achieve their remedial goals. Yearly visits reach several hundred RPMs.
Furthermore, periodic presentations have been delivered at conferences (e.g., Battelle Conferences in 2002, 2003 and 2004) and workshops (NFESC, Dover NETTS, Amherst Soil and Remediation Conference in October 2003) and will continue to be delivered. This data has been presented at the RTDF Bioremediation working group that Geosyntec is a member. A peer-review publication will be prepared and submitted in the coming months.

ER0008 82 2007.05.24 Revision 3.0
7. REFERENCES
Battelle (1997). Draft Technical Protocol: A Treatability Test for Evaluating the Potential Applicability of the Reductive Anaerobic Biological In Situ Treatment Technology (RABITT) to Remediate Chloroethenes, December (1997).
Bourquin, A.W., D.C. Mosteller, R.L. Olsen, M.J. Smith, and K.F. Reardon. 1997. "Aerobic Bioremediation of TCE-Contaminated Groundwater: Bioaugmentation with Burkholderia cepacia PR1301" In B.C. Alleman and A. Leeson (eds), In Situ and On-Site Bioremediation: Vol. 4., Battelle Press, Columbus, OH, 513-518.
Carr, C.S., S. Garg, and J.B. Hughes (2000). “Effect of Dechlorination on the Longevity and Composition of NAPL Source under Equilibrium Dissolution Conditions”, Environmental Science and Technology. 34: 1088-1094.
Cope, N. and J.B. Hughes (2001). “Biologically-Enhanced Removal of PCE from NAPL Source Zones.” Environmental Science and Technology. 35: 2014-2021.
Cox, E., E. Edwards and D. Major (1995). Intrinsic Biodegradation of Trichloroethene and Trichloroethane in a Sequential Anaerobic-Aerobic Aquifer, Intrinsic Bioremediation, 3(1):223-231.
Cox, E.E., E.A. Edwards, S. Neville, G. Swanick, and D.W. Major. 2000. Accelerated bioremediation of perchlorate and trichloroethene in groundwater. Abstract. Second International Conference on Remediation of Chlorinated and Recalcitrant Compounds. Monterey, California, May 22-25.
DiStefano, T.D., J.M. Gossett, and S.H. Zinder. 1991. “Reductive Dechlorination of High Concentrations of Tetrachloroethene to Ethene by an Anaerobic Enrichment Culture in the Absence of Methanogenesis”, Applied and Environmental Microbiology, 57(8):2287-2292.
Droy, B.F., F. Manale, R. Copeland, C. Creber, G. Klecka, "Evaluating Enhanced In Situ Anaerobic Bioremediation as a Primary Site-Wide Remediation Strategy", Abstract. Third International Conference on Remediation of Chlorinated and Recalcitrant Compounds. Monterey, California, May 2002.
Duba, A.G., K.J. Jackson, M.C. Jovanovich, R.B. Knapp, and R.T. Taylor. 1996. "TCE Remediation Using In Situ Resting-State Bioaugmentation." Environ. Sci. Technol. 30(6):1982-1989.
Duhamel, M., S.D. Wehra, L. Yua, H. Rizvia, D. Seepersada, S. Dworatzek, E.E. Cox, and E.A. Edwardsa. 2002. “Comparison of anaerobic dechlorinating enrichment cultures maintained

ER0008 83 2007.05.24 Revision 3.0
on tetrachloroethene, trichloroethene, cis-dichloroethene and vinyl chloride”, Water Research, 36:4193-4202.
Dybas, M.J., S. Bezborodnikov, T. Voice, D.C. Wiggert, S. Davies, J. Tiedje, C.S. Criddle, O. Kawka, and M. Barcelona, "Evaluation Of Bioaugmentation to Remediate an Aquifer Contaminated with Carbon Tetrachloride", in the proceedings of In Situ and On Site Bioremediation Symposium, New Orleans, April 28-May 1, 1997.
Dybas, M.J., M. Barcelona, S. Bezborodnikov, S. Davies, L. Forney, H. Heuer, O. Kawka, T. Mayotte, L. Sepulveda-Torres, K. Smalla, M. Sneathen, J. Tiedje, T. Voice, D.C. Wiggert, M.E. Witt, and C.S. Criddle, "Pilot-Scale Evaluation Of Bioaugmentation For In Situ Remediation Of A Carbon Tetrachloride-Contaminated Aquifer", Environmental Science & Technology, 32(22):3598-3611, 1998.
ESTCP. 2006. Bioaugmentation For Remediation Of Chlorinated Solvents: Technology Development, Status, And Research Needs October 2005.
Federal Remediation Technologies Roundtable. 1998. Guide to Managing Cost and Performance Information for Remediation Projects. Revised Version. EPA 542-B-98-007. www. frtr.gov
Ellis, D.E., Lutz, E., J.M. Odom, R. J. Buchanan, C.J. Bartlett, M. D. Lee, M. R. Harkness, K. A.. DeWeerd 2000. “Bioaugmentation for Accelerated In Situ Anaerobic Bioremediation”, Environ. Sci. Technol., 34(11):224-2260.
Finn, P. S., A. Kane, J. Vidumsky, D.W. Major, and N. Bauer. 2003. "In Situ Bioremediation of Chlorinated Solvents in Overburden and Bedrock Using Bioaugmentation." Abstract. Seventh International In Situ and On-Site Bioremediation Symposium. Orlando, Florida, June 2-5.
Fountain, J.C. (1998). Technology Evaluation Report: Technologies for Dense Non-aqueous Phase Liquid Source Zone Remediation. Ground Water Remediation Technologies Analysis Center, Publication Document Number: TE-98-02, December 1998.
Freedman, D.L. and J.M. Gossett. 1989. Biological Reductive Dechlorination of Tetrachloroethylene and Trichloroethylene to Ethylene under Methanogenic Conditions. Applied and Environmental Microbiology, 55(9):2144-2151.
Haston, Z.C., P.K. Sharma, J.N.P. Black and P.L McCarty. 1994. Enhanced Reductive Dechlorination of Chlorinated Ethenes. Symposium on Bioremediation of Hazardous Wastes: Research, Development and Field Evaluations. EPA/600/R-93/054:11-14.

ER0008 84 2007.05.24 Revision 3.0
Harkness, M. R., A. A. Bracco, M.J. Brennan Jr., K.A. De Weeerd, J. L. Spivack. 1999. Use of bioaugmentation to stimulate complete reductive dechlorination of trichloroethene in Dover soil columns. Environ. Sci. Technol. 33(7): 1100-1109.
Hendrickson, E.R, J.A. Payne, R.M. Young, M.G. Starr, M.P. Perry, J.A. Payne, and L.W. Buonamici. 2002. “Molecular Analysis of Dehalococcoides 16S ribosomal DNA from Chloroethene-Contaminated Sites Throughout North America and Europe. Appl. Environ. Microbiol. 68:485-495.
Henssen, M.J.C., A.W. van der Werf, S. Keuning, C. Hubach, R. Blokzijl, E. van Keuklen, B. Alblas, C. Haasnoot, H. Boender, and E. Meijerink. 2001. Engineered Full Scale Bioremediation of Chlorinated Ethenes. In: Leeson, A., B.C. Alleman, P.J. Alvarez, and V.S. Magar (Eds.), Bioaugmentation, Biobarriers, and Biogeochemistry. Battelle Press, Columbus, OH. pp. 73-78. 2001
Isalou, Mansour, Brent E. Sleep and Steven N. Liss. 1998. “Biodegradation of High Concentrations of Tetrachloroethene in a Continuous Flow Column System.” Environmental Science & Technology, 32(22):3579-3585.
Jin, Peikang, B.F. Droy, F. Manale, S.Lui, R. Copeland, C. Creber, G. Klecka, "Monitoring the Effectiveness of Large-scale In Situ Anaerobic Bioremediation", Abstract. Third International Conference on Remediation of Chlorinated and Recalcitrant Compounds. Monterey, California, May 2002.
Johnson, Richard L. and James F. Pankow. 1992. “Dissolution of Dense Chlorinated Solvents into Groundwater. 2. Source Functions for Pools of Solvent.” Environmental Science & Technology, 26(5):896-901.
Johnston, R.H. 1973. Hydrology of the Columbia Deposits of Delaware – An appraisal of a regional water table aquifer: Newark Del., Delware Geological Survey Bulletin No. 14. 78 p.
Jordan, R.R. 1964. Columbia sediments of Delaware: Newark Del., Delware Geological Survey Bulletin No. 142. 69 p.
Kampbell, D.H., J.T. Wilson, and S.A. Vandegrift. 1989. “Dissolved Oxygen and Methane in Water by a GC Headspace Equilibrium Technique.” Intern. J. Environ. Anal. Chem., 36:249-257.
Klens, J., D. Pohlmann, and D. Graves, The effects of permanganate oxidation on subsurface microbial populations, in the proceedings of the Sixth International In Situ and On-Site Bioremediation Symposium, San Diego, CA, June 4-7, 2001.
Leahy, P.P. 1982. Groundwater resources of the Piney Point and Cheswold aquifers in central Delaware as determined by a flow model: Newark Del., Delaware Geological Survey Bulletin No. 16. 68 p.
ER0008 85 2007.05.24 Revision 3.0
Lendvay, J.M., F.E. Löffler, M. Dollhopf, M.R. Aiello, G. Daniels, B.Z. Fathepure, M. Gebhard, R. Heine, R. Helton, J. Shi, R. Krajmalnik-Brown, C.L. Major, M.J. Barcelona, E. Petrovskis, J.M. Tiedje, and P. Adriaens. 2003. Bioreactive barriers: a comparison of bioaugmentation and biostimulation for chlorinated solvent remediation. Environmental Science and Technology 37:1422-1431.
Loffler, F.E., Q. Sun, J. Li and J.M. Tiedje. 2000. 16 S rRNA gene-based detection of tetrachloroethene dechlorinating Desulfuromonas and Dehalococcoides species. Appl. Environ. Microbiol. 66: 1369-1374.
Major, D.W., E. Hodgins, and B. Butler. 1991. “Field and Laboratory Evidence of In Situ Biotransformation of Tetrachloroethylene to Ethene and Ethane at a Chemical Transfer Facility in North Toronto.” In R. Hinchee and R. Olfenbuttel (Eds.), On-Site Bioreclamation Processes for Xenobiotic and Hydrocarbon Treatment. Pp. 147-171. Butterworth-Heinemann, Boston, MA.
Major, D., E. Cox and E. Edwards. 1994. The Complete Dechlorination of Trichloroethene to Ethene Under Natural Conditions in a Shallow Bedrock Aquifer Located in New York State. Symposium On Intrinsic Bioremediation of Groundwater.
Major, D.W., M.M. McMaster, E.E. Cox, E.A. Edwards, S.M. Dworatzek, E.R. Hendrickson, M.G. Starr, J.A. Payne, and L.W. Buonamici. 2002. Field demonstration of successful bioaugmentation to achieve dechlorination of tetrachloroethene to ethene. Environmental Science and Technology 36:5106-5116.
Maymo-Gatell, X., J.M. Gossett and S.H. Zinder. 1997. Dehalococcoides ethenogenes Strain 195: Ethene production from halogenated aliphatics. In: In Situ and On-Site Bioremediation: Volume 3. Alleman, B.C. And Leeson, A. (Eds). Battelle Press, Columbus, OH.
McCarty, P.L. 1994. An overview of anaerobic transformation of chlorinated solvents. Pages 135-142 In Symposium on Intrinsic Bioremediation of Ground Water. Washington, D.C., U.S. Environmental Protection Agency, EPA 540/R-94/515.
Morrill, P.E., G. Lacrampe-Couloume, G.F. Slater, B.E. Sleep, E.A. Edwards, M.L. McMaster, D.W. Major, and B. Sherwood Lollar. 2005. Quantifying chlorinated ethene degradation during reductive dechlorination at Kelly AFB using stable carbon isotopes. J. Contam. Hydrology. 76(3-4):279-93
National Research Council. 1994. Alternatives for ground water cleanup. National Academy Press, Washington DC.

ER0008 86 2007.05.24 Revision 3.0
Pankow, J.F. and J.A. Cherry. 1996. Dense chlorinated solvents and other DNAPLs in Groundwater. Waterloo Press.
Sherwood Lollar, B., G.F. Slater, B. Sleep, M. Witt, G.M. Klecka, M. Harkness and J. Spivack. 2001. Stable Carbon Isotope Evidence for Intrinsic Bioremediation of Tetrachloroethene and Trichloroethene at Area 6, Dover Air Force Base. Environ. Sci. Technol. 35(2):261-269.
Sherwood Lollar, B., G.F. Slater, J. Ahad, B. Sleep, J. Spivack, M. Brennan and P. Mackenzie. 1999. Contrasting carbon isotope fractionation during biodegradation of trichloroethylene and toluene: Implications for intrinsic bioremediation. Organic Geochemistry. 30:813-820.
Sleep, B. E., D. J. Seepersad, K. Mo, C. M. Heidorn, L. Hrapovic, P. L. Morrill, M. L. McMaster, E. D. Hood, C. LeBron, B. Sherwood Lollar, D. W. Major, and E. A. Edwards. 2006. Biological Enhancement of Tetrachloroethene Dissolution and Associated Microbial Community Changes. Environ. Sci. Technol 40(11):3623-3633
Steffan, R.L., K.L. Sperry and M.T. Walsh. 1999. “Field-scale Evaluation of In Situ Bioaugmentation For Remediation of Chlorinated Solvents in Groundwater.” Environmental Science & Technology. 33(16):2771-2881.
United States Environmental Protection Agency, 1996. Drinking Water Regulations and Health Advisories. EPA/822-3-96-002. Office of Water, Washington, D.C., October.
Wehr, S. D, L. Yu, H. Rizvi, E. A. Edwards. 2000. Comparison of Anaerobic Dechlorinating Enrichment Cultures Maintained on Different Chlorinated Ethenes. Submitted to the Journal of Environmental Science and Technology.
Yang, Y. and P.L. McCarty. 2000. Biologically Enhanced Dissolution of Tetrachloroethene DNAPL. Environmental Science and Technology, 34(14):2979-2984.

ER0008 87 2007.05.24 Revision 3.0
8. POINTS OF CONTACT
A summary of contact information for all personnel associated with this demonstration project is presented in Table 16.
TABLE 16: LIST OF CONTACTS Test Cell #1, Dover AFB, Delaware
POINT OF CONTACTName
ORGANIZATIONName
Address
Phone/Fax/E-mail Role in Project
Timothy McHale Air Force Research Laboratory (AFRL)Dover National Test Site Program Manager
Building 909, Arnold Drive ExtendedP.O. Box 02063
Dover Air Force Base, Delaware, UNITED STATES19902
(302) 677-4147Fax (302) 677-4100
Dover AFB Site Coordinator
Dave Major GeoSyntec Consultants130 Research Lane, Suite 2Guelph, Ontario, CANADA
N1G 5G3
(519) 822-2230 Ext. 232Fax (519) 822-3151
Project Director/Principal
Michaye McMaster GeoSyntec Consultants130 Research Lane, Suite 2Guelph, Ontario, CANADA
N1G 5G3
(519) 822-2230 Ext. 229Fax (519) 822-3151
Project Coordinator
Matthew Bogaart GeoSyntec Consultants130 Research Lane, Suite 2Guelph, Ontario, CANADA
N1G 5G3
(519) 822-2230 Ext. 237Fax (519) 822-3151
Field Manager
Brent Sleep University of TorontoDepartment of Civil Engineering
35 St. George StreetToronto, Ontario, CANADA
M5S 1A4
(416) 978-3005Fax (416) 978-3674
Associate Professor
Elizabeth Edwards University of TorontoDepartment of Chemical Engineering and Applied
Chemistry200 College Street
Toronto, Ontario, CANADAM5S 3E5
(416) 946-3506 Fax (416) 978-8605
Assistant Professor
Carmen LeBron Navy Facilities Engineering Service CentreEnvironmental Engineer
1100 23rd AvenuePort Hueneme, California, UNITED STATES
93043
(805) 982-1616Fax (805) 982-4304
NFESC Technical Lead
Fred Goetz Navy Facilities Engineering Service CentreEnvironmental Engineer
1100 23rd AvenuePort Hueneme, California, UNITED STATES
93043
(805) 982-1184Fax (805) 982-4304
NFESC Technical Lead
John Bradford University of WyomingDepartment of Geology and Geophysics
PO Box 3006Laramie, WY, UNITED STATES
82071-3006
(307) 766-3239Fax (307) [email protected]
Principal Investigator (Geophysics)