Embed Size (px)
Citation preview


Continuous Improvement: Checking in with our Customers
Presented to the Dallas City CouncilSeptember 19, 2007
Results of the 2007 Citizen Survey

Purpose
Page 2
To present results of the 2007 Citizen Survey, and
To discuss how the Citizen Survey relates to staff’s commitment to continuous improvement and accountability for the quality of our customer service.

Background
Page 3
In 2005 the new City Manager faced two significant challenges:
Overcoming poor public perception of the City, and
Uniting an organization that provides a huge array of services – from sanitation to saving lives – behind a common guiding principle
CMO formulated a single solution to both challenges:
Promote and recognize quality customer service

Background
Page 4
As part of the quality customer service strategy, CMO created Strategic Customer Services to:
Develop a new customer service culture, now spearheaded by CSI Dallas (Customer Service Initiative run by staff volunteers);
Assist departments in becoming accountable for continuously improving service delivery;
Make improvements to the 311 Service Request (SR) System; and
Improve interdepartmental coordination by assigning customer service reps to community projects (Service Area Coordination Team)

Continuous Improvement Model
Page 5
DO
ACT
PLAN
CHECK
COMMUNICATE

Continuous Improvement Model
Page 6
DO
ACT
PLAN
CHECK
COMMUNICATE
ACTProcess Improvement projects
CHECKCitywide Performance Measurement, Benchmarking Project, Quality Assurance program and Action Plan updates
PLANCitywide Strategic and Tactical Planning
DOCSI Dallas; Service Area Coordination Team; 311 Configuration
Strategic Customer Services Functions
COMMUNICATECustomer Feedback and Performance Reporting

Communication with Customers
Page 7
The City communicates with customers through a variety of channels, including:
person-to-person (by phone, Town Halls, community events, at City facilities)print (newsletters, newspaper and water bill inserts, billboards);broadcast (cable, radio); and digital (emails, Internet);
Communication channels are typically one-way
Continuous improvement in customer satisfaction would suggest that two-way communication is preferred

Communication with Customers
Page 8
Feedback tools for both internal and external customers recently tested include:
Various departmental and programmatic feedback tools
Annual citywide service quality survey (Citizen Survey)
311 Mystery Shopper program and monthly Customer Experience survey
Employee engagement survey
Internal services survey
Focus groups

Citizen Survey - Background
Page 9
Annual citywide service quality survey:
Recommended by the McKinsey Report (2004)
Validated as a best practice by the CSI Dallas Customer Feedback tactical team study (2006)
Partnership with ICMA and the National Research Center, Inc. (NRC) resulted in the development of the City of Dallas Citizen Survey:
Provides a high-level overview of customer opinions
Provides standard and statistically valid results

Citizen Survey - Administration
Page 10
In spring, NRC mails out 8,400 surveys (600 per Council district) in both English and Spanish to randomly selected households
Questions cover customers’:
Attitudes about living in Dallas;
Perception of government and service quality; and
Demographic information

Citizen Survey - Administration
Page 11
In 2007, 1,192 residents mailed in a completed survey (12% in Spanish) resulting in a +/- 3% margin of error at a 95% confidence interval
In comparing scores from year to year, only changes of 3 or more points in either direction on a 100-point scale are considered ‘statistically significant’ (not simply due to chance)

Citizen Survey - Scoring
Page 12
Most survey questions are scored on a scale of excellent-good-fair-poor and then converted to a 100-point scale.
Example: “How do you rate Dallas as a place to live”
Response Option
Percent Response
Scale Value Average Rating
Excellent 12% X 100 = 12Good 52% X 67 = 35Fair 31% X 33 = 10Poor 5% X 0 = 0
Total 100% 57
0 1006733
goodfairpoor excellent
57
Citizen Survey – Results Overview
Page 13
2007 results show a trend of improved customer satisfaction, consistent with the continuous improvement model and customer service initiative:
48% rated the overall quality of City services as good or excellent up from 41% in 2005
22 of 42 of the City services rated (52%) improved over the benchmark year of 2005
13 of 26 quality of life issues rated (50%) improved over the benchmark year of 2005
No City service nor quality of life issues declined in customer perception over the benchmark year of 2005

Citizen Survey – Highest Rated
Page 14
Highest rated services/issues
Service/Issue Rating Change from ’05*
74 NSC
NSC
NSC
n/a
NSC
69
66
66
62
% rated good or excellent
Shopping opportunities 83%
83%
77%
66%
Public library services 68%
Fire services
Ambulance/EMS services
WRR 101.1 classical music programming**
0 1006733
goodfairpoor excellent
*NSC = No significant change**New question for 2007

Citizen Survey – Lowest Rated
Page 15
Lowest rated services/issues
Service/Issue Rating Change from ’05*
33 +5
Code enforcement 33 +4 28%
+4
+3
NSC
+4
32
31
31
25
% rated good or excellent
Ease of bicycle travel 29%
25%
27%
26%
Street repair 21%
Crime prevention
Alley maintenance
Sidewalk maintenance
0 1006733
goodfairpoor excellent
*NSC = No significant change
Note: 5 of the 6 lowest rated services/issues showed improvement over the benchmark year of 2005.
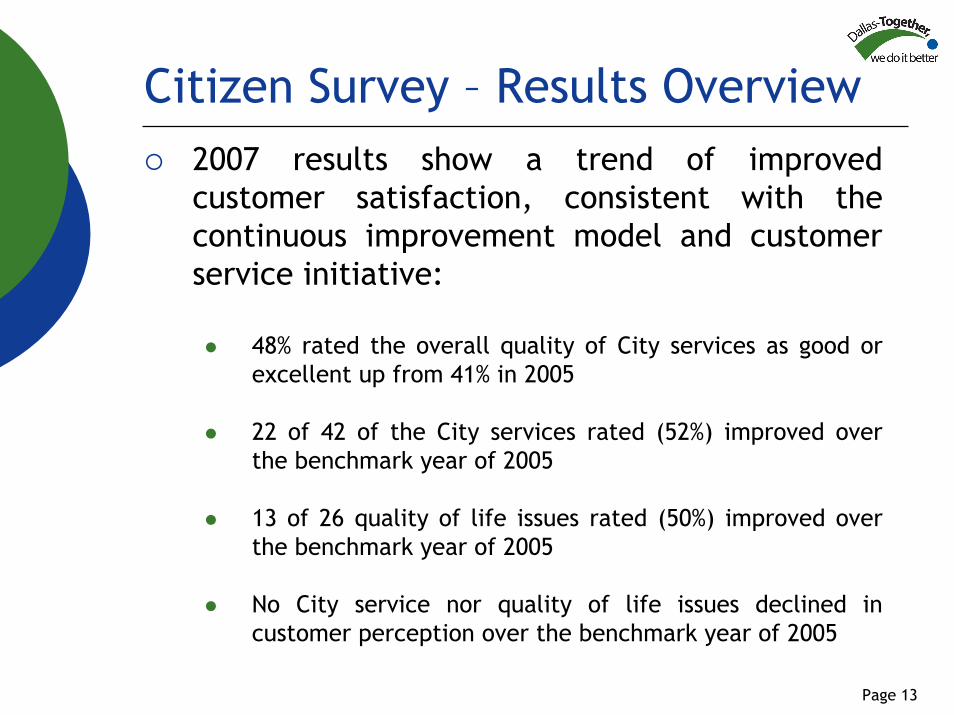
Citizen Survey – Most Improved
Page 16
Most improved services/issues
Service/Issue Rating Change from ‘05
48 +12
Job opportunities 52 +11 56%
Opportunities to attend cultural activities
60 +6 69%
Economic Development 46 +6 45%
+5
+5
+5
53
50
40
% rated good or excellent
Recycling 53%
54%
48%
Dallas as a place to retire 39%
311 services
Appearance of recreation centers/ facilities
0 1006733
goodfairpoor excellent

Citizen Survey – Other Results
Page 17
Economic indicators: perception has improved substantially over the past two years
Economic Indicator % rated good or excellent Change from ‘05
72% +18
+15Job opportunities 56%
Dallas as a place to do business

Citizen Survey – Other Results
Page 18
Top 5 Perceived Problems % response ‘major problem’ Change from ’05*
77% NSC
-6
NSC
NSC
-8
Crime 66%
Traffic congestion 51%
Unsupervised youth 51%
48%
Drugs
Homelessness
Perceived problems: residents were asked to rate whether issues faced by cities across the country were a ‘major problem’ in Dallas
*NSC = No significant change

Citizen Survey – Other Results
Page 19
Safety ratings: perception of crime as ‘major problem’ is down from 72% in 2005 to 66% in 2007. However, feelings of safety have not declined (or not changed) in the following areas:
Safety Indicator % rated very or somewhat safe Change from ’05*
70% -6
Downtown – daytime 62% NSC
Parks – daytime 61% NSC
Safe from fire 47% -5
Safe from violent crime 20% -6
Safe from property crime 15% -5
NSC
-4
Parks – after dark 9% NSC
In neighborhood – after dark 37%
Downtown – after dark 15%
In neighborhood – daytime
*NSC = No significant change

Citizen Survey – Other Results
Page 20
Comparison data: Results show a trend of improvement against other local governments since 2005, although the majority City service ratings and quality of life items continue to fall below average
Rating Category Items in this category
% in this category
% in this category (’05)
11
7
56
Total 74 100%
14.9%
100%
Similar to the average score
9.5%
2.9%
4.3%
Below average score 75.6% 92.8%
Above average score

Citizen Survey – Other Results
Page 21
Comparison data: Items with above average ratings:
Dallas as a place to workOpportunities to attend cultural eventsShopping opportunitiesJob opportunitiesEase of bus travel in DallasSnow removalAmount of public parkingBus/transit servicesStorm drainageLand use, planning and zoningEconomic development

Citizen Survey – Other Results
Page 22
Comparison data: Items with average ratings:
Overall quality of new development in DallasEase of car travelFire servicesTraffic signalDrinking waterSewer servicesServices to low-income people

Citizen Survey – Use of Results
Page 23
Citizen Survey results are used for a variety of purposes, including:
Indicators of customer service for citywide performance measures initiative
Comparison with jurisdictions that belong to ICMA’s Center for Performance Measurement (benchmarking project)
Indicators of progress for achieving Council goals through the annual budget and strategic plan
Source of process improvement projects (e.g. Sanitation’s “Too Good to Throw Away” program)
Focus group topics (e.g. Streets/SCS focus groups on the quality of residential streets)

Citizen Survey – Reports
Page 24
The following reports can be found on Strategic Customer Services webpage athttp://www.dallascityhall.com/scs/citizen_survey.html:
Report of ResultsNormative Comparisons Geographic Comparisons Demographic Comparisons 2005 and 2006 versions of the above
SCS has also partnered with CIS to create an interactive website that will allow users to select variables of interest (anticipated completion – September 2007)

Appendix
Ratings of City services, quality of life and general government issues by Council Key Focus Areas (KFAs)

Citizen Survey – By Council KFA
Page 26
Public Safety
0 1006733
goodfairpoor excellent
Service/Issue Rating Change from ’05*
Fire services 69 NSC
Ambulance/EMS services 66 NSC
Fire prevention and education 51 NSC
Municipal courts 44 NSC
Traffic enforcement 42 NSC
NSC
+4
46
32
Police services
Crime prevention
*NSC = No significant change

Citizen Survey – By Council KFA
Page 270 1006733
goodfairpoor excellent
Service/Issue Rating Change from ’05*
Shopping opportunities 74 NSC
Bus/transit services 54 NSC
Ease of bus travel 48 NSC
Economic development 46 +6
Ease of car travel 43 +4
Overall image/reputation of Dallas 47 +3
Overall quality of new development in Dallas** 54 NSC
Ease of rail travel 49 NSC
NSC
+11
58
52
Dallas as a place to work**
Job opportunities
*NSC = No significant change**Question first asked in 2006
Economic Vibrancy

Citizen Survey – By Council KFA
Page 280 1006733
goodfairpoor excellent
Service/Issue Rating Change from ’05*
Access to affordable quality housing 42 NSC
Traffic signal timing 41 NSC
Land use, planning and zoning 39 +4
Street lighting 36 NSC
Ease of walking 35 +4
Ease of bicycle travel 33 +5
Alley maintenance 31 +3
Sidewalk maintenance** 31 NSC
Street repair 25 +4
Amount of public parking 39 +3
Economic Vibrancy (cont.)
*NSC = No significant change**Question first asked in 2006

Citizen Survey – By Council KFA
Page 290 1006733
goodfairpoor excellent
Service/Issue Rating Change from ’05*
Garbage collection 58 +3
Sewer services 52 NSC
Appearance of recreation centers/facilities 50 +5
Appearance/maintenance of parks 49 NSC
Drinking water 49 +3
Overall appearance of Dallas 49 +4
Snow removal 49 NSC
Bulk trash pickup 50 +4
Access to affordable quality food** 57 NSC
NSC57Dallas as a place to live
Clean, Healthy Environment
*NSC = No significant change**Question first asked in 2006
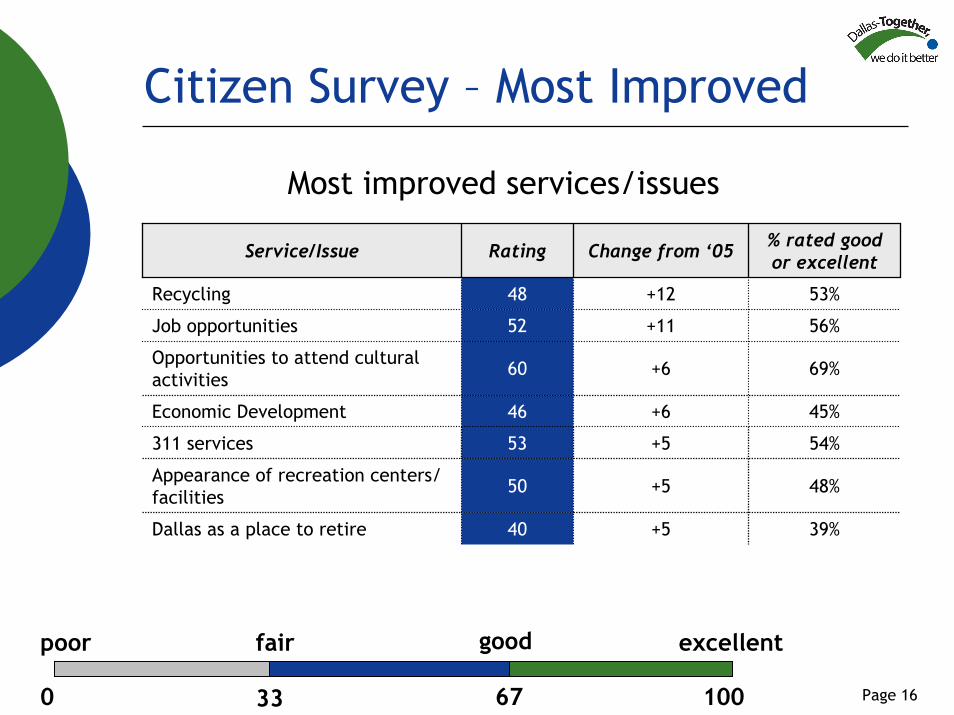
Citizen Survey – By Council KFA
Page 300 1006733
goodfairpoor excellent
Service/Issue Rating Change from ’05*
Neighborhood as a place to live 48 NSC
Recycling 48 +12
Health services 46 +3
Services to seniors 41 NSC
Storm drainage 44 NSC
Openness and acceptance 42 NSC
Access to affordable quality health care 41 NSC
Access to affordable quality child care 38 +3
Dallas as a place to retire 40 +5
Sense of community 40 +3
Clean, Healthy Environment (cont.)
*NSC = No significant change

Citizen Survey – By Council KFA
Page 310 1006733
goodfairpoor excellent
Service/Issue Rating Change from ’05*
Air quality 36 NSC
Animal control 36 NSC
Services to low income people 34 NSC
Street cleaning 34 +4
Code enforcement 33 +4
Clean, Healthy Environment (cont.)
*NSC = No significant change

Citizen Survey – By Council KFA
Page 320 1006733
goodfairpoor excellent
Service/Issue Rating Change from ‘05
WRR 101.1 FM classical music programming* 66 n/a
Appearance of arts and cultural centers/ facilities*
60 n/a
Accessibility of arts and cultural centers/ facilities*
56 n/a
Arts and cultural programs* 56 n/a
Accessibility of parks 55 +4
Accessibility of recreation centers/facilities 52 +4
+6
+5
60
52
Opportunities to attend cultural events
Recreational opportunities
Culture, Arts and Recreation
*New question for 2007
Citizen Survey – By Council KFA
Page 330 1006733
goodfairpoor excellent
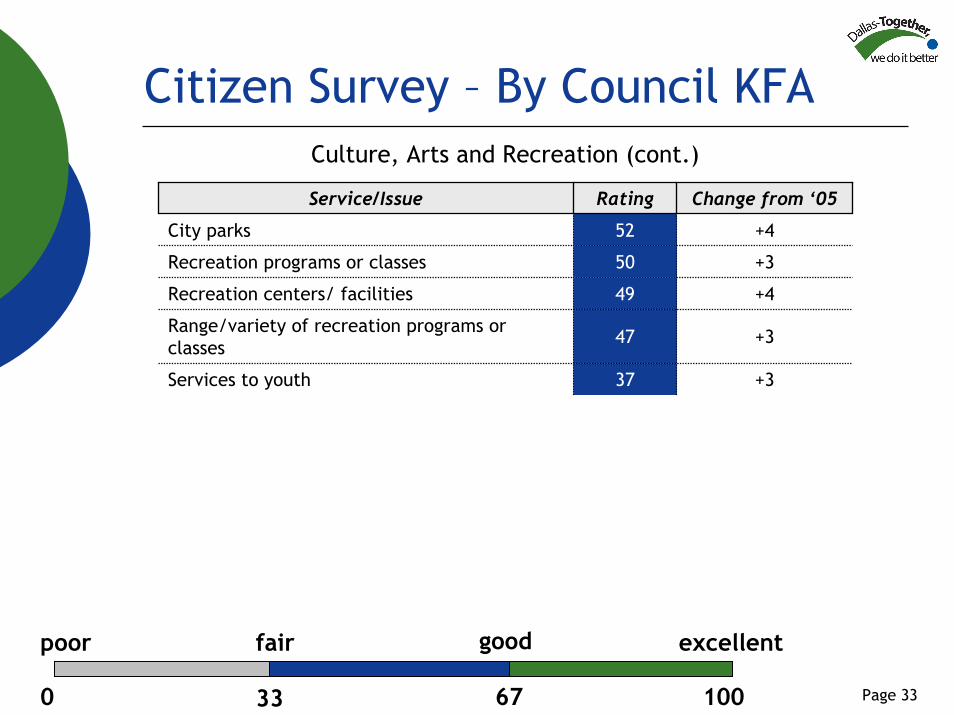
Service/Issue Rating Change from ‘05
52 +4
+3
Recreation centers/ facilities 49 +4
Services to youth 37 +3
+3
50
47
City parks
Recreation programs or classes
Range/variety of recreation programs or classes
Culture, Arts and Recreation (cont.)

Citizen Survey – By Council KFA
Page 340 1006733
goodfairpoor excellent
Service/Issue Rating Change from ’05*
Public library services 62 NSC
Variety of library materials 59 NSC
Dallas as a place to raise children 43 +3
NSC
+3
56
39
Educational opportunities**
Public schools
Education
*NSC = No significant change**Question first asked in 2006
Citizen Survey – By Council KFA
Page 350 1006733
goodfairpoor excellent
Service/Issue Rating Change from ’05*
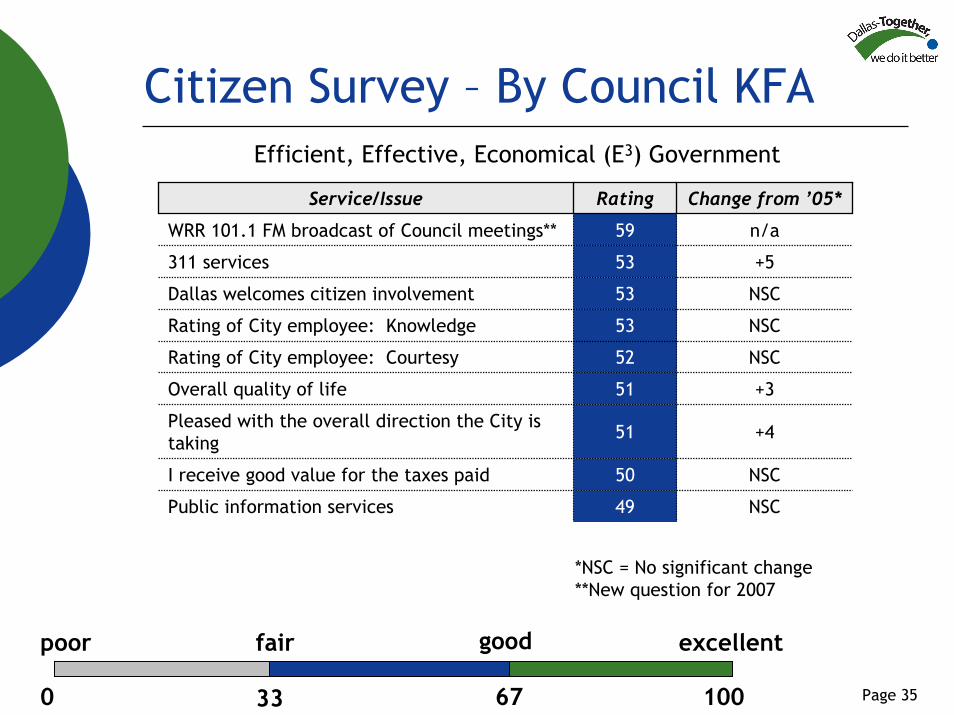
WRR 101.1 FM broadcast of Council meetings** 59 n/a
311 services 53 +5
Dallas welcomes citizen involvement 53 NSC
Rating of City employee: Knowledge 53 NSC
Rating of City employee: Courtesy 52 NSC
Public information services 49 NSC
Overall quality of life 51 +3
Pleased with the overall direction the City is taking
51 +4
NSC50I receive good value for the taxes paid
Efficient, Effective, Economical (E3) Government
*NSC = No significant change**New question for 2007

Citizen Survey – By Council KFA
Page 360 1006733
goodfairpoor excellent
Service/Issue Rating Change from ’05*
Rating of City employee: Overall impression 49 NSC
Overall quality of City services 47 +4
Rating of City employee: Responsiveness 46 NSC
Cable Television 43 NSC
NSC46The City government listens to citizens
Efficient, Effective, Economical (E3) Government (cont.)
*NSC = No significant change


1
Office of Economic Development
WWW.DALLAS-EDD.ORG
International Inland Port of Dallas (IIPOD):Converting Vision to Reality
September 19, 2007

2
Office of Economic Development
WWW.DALLAS-EDD.ORG
Purpose
To describe the IIPOD vision
To show how changing global trade patterns create opportunities
To outline key components of IIPOD
To review the Urban Land Institute’s (ULI) Advisory Panel recommendations
To discuss status of current initiatives
To recommend a strategic approach and next steps

3
Office of Economic Development
WWW.DALLAS-EDD.ORG
The Vision
IIPOD is successfully developed into:A third phase of regional intermodal development (building off of DFW Airport and Alliance) that is a key driver in making Dallas the nation’s premier logistics and distribution center
A catalyst for Southern Sector investment, job growth and development of sustainable communities, increasing city-wide tax base
4
Office of Economic Development
WWW.DALLAS-EDD.ORG
Changing Global Trade Patterns Create Opportunities
5
Office of Economic Development
WWW.DALLAS-EDD.ORG
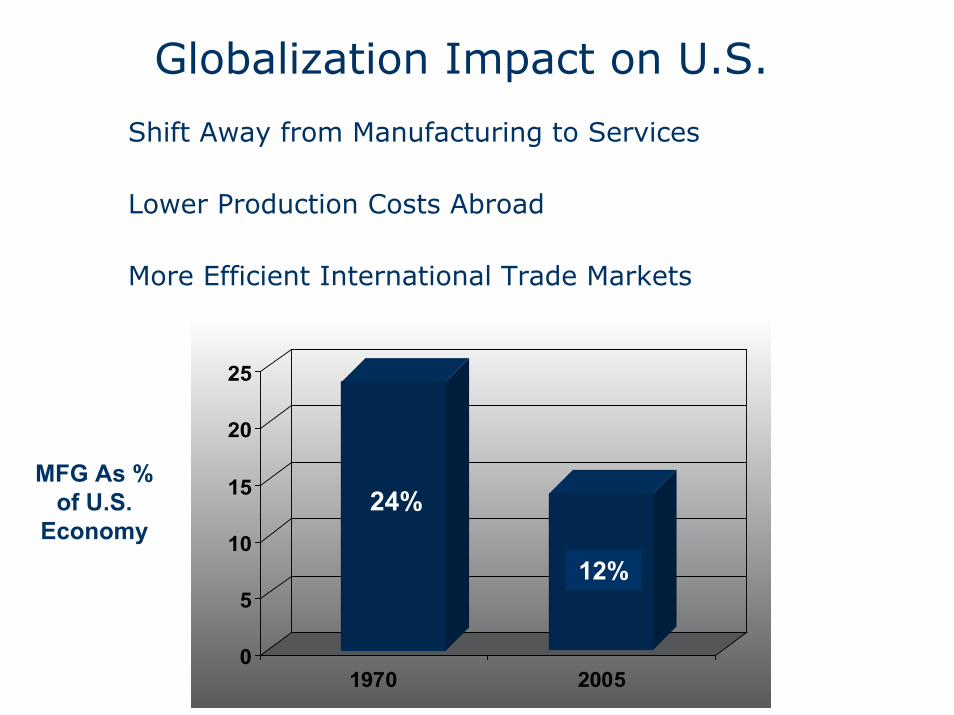
Globalization Impact on U.S.
Shift Away from Manufacturing to Services
Lower Production Costs Abroad
More Efficient International Trade Markets
MFG As % of U.S.
Economy
0
5
10
15
20
25
1970 2005
24%
12%
6
Office of Economic Development
WWW.DALLAS-EDD.ORG
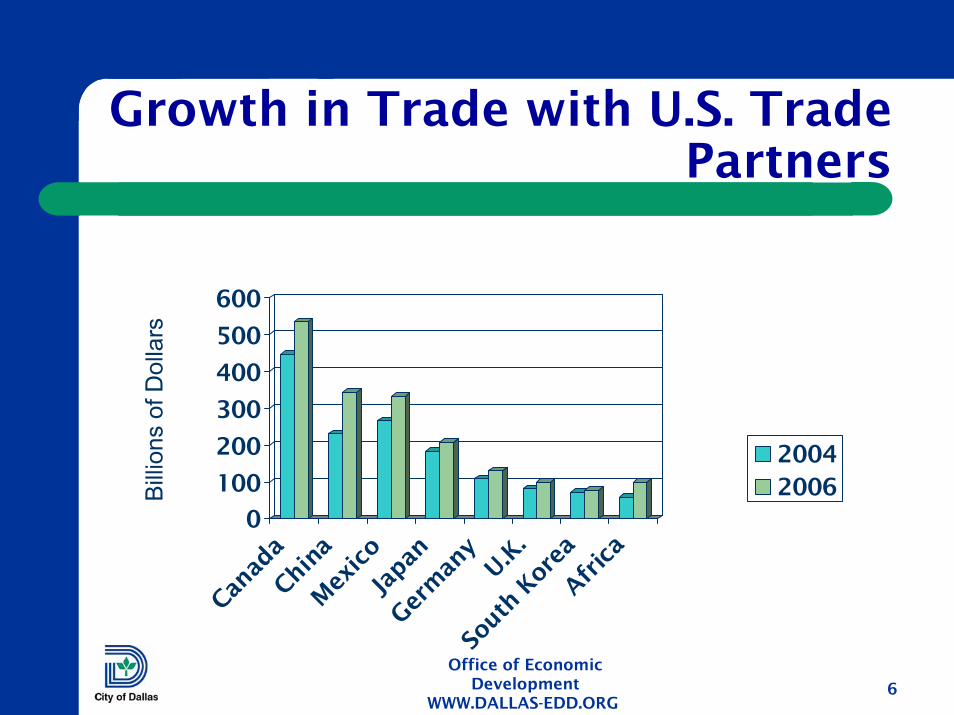
Growth in Trade with U.S. Trade Partners
Billi
ons
of D
olla
rs
0
100
200
300
400
500
600
Canad
aChi
naM
exic
oJa
pan
Germ
any
U.K.
Sout
h Kor
eaAfr
ica
20042006

7
Office of Economic Development
WWW.DALLAS-EDD.ORG
Key Trade Facts
Over one third of goods to the U.S. originate in the Pacific Rim. This has grown 91% over 10 years.
China is the leading source of Pacific Rim imports, overtaking Japan (led in 2001)
The fastest growing region is Latin America, with a growth rate of 177% over the past 10 years.Dallas is positioned to benefit from both of these growth regions, through service from the West Coast ports and the Port of Houston.

8
Office of Economic Development
WWW.DALLAS-EDD.ORG
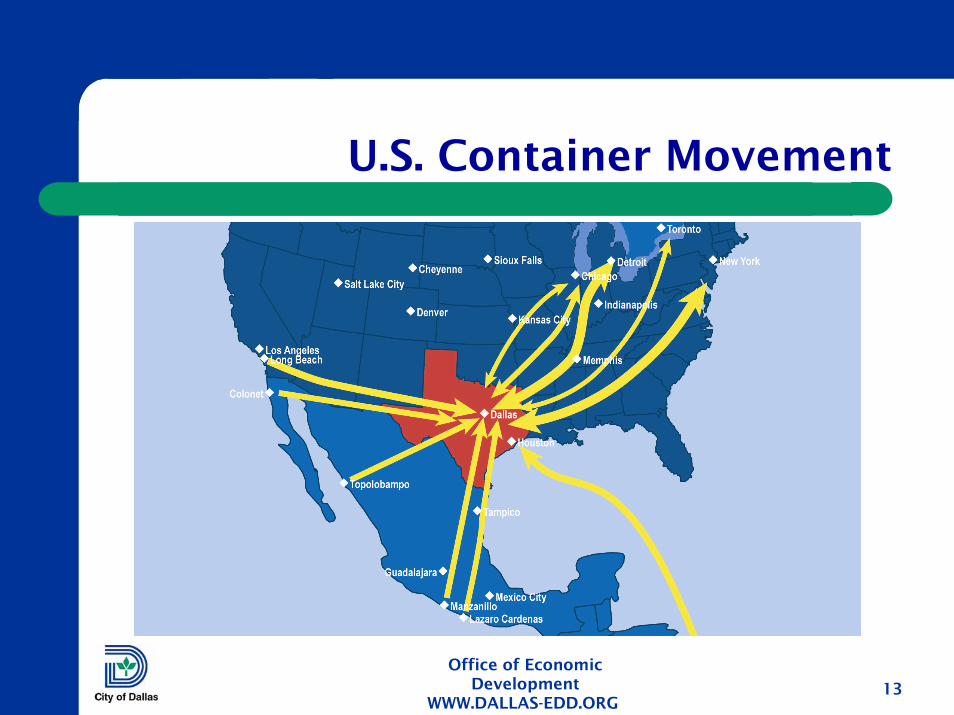
Trade Moves in U.S. From West to East
Products are shipped via ocean container from Asia to USAContainers clear U.S. Customs at the Port of Los Angeles/Long BeachDelays in clearance at congested portsResults in delays and damaged/missing products
Only 30% of all products have a destination west of the Rocky Mountains
70% of all products are shipped east of the Rocky Mountains

9
Office of Economic Development
WWW.DALLAS-EDD.ORG
Logistical Trends
Use of Larger Ships
Limited Expansion Capacity of L.A./L.B. Ports
Increasing Use of Rail
Improvement in Inventory Control Techniques & Shipping Technologies
Emergence of Large Distribution Centers

10
Office of Economic Development
WWW.DALLAS-EDD.ORG
World-Wide Container Traffic
300
250
200
150
100
50
01980 1985 1990 1995 2000 2005
Mill
ion
TEU
*
*TEU: Twenty-foot Equivalent Unit

11
Office of Economic Development
WWW.DALLAS-EDD.ORG
Growth in Ships
Post-Panamax Ships

12
Office of Economic Development
WWW.DALLAS-EDD.ORG
The Panama Canal and Port of Houston
In October of 2006, Panamanians voted to expand the Panama Canal.
Estimated cost of $5.25 billion with completion in 2014. Expansion will allow ships with up to 12,000 TEUs to use the canal
The U.S. is the primary origin and destination of goods shipped through the Panama CanalHouston is the primary container port in Texas and handled 1.6 M TEU’s in 2006
This number is expected to grow more than 25% annually with the expansion of the Panama CanalHouston does not face the same congestion and delay issues as the Ports of L.A. and Long Beach
13
Office of Economic Development
WWW.DALLAS-EDD.ORG
U.S. Container Movement

14
Office of Economic Development
WWW.DALLAS-EDD.ORG
Logistical Strengths of the Region
The DFW region has the third lowest distribution costs of the top 50 U.S. consumer markets, trailing only Louisville and MemphisMore than 600 motor carriers and 100 freight forwarders operate out of the regionThe two largest FTZs cover more than 9600 acres.More than 640 million feet of warehouse space, with another 6 million under construction2nd lowest price per square foot in major metropolitan citiesGood weather provides year-round rail access

15
Office of Economic Development
WWW.DALLAS-EDD.ORG
Alliance, 1993 (above) and today (right)
Growth at Alliance

16
Office of Economic Development
WWW.DALLAS-EDD.ORG
Intermodal lifts have increased 96% since 1995
41% of business isinternational (increase of 31%in 2006)
Overall, there are 24,000 employees at AllianceTexas, 140 corporate residents and 24.4 million sq. ft. office space
$5.76 billion was invested for a $26 billion economic impact
292,863
573,252
1995 2005
Intermodal lifts at Alliance
Growth at Alliance

17
Office of Economic Development
WWW.DALLAS-EDD.ORG
Components of IIPOD

18
Office of Economic Development
WWW.DALLAS-EDD.ORG
Map of IIPOD Communities
Impact area covers 234,000 acres and encompasses 12 municipalities.
Located in Southern Dallas County, at confluence of I-35, 45, 20 and future Loop 9

19
Office of Economic Development
WWW.DALLAS-EDD.ORG
Components of IIPOD
Third phase of comprehensive regional intermodal development (complementing DFW and Alliance)
Initial development anticipated to focus on the “box” area south of I-20.
Dallas
The “Box” Area

20
Office of Economic Development
WWW.DALLAS-EDD.ORG
Development in IIPOD Area
Serviced by one of UP’s largest rail intermodals and future BNSF intermodal within 2 milesCentered around the 6000 acre Dallas Logistics Hub (Allen Group), approximately 25% of which falls within Dallas City limits. Other major developers include: Prologis, Trammell Crow, Duke, First Industrial and Hillwood7 projects planned or under construction. Allen’s first two projects in Southport break ground in 3rd QuarterEstimate 7000 new direct jobs for Dallas and 30,000 total jobs in “box”area over 20 year period. Additional 30,000 indirect jobs.
21
Office of Economic Development
WWW.DALLAS-EDD.ORG
ULI Advisory Services Panel

22
Office of Economic Development
WWW.DALLAS-EDD.ORG
ULI Advisory Services Panel
The Urban Land Institute (ULI) is an independent non-profit education and research organization with 30,000+ members worldwide
Represents entire spectrum of land use and real estate development disciplines
In June of 2006, a seven member ULI Advisory Services Panel spent five days in Dallas looking at the Inland Port concept.Results of visit included a presentation and written report which currently serve as the framework for IIPOD.
23
Office of Economic Development
WWW.DALLAS-EDD.ORG
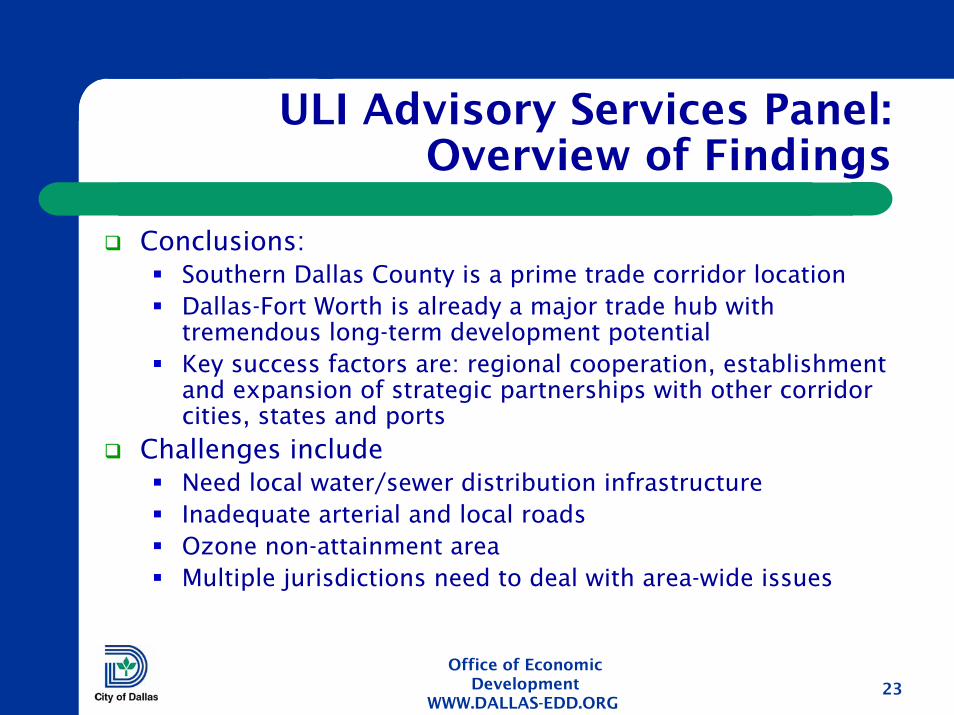
ULI Advisory Services Panel: Overview of Findings
Conclusions:Southern Dallas County is a prime trade corridor locationDallas-Fort Worth is already a major trade hub with tremendous long-term development potentialKey success factors are: regional cooperation, establishment and expansion of strategic partnerships with other corridor cities, states and ports
Challenges includeNeed local water/sewer distribution infrastructureInadequate arterial and local roadsOzone non-attainment areaMultiple jurisdictions need to deal with area-wide issues
24
Office of Economic Development
WWW.DALLAS-EDD.ORG
ULI’s Recommendations
Key recommendations include the following:
Develop a comprehensive master planAddress environmental issuesOrganize area municipalities through Interlocal AgreementsCreate a communications programIncrease rail opportunities and connectionsLeverage public sector funding to improve infrastructure
25
Office of Economic Development
WWW.DALLAS-EDD.ORG
ULI’s Key Recommendations
Develop a comprehensive Master Plan (in progress)Encourage uniform building codes among municipal jurisdictionsCreate compatible zoning and subdivision regulationsExplore ways to expedite building plan review/approval and building inspectionsEngage experienced planning and urban design teamInclude development regulations and capital improvement program in implementation planFocus on sustainability to realize long-term development potential
Address environmental issues (in progress)Engage environmental stakeholdersSet reasonable and cost effective environmental standards/expectations

26
Office of Economic Development
WWW.DALLAS-EDD.ORG
ULI’s Key Recommendations
Organize area municipalities through InterlocalAgreements (in progress)
Formalize and broaden existing interlocal agreements within IIPOD coalitionForm a non-profit trade corridor development organization to create a unified voiceInclude all key stakeholdersPool resources
Create a communications program (in progress)Work closely with all interested parties and keep public informed and involvedContinue leadership involvement in ROTCC

27
Office of Economic Development
WWW.DALLAS-EDD.ORG
ULI’s Key Recommendations
Increase rail opportunities and connections (in beginning stages)
Leverage public sector funding to improve infrastructure (in progress)
Prioritize infrastructure investments
Municipal airport in Lancaster and Mesquite should focus on general aviation and corporate uses as there is significant excess capacity at both Alliance and DFW

28
Office of Economic Development
WWW.DALLAS-EDD.ORG
Current Initiatives Status

29
Office of Economic Development
WWW.DALLAS-EDD.ORG
Current Initiative Status
Master Planning ProcessKey ULI recommendation is initiation of comprehensive master planning process to maximize long term development and create sustainable communities
Hired consultant to develop scope of work and first steps of master planning process
Ready to move forward with RFQ and RFP
Will require Council approval and local match funding from IIPOD municipalities and stakeholders.

30
Office of Economic Development
WWW.DALLAS-EDD.ORG
Current Initiative Status
Environmental Stakeholder EngagementEnvironmental Working Group created to ensure impact area properly treated in State Implementation Plan and local environmental concerns are addressed
Representatives from U.S. EPA, State, Cities, COG, environmental groups, and developers.
ROTCCMOUs with EPA regions 4 and 6 and Southeast Diesel Collaborative to implement green and safe international trade corridor.

31
Office of Economic Development
WWW.DALLAS-EDD.ORG
Current Initiative Status
GovernanceCollaborative agreements in place with Cedar Hill, DeSoto, Duncanville, Lancaster and Mesquite, Dallas County, Balch Springs, Hutchins and SeagovillePlans to create a professionally staffed, stakeholder funded non-profit for the purpose of fundraising, outreach, promotion and marketing on hold pending interlocals and other funding needs assessment.
Communication and OutreachROTCC holds quarterly meetings throughout the U.S. for educational purposesIIPOD coalition meetings quarterly involving all targeted communities

32
Office of Economic Development
WWW.DALLAS-EDD.ORG
Current Initiative Status
Rail IssuesOngoing discussions with Port of Houston, Harris County and Laredo regarding efficient short haul rail to Southern Dallas County
Contact made with UP and BNSF (little current interest) as well as short haul rail lines
Preliminary conversations with Mexican cities of Monterrey and Guanajuato
Public Infrastructure Support$35 million of 2006 bond issue targeted for strategic infrastructure development in IIPOD “box” with focus on potential BNSF intermodal site. Matching funds from state and federal sources total $25+ million

33
Office of Economic Development
WWW.DALLAS-EDD.ORG
Current Initiative Status
IIPOD Project Development7 projects planned or under constructionAllen’s first two projects in Southport (860,000 sq. ft) break ground in 3rd Quarter 07.
BNSF IntermodalSigned Letter of Intent between BNSF and Allen Group; due diligence process underwayPending approval by DART and “T” for additional BNSF trackage rights.
Foreign Trade Zone ExpansionSupported foreign trade zone expansion application prepared by Ernst and Young for DFW Airport Board endorsementFederal government approval expected 2nd Quarter 2008.

34
Office of Economic Development
WWW.DALLAS-EDD.ORG
Current Initiative Status
Agile Port SystemThe physical design, business processes and operational characteristics that increase the velocity of intermodal cargo moving through ports and terminalsMOU’s with Maritime Administration, Port of Houston, Panama Canal Authority, Inland Port of Guanajuato and Mexican West Coast portsVisits and discussions with various Mexican cities who are developing similar inland port conceptsDeveloping a RFQ proposal for an Agile Port feasibility analysis to better assess the value proposition (will require Council approval)

35
Office of Economic Development
WWW.DALLAS-EDD.ORG
Current Initiative Status
Enhanced security thru technologyIn discussions with two groups regarding pilot programs to use different types of technology to augment container security
Workforce TrainingWorking with COG on workforce training issues
Ongoing discussions with UNT, UTD, Paul Quinn and Cedar Valley Community College

36
Office of Economic Development
WWW.DALLAS-EDD.ORG
Potential Challenges

37
Office of Economic Development
WWW.DALLAS-EDD.ORG
Potential Challenges
Regional project with regional sensitivities but the City also needs to achieve benefits
Alliance views IIPOD as a threat
Infrastructure costs are substantial

38
Office of Economic Development
WWW.DALLAS-EDD.ORG
Recommended Next Steps

39
Office of Economic Development
WWW.DALLAS-EDD.ORG
Recommended Next Steps
Engage Mayor’s task force on Southern Sector Economic Opportunities to ensure alignment of priorities
Renew and expand interlocal agreements with IIPOD cities and Dallas County
Implement public infrastructure investment (’06 bonds) to support recruitment of BNSF rail intermodal
$35 million allocated ($4.75 M in June and $18 M in November)

40
Office of Economic Development
WWW.DALLAS-EDD.ORG
Recommended Next Steps
Promote Construction of new projects within the City of Dallas sector of IIPOD
Goal: 1 M sq ft of new industrial space in FY07-08.Promote Public/Private funding of IIPOD master planning process and Agile Port feasibility analysis
Estimated City of Dallas funding participation (Master plan $200k, Agile Port study $150K) earmarked in PPP but subject to Council approvalPrepare RFQs and RFPs for council approval
Continue to promote expansion of the FTZ Final federal approval expected within 8 months

41
Office of Economic Development
WWW.DALLAS-EDD.ORG
Recommended Next Steps
Actively explore upgrading cargo rail service between the Port of Houston, Laredo, selective Mexican cities with state and private sector
Longer term initiative with high priority for the region
Explore the implementation of a 501(c)6 organization for fundraising, marketing and potential oversight of IIPOD.
42
Office of Economic Development
WWW.DALLAS-EDD.ORG
Appendix A: Comprehensive Master Plan
Two Strategic Initiatives:Support Ongoing Activities –adequate and consistent services to support current needs
Strategic Vision – to develop opportunities and guide regional actions
43
Office of Economic Development
WWW.DALLAS-EDD.ORG
Comprehensive Master Plan
Create a Strategic VisionCreate a shared vision for the area that reflects each jurisdiction’s goals
Identify new project opportunities consistent with current activities and defined goals
Identify human capital needs
Create an environment for outcomes that are:Economically efficient
Aesthetically pleasing
Environmentally sensitive and sustainable

44
Office of Economic Development
WWW.DALLAS-EDD.ORG
Strategic Vision Components
Strategic vision has 6 components:The Vision
Prosperous Economy
Livable Community
Healthy Environment
Opportunity and Equity
Implementation, Long-term Coordination & Monitoring

45
Office of Economic Development
WWW.DALLAS-EDD.ORG
Master Plan Next Steps and Timing
Create a Strategic Leadership Team –Stakeholders/Project Champions from multiple jurisdictions and interests
Market projectAssist in fundraisingOversee project and contract
Brief council members and mayor/ Council Committees/ Dallas CouncilBrief all jurisdictions/stakeholdersSecure funding
Up to $1.5 millionProcess RFQ/RFP Six month timeline


1
City of Dallas Grant ActivitiesBriefing to the Dallas City CouncilSeptember 19, 2007Office of Intergovernmental Services
2
Purpose of BriefingTo review the City’s grant related activities including an overview of the role of the Office of Intergovernmental Services; the process for identification and solicitation of funding opportunities; how the City compares to other similar municipalities; examples of grants in the FY07-08 proposed budget; and opportunities for on-going improvement to secure grant funds for the City of Dallas.

3
Briefing OutlineOffice of Intergovernmental Services (IGS) Overview
• Mission • Services
• Intergovernmental Affairs• Fund Development
Grant Activities• Key Participants• Process• Benchmarking – How Does Dallas Compare?• Grants from all Sources FY05 and FY06• Grants in the FY07-08 Budget• Continuous Improvement

4
Office of Intergovernmental Services (IGS) OverviewMissionTo advance the City’s strategic priorities through developing intergovernmental partnerships and serving as the primary point of contact for the City to local, regional, state and federal levels of government and other independent agencies

5
Office of Intergovernmental Services (IGS) OverviewIntergovernmental Affairs:
• Serves as the primary point of contact between the City and other governmental entities and agencies
• Maintains a communication network of policy makers and organizations to influence legislative initiatives
• Provides research to the Mayor and City Council, the City Manager's Office, the City Attorney’s Office, and City Departments on legislative matters pertinent to the City
• Coordinates with state and federal lobbyists to develop and implement the City’s state and federal legislative agendas

6
Fund Development:
• Serves as a centralized resource to City Departments and provides technical expertise for the City’s grant seeking activities to ensure all funding requests link to City goals and to provide a coordinated effort on City funding requests
• Identifies potential public and private funding opportunities tomaximize acquiring and leveraging outside resources
• Solicits funding for City programs and activities, public/private partnerships and non-profit agencies
• Develops and maintains relationships with funding agencies• Tracks and reports on competitive grants received by the City
Office of Intergovernmental Services (IGS) Overview

7
Key Participants in the Grant Process• Mayor and City Council• City Manager’s Office (CMO)• City Attorney’s Office (CAO)• Office of Intergovernmental Services (IGS)• State and Federal Lobbyists• Office of Financial Services (OFS)• City Departments• Local, State and Federal Elected Officials• Program Partners• Public and Private Funding Agencies

8
Types of GrantsFormula GrantsAllocations based on statistical data that indicates need or specific condition, such as the extent of poverty, population, inadequacy of housing supply, or number of cases of AIDS.
Competitive GrantsGovernment or private funds for which the City must compete against other agencies, including other cities, counties, non-profits, and faith based organizations.
Combination GrantsA type of competitive grant. A formula is used to determine eligibility and then the City competes against other “eligible jurisdictions” for funds.
Appropriations RequestsAlso a competitive grant. Funding identified in federal appropriations legislation by a Senator or Member of Congress for a specific purpose. Once awarded, these funds follow the federal department’s grant process.

9
Competitive Grant ProcessPhase 1 Phase 2 Phase 3 Phase 4 Phase 5Identification & Preparation Development Submission
& Outcome Execution Monitoring
Notice of availability of funding released
Funding opportunity identified by research
Reviewed for consistency w/ CoD goals
Link made between CoD goals & funding agency priorities
Department or Agency identified to apply
Match requirement reviewed
Sustainability study conducted
Program (and budget) development
Application submitted
Receive funding decision
Council accepts funds; Fund created
Program implementation occurs
Adherence to Funder guidelines reviewed
Program evaluation conducted
Closeout report submitted to agency
10
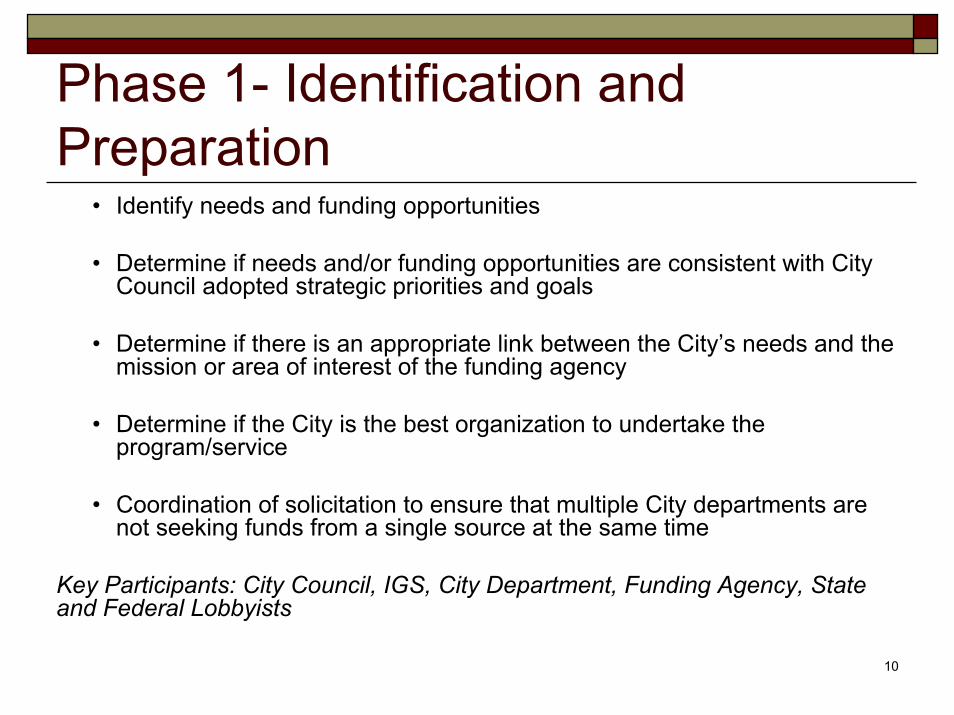
Phase 1- Identification and Preparation
• Identify needs and funding opportunities
• Determine if needs and/or funding opportunities are consistent with City Council adopted strategic priorities and goals
• Determine if there is an appropriate link between the City’s needs and the mission or area of interest of the funding agency
• Determine if the City is the best organization to undertake the program/service
• Coordination of solicitation to ensure that multiple City departments are not seeking funds from a single source at the same time
Key Participants: City Council, IGS, City Department, Funding Agency, State and Federal Lobbyists

11
Phase 2 - Development• Determine in-kind/match requirement
• Determine the sustainability of the program/activity after grant funding ends
• Develop program plan and budget according to funding guidelines
Key Participants: IGS, City Department, Program Partners, CMO

12
Phase 3 - Submission and Outcome
• Submit application to funding agency
• Receive funding decision
If denied:• inform City Department, Program Partners, and CMO of denial • contact funding agency to seek reviewers’ notes or other feedback
on merits/weaknesses of proposal• evaluate and consider resubmissionIf approved:• inform City Department, Program Partners, CMO, CAO, and OFS
of award• continue to Phase 4
Key Participants: IGS, City Department, Program Partners, Local, State and Federal Lobbyists, Funding Agency

13
Phase 4 - Execution• Seek Council approval to accept funds including:
- Establishing fund with OFS- Reviewing contracts with CAO
• Implement Program
Key Participants: City Council, City Department, CAO, CMO, OFS
14
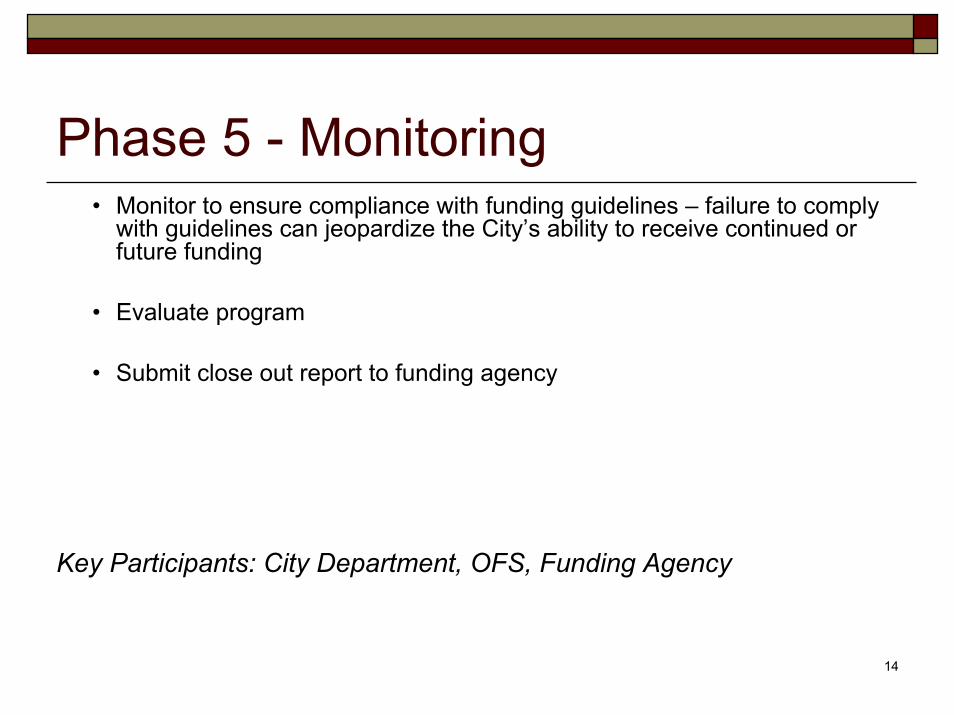
Phase 5 - Monitoring• Monitor to ensure compliance with funding guidelines – failure to comply
with guidelines can jeopardize the City’s ability to receive continued or future funding
• Evaluate program
• Submit close out report to funding agency
Key Participants: City Department, OFS, Funding Agency

15
Benchmarking – How Does Dallas Compare to Other Cities?To which cities are we comparing ourselves?• Phoenix, San Antonio, San Diego, San Jose
Why did we choose these cities?• These cities are comparable to Dallas as they are all close to 1 million in
population with similar geography and governmental structure
How did we select the categories of funding?• We used “major” federal funding sources, or only those programs funded
at $100 million or more for nationwide distribution
What do the numbers tell us?• Dallas compared favorably to benchmark cities in federal grant funding
secured for FY05 and FY06• All Cities selectively pursued federal funding according to their priorities

16
Federal Funds Benchmarking FY05D AL L AS P H O E N IX S AN AN T O N IO S AN D IE G O S AN JO S E
F orm u la G ran t P rog ram sC D B G $20 ,475 ,665 $19 ,258 ,051 $16 ,484 ,127 $17 ,282 ,982 $11 ,476 ,479H O M E $8,471 ,506 $7 ,023 ,260 $7 ,000 ,703 $9 ,009 ,931 $4 ,642 ,637H O P W A $3,867 ,000 $1 ,391 ,000 $960 ,000 $2 ,527 ,000 $736 ,000E m ergency S he lte r $774 ,810 $743 ,320 $635 ,638 $667 ,873 $444 ,240B yrne Jus tice A ss is tance $2 ,393 ,527 $1 ,845 ,696 $1 ,117 ,297 $957 ,751 $750 ,048
T o ta l F o rm u la $35 ,982 ,508 $30 ,261 ,327 $26 ,197 ,765 $30 ,445 ,537 $18 ,049 ,404
M ajo r C om pe titive G ran t P rog ram sE D A $0 $0 $3 ,300 ,000 $0 $2 ,000 ,000A ss is tance to F ire figh te rs $1 ,650 ,000 $1 ,248 ,000 $138 ,072 $0 $0S A F E R F ire figh te r H iring $0 $0 $0 $0 $0U rban A rea S ecu rity In itia tive $13 ,891 ,234 $9 ,996 ,463 $5 ,973 ,524 $14 ,784 ,191 $33 ,226 ,729Lead H azard R educ tion $0 $3 ,000 ,000 $0 $7 ,000 ,000 $0H om e less A ss is tance $11 ,354 ,501 $20 ,043 ,200 $5 ,477 ,622 $8 ,301 ,608 $9 ,360 ,889
T o ta l C om petitive $26 ,895 ,735 $34 ,287 ,663 $14 ,889 ,218 $30 ,085 ,799 $44 ,587 ,618
A pp rop ria tions G ran t P rog ram sE P A D isc re tiona ry $0 $0 $650 ,000 $0 $750 ,000H U D E D I $644 ,000 $150 ,000 $0 $0 $169 ,750B yrne D isc re tiona ry $0 $0 $0 $500 ,000 $0C O P S $350 ,000 $500 ,000 $0 $0 $0Juven ile Jus tice $0 $0 $0 $0 $250 ,000A rm y C o rps o f E ng ineers $13 ,450 ,000 $14 ,478 ,000 $1 ,625 ,000 $0 $0T ranspo rta tion A pp rop ria tions $14 ,550 ,000 $2 ,500 ,000 $1 ,300 ,000 $6 ,450 ,000 $500 ,000
T o ta l A pprop ria tions $28 ,994 ,000 $17 ,628 ,000 $3 ,575 ,000 $6 ,950 ,000 $1 ,669 ,750
$44 ,661 ,983 $67 ,481 ,336 $64 ,306 ,772
D ata is from federa l sou rces to assu re com m on fisca l yea r in fo rm a tion . "M a jo r sou rces" a re those p rog ram s funded a t $100 m illion o r m o re a t the fede ra l le ve l. B ecause c ity respons ib ilities and func tions va ry, p rog ram s in the fo llow ing a reas have no t been inc luded : trans it, a irpo rts , pub lic hosp ita ls , job tra in ing and educa tion .
T o ta l F Y 2005 $91 ,872 ,243 $82 ,176 ,990

17
Federal Funds Benchmarking FY06D A L L A S P H O E N IX S AN A N T O N IO S A N D IE G O S A N J O S E
F orm u la G ran t P ro g ram sC D B G $ 18 ,40 9 ,80 9 $ 17 ,3 55 ,6 76 $1 4 ,84 6 ,217 $1 5 ,50 6 ,86 2 $ 10 ,3 13 ,70 9H O M E $7 ,96 0 ,84 5 $6 ,6 16 ,2 68 $ 6 ,61 1 ,797 $8 ,51 4 ,69 4 $4 ,3 55 ,56 7H O P W A $3 ,14 1 ,00 0 $1 ,4 33 ,0 00 $ 97 1 ,000 $2 ,54 9 ,00 0 $7 38 ,00 0E m ergen cy S he lte r $7 70 ,24 5 $7 40 ,6 99 $ 63 4 ,008 $66 4 ,74 0 $4 41 ,40 0B yrne Jus tice A ss is tan ce $ 1 ,404 ,761 $ 1 ,02 2 ,16 9 $6 38 ,8 43 $ 574 ,8 93 $ 39 6 ,632
T o ta l F o rm u la $31 ,686 ,660 $27 ,167 ,812 $23 ,701 ,865 $27 ,810 ,189 $16 ,245 ,308
M ajo r C o m pe titive G ra n t P rog ram sE D A $0 $ 0 $0 $0 $0A ss is ta nce to F ire f igh te rs $0 $ 0 $4 65 ,2 09 $ 567 ,3 52 $0S A F E R F ire fig h te r H ir in g $0 $ 0 $0 $0 $0U rba n A rea S e cu rity In itia tive $1 3 ,83 0 ,000 $ 3 ,92 0 ,00 0 $4 ,4 60 ,0 00 $7 ,990 ,0 00 $2 8 ,32 0 ,000Le ad H aza rd R e du c tion $0 $ 0 $0 $0 $0H om e le ss A ss is tan ce $1 1 ,82 0 ,908 $2 0 ,12 6 ,94 1 $5 ,6 14 ,6 59 $7 ,786 ,5 57 $ 9 ,34 5 ,250
T o ta l C om p e titive $25 ,650 ,908 $24 ,046 ,941 $10 ,539 ,868 $16 ,343 ,909 $37 ,665 ,250
A pp rop ria tio ns G ran t P rog ram sE P A D isc re tiona ry $0 $ 0 $0 $0 $0H U D E D I $ 350 ,000 $ 0 $0 $0 $ 15 0 ,000B yrne D isc re tion a ry $0 $ 0 $0 $ 200 ,0 00 $ 40 0 ,000C O P S $ 300 ,000 $ 50 0 ,00 0 $0 $ 100 ,0 00 $0Juven ile Jus tice $0 $ 0 $2 00 ,0 00 $0 $0A rm y C o rps o f E n g in ee rs $1 2 ,05 0 ,000 $ 8 ,23 0 ,00 0 $2 ,7 30 ,0 00 $0 $0T ra nspo rta tion A pp ro p ria tions $0 $ 70 0 ,00 0 $2 ,5 00 ,0 00 $1 ,000 ,0 00 $0S A F E T E A -LU $ 10 0 ,200 ,000 $1 3 ,60 0 ,00 0 $13 ,5 00 ,0 00 $5 5 ,040 ,0 00 $2 8 ,60 0 ,000
T o ta l A p p rop ria tion s $112 ,900 ,000 $23 ,030 ,000 $18 ,930 ,000 $56 ,340 ,000 $29 ,150 ,000
$ 10 0 ,494 ,0 98 $8 3 ,06 0 ,558T o ta l F Y 2 006 $ 17 0 ,237 ,568 $7 4 ,24 4 ,75 3 $53 ,1 71 ,7 33
D ata is from fed e ra l sou rces to a ssu re co m m on f is ca l yea r in fo rm a tion . "M a jo r so u rce s " a re tho se p ro g ra m s fun ded a t $ 100 m illio n o r m o re a t the fede ra l le ve l. B ecause c ity re sp ons ib ilitie s an d fu nc tio ns va ry, p rog ra m s in the fo llow ing a re as h ave no t b een in c lu de d : tra ns it, a irpo rts , pub lic ho sp ita ls , job tra in in g and edu ca tio n .

18
City of Dallas Grant Funding from all Sources FY05 and FY06
FY05 FY06Federal Grant ProgramsFormula $35,982,508 $31,686,660Major Competitive $26,895,735 $25,650,908Appropriations $28,994,000 $112,900,000
Total Federal $91,872,243 $170,237,568
Other Grant ProgramsMinor Federal Competitive $4,771,424 $5,251,992State $1,224,161 $2,006,727Private $1,711,000 $17,612,500
Total Other $7,706,585 $24,871,219
Total $99,578,828 $195,108,787

19
FY07-08 Budget HighlightsPUBLIC SAFETY
• $4,000,000 - Fusion Center (Records Management System), Urban Area Security Initiative (UASI)
• $500,000 - Upgrades to DPD’s vehicle scheduling software, Justice Assistance Grant (JAG)
• $450,000 – 45 thermal imagers, UASI• $600,000 – Equipment for high-rise firefighting, UASI• $300,000 – Hazmat satellite station, UASI• $400,000 – Communication equipment & training of Urban Search and
Rescue (USAR) Team, UASI• $400,000 – Reverse 911 system, UASI • $200,000 – Community Emergency Response Team (CERT) trainings for
approximately 20 teams, UASI

20
FY07-08 Budget HighlightsCLEAN, HEALTHY ENVIRONMENT
• $855,000 - New Freedom Transportation Program for seniors and disabled individuals, Department of Transportation
• $200,000 - Prisoner Reentry Initiatives, JAG • $200,000 – Dallas Sustainable Skylines Initiative,
Environmental Protection Agency (EPA) • $560,000 - Community Courts Program, JAG
EDUCATION• $8,000,000 - Dallas Arts Learning Initiative (DALI), Wallace
Foundation• $173,400 – Middle School After-School Programs in the Park &
Recreation Department, Department of Education

21
FY07-08 Budget HighlightsECONOMIC VIBRANCY
• $150,000 –Farmer’s Market Renovations, Housing and Urban Development (HUD) Economic Development Initiative
• $350,000 - Fair Park Entertainment District, HUD Economic Development Initiative
CULTURE, ARTS AND RECREATION• $75,000 - Children’s programming at the new North
Park Public Library branch, Atmos Energy• $62,000 - Office of Cultural Affairs, Texas
Commission on the Arts

22
Continuous Improvement
• Sponsoring a Process Improvement Pilot Project to evaluate and improve upon the fund development functions
• Conducting strategic planning with City Departments to address City Council established priorities through grant requests
• Focusing on a city-wide approach to grant requests by engaging several departments on coordinated grant applications to public and private funding sources
23
Briefing Summary
• The City of Dallas has a comprehensive strategic program to identify and secure grant funding from public and private sources
• The Mayor and City Council play an important role in the City’s grant process
• Dallas continues to identify ways to improve seeking and securing grant funds